Global Forestry Outlook 2060 - Russell Labs Site Hosting
Global Forestry Outlook 2060 - Russell Labs Site Hosting
Global Forestry Outlook 2060 - Russell Labs Site Hosting
- No tags were found...

Create successful ePaper yourself
Turn your PDF publications into a flip-book with our unique Google optimized e-Paper software.
<strong>Outlook</strong> to <strong>2060</strong> for World Forestsand Forest IndustriesA Technical Document Supportingthe Forest Service 2010 RPA AssessmentJoseph Buongiorno, Shushuai Zhu,Ronald Raunikar, and Jeffrey P. Prestemon
The Authors:Joseph Buongiorno, Professor Emeritus, Department of Forestand Wildlife Ecology, University of Wisconsin, Madison, WI;Shushuai Zhu, Assistant Scientist, Department of Forest andWildlife Ecology, University of Wisconsin, Madison, WI;Ronald Raunikar, Economist, U.S. Geological Survey, MenloPark, CA; Jeffrey P. Prestemon, Research Forester, <strong>Forestry</strong>Sciences Laboratory, U.S. Department of Agriculture, ForestService, Southern Research Station, Research Triangle Park, NC.Product DisclaimerThe use of trade or firm names in this publication is forreader information and does not imply endorsement by theU.S. Department of Agriculture of any product or service.April 2012Southern Research Station200 W. T. Weaver Blvd.Asheville, NC 28804www.srs.fs.usda.gov
<strong>Outlook</strong> to <strong>2060</strong> for World Forestsand Forest Industries:A Technical Document Supportingthe Forest Service 2010 RPA AssessmentJoseph Buongiorno, Shushuai Zhu, Ronald Raunikar, and Jeffrey P. Prestemon
ContentsList of Figures . . . . . . . . . . . . . . . . . . . . . . . . . . . . . . . . . . . . . . . . . . . . . . . . . . . . . . . . . . . . .viiIntroduction . . . . . . . . . . . . . . . . . . . . . . . . . . . . . . . . . . . . . . . . . . . . . . . . . . . . . . . . . . . . . . 1The <strong>Global</strong> Forest Products Model. . . . . . . . . . . . . . . . . . . . . . . . . . . . . . . . . . . . . . . . . . . . . . . . . . 1Theory and Structure . . . . . . . . . . . . . . . . . . . . . . . . . . . . . . . . . . . . . . . . . . . . . . . . . . . . . . . 1Model Calibration . . . . . . . . . . . . . . . . . . . . . . . . . . . . . . . . . . . . . . . . . . . . . . . . . . . . . . . . . 3Intergovernmental Panel on Climate Change Scenarios and <strong>Global</strong> Forest Products Model Drivers . . . . . . . . . . . . 3National Gross Domestic Product Assumptions . . . . . . . . . . . . . . . . . . . . . . . . . . . . . . . . . . . . . . . . . 4Fuelwood Demand Assumptions . . . . . . . . . . . . . . . . . . . . . . . . . . . . . . . . . . . . . . . . . . . . . . . . . 4Technical Change Assumptions . . . . . . . . . . . . . . . . . . . . . . . . . . . . . . . . . . . . . . . . . . . . . . . . . . 4Observed and Projected Evolutions of the Forest Economy . . . . . . . . . . . . . . . . . . . . . . . . . . . . . . . . . . . . 5Forest Area . . . . . . . . . . . . . . . . . . . . . . . . . . . . . . . . . . . . . . . . . . . . . . . . . . . . . . . . . . . . . 5Forest Stock. . . . . . . . . . . . . . . . . . . . . . . . . . . . . . . . . . . . . . . . . . . . . . . . . . . . . . . . . . . . . 5Solid Wood Prices . . . . . . . . . . . . . . . . . . . . . . . . . . . . . . . . . . . . . . . . . . . . . . . . . . . . . . . . . 10Fuelwood . . . . . . . . . . . . . . . . . . . . . . . . . . . . . . . . . . . . . . . . . . . . . . . . . . . . . . . . . . . . . . 11Industrial Roundwood . . . . . . . . . . . . . . . . . . . . . . . . . . . . . . . . . . . . . . . . . . . . . . . . . . . . . . . 18Sawnwood . . . . . . . . . . . . . . . . . . . . . . . . . . . . . . . . . . . . . . . . . . . . . . . . . . . . . . . . . . . . . 24Wood-Based Panels . . . . . . . . . . . . . . . . . . . . . . . . . . . . . . . . . . . . . . . . . . . . . . . . . . . . . . . . 25Wood Pulp and Other Fibers. . . . . . . . . . . . . . . . . . . . . . . . . . . . . . . . . . . . . . . . . . . . . . . . . . . 35Paper and Paperboard . . . . . . . . . . . . . . . . . . . . . . . . . . . . . . . . . . . . . . . . . . . . . . . . . . . . . . . 50Value Added . . . . . . . . . . . . . . . . . . . . . . . . . . . . . . . . . . . . . . . . . . . . . . . . . . . . . . . . . . . . 58Summary and Conclusion. . . . . . . . . . . . . . . . . . . . . . . . . . . . . . . . . . . . . . . . . . . . . . . . . . . . . . 59Acknowledgments . . . . . . . . . . . . . . . . . . . . . . . . . . . . . . . . . . . . . . . . . . . . . . . . . . . . . . . . . . . 65Literature Cited . . . . . . . . . . . . . . . . . . . . . . . . . . . . . . . . . . . . . . . . . . . . . . . . . . . . . . . . . . . . 65Index of Tables . . . . . . . . . . . . . . . . . . . . . . . . . . . . . . . . . . . . . . . . . . . . . . . . . . . . . . . . . . . . . 66Tables 1-48 . . . . . . . . . . . . . . . . . . . . . . . . . . . . . . . . . . . . . . . . . . . . . . . . . . . . . . . . . . . . . . . 69Appendix A: <strong>Global</strong> Forest Products Model formulations. . . . . . . . . . . . . . . . . . . . . . . . . . . . . . . . . . . . 115Appendix B: Gross Domestic Product growth assumptions . . . . . . . . . . . . . . . . . . . . . . . . . . . . . . . . . . . 117Appendix C: Fuelwood demand assumptions . . . . . . . . . . . . . . . . . . . . . . . . . . . . . . . . . . . . . . . . . . . 118Appendix D: Technical change assumptions . . . . . . . . . . . . . . . . . . . . . . . . . . . . . . . . . . . . . . . . . . . 119v
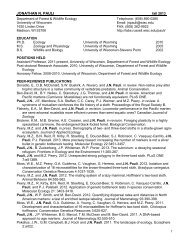
<strong>Outlook</strong> to <strong>2060</strong> for World Forests and ForestIndustries: A Technical Document Supportingthe Forest Service 2010 RPA AssessmentJoseph Buongiorno, Shushuai Zhu, Ronald Raunikar, and Jeffrey P. PrestemonAbstractFour RPA scenarios corresponding with scenarios from the Third andFourth Assessments of the Intergovernmental Panel on Climate Changewere simulated with the <strong>Global</strong> Forest Products Model to project forest area,volume, products demand and supply, international trade, prices, and valueadded up to <strong>2060</strong> for Africa, Asia, Europe, North America, Oceania, SouthAmerica, and selected countries. Scenario A1B presents a 5.5-fold increasein world fuelwood use that leads to high prices of fuelwood and industrialroundwood, driven by especially strong demand in Asia for large importsfrom South America and Europe. World roundwood consumption reaches11.2 billion m 3 in <strong>2060</strong>, exceeding the increment of forests, particularly inAsia. Even under scenarios A2 and B2, the harvest in Asia is unsustainable.However, scenario A1B and a low fuelwood demand lead to a globalharvest of 3.6 billion m 3 only and to a sustainable forest volume. The worldconsumption of manufactured wood products grows modestly under mostscenarios, with slight changes in prices. Consumption and value added inindustries increases more rapidly in Asia, due to the fast economic growthof China and India in all scenarios. As a result, Asia is a large importer ofindustrial roundwood from South America and Europe and of paper andpaperboard from Europe and North America.Keywords: Energy, forecasting, <strong>Global</strong> Forest Products Model, industries,Intergovernmental Panel on Climate Change, markets, policy.IntroductionDuring the last three decades, international trade of forestproducts has expanded rapidly. As a case in point, China’srapid economic growth has had profound effects on the foresteconomies of the Asian Pacific and the United States throughdemand for raw materials and exports of processed woodproducts (Katsigris and others 2005). Therefore, the forestportion of the 2010 Resources Planning Act (RPA) reportanchors the national assessment in an international context,with specific focuses on U.S. imports and exports and howdomestic production and prices relate to developments in theglobal forest sector. 1 Using the <strong>Global</strong> Forest Products Model(GFPM) (Buongiorno and others 2003, updated in Buongiornoand Zhu 2011a), the authors of this document developedprojections for world regions and selected countries that wereconsistent with the more detailed national projections of theUnited States Forest Products Module (Ince and others 2011).In addition to trade, climate change is an issue that mayimpact world forests. To address this potential impact,the 2010 RPA Forest Assessment is linked directly toIntergovernmental Panel on Climate Change (IPCC) scenarios(Nakicenovic and others 2001) on projections (includingglobal and regional economic activity, population, land uses,and greenhouse gases and biofuel consumption [see alsoAlcamo and others 2005]) that could have major implicationsfor forests and forest industries.The objective of this study was to assess consequences of theIPCC projections for the world’s forest economy. We lookedat four scenarios. Three scenarios (A1B, A2, and B2) adoptthe IPCC assumptions, with varying but large future biofuelproduction. A fourth scenario assumes the same economic anddemographics as A1B but a lower demand for energy wood.In this paper, we first describe the GFPM structure andcalibration, then discuss the three IPCC scenarios as they wereimplemented in the GFPM, and next present results, consistingof projections to <strong>2060</strong> for forest area and forest stock, and forthe prices, consumption, and trade of wood, wood products,and other papermaking fibers. We also offer global projectionsfor the main regions and for selected individual countries ineach region.The <strong>Global</strong> Forest Products ModelTheory and StructureThe <strong>Global</strong> Forest Products Model (GFPM) is a spatialdynamic economic model of the forest products sector ofthe world economy. The model simulates the evolution ofcompetitive world markets for forest products and recognizes180 countries (table 1) and their interaction through worldeconomic trade. For each country, the model simulateschanges in forest area and forest stock, and calculatesconsumption, production, and trade of up to 14 commoditygroups (fig. 1). In each projected year, the model computesprices that clear world markets for all products.1 The assessment is mandated by the Forest and Rangeland RenewableResources Planning Act of 1974.
Figure 1—Within each country, the <strong>Global</strong> Forest Products Model describes the flow and transformation of wood products, from the forest inventory to the endproducts and paper recycling.The GFPM is a dynamic system due to its differenceequations: the equilibrium in a particular year is a function ofthe equilibrium in the previous year, but the two equilibriumsare computed sequentially, not simultaneously, thus avoidingthe strong assumption of perfect foresight. An earlier versionof the GFPM and several applications are described in detailby Buongiorno and others (2003). The most recent version,including the software, documentation, and one data set, isavailable at http://fwe.wisc.edu/facstaff/buongiorno/.Figure 1 shows the flow and transformation of wood productsin each country. At one end of the flow is the supply of rawmaterials, including fuelwood and industrial roundwood,which depend directly on the forest inventory. At the otherend is the demand for end products, sawnwood, woodbasedpanels, and paper and paperboard. In between is thetransformation of industrial roundwood into intermediate(pulp) or end products.Additional sources of raw materials are nonwood fiber pulpand the waste paper recovered after consumption of paper andpaperboard. In this particular application, part of what usedto be industrial roundwood may be diverted to fuelwood ifand when, due to high biofuel demand, the price of fuelwoodapproaches that of industrial roundwood (dashed arrow infig. 1). The GFPM has a static element that describes the worldspatial market equilibrium in a particular year, and a dynamicelement that simulates the changes from year to year.2<strong>Global</strong> equilibriumComputation of the spatial equilibrium in any given year relieson Samuelson’s (1952) demonstration that this equilibriumresults from maximization of “social surplus,” which in theGFPM is the sum of the producer and consumer surplus.Equivalently, this is the value to consumers of all end productsin all countries minus the costs of supplying the raw materials,transforming the raw materials into end products, andtransportation (equation 1 in appendix A).The essential constraints that describe the equilibrium are thematerial balance constraints that ensure that, for each countryand product, the total supply is equal to the total demand.The left-hand side of the equation refers to the total importsand domestic production of a country. The right-hand sideexpresses how much of the particular product is consumedas an end product, used as input in the production of anotherproduct, or exported.In the GFPM, the final demand and the raw materials supplyare represented by econometric equations. The intermediatedemand and supply are represented by input-outputcoefficients, and by the corresponding output-dependentmanufacturing cost, which covers labor, energy, and capital.The marginal manufacturing cost depends on the level ofproduction, and the transport cost depends on the export priceof the product and the import tax duty. With local linearizationof the demand, supply, and manufacturing cost equations, theproblem describing the global equilibrium has a quadraticobjective function and linear constraints.
The dual solution of this quadratic program gives a shadowprice for each material-balance constraint, which is themarket-clearing equilibrium price for each product andcountry in the particular year considered. In the absence oftrade limits, the export price is the same for all exportingcountries, while the price in importing countries is equal tothe export price plus the transport cost. Price distortions mayoccur in individual countries due to trade inertia constraintsused in the GFPM to express the incomplete adjustment oftrade to changes in economic conditions.Market dynamicsThe dynamic element of the GFPM describes endogenousand exogenous temporal changes in the conditions of theglobal sector. For example, one type of exogenous changerefers to the yearly shift of the demand for the end productsdue to economic growth. For a given price, the demand for aparticular product in a country in the current year depends onlast year’s demand and on the rate of Gross Domestic Product(GDP) growth (Simangunsong and Buongiorno 2001).The wood supply for industrial roundwood and fuelwoodshifts endogenously over time according to how forest stockchanges (also endogenously) (Turner and others 2006). Foreststock changes as a result of forest area change, harvest, andgrowth of stock on the remaining forest. The change in forestarea in the GFPM depends on the level of GDP per capitaaccording to an “environmental Kuznets curve” (Turner andothers 2006), which implies that as GDP per capita increases,forest area decreases at a decreasing rate, then forest areaincreases at an increasing rate up to maximum, beyond whichforest area increases at a decreasing rate up to a point whereforest area stabilizes. The endogenous rate of growth of foreststock, without harvest, is described by an inverse relationbetween growth and forest density as the ratio of forestvolume to forest area.Technical change in the GFPM is represented by exogenouschanges of the input-output coefficients and of the manufacturingcost. Given these changes from one period to the next, the GFPMcalculates the global market equilibrium in the next period, andthe process is repeated until the end of the projection.Model CalibrationThe demand elasticity parameters were based onSimangunsong and Buongiorno (2001), updated with morerecent data, and the timber supply parameters were based onTurner and others (2006). The main database for production,import, and export data was the Food and AgricultureOrganization (United Nations) Statistical Database(FAOSTAT) (FAO 2009). The GDP and population data camefrom the World Development Indicators (WDI) data bank(World Bank 2008). The data on forest area and forest stockwere from the <strong>Global</strong> Forest Resources Assessment 2005(FAO 2006). The demand elasticities are presented in table 2.In all countries except the United States, the price elasticity ofsupply of fuelwood and industrial roundwood, i.e., the percentchange in supply due to a one percent change in price, was1.31, the elasticity with respect to growing stock was 1.10, andthe elasticity with respect to forest area was -0.17 (Turner andothers 2006), the negative value reflecting the higher cost ofharvesting a given volume from a larger area.For the United States, the price elasticity and rate of shiftof wood supply and the rate of forest area change wereexogenous and the same as in the United States ForestProducts Module (USFPM) (table 3). The rates of shift oftimber supply reflect in part future climate changes.For the other countries, parameters of the Kuznets curvedescribing forest area change as a function of GDP percapita, and the parameters of the relationship between forestgrowth and forest stock on the residual forest were taken fromTurner and others (2006), updated with more recent data. Theconstants of the forest area change equation and of the forestgrowth equation were calibrated so that the predicted valuesin the base year (2006) were equal to the most recent observedvalues in each country.The calibration methods used to estimate the input-outputcoefficients and the corresponding manufacturing costs werethose described in Buongiorno and others (2001), and updatedin Buongiorno and Zhu (2011b). The main databases are theFAOSTAT (FAO 2009) and the WDI data bank (World Bank2008). The calibration is done with goal programming. Foreach country, the method uses smoothed data on production,imports, exports, and prices from 1992 to 2007 to estimateinput-output coefficients for the base year 2006 by minimizingthe deviation of calculated from observed production forall products, given a-priori bounds on the input-outputcoefficients. Manufacturing costs are estimated as thedifference between the price of a product and the cost of woodand fiber that go into it, under the assumption of equilibriumand thus zero net profit (beyond a normal return to capital).Intergovernmental Panel on Climate ChangeScenarios and <strong>Global</strong> Forest Products ModelDriversThree scenarios (labeled A1B, A2, and B2) developed by theIntergovernmental Panel on Climate Change (IPCC) wereinitially selected to set the basic assumptions for the 2010 RPAForest Assessment (USDA Forest Service, 2012). A fourthscenario (labeled A1B-Low Fuelwood) was added later, and3
makes the same assumptions as scenario A1B, except for theassumption about demand for fuelwood.Each scenario is based on a separate IPCC storyline aboutthe direction of global social, economic, technical, andpolicy developments. The storylines also reflect differentdirections possible for the interaction between developing andindustrialized countries. The main characteristics of the threescenarios are presented in table 4.Scenario A1B assumes continuing globalization that leads tohigh income growth and low population growth. The scenarioimplies the highest income per capita in <strong>2060</strong> among allscenarios, and assumes a rapid growth of biofuel demand,specifically, that global consumption of biofuels increased 5.5times from 2006 to <strong>2060</strong>.Scenario A2 assumes a slowdown of globalization and the riseof more regional interests, leading to a lower income growththan scenario A1B, and higher population growth, and thuslower income per capita. In the scenario, biofuel productiongrows more slowly than in A1B but is still substantial, withglobal production by <strong>2060</strong> reaching 2.7 times that of 2006.Scenario B2 has economic and demographic assumptionsthat fall between scenarios A1B and A2, and global fuelwoodproduction reaches 2.9 times that of 2006 by <strong>2060</strong>.For the GFPM simulations, the exogenous variables takenfrom these scenarios are the growth of GDP, population, andglobal fuelwood demand.National Gross Domestic Product AssumptionsAssumptions about Gross Domestic Product (GDP) growth inindividual countries were obtained by first projecting nationalGDP per capita and then multiplying by national population,except for the United States, for which future GDP growth rateswere established separately (USDA Forest Service, 2012). For theother countries, the main assumption was that the GDP per capitaof the different countries would converge between 2006 and <strong>2060</strong>(Sala-i-Martin 2006), and specifically that, by the year 2100, theGDP per capita of all the countries within a region would be thesame as well as equal to the average regional GDP per capitapredicted by each IPCC scenario.A secondary assumption was that the ratio of the GDP percapita of a particular country to the GDP per capita of itsregion would evolve from its initial value in 2006 to 1.0in 2100 according to the logarithmic difference equationdescribed in Appendix B. Tables 5 and 6 summarize the rateof growth of GDP and the level of GDP per capita obtainedwith this procedure for selected countries and world regions.4Fuelwood Demand AssumptionsFor scenarios A1B, A2, and B2, it was assumed that, between2006 and <strong>2060</strong>, the world fuelwood consumption would growas the world biofuel consumption predicted by the IPCC(i.e., approximately 5.5 times for scenario A1B, 2.7 times forscenario A2, and 2.9 times for scenario B2).Another assumption was the convergence of theconsumption per capita of fuelwood (energy wood) acrosscountries, analogous to the past convergence observedfor other products (Buongiorno 2009). Specifically, theassumption was that, by <strong>2060</strong>, the ratio of national toworld fuelwood consumption would be equal to the ratio ofnational to world GDP.From these two assumptions, we computed the nationalfuelwood consumption in <strong>2060</strong> and the correspondingnational annual growth rate of demand that would beneeded between 2006 and <strong>2060</strong>, at constant price, toachieve the level consumption in <strong>2060</strong>. The demand growthrate applied to the GFPM gave projections of demand thatdiffered from the desired level due to the endogenouschange in price. The demand growth rate was then adjustediteratively until the desired level of global consumption wasachieved (appendix C).For scenario A1B-Low Fuelwood, the demand for fuelwoodwas entirely defined by econometric demand equations. Forhigh-income countries, the price elasticity was -0.1 and theGDP elasticity was 0.2 (Simangunsong and Buongiorno 2001).For low-income countries, the same price elasticity was usedwith a GDP elasticity of 0.05 to continue past trends.Technical Change AssumptionsTechnology for manufacture of wood products is maturebut not static. Marginal improvements in techniques andequipment were made between 1961 and 2005, with less wooduse per unit of output and more recycled paper used in makingpaper and paperboard (Kando and Buongiorno 2009).Information about improvements in technology, in ourview, is incorporated at the rate any necessary equipmentchanges are made, and because the state of the art in a matureindustry is increasing slowly, inefficient producers have anopportunity to catch up with the best available technology. Inthis application, the assumption was made that the least costtechniques observed in 2006 would improve further by <strong>2060</strong>.Furthermore, the assumption was made, too, that technologywould become more similar across countries, using lesswood per unit of output and more waste paper instead of pulp(appendix D).
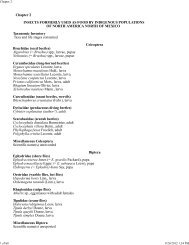
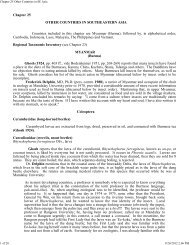
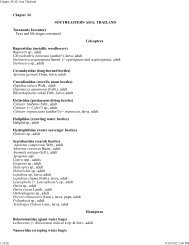
Observed and Projected Evolutionsof the Forest EconomyIn this section, we present results of four scenarios run withthe <strong>Global</strong> Forest Products Model (GFPM) for the followingaspects of the world forest economy: forest area and foreststock; and prices, consumption, production, and trade ofwood, wood products, and other papermaking fibers. Wealso offer global projections for the main regions and forselected individual countries in each region. We prefacethe projections with findings from an observed history(1992 to 2006, unless otherwise noted) of each aspect. Theprojections for each aspect cover the years 2006 to <strong>2060</strong>,unless otherwise noted.Forest AreaFigure 2 shows the observed and projected forest area byworld region. Table 7 shows data for the main countries ineach region. The data from 1992 to 2006 are interpolationsand extrapolations of the data in the <strong>Global</strong> Forest ResourcesAssessment 2005 (FAO 2006) and earlier assessments.The data from 2007 to <strong>2060</strong> are projections obtained withthe <strong>Global</strong> Forest Products Model (GPFM). As indicatedabove in the description of the dynamics of the GFPM, theevolution of forest area depends on the historical rate ofchange and the projected level of Gross Domestic Product(GDP) per capita.Observed forest area evolutionBetween 1992 and 2006, the world forest area decreased by 111million ha. In developing countries, forest area decreased by 123million ha and increased by 12 million ha in developed countries.The largest reductions were in Africa (-57 million ha, with -6million in Nigeria) and in South America (-55 million, with -40million ha in Brazil). 2 In Europe, the forest area increased by 12million ha.Projected forest area evolutionScenario A1B—Under scenario A1B, the world forest areaincreases by 63 million ha, almost equally in developed anddeveloping countries. The largest regional increases are inAsia (+96 million ha in China, and 28 million ha in India) andEurope (+49 million ha, spread over several countries). Thelargest regional reductions are in South America (-28 millionha, due mostly to a loss of 52 million ha in Brazil), Africa(-20 million ha), and North/Central America (-19 million ha,largely due to the -29 million ha in the United States).Scenario A2—Under scenario A2, the world forest areadeclines by 628 million ha, with 431 million ha in developing2 Here and in the remainder of the paper, a “-” sign in the text refers to areduction, and a “+” sign to an increase. The data in the tables are in levels.countries and 198 million ha in developed countries. The largestregional decrease is in South America (-217 million ha, of which-163 million ha in Brazil). In Europe, the decrease of 175 millionha is due mostly to -197 million ha in the Russian Federation.There are declines in Africa (by 127 million ha) and Asia (by62 million ha, due mostly to -54 million ha in Indonesia).In North/Central America, there is little change except fordecreases of 6 million ha in Mexico and 25 million ha in theUnited States, adding up to a regional decrease of39 million ha. There is a decrease of 7 million ha in Oceania.Scenario B2—Under scenario B2, the world forest areadeclines by 305 million ha, with most of the decline indeveloping countries (-287 million ha). The largest regionaldeclines are in South America (-161 million ha, with-132 million ha in Brazil) and Africa (-93 million ha). There ismore reduction in North/Central America (-26 million ha, with-19 million ha in the United States) than in Asia, where theincrease in China (+43 million ha) and India (+14 million ha)compensates for the decrease in Indonesia (-51 million ha).There is a decrease in Europe of 6 million ha, due mostly tothe 48 million ha decrease in the Russian Federation.Scenario A1B-Low Fuelwood—Scenario A1B-LowFuelwood led to the same projections as scenario A1B becausethe assumptions for GDP per capita were the same.Forest StockFigure 3 shows the observed and projected forest stock(standing volume of trees) by world region. Table 8 shows datafor the stock levels in the main countries in each region. Thedata from 1992 to 2006 are interpolations and extrapolationsof the data in the <strong>Global</strong> Forest Resources Assessment 2005(FAO 2006) and earlier assessments. The data from 2007 to<strong>2060</strong> are GFPM projections.The evolution of the forest stock depends on the evolution offorest area, the periodic harvest, and the growth rate of theresidual stock, which is inversely related to the stock density(stock per unit area). Due to this relationship, and dependingon the initial growth rate of forest stock on nonharvestedareas, the forest stock could increase while the forest areadecreased in some countries, and vice-versa.Observed forest stock evolutionBetween 1992 and 2006, the forest stock decreased indeveloping countries by 14 billion m 3 and increased indeveloped countries by 10 billion m 3 . The largest regionaldecrease was in South America (-7 billion m 3 , with-6 billion in Brazil). In Asia, the forest stock decreased by3 billion m 3 due principally to a 7 billion m 3 decrease inIndonesia, partly compensated by a 2 billion m 3 increase5
Forest area, scenario A1B Forest area, scenario A2 Figure 2—Forest area by world region, observed and projected with the <strong>Global</strong> Forest Products Model. (continued on next page)6
Forest area, scenario B2 Forest area, scenario A1B-Low Fuelwood Figure 2 (continued)— Forest area by world region, observed and projected with the <strong>Global</strong> Forest Products Model.7
Forest stock, scenario A1B Forest stock, scenario A2 8Figure 3—Forest stock by world region, observed and projected with the <strong>Global</strong> Forest Products Model. (continued on next page)
Forest stock, scenario B2 Forest stock, scenario A1B-Low Fuelwood Figure 3 (continued)—Forest stock by world region, observed and projected with the <strong>Global</strong> Forest Products Model.9
in China. The stock declined in Africa by 3 billion m 3 butincreased in Europe by 5 million m 3 (spread out over manycountries) and in North America (mostly in the United States)by 3 billion m 3 .Projected forest stock evolutionScenario A1B—Under scenario A1B, the world growingstock decreases by 22 billion m 3 , with 14 million m 3 indeveloping countries. The largest regional decrease is inAsia (-18 billion m 3 , of which -10 billion m 3 were in China).There is a projected decrease also for North/Central America(by 15 billion m 3 , spread among Canada, the United States,and Mexico) but an increase in South America (+18 billionm 3 , with +13 billion m 3 in Brazil). Thus, it appears that thegrowth rate of stock, notably high in Brazilian new forests,more than compensates for the decrease in forest areaobserved above. There is a decrease in Oceania of2 billion m 3 and little change in Europe.Scenario A2—Under scenario A2, the world growing stockdecreases by 17 billion m 3 . This is larger than under scenarioA1B in total but with a larger decrease in developingcountries (-26 billion m 3 ) and an increase in developedcountries (+9 billion m 3 ). The largest regional declines arein Asia (-11 billion m 3 , with -7 billion m 3 in China) andAfrica (-7 billion m 3 ). In South America, where the stockis projected under A1B to increase, the stock changes little.Meanwhile, the stock of North/Central America (where thestock is projected under A1B to decrease) increases by4 billion m 3 in the United States. There is little overallchange in growing stock in Europe, where the 13 billionm 3 decrease in the Russian Federation is compensated byincreases in several other countries.Scenario B2—Under scenario B2, the world growing stockincreases modestly, by 12 billion m 3 , although the stockdecreases by 15 billion m 3 in developing countries. As underscenario A2, the largest regional decline in growing stock isin Asia (-11 billion m 3 , with -8 billion m 3 in China and-4 billion m 3 in India and Indonesia). There are also declinesin Africa (-4 billion m 3 ) and North/Central America,although, globally, these declines are more than compensatedby increases for Europe (+18 billion m 3 , with 3 billion m 3 inthe Russian Federation) and South America (+9 billion m 3 ,with +6 billion m 3 in Brazil).Scenario A1B-Low Fuelwood—Under scenario A1B-LowFuelwood, the world growing stock increases by 101 billion m 3 ,with more than half of that increase in developing countries.The largest regional increases are in South America (+44billion m 3 , with 32 billion m 3 in Brazil) and Europe (+37billion m 3 , with 12 billion m 3 in the Russian Federation). InNorth/Central America, the growing stock increases by109 billion m 3 , mostly due to the 11 billion m 3 increase in theUnited States. There are modest positive changes in Asia (withdeclines in Indonesia, China, and India compensated in partby a combined 6 billion m 3 increase in Japan and Oceania).Solid Wood PricesFigure 4 shows the past and projected world real prices offuelwood, industrial roundwood, and sawnwood, measured bythe unit value of exports expressed in 1997 U.S. dollars. Tables9, 10, and 11 show the prices of the same commodities in themajor countries within each world region. The data from 1961to 2006 came from the FAOSTAT database (FAO 2009). Theprojections to <strong>2060</strong> were obtained with the GFPM.Observed evolution of solid wood pricesBetween 1961 and 2006, the real prices of fuelwood, industrialroundwood, and sawnwood fluctuated considerably. Priceswere highest in the 1970s. Compared to the real world pricesin 1992, fuelwood was $13 lower, industrial roundwood was$43 lower, and sawnwood was $10 lower in 2006.Projected evolution of solid wood pricesScenario A1B—Scenario A1B implies a very high increasein fuelwood demand. Under scenario A1B, the price offuelwood more than doubles. The price of fuelwood risesrapidly and approaches the price of industrial roundwoodby 2030. The real world price of industrial roundwood riseslittle until 2030, but thereafter, the prices of fuelwood andindustrial roundwood increase in concert and reach $256/m 3by <strong>2060</strong>. The price of sawnwood follows the trend of the priceof industrial roundwood, hardly changing between 2006 and2030 and then sharply rising to reach $392/m 3 in <strong>2060</strong>, for anoverall rise of 72 percent above its 2006 level.Scenario A2—Under scenario A2, the prices of fuelwoodand industrial roundwood rise much less than under scenarioA1B. The two prices converge 10 years later than underscenario A1B and reach $118/m 3 in <strong>2060</strong>. The real price ofsawnwood declines until 2035 and then rises slightly to reach$250/m 3 in <strong>2060</strong>.Scenario B2—Under scenario B2, the future real prices offuelwood, industrial roundwood, and sawnwood are verysimilar to those under scenario A2, except for a slightlyearlier convergence of the prices of fuelwood and industrialroundwood.Scenario A1B-Low Fuelwood—Under scenario A1B-LowFuelwood, prices of solid wood products are the lowest amongall the scenarios. Even though the fuelwood price rises fasterthan the price of industrial roundwood, convergence of thetwo prices occurs only towards 2050. Compared to 2006, in
<strong>2060</strong> the world price of fuelwood is $24 higher, but the worldprice of industrial roundwood is $9 lower, and the world priceof sawnwood is $50 lower.FuelwoodFuelwood consumptionFigure 5 shows the historic and projected data for fuelwoodconsumption (production plus imports minus exports),including industrial roundwood that is used for energy, andtable 12 shows the corresponding data for major countries ineach region.Observed evolution of fuelwood consumptionBetween 1992 and 2006, the annual consumption of fuelwoodincreased by 243 million m 3 in developing countries but declinedby 10 million in developed countries. The largest regionalincreases were in Africa (208 million m 3 spread over manycountries) and Europe (39 million m 3 , the growth in France,Germany, and other countries compensating in part for the18 million m 3 decline in the annual consumption of the RussianFederation). In South America, annual fuelwood consumptionincreased by 26 million m 3 , of which more than half was inBrazil. In Asia, the increase of consumption in India and Chinawas offset by a decrease of 45 million m 3 in Indonesia, resultingin no net change at the regional level. In North/Central America,annual fuelwood consumption decreased by 40 million m 3 ,mostly due to the decrease in the United States.Projected evolution of fuelwood consumptionScenario A1B—Under scenario A1B, the world annualconsumption of fuelwood increases by 8 billion m 3 (i.e., atmore than five times the average annual growth observedbetween 1992 and 2006). Almost half of this world increaseof consumption occurs in Asia (850 million m 3 in China,721 million m 3 in India, and 351 million m 3 in Japan). InEurope, consumption grows by 1.4 billion m 3 from 2006 to<strong>2060</strong>, with especially strong growth in France, Germany, theRussian Federation, and the United Kingdom. The1.6 billion m 3 increase of annual consumption in NorthAmerica is due mostly to growth in the United States(+1.2 billion m 3 ). In South America, consumption grows moremodestly (+481 million m 3 , with 184 million m 3 in Brazil).Scenario A2—Under scenario A2, the world annual fuelwoodconsumption increases by less than half than that under A1B,by 3 billion m 3 . In contrast to scenario A1B, under scenarioA2, two-thirds of this growth is in developed countries.Annual consumption grows the most in North America(+1.2 billion m 3 , mostly in the United States), Asia (+936million m 3 , with 285 million m 3 in Japan and 117 million m 3in China), and Europe (+800 million m 3 , with strong growth inFrance and Germany). In South America, annual consumptionincreases by 152 million m 3 , largely in Argentina and Brazil.In Oceania, fuelwood consumption grows somewhat less thanunder scenario A1B. Africa is the only region where fuelwoodconsumption decreases.Scenario B2—Under scenario B2, the world annual fuelwoodconsumption rises somewhat more than under scenario A2but much less than under scenario A1B. As under scenarioA2, about two-thirds of the growth is in developed countries.The main difference between scenarios B2 and A2 is theprojection under scenario B2 of almost double the growthof consumption in Asia. Between 2006 and <strong>2060</strong>, annualfuelwood consumption increases by 473 million m 3 in Chinaand 232 million m 3 in India.Scenario A1B-Low Fuelwood—Under scenario A1B-LowFuelwood, the increase in world fuelwood consumptionbetween 2006 and <strong>2060</strong> is approximately the same as theincrease observed between 1992 and 2006. The growthof consumption in developing countries is triple that indeveloped countries. Annual consumption grows by111 million m 3 in Asia, with 44 million m 3 in India and28 million m 3 in China. Fuelwood consumption increases by66 million m 3 in Africa and 38 million m 3 in Europe, with28 million m 3 in the Russian Federation. In North/CentralAmerica, consumption increases by 19 million m 3 , mostly dueto an increase in the United States. Most of the 13 million m 3increase in South America is in Brazil.Fuelwood tradeFigure 6 shows the net trade (exports minus imports) offuelwood by major world region, from 1961 to <strong>2060</strong>, and table13 shows the data for selected years and principal countrieswithin each region.Observed evolution of fuelwood tradeThe main changes in fuelwood trade between 1992 and 2006were increases in exports from Europe and North/CentralAmerica and a corresponding increase in imports in Asia.Projected evolution of fuelwood tradeUnder all scenarios, Asia is the main region of net imports,while South America and Europe are regions with net exports.However, the magnitude of the trade differed greatly amongscenarios, from scenario A1B with the largest net trade toscenario to A1B-Low Fuelwood with the lowest, and B2 andA2 in between (fig. 6).Scenario A1B—Under scenario A1B, the annual net exportsof fuelwood from developed to developing countries increasesby 819 million m 3 (table 13). More than 2 billion m 3 of theincrease originates in South America, with nearly all of theincrease coming from Brazil. Europe increases annual net11
Solid wood prices, scenario B2 Solid wood prices, scenario A1B-Low Fuelwood Figure 4 (continued)—World prices of fuelwood, industrial roundwood, and sawnwood, observed and projected with the <strong>Global</strong> Forest Products Model.13
Fuelwood consumption, scenario A1B Fuelwood consumption, scenario A2 14Figure 5—Fuelwood consumption by world region, observed and projected with the <strong>Global</strong> Forest Products Model. (continued on next page)
Fuelwoodconsumption, scenario B2 Fuelwood consumption, scenario A1B-Low Fuelwood Figure 5 (continued)—Fuelwood consumption by world region, observed and projected with the <strong>Global</strong> Forest Products Model.15
Fuelwood net trade, scenario A1B Fuelwood net trade, scenario A2 16Figure 6—Fuelwood net trade by world region, observed and projected with the <strong>Global</strong> Forest Products Model. (continued on next page)
exports by 801 million m 3 , mostly from the Russian Federation.North/Central America increases its annual net exports by222 million m 3 , with a 372 million m 3 increase in netexports emerging from Canada, which is partially offset by125 million m 3 more net imports by Mexico. Asia is the mainnegative change of net trade, with India increasing its annualnet imports by 929 million m 3 and China by 694 million m 3 .Scenario A2—Under scenario A2, the net trade of developedcountries falls by 151 million m 3 , an event that turnsdeveloped countries from net exporters into net importers.The largest regional negative change in annual net trade is inAsia (-837 million m 3 , principally in Japan and India). The nettrade of North/Central America also falls (-44 million m 3 ,with -55 million m 3 in Mexico and -29 million m 3 in theUnited States offset by a 35 million m 3 increase in Canada).The other regions experience an increase in annual net trade,mostly from South America (+576 million m 3 , with 449million m 3 from Brazil and 108 million m 3 from Chile). InEurope, annual net trade increases by 165 million m 3 , mostlyfrom the Russian Federation. Africa increases its annual nettrade of fuelwood by 138 million m 3 , despite decreases inEgypt, Nigeria, and South Africa.Scenario B2—Under scenario B2, as in scenario A1B butin contrast to scenario A2, the annual net trade of fuelwoodincreases in developed countries and decreases in developingcountries by 320 million m 3 . The direction of changes in net tradeis similar to that of scenario A1B but different in magnitudes.The increase in deficit of Asia is about half that of scenarioA1B, and still occurs in China, India, Japan, and Indonesia. Theannual net trade increases in all other regions: by 854 millionm 3 in South America (mostly Brazil and Chile), 447 million m 3in Europe (with 203 million m 3 in the Russian Federation), and192 million m 3 in Africa. In North/Central America, annual nettrade increases by 77 million m 3 , with a 93 million m 3 increasein Canada more than compensating for a projected decrease of31 million m 3 in the United States. In Oceania, annual net tradeincreases by 25 million m 3 , mostly from Australia.Scenario A1B-Low Fuelwood—Under scenario A1B-LowFuelwood, the annual net trade of fuelwood decreases indeveloping countries and increases in developed countries, as inB2 but by a lesser amount. Asia and Africa were the two regionswith negative changes of net trade. India is the country with themain negative change (-182 million m 3 ). Net trade decreasesalso in Nigeria (by 62 million m 3 ), and China’s net trade isunchanged. The largest regional positive changes of annual nettrade are in South America (+297 million m 3 , with 213 millionm 3 in Brazil) and Europe (+243 million m 3 , spread over severalcountries, including the Russian Federation and France).18Industrial RoundwoodIndustrial roundwood consumptionFigure 7 shows the data of past and projected industrialroundwood consumption (production plus imports minusexports), except energy wood, between 1961 and <strong>2060</strong> inworld regions. 3 Table 14 shows the same data for selectedyears and countries.Projected evolution of industrial roundwood consumptionUnder all four scenarios, the world annual industrialroundwood consumption decreases—especially underscenarios A2 and B2, less so under scenario A1B, and leastso under scenario A1B-Low Fuelwood. There are substantialdifferences between scenarios, with scenario A1B aligningclosest to A1B-Low Fuelwood, and scenario A2 with B2.Scenario A1B—Under scenario A1B, the world annualconsumption of industrial roundwood decreases by 341 millionm 3 , despite a modest increase of 16 million m 3 in developingcountries. The largest decreases of consumption are in North/Central America (-245 million m 3 , with -167 million m 3 in theUnited States), and Europe (-109 million m 3 , with-44 million m 3 in the Russian Federation and -30 million m 3in Finland). Annual consumption also decreases in SouthAmerica (-67 million m 3 , with -41 million m 3 in Brazil and-21 million m 3 in Chile), Africa (-17 million m 3 ), and Oceania(-6 million m 3 ). The annual consumption of industrialroundwood only increases in Asia (+103 million m 3 by <strong>2060</strong>,with +63 million m 3 in China and +12 million m 3 in Japan).In other regions, the decrease of industrial roundwoodconsumption is due mainly to the decrease of wood pulpin paper and paperboard manufacture, with its fiber needsprovided by increased use of waste paper. Other causesinclude the increasing use of industrial roundwood for energyand, to a lesser extent, improvements in technology thatdecrease the amount of wood use in sawnwood, panels, andpulp production.Scenario A2—Among all the scenarios, scenario A2implies the largest decrease in world industrial roundwoodconsumption (-504 million m 3 , with -455 million m 3 indeveloped countries). As in scenario A1B, the largestdecline is in North/Central America (-390 million m 3 , with-345 million m 3 in the United States and -49 million m 3 inCanada). The decrease of annual consumption in Europe ismore modest than under scenario A1B (the projected decreaseunder scenario A2 is -43 million m 3 , with -45 million in theRussian Federation and -23 million m 3 in Finland). Annualconsumption also decreases in Oceania (-14 million m 3 ) and3 The large drop of consumption in Europe from 1990 to 1991 reflects thecollapse of the former USSR and corresponding data changes. Beginning in1991, Europe includes the data for the Russian Federation only.
Africa (-13 million m 3 ). Annual consumption increases only inAsia, by a modest 18 million m 3 due to an increase of24 million m 3 in China that is partly offset by decreases of 14and 9 million m 3 in Indonesia and Malaysia, respectively.Scenario B2—Projections under scenario B2 are similarto projections under scenario A2, with somewhat lowerdecreases of annual industrial roundwood consumptionin developed and developing countries. The decrease ofconsumption in North/Central America is lower than underscenario A2 but the projected decrease in Europe is aboutdouble that under A2. On the other hand, the increase ofannual consumption in Asia is about double the increase underscenario A2, due in part to a 34 million m 3 increase of annualconsumption in China. The projections for Africa and Oceaniaare similar to those under scenario A2.Scenario A1B-Low Fuelwood—Under scenario A1B-LowFuelwood, the decrease of world annual industrial roundwoodconsumption is less than half the decrease under scenarioA1B. Annual consumption decreases by 245 million m 3in developed countries and increases by 93 million m 3 indeveloping countries. As under the other scenarios, Asia is theonly region with an increase (+142 million m 3 , with 92 millionm 3 in China, 11 million m 3 in India, and 10 million m 3 inJapan). The largest regional decrease of annual consumptionis in North/Central America (-158 million m 3 , with -87 millionm 3 in the United States and -77 million m 3 in Canada). Theannual consumption in Europe decreases by 74 million m 3 ,mostly in the Russian Federation (-39 million m 3 ), Finland(-23 million m 3 ), and Sweden (-18 million m 3 ). Consumptiondecreases in Oceania and Africa by 11 and 3 million m 3 ,respectively.Industrial roundwood tradeFigure 8 shows the annual net trade (exports minus imports)of total industrial roundwood between 1961 and <strong>2060</strong> byworld region. Table 15 shows the same data for selected yearsand countries. The GFPM projections between 2007 and <strong>2060</strong>may include energy wood after the prices of fuelwood andindustrial roundwood converge (fig. 4).Observed evolution of industrial roundwood tradeA major change occurred between 1992 and 2006 asdeveloped countries went from net importers to net exporters,increasing their annual net trade of industrial roundwoodby 38 million m 3 , while developing countries went from netexporters to net importers. Net trade in Europe increased by32 million m 3 , with +40 million m 3 in the Russian Federation.Meanwhile, the largest decrease in net trade was in Asia(-13 million m 3 , with -25 million m 3 in China) and North/Central America (-17 million m 3 , mostly in the United States).Projected evolution of industrial roundwood tradeUnder scenario A1B, the annual net trade of developedcountries increases by 176 million m 3 . The primary growthin annual net trade is in Europe (+195 million m 3 , principallyfrom Finland, Sweden, and Austria, but with a decrease of48 million m 3 in the Russian Federation). An almostsymmetric growth of imports occurs in Asia, where annualnet trade declines by 182 million m 3 . Net trade also decreasesin Africa (-18 million m 3 ) and Oceania (-9 million m 3 ), butincreases by in North/Central America (+2 million m 3 ).Scenario A2—Under scenario A2, the annual net trade ofdeveloped countries increases by about one-fourth of theincrease projected under scenario A1B. The largest growthsof net trade are in South America (+87 million m 3 , mostlyfrom Brazil and Chile) and Europe (+58 million m 3 , with43 million m 3 from the Russian Federation). As underscenario A1B, the decrease in annual net trade is in Asia(-103 million m 3 , of which 66 million m 3 in China and15 million m 3 in India), but net trade also decreases in North/Central America (-16 million m 3 , mostly in Mexico and theUnited States), Africa (-18 million m 3 ), and Oceania(-10 million m 3 ).Scenario B2—Under scenario B2, the change in annual nettrade of developed and developing countries falls betweenthe changes projected under scenarios A1B and A2, withtrade rising by 114 million m 3 for developed countries. Asunder scenario A1B, the largest positive change is in Europe(+133 million m 3 , with 35 million m 3 in Sweden and30 million m 3 equally in Finland and the RussianFederation). A symmetric change occurs in Asia, whereannual net trade decreases by 131 million m 3 , with 76million m 3 in China and 21 million m 3 in India. Annual nettrade also decreases in Africa by 23 million m 3 , Oceania by10 million m 3 , and North/Central America by 8 million m 3(with 6 million m 3 in the United States).Scenario A1B-Low Fuelwood—Among all the scenarios,scenario A1B-Low Fuelwood projects the largest positivechange of annual net trade for developed countries with anincrease of 179 million m 3 between 2006 and 2030. Thecorresponding decline in developing countries centered inAsia, where net trade declined by 196 million m 3 with134 million m 3 in China and 28 million m 3 in India. Net tradealso decreases in Africa and Oceania, by 29 and 10 millionm 3 , respectively. These declines are matched by the increasein annual net trade principally in North/Central America(93 million m 3 , with 96 million m 3 in the United States),Europe (76 million m 3 , with 20 million m 3 in Finland), andSouth America (63 million m 3 , with 39 million m 3 in Braziland 28 million m 3 in Chile).19
Industrial roundwood consumption except energy wood, scenario A1B Industrial roundwood consumption except energy wood, scenario A2 20Figure 7—Industrial roundwood consumption (except energy wood) by world region, observed and projected with the <strong>Global</strong> Forest Products Model.(continued on next page)
Industrial roundwood consumption except energy wood, scenario B2 Industrial roundwood consumption except energy wood, scenario A1B-Low Fuelwood Figure 7 (continued)—Industrial roundwood consumption (except energy wood) by world region, observed and projected with the <strong>Global</strong> ForestProducts Model.21
Total industrial roundwood net trade, scenario A1B Total industrial roundwood net trade, scenario A2 22Figure 8—Total industrial roundwood net trade by world region, observed and projected with the <strong>Global</strong> Forest Products Model. (continued on next page)
Total industrial roundwood net trade, scenario B2 Total industrial roundwood net trade, scenario A1B-Low Fuelwood Figure 8 (continued)—Total industrial roundwood net trade by world region, observed and projected with the <strong>Global</strong> Forest Products Model.23
SawnwoodSawnwood consumptionFigure 9 shows the past and projected annual sawnwoodconsumption in world regions between 1961 and <strong>2060</strong>. Table16 shows the same data for selected years and countries.Observed evolution of sawnwood consumptionThe world annual consumption of sawnwood increased by31 million m 3 between 1992 and 2006, with 22 million m 3 ofthe increase taking place in developing countries and 9 millionm 3 in developed countries. The largest regional increase wasin North/Central America (41 million m 3 , with 27 million m 3in the United States). Annual consumption also increased inSouth America and Africa by 7 and 2 million m 3 , respectively.The largest regional decrease in annual consumption was inEurope (-15 million m 3 , with -41 million m 3 in the RussianFederation, but offset by small increases in other countries).Annual consumption also decreased in Asia by 6 millionm 3 , the cumulative result of an increase of 11 million m 3 inChina offset by a decrease of 16 million m 3 in Japan and othersmaller decreases in other countries.Projected consumption of sawnwoodScenario A1B—Under scenario A1B, the world annualconsumption of sawnwood increases by 53 million m 3 , mostlyin developing countries. The largest growth is in Asia (+33million m 3 , with 10 million m 3 in India and 8 million m 3 inChina). Annual consumption grows by 7 million m 3 in SouthAmerica, with 5 million m 3 in Brazil, and by the same amountin Africa. In North/Central America, annual sawnwoodconsumption grows by 3 million m 3 , with two-thirds of theprojected increase taking place in the United States. Theregional change is less in Europe (+2 million m 3 , with +4million m 3 in the Russian Federation and small declines inseveral other countries).Scenario A2—Scenario A2 implies the smallest worldincrease of annual sawnwood consumption: 12 million m 3 , thecumulative result of a 17 million m 3 increase in developingcountries offset by a 5 million decrease in developedcountries. The main decline is in Europe (-6 million m 3originating in several countries, a decline that offsets a2 million m 3 increase in the Russian Federation). Underscenario A2, Asia has an increase in annual consumptionof 11 million m 3 , with a 4 million m 3 increase in India.Consumption also increases in Africa by 3 million m 3 , North/Central America by 2 million m 3 (mostly in the United States),and South America and Oceania by 1 million m 3 each.Scenario B2—In scenario B2, the growth of the worldsawnwood annual consumption falls between the growthprojected in scenarios A1B and A2. As under A2, consumption24increases in developing countries and decreases in developedcountries, but to a greater degree. There is a world increase of20 million m 3 in annual consumption that matches the increasein Asia, where the increase includes increases in India andChina of 7 and 3 million m 3 , respectively. Consumption alsoincreases in Africa and South America, by 7 and 4 millionm 3 , respectively. However, annual consumption decreases inNorth/Central America by 6 million m 3 , mostly in the UnitedStates, and Europe (-4 million m 3 with decreases in severalcountries not compensated by the 3 million m 3 increase in theRussian Federation).Scenario A1B-Low Fuelwood—The scenario A1B-LowFuelwood induces the highest world growth in annualsawnwood consumption: +95 million m 3 , with +63 million m 3in developing countries. As there is little competitionbetween energy wood and logs for sawnwood under thisscenario, the price of wood is lower than under scenarioA1B, and this leads to cheaper sawnwood and moreconsumption in all regions. As under all the other scenarios,the largest growth is in Asia (+43 million m 3 , with 11 millionm 3 in China and 12 million m 3 in India). In North/CentralAmerica, annual consumption grows by 20 million m 3 ,with 16 million m 3 in the United States. In Europe, annualconsumption increases by 12 million m 3 , with 4 million m 3in the Russian Federation. Consumption grows almost asmuch in South America (+10 million m 3 , with 7 million m 3in Brazil) and Africa (+9 million m 3 ).Sawnwood tradeFigure 10 shows the historical data of annual sawnwood nettrade (exports minus imports) by world region, and table 17shows the data for selected years and countries.Observed evolution of sawnwood tradeBetween 1992 and 2006, the net trade of developed countriesincreased by 18 million m 3 . Most of this increase took placein Europe where net trade increased by 26 million m 3 ,including increases of 10 million m 3 in the RussianFederation and 8 million m 3 in Germany. North/CentralAmerica passed from a surplus to a deficit region, with adecline in net trade of 14 million m 3 due largely to the19 million m 3 decrease in the United States. Asia increasedits annual deficit by 12 million m 3 , with 5 million m 3 inChina and 4 million m 3 in Malaysia.Projected evolution of sawnwood tradeScenario A1B—Under scenario A1B, there is a 3 million m 3reduction in the annual net trade of developed countries. Theannual deficit of Asia decreases by 15 million m 3 , with6 million m 3 in China and 8 million m 3 in Japan. Meanwhile,the annual deficit worsens in North/Central America by9 million m 3 due to a 34 million decrease in the surplus of
Canada that is only partly offset by a 28 million m 3 decreasein the annual deficit of the United States. The positive annualnet trade of Europe decreases by 4 million m 3 due to a15 million m 3 reduction in the Russian Federation surplusthat is offset only in part by an increase of 11 millionin Sweden’s surplus. The annual trade deficit of Africadecreases by 3 million m 3 , while the surplus of Oceaniadecreases by 1 million m 3 .Scenario A2—Under scenario A2, the annual net tradeof sawnwood decreases by 20 million m 3 in developedcountries, traceable largely to the worsening trade deficit ofNorth/Central America by 97 million m 3 , including a25 million m 3 reduction of the annual trade surplus ofCanada, and a worsening of the United States annualdeficit by 76 million m 3 . This regional deficit is met byimprovements of the trade balance in all other regions,mostly in Europe, where annual net trade would increase by73 million m 3 , with 72 million m 3 in Sweden but declines insome other countries. The annual net trade also improves inAsia by 16 million m 3 , with 8 million m 3 in Japan and6 million m 3 in China, and in Africa by 9 million m 3 .Scenario B2—Under scenario B2, there is a reduction in theannual net trade of developed countries by 4 million m 3 ,coming largely from a 32 million decrease in the net tradeof North/Central America that stems from a 35 millionreduction in the annual surplus of Canada, and despite a6 million m 3 decrease in the United States’ deficit. Theannual surplus of Europe increases by 18 million m 3 , largelyfrom the 41 million m 3 increase in Sweden’s annual surplus,and despite the 15 million m 3 reduction in the surplus of theRussian Federation. The annual sawnwood trade deficit ofAfrica is reduced by 4 million m 3 , while the annual surplusof Oceania is reduced by 1 million m 3 .Scenario A1B-Low Fuelwood—Under scenario A1B-LowFuelwood, the development of net trade is similar to thatunder scenario A1B but with an improvement of the nettrade of developing countries, where the deficit is reducedby 6 million m 3 . As under scenario A1B, the main regionalgains of annual net trade occur in Asia (+13 million m 3 ,with 8 million m 3 in Japan and 5 million m 3 in China). Alsoas under scenario A1B, the annual trade surplus of Europedecreases by 15 million m 3 , stemming from the RussianFederation, Finland, and Austria. The annual trade surplusdecreases also in South America, by 5 million m 3 , with 3million m 3 in both Brazil and Chile. As under scenariosA2 and B2, Africa goes from deficit in 2006 to surplus in<strong>2060</strong>, improving net trade by 6 million m 3 , while the annualsurplus of Oceania is reduced by 1 million m 3 .Wood-Based PanelsWood-based panels pricesFigure 11 shows the past and projected world real prices ofveneer and plywood, particleboard, and fiberboard, measuredby the unit value of exports expressed in 1997 U.S. dollars.Tables 18, 19, and 20 show the corresponding prices in themajor countries within each world region.Observed evolution of wood-based panels pricesFrom 1961 to 2006, the real prices of wood-based panelsfluctuated considerably, especially for veneer and plywood,with peaks around 1980. The general tendency was ofdecreasing real prices. In 2006, the real world price of veneerand plywood was $49 lower than it had been in 1992, and $18lower for particleboard and $38 lower for fiberboard.Projected evolution of wood-based panels pricesScenario A1B—Under scenario A1B, the prices of woodbased panels remain approximately constant in real terms up to2030. Then they increase rapidly and reach nearly $600/m 3 forplywood, $400/m 3 for particleboard, and $480/m 3 for fiberboard.Scenarios A2 and B2—Under scenarios A2 and B2, thereis a slight decrease in prices of wood-based panels until2030, followed by a rise that brings the prices in <strong>2060</strong> toapproximately their level of 2006. There is also a convergenceof the prices of fiberboard and particleboard towards the endof the projection period.Scenario A1B-Low Fuelwood—Under scenario A1B-LowFuelwood, the prices of veneer and plywood, particleboard,and fiberboard continue their historic negative and paralleltrend to end lower in <strong>2060</strong> than in 2006.Wood-based panels consumptionFigure 12 shows the past and projected annual wood-basedpanel consumption in world regions, from 1961 to <strong>2060</strong>.Tables 21, 22, and 23 show the same data for selected yearsand countries and for each component, veneer and plywood,particleboard, and fiberboard.Observed wood-based panels consumptionThe world annual consumption of wood-based panelsincreased by 121 million m 3 between 1992 and 2006, threetimes as much as for sawnwood. Consumption grew inall world regions, and more in developing than developedcountries. The largest regional increase was in Asia(59 million m 3 , with 46 million m 3 in China). Annualconsumption increased by 28 million m 3 in Europe, spreadout in several countries. It grew nearly as much in North/Central America (27 million m 3 , with 23 million m 3 in theUnited States). A large part of the 5 million m 3 growth of25
Sawnwood consumption, scenario A1B Sawnwood consumption, scenario A2 26Figure9—Sawnwood consumption by world region, observed and projected with the <strong>Global</strong> Forest Products Model. (continued on next page)
Sawnwood consumption, scenario B2 Sawnwood consumption, scenario A1B-Low Fuelwood Figure 9 (continued)—Sawnwood consumption by world region, observed and projected with the <strong>Global</strong> Forest Products Model.27
Sawnwood net trade, scenario A1B Sawnwood net trade, scenario A2 28Figure 10—Sawnwood net trade by world region, observed and projected with the <strong>Global</strong> Forest Products Model. (continued on next page)
Sawnwood net trade, scenario B2 Sawnwood net trade, scenario A1B-Low Fuelwood Figure 10 (continued) —Sawnwood net trade by world region, observed and projected with the <strong>Global</strong> Forest Products Model.29
Wood-based panels prices, scenario A1B Wood-based panels prices, scenario A2 30Figure11—World prices of wood-based panels, observed and projected with the <strong>Global</strong> Forest Products Model. (continued on next page)
Wood-based panels prices, scenario B2 Wood-based panels prices, scenario A1B-Low Fuelwood Figure 11 (continued)—World prices of wood-based panels, observed and projected with the <strong>Global</strong> Forest Products Model.31
Wood-based panels consumption, scenario A1B Wood-based panels consumption, scenario A2 32Figure 12—Wood-based panels consumption by world region, observed and projected with the <strong>Global</strong> Forest Products Model. (continued on next page)
Wood-based panels consumption, scenario B2 Wood-based panels consumption, scenario A1B-Low Fuelwood Figure 12 (continued) —Wood-based panels consumption by world region, observed and projected with the <strong>Global</strong> Forest Products Model.33
annual consumption in South America took part in Brazil.Consumption also increased by about 1 million m 3 in Africaand Oceania.Projected evolution of wood-based panels consumptionScenario A1B—Under scenario A1B, the world annualconsumption of wood-based panels increases by 98 million m 3 .Eighty percent of this growth takes place in developingcountries. The largest growths are in Asia (+72 million m 3 ,with 51 million m 3 in China and Europe (+16 million m 3 , with6 million m 3 in the Russian Federation). Annual consumptionalso grows by 6 million m 3 in South America, with 4 millionm 3 in Brazil, and 4 million m 3 in Africa. Growth in North/Central America is small (1 million m 3 ), and there was hardlyany change in Oceania.Scenario A2—Scenario A2 implies the smallest worldincrease of annual wood-based panels consumption: 42million m 3 , resulting from a 40 million m 3 increase indeveloping countries. In contrast to scenario A1B, underscenario A2, Asia experiences a modest increase in annualconsumption (+34 million m 3 , with a 26 million m 3 increase inChina, in particular). Consumption also increases in Africa by2 million m 3 , North/Central America by 4 million m 3 (mostlyin the United States), and South America.Scenario B2—Under scenario B2, the growth of the worldwood-based panels annual consumption falls between thegrowth projected under scenarios A1B and A2. As underscenario A2, consumption increases most in developingcountries, but more than under scenario A2. The worldincrease of 59 million m 3 in annual consumption is mostly inAsia, which includes increases of 2 million m 3 in India and35 million m 3 in China. Consumption increases in Africa by3 million m 3 and South America by 4 million m 3 . However,annual consumption decreases in North/Central America by5 million m 3 , mostly in the United States, and Europestagnates as in scenario A2.Scenario A1B-Low Fuelwood—Scenario A1B-Low Fuelwoodinduces the highest world growth in annual wood-basedpanels consumption: +180 million m 3 , with +120 million m 3 indeveloping countries. Consumption grows in all regions dueto the lower panel prices (fig. 11) induced by the lower price ofwood due to little diversion of industrial roundwood for energy.As under the other scenarios, the largest growth is in Asia(+106 million m 3 , with 74 million m 3 in China and 4 million m 3in India). In North/Central America, annual consumption growsby 23 million m 3 , with 20 million m 3 in the United States. InEurope, annual consumption increases by 35 million m 3 , with10 million m 3 in the Russian Federation. Consumption alsogrows in South America (+10 million m 3 from 2006 to <strong>2060</strong>,with 7 million m 3 in Brazil) and Africa (+9 million m 3 ).34Wood-based panels tradeFigure 13 shows the historical annual net trade of wood-basedpanels (exports minus imports) from 1961 to 2006, and theGFPM projections from 2006 to <strong>2060</strong>, by world region. Moredetailed data for selected years, countries, and componentproducts (veneer and plywood, particleboard, and fiberboard)are in tables 24, 25, and 26.Observed wood-based panels tradeFrom 1992 to 2006, developing countries were net exportersof wood-based panels, and their net trade increased by9 million m 3 . Annual trade grew by 4 million m 3 in Asia(+11 million m 3 in China, partly offset by -7 million m 3 inIndonesia and -2 million m 3 in Japan). The South Americanannual net trade grew by 4 million m 3 , with 3 million m 3 inBrazil. In Europe, annual net trade also grew by 8 million m 3 ,with 5 million m 3 in Germany and 2 million m 3 in France.Most of the decrease in annual net trade was in North/CentralAmerica (-11 million m 3 , with -17 million m 3 in the UnitedStates offset in part by +7 million m 3 in Canada).Projected wood-based panels tradeScenario A1B—Under scenario A1B, the developingcountries turn from net exporters into net importers, theirannual net trade decreasing by 18 million m 3 . The largestdecrease is in Asia, which goes from net exporter in 2006 tonet importer in <strong>2060</strong>. In total, the Asian net trade decreases by12 million m 3 , with 7 million m 3 in China and 6 million m 3 inMalaysia, and partly offset by an increase of 7 million m 3 inJapan and the Republic of Korea. Annual net trade decreasesin South America (-2 million m 3 ), Europe (-1 million m 3 , withsmall unequal changes in various countries), and Oceania(-1 million m 3 ). The change in North/Central America isalmost the opposite of the change in Asia, as the regiontransitions from net importer to net exporter, with an increasein the Canadian annual surplus of 9 million m 3 and a decreaseof the United States’ deficit by 6 million m 3 .Scenario A2—Under scenario A2, there is little change in thetrade balance of developed countries and developing countriesas a whole, but there are large changes within regions andcountries. In particular, the annual trade deficit of North/Central America worsens by 20 million m 3 , due to a48 million m 3 increase in the deficit of the United States, offsetonly in part by the 27 million m 3 increase in the surplus ofCanada. The trade surplus of Asia becomes a deficit with a nettrade change of -12 million m 3 , with -7 million m 3 in Chinaand -6 million m 3 in Malaysia, compensated only in partby a 4 million m 3 and a 2 million m 3 reduction of the tradedeficit in Japan and the Republic of Korea, respectively. Thesechanges are matched by increases in the surplus of Europe(+17 million m 3 , spread over several countries) and SouthAmerica (+12 million m 3 , mostly in Brazil).
Scenario B2—Under scenario B2, the annual surplus inwood-panel trade of developing countries decreases by8 million m 3 . This is due in large part to the passage of Asiafrom net exporter to net importer, with a reduction in nettrade of 12 million m 3 , distributed in the same amounts asunder scenario A2 between China, Malaysia, Japan, andthe Republic of Korea. But the annual trade deficit of NorthAmerica is much less than under scenario A2 (-5 million m 3 ,with a 29 million m 3 increase of the trade deficit of the UnitedStates matched in part by an improvement in the Canadiansurplus of 24 million m 3 ). Net exports increase less than underA2 in South America (+8 million m 3 , of which 7 million m 3in Brazil) and Europe (+7 million m 3 , distributed in severalcountries). As under scenario A2, the trade surplus of Oceaniais reduced by 1 million m 3 while the trade deficit of Africa isreduced by the same amount.Scenario A1B-Low Fuelwood—Under scenario A1B-LowFuelwood, the changes of net trade resemble those underscenario A1B for the developed and developing countries asa whole, but are more pronounced by region and country. Inparticular, the net trade of Asia decreases by 21 million m 3 , asthe region changes from exporter to major importer, with thetrade surplus of China, Malaysia, and Indonesia decreasingby 7 million m 3 , 6 million m 3 , and 3 million m 3 , respectively.This worsening of the trade balance of Asia is matched bya 21 million m 3 improvement in the annual trade of North/Central America, where the annual deficit of the United Statesdecreases by 19 million m 3 and the surplus of Canada increasesby 3 million m 3 . The trade balance would also improve inSouth America (+5 million m 3 , due in part to a 6 million m 3increase in Brazilian annual net exports). In contrast, the tradebalance of Europe worsens by 8 million m 3 , changing theregion from net exporter to net importer, with a decrease of5 million m 3 in net exports from Germany and France.Wood Pulp and Other FibersFiber pricesFigure 14 shows past and projected values of the world realprices of mechanical pulp, chemical and semi-chemical pulp,other fiber pulp, and waste paper measured by the unit valueof exports expressed in 1997 U.S. dollars. Tables 27, 28, 29,and 30 show the same data for selected years and countries.Observed evolution of the prices of wood pulpand other fibersThere was a slight negative trend in real prices of the threewood pulp grades and of waste paper from 1961 to 2006, anda positive trend for the price of other fibers, with strong annualfluctuations around this trend. For these four papermakingfibers, the world price was somewhat lower in 2006 than it hadbeen in 1992.Projected evolution of the prices of wood pulpand other fibersScenario A1B—Under scenario A1B, the world prices ofmechanical and chemical wood pulp increase by about $300/mt,and the prices of waste paper by $130/mt. The price of otherfiber pulp decreases by $60/mt.Scenario A2—Under scenario A2 the price of mechanicalpulp increases by about $20/mt and the price of chemical pulpby $60/mt from 2006 to <strong>2060</strong>. The price of waste paper alsoincreases by $34/mt while it decreases by $240/mt for otherfiber pulp.Scenario B2—Under scenario B2, the world prices trends aresimilar to those of scenario A2 (fig. 14), with a slightly higherprice increase for wood pulps and waste paper, and a lowerdecrease for other fiber pulp.Scenario A1B-Low Fuelwood—Scenario A1B-LowFuelwood leads to prices in <strong>2060</strong> that are about $80/mt, $50/mt,and $170/mt lower than in 2006 for mechanical pulp, chemicalpulp, and other fiber pulp, respectively. However, the price ofwaste paper is $140/ton higher in <strong>2060</strong> than in 2006.Wood pulp consumptionFigure 15 shows the data on wood pulp consumption (mechanicaland chemical pulp) from 1961 to 2006 and projections for worldregions, according to the four scenarios. More detailed data forselected years and countries, and separated by mechanical andchemical pulp, are in tables 31 and 32.Observed evolution of wood pulp consumptionFrom 1992 to 2006, the world annual consumption of woodpulp increased by 25 million mt, of which 16 million mt were indeveloping countries. World consumption increased or remainedstable in all regions, except in North America where it decreasedby 5 million mt, due mostly to the decrease of 6 million mt inthe United States. Wood pulp consumption increased in Europe(+16 million mt, of which +4 million mt occurred in Finland and+2 million mt each in Sweden and Germany). In Asia, annualconsumption increased by 12 million mt, mostly in China(+7 million mt), and Indonesia and the Republic of Korea(+2 million mt each). Annual consumption also increased inSouth America by 2 million mt, mostly in Brazil.Projected evolution of wood pulp consumptionScenario A1B—Under scenario A1B, the world annual woodpulp consumption increases by 12 million mt, rising by41 million mt in developing countries while it declines by29 million mt in developed countries. Much of this decrease isin North/Central America where it accelerates after 2030, withthe United States annual consumption ending 23 million mtlower in <strong>2060</strong> than in 2006. Annual wood pulp consumption35
Wood-based panels net trade, scenario A1B Wood-based panels net trade, scenario A2 36Figure 13—Wood-based panels net trade by world region, observed and projected with the <strong>Global</strong> Forest Products Model. (continued on next page)
Wood-based panels net trade, scenario B2 Wood-based panels net trade, scenario A1B-Low Fuelwood Figure 13 (continued)—Wood-based panels net trade by world region, observed and projected with the <strong>Global</strong> Forest Products Model.37
Fiber prices, scenario A1B Fiber prices, scenario A2 38Figure 14—World prices of papermaking fibers, observed and projected with the <strong>Global</strong> Forest Products Model. (continued on next page)
Fiber prices, scenario B2 Fiber prices, scenario A1B-Low Fuelwood Figure 14 (continued)—World prices of papermaking fibers, observed and projected with the <strong>Global</strong> Forest Products Model.39
Wood pulp consumption, scenario A1B Wood pulp consumption, scenario A2 40Figure 15—Wood pulp consumption by world region, observed and projected with the <strong>Global</strong> Forest Products Model. (continued on next page)
Wood pulp consumption, scenario B2 Wood pulp consumption, scenario A1B-Low Fuelwood Figure 15 (continued)—Wood pulp consumption by world region, observed and projected with the <strong>Global</strong> Forest Products Model.41
also decreases in Europe by 4 million mt, with -6 million mtin Finland and -8 million mt in Sweden. Meanwhile, annualwood pulp consumption increases by 37 million mt in Asia,with 24 million mt in China and 3 million mt in India.Scenario A2—Scenario A2 implies a decrease in worldwood pulp consumption of 27 million mt, with -44 million mtin developed countries. The main decrease is in North/Central America (-29 million mt, with -24 million mt inthe United States and -5 million mt in Canada). Annualconsumption also decreases in Europe by 13 million mt,including -8 million mt in Sweden and -7 million mtin Finland. The largest increase in annual wood pulpconsumption is in Asia (+16 million mt from 2006 to <strong>2060</strong>,with +14 million mt in China).Scenario B2—The projections for scenario B2 are similar toA2, with small differences by region and country.Scenario A1B-Low Fuelwood—Under scenario A1B-LowFuelwood, the annual world consumption of wood pulpincreases the most, compared to the other three scenarios,by 29 million mt, with a 35 million increase in developingcountries and a 6 million mt decrease in developed countries.As was the case under the other scenarios, most of thegrowth is in Asia, where annual production increases by31 million mt (with 18 million mt in China and 3 million mtin India). Annual consumption also increases in Europe(+7 million mt spread over several countries, and despitean 8 million mt decline in Sweden). The decrease in annualconsumption in North America (-12 million mt due mainly to-18 million mt in the United States) is about half of what wasobtained under the other scenarios. The better performanceof wood pulp in this scenario than in A1B stems from thelower price of wood pulp (fig. 14) due to the lower use ofindustrial roundwood for energy.Wood pulp net tradeFigure 16 shows the historical data of the net trade of woodpulp (mechanical pulp and chemical pulp), from 1961 to 2006,and the GFPM projections to <strong>2060</strong>, for the world regions,according to each scenario. More detailed data for selectedyears and countries, and separated by mechanical pulp andchemical pulp, are presented in tables 33 and 34.Observed evolution of wood pulp net tradeFrom 1992 to 2006, the annual net trade of developed anddeveloping countries decreased by less than half a million mt,developed countries remaining net exporters while developingcountries stayed net importers. The main regional change wasin South America where annual net exports increased by6 million mt, of which +4 million mt occurred in Brazil.Europe also improved its net trade by reducing net imports42by 1 million mt. Symmetrically, the annual deficit of Asiaincreased by 5 million mt, due largely to China increasedannual net imports by 6 million mt, compensated in part bypositive net trade changes of 2 million mt in Indonesia.Projected evolution of wood pulp net tradeScenario A1B—Under scenario A1B, the annual net exportsof developed countries increase by 19 million mt, while the netimports of developing countries increase by a similar amount.The largest regional change is in Asia, where net importsincrease by 13 million mt, with 11 million mt in China and2 million mt each in India and Indonesia, partly compensatedby decreases of 2 million mt each in Japan and the Republicof Korea. This rise in net imports is met by an increase inannual net exports in North/Central America (+8 million mt,primarily due to +9 million mt in Canada) that compensate forthe decrease in annual net exports of South America(-5 million mt, with 3 million mt in Brazil and 2 million mtin Chile). Europe changes from net importer in 2006 to netexporter in <strong>2060</strong>, with a net trade change of 5 million mtstemming from an increase in the surplus of Finland of4 million mt and Sweden of 3 million mt.Scenario A2—Under scenario A2, the annual net exportsof developed countries (net imports of developing countries)changes by about half of the change in A1B. As under scenarioA1B, the main regional change is an increase in the annualnet imports of Asia (7 million mt due largely to a 5 million mtincrease in China). As under A1B, annual net exports of SouthAmerica decrease by 5 million mt, from Brazil and Chile.These changes are met by increased net exports from North/Central America (+5 million mt, with +11 million mtin Canada and notwithstanding -6 million mt in the UnitedStates) and Europe (+5 million mt, of which +4 million mtoccurred in Finland).Scenario B2—Under scenario B2, the wood pulp annual netexports of developed countries increase by 16 million mt.The increase occurs primarily in Europe, which goes fromnet importer to net exporter, adding 8 million mt to net trade,with 4 million mt in Finland and 3 million mt in Germany.North/Central America also adds 4 million mt to net trade,with a 10 million mt increase in Canada’s surplus and despitea 5 million mt increase in the U.S. deficit. Annual net exportsalso increase in Oceania by 3 million mt to meet an increaseof net imports of 11 million mt in Asia, with 8 million mt inChina and 2 million mt each in India and Indonesia.Scenario A1B-Low Fuelwood—Scenario A1B-LowFuelwood gives the same increase as scenario B2 for thechanges in net annual exports of developed countries, withvariations in regional and country effects. The annual exports ofNorth/Central America grow more than in the other scenarios
(+13 million mt, due mostly to increases of 8 million mtin the United States, which goes from net importer to netexporter, and a 4 million mt increase in Canada’s net exports).Another positive change of net trade is in Europe (+3 millionmt due to lower imports in particular in France and Germany).On the other hand, Asia increases its annual deficit by13 million mt, of which 7 million mt are due to increased netimports of China and 2 million mt of India.Other fiber consumptionIn addition to wood pulp, the GFPM projects production,consumption, prices, and net trade of waste paper and otherfiber pulp. The past world consumption of other fiber pulp wasapproximately 5 percent of the world consumption of totalpapermaking fiber, and it is expected to change little until <strong>2060</strong>(table 35). On the other hand, waste paper constituted 46 percentof the world fiber consumption for papermaking in 2006, andthis share is projected to increase to about 70 percent by <strong>2060</strong>,a level that seems achievable given 2006 shares of 68 percentin the United Kingdom, 61 percent in Germany, 71 percent inSpain, and 66 percent in China. This increase is made possibleby the rise of waste paper recovery rate, the ratio of wastepaper production to paper and paperboard consumption, whichreaches 75 percent in Europe and North America, and above 60percent in Asia by <strong>2060</strong>, with a faster increase in scenario A1Bdue to more rapid economic growth (fig. 17).Figure 18 shows the historical data and projections of wastepaper consumption in the main world regions. Table 36 showsthe same data for selected years and countries within eachregion.Observed evolution of waste paper consumptionFrom 1992 to 2006, the world annual consumption of wastepaper increased by 94 million mt, nearly four times the growthof wood pulp consumption. More than half of this growth wasin developing countries. The main regional growth was inAsia (+54 million mt, with 42 million mt in China and3 million mt in Indonesia), followed by Europe (+21 millionmt, with +6 million mt in Germany), and in North/CentralAmerica (+17 million mt, with +13 million mt in the UnitedStates). Annual consumption also grew by 1 million mt eachin Africa and Oceania, but by less than one half million ton inSouth America.Scenario A1B—According to scenario A1B, the worldconsumption of waste paper grows by 330 million mt, with184 million mt in developing countries. Most of the regionalgrowth is in Asia (+163 million mt, with 91 million mt inChina, 14 million mt in India, and 11 million mt in Japan).Annual consumption grows by 69 million mt in North/CentralAmerica, with 40 million mt in the United States, 20 millionmt in Canada, and 7 million mt in Mexico. An almost equalgrowth occurs in Europe (+68 million mt, principally in theRussian Federation, the United Kingdom, Finland, Germany,and France). Annual consumption grows by 16 million mt inSouth America, with 9 million mt in Brazil and 3 million mtin Argentina, and by 11 million mt and 4 million mt in Africaand Oceania, respectively.Scenario A2—Under scenario A2, the world annualconsumption of waste paper grows by 207 million mt,and more in developed countries (+114 million mt) than indeveloping countries. As under scenario A1B, the mainregional change is in Asia, but smaller (+82 million mt, with46 million in China, 6 million mt in India, and 9 million mtin Japan). Consumption also grows less in North/CentralAmerica (+56 million mt, with 36 million mt in the UnitedStates, 15 million mt in Canada, and 4 million mt in Mexico).Consumption grows by 49 million mt in Europe, mostly inGermany, Finland, and the United Kingdom; 10 million mt inSouth America (with 6 million mt in Brazil); 6 million mt inAfrica; and 3 million mt in Oceania (mostly Australia).Scenario B2—Under scenario B2, the change of annualwaste paper consumption, 231 million mt, is slightly higherthan in scenario A2. The 118 million mt growth in developingcountries is almost equal to that in developed countries.Consumption in Asia grows more than under scenario A2(+99 million mt, with 55 million mt in China, 9 million mt inIndia, and 7 million mt in Japan). In North/Central America,annual consumption grows by 53 million mt, with 28 millionmt in the United States, 18 million mt in Canada, and5 million mt in Mexico. European consumption also grows by53 million mt, principally in Finland, Germany, and the UnitedKingdom. In South America, annual waste paper consumptionincreases by 13 million mt, with 7 million mt in Brazil, whileit grows by 10 million mt in Africa and 3 million mtin Oceania.Scenario A1B-Low Fuelwood—Scenario A1B-LowFuelwood gives the highest increase in the world annualconsumption of waste paper among the four scenarios,348 million mt, with 195 million mt in developed countries.The growth in Asia (132 million mt, with 61 million mt inChina, and 12 million each in India and Japan) is smaller thanunder scenario A1B. Instead, the North/Central Americanannual consumption grows more than under A1B (98 millionmt, with 52 million mt in the United States, 36 million mt inCanada, and 6 million mt in Mexico). Annual consumptionin Europe also grows more than under A1B (+86 million mt,with 17 million mt in Finland, 12 million mt in Germany, and9 million mt in the United Kingdom). In Africa and Oceania,waste paper annual consumption increases by 11 million mt and4 million mt respectively, the same as under scenario A1B.43
Wood pulp net trade, scenario A1B Wood pulp net trade, scenario A2 44Figure 16—Wood pulp net trade by world region, observed and projected with the <strong>Global</strong> Forest Products Model. (continued on next page)
Wood pulp net trade, scenario B2 Wood pulp net trade, scenario A1B-Low Fuelwood Figure 16 (continued)—Wood pulp net trade by world region, observed and projected with the <strong>Global</strong> Forest Products Model.45
Waste paper recovery rate, scenario A1B Waste paper recovery rate, scenario A2 46Figure 17—Waste paper recovery rate by world region, observed and projected with the <strong>Global</strong> Forest Products Model. (continued on next page)
Waste paper recovery rate, scenario B2 Waste paper recovery rate, scenario A1B-Low Fuelwood Figure 17 (continued)—Waste paper recovery rate by world region, observed and projected with the <strong>Global</strong> Forest Products Model.47
Waste paper consumption, scenario A1B Waste paper consumption, scenario A2 48Figure 18—Waste paper consumption by world region, observed and projected with the <strong>Global</strong> Forest Products Model. (continued on next page)
Waste paper consumption, scenario B2 Waste paper consumption, scenario A1B-Low Fuelwood Figure 18 (continued)—Waste paper consumption by world region, observed and projected with the <strong>Global</strong> Forest Products Model.49
Other fiber net tradeWhile the trade of nonwood fiber pulp was quite small andis expected to remain so (table 37), the world trade of wastepaper was 50 percent of the world trade of total papermakingfibers in 2006. Figure 19 shows the historical data of the nettrade of waste paper from 1961 to 2006 and the projections to<strong>2060</strong> for each world region. Table 38 shows the same data forselected years and countries within each region.Observed evolution of waste paper net tradeFrom 1992 to 2006, developing countries were net importersof waste paper while developed countries were net exporters.The annual net imports of developing countries increasedby 23 million mt. Much of this growth of annual net importswas in Asia (18 million mt, with 19 million mt in China,partly compensated by a growth of the Japanese net trade of4 million mt). Symmetrically, net exports increased in North/Central America by 9 million mt, and by 10 million mt inthe United States. The annual net exports of Europe alsoincreased by 9 million mt, including a 4 million mt increase inthe United Kingdom. There was little change in the net tradeof Africa, while the net exports of Oceania increased by1 million mt, mostly in Australia.Projected evolution of waste paper net tradeScenario A1B—Under scenario A1B, the net imports ofdeveloping countries decrease by 17 million mt. The mainregional change is in Asia, where net imports decrease by22 million mt, due principally to China’s change from netimporter to net exporter, a 41 million mt increase in net trade,and despite a 14 million mt increase of India’s net imports.North/Central America changes from net exporter in 2006 tonet importer in <strong>2060</strong>, with a reduction in annual net trade of 14million mt, due mostly to a reduction of Canadian annual netimports by 15 million mt. Europe is still a net exporter in <strong>2060</strong>,but with 3 million mt less of annual net exports compared to2006, a change due mostly to Finland going from net exporterto net importer with a reduction of 7 million mt in annual nettrade. In Africa, net imports increased by 2 million mt,while there is little change in Oceania.Scenario A2—Under scenario A2, the annual net imports ofwaste paper in developing countries decreases by 16 million mt.This is related mostly to a 20 million mt decrease of netimports in Asia, due to a 26 million mt improvement of the nettrade of China, which goes from net importer to net exporter,and despite a 6 million mt increase of annual net imports inIndia. In North/Central America, net trade decreases by11 million mt, mostly due to a 13 million mt increase in the netimports of Canada. The annual net exports of Europe decreaseby 4 million mt, due mostly to a deterioration of Finland’s nettrade. The annual net imports increases by 2 million mt inSouth America and 1 million mt in Africa.50Scenario B2—Under scenario B2, the net imports ofdeveloping countries decreases by 21 million mt. Asiagoes from net importer to net exporter, with a 26 millionmt improvement of net trade (+ 36 million mt in China,changing it to a net exporter, against a 9 million mt increasein the net imports of India). Symmetrically, North/CentralAmerica goes from net exporter in 2006 to net importer in<strong>2060</strong>, mostly due to a 15 million mt increase in the annualimports of Canada. Europe remains a net exporter, but witha reduction of 6 million mt, mostly due to an increase inFinland’s imports.Scenario A1B-Low Fuelwood—Scenario A1B-LowFuelwood gives the largest increase in the waste paper annualnet trade of developing countries among the four scenarios,56 million mt. Most of the increase is in Asia, where nettrade increases by 61 million mt with a 77 million mtimprovement in China, which goes from being a largeimporter to a large exporter, partly compensated by a12 million mt increase in the net imports of India. The nettrade of North/Central America decreases by 39 million mt,and the region becomes a large net importer, mostly due toa 33 million mt increase in Canadian imports. Europe alsochanges from net exporter in 2006 to net importer in <strong>2060</strong>,with a nearly 16 million mt increase in the net imports ofFinland. The net imports of Africa increase by 2 million mt,and the net exports of Oceania decrease by 1 million mt,mostly in Australia.Paper and PaperboardPrices of paper and paperboardFigure 20 shows the past and projected values of the worldprices of newsprint, printing and writing paper, and otherpaper and paperboard, expressed by the unit value of worldexports in 1997 U.S. dollars. Tables 39, 40, and 41 show theprices in selected years and countries.Observed evolution of prices of paper and paperboardPast data show a strong negative trend of the world price ofall three commodities, but with large fluctuations around thistrend. From 1992 to 2006, the real world price decreased by$124/mt for newsprint, $276/mt for printing and writing paper,and by $183/mt for other paper and paperboard.Projected evolution of prices of paper and paperboardScenario A1B—Under scenario A1B, after a slight decreasefrom 2006 to 2030, the price of newsprint and of printing andwriting paper ends up in <strong>2060</strong> at about the same level as in2006. The price of other paper and paperboard declines to endat about $96/mt lower than in 2006.
Scenario A2—Under scenario A2, the prices of all threegrades of paper decline steadily from 2006 to <strong>2060</strong>. Thereal price of newsprint ends approximately $130/mt lower in<strong>2060</strong> than in 2006, the price of printing and writing paperwas $220 lower, and that of other paper and paperboard was$230 lower.Scenario B2—The price trends for scenario B2 are similarto those of A2, with slightly smaller decreases: -$100/mtfor newsprint, -$190/mt for printing and writing paper, and-$200/mt for other paper and paperboard.Scenario A1B-Low Fuelwood—Under scenario A1B-LowFuelwood, the price changes are similar to those in scenarioB2, except for less decrease of the price of other paper andpaperboard (-150$/ton).Paper and paperboard consumptionFigure 21 shows the historical data and the projections of theannual consumption of total paper and paperboard (newsprint,printing and writing paper, and other paper and paperboard),by world region. More detailed data for each subcommoditygroup, and for selected years and countries are in tables 42, 43,and 44.Observed evolution of paper and paperboard consumptionFrom 1992 to 2006, the world annual consumption of totalpaper and paperboard increased by 132 million mt, with81 million mt in developing countries. The main regionalgrowth was in Asia, where annual consumption increased by73 million mt, with 49 million mt in China and 3 million mteach in India and the Republic of Korea. In Europe, annualconsumption increased by 33 million mt, with 5 million mt inGermany and 4 million mt each in Spain and Italy. The annualconsumption of North/Central America grew by 19 million mt,with 12 million mt in the United States and 5 million mt inMexico. In South America, annual consumption increasedby 3 million mt, mostly in Brazil, Argentina, and Chile. Itincreased as much in Africa and by 2 million mt in Oceania.Projected evolution of paper and paperboard consumptionScenario A1B—Under scenario A1B, annual worldconsumption of total paper and paperboard increases by374 million mt, with 278 million mt in developing countries.Asia is the region of most growth (+244 million mt, with145 million mt in China, 21 million mt in India, 12 million mtin Indonesia, and 10 million mt in Japan). The second largestgrowth of annual consumption is in Europe (+55 million mt,with 8 million mt in the Russian Federation, 7 million mt in theUnited Kingdom, and 5 million each in France and Germany).In North/Central America, the annual consumption increasesby 35 million mt, with 17 million mt in the United States,9 million mt in Mexico, and 5 million mt in Canada. SouthAmerica increases its annual consumption by 20 million mt,with more than half in Brazil. Annual consumption increasesby 17 million mt in Africa, with 4 million mt each in Egypt andNigeria, and by 3 million mt in Oceania, most of it in Australia.Scenario A2—Under scenario A2, the growth of annualconsumption of paper and paperboard is about half what it isunder scenario A1B: 131 million mt in developing countriesand 61 million mt in developed countries. Asia still has thelargest growth: 117 million mt growth in aggregate, with75 million mt growth in China, 8 million mt in India, and7 million mt in Japan. In Europe, annual consumption growsby 31 million mt, with 6 million mt in the United Kingdomand 4 million mt each in France and Germany. The North/Central American annual consumption increases by24 million mt, with 14 million mt in the United States and5 million mt in Canada. Annual consumption grows by10 million mt in South America (with 5 million mt in Brazil),8 million mt in Africa, and 3 million mt in Oceania.Scenario B2—Under scenario B2, the world annualconsumption of paper and paperboard grows faster fordeveloping countries (+179 million mt) but slower fordeveloped countries (+48 million mt) than under scenario A2.In Asia, the annual consumption increases by 150 million mt,with 93 million mt in China and 14 million mt in India. InEurope, annual consumption increases by 34 million mt,including 4 million each in the Russian Federation and theUnited Kingdom. The increase of annual consumption in bothAfrica (+15 million mt, with 4 million mt in South Africa) andin South America (+4 million mt, with 7 million mt in Brazil)exceeds the increase in North America (+12 million mt, with5 million mt in Mexico and 3 million mt in Canada).Scenario A1B-Low Fuelwood—Scenario A1B-LowFuelwood gives the largest increase in the world annualconsumption of paper and paperboard: 404 million mt, with291 million in developing countries. Relative to scenario A1B,this is due to the lower price of paper and paperboard (fig. 20)in concert with a lower price of wood pulp induced by a lowerprice of wood stemming from the low use of wood for energy.As in the other scenarios, the largest growth is in Asia, whereannual consumption increased by 256 million mt, with151 million mt in China, 21 million mt in India,13 million mt in Indonesia, and 12 million mt in Japan. Europeis still the region of second largest growth, with an increaseof 63 million mt of annual consumption, principally in theRussian Federation and the United Kingdom (+8 million mteach), Germany (+7 million mt), and France (+6 million mt).In North/Central America, annual consumption increased by42 million mt, with 22 million mt in the United States,10 million mt in Mexico, and 6 million mt in Canada. The annualconsumption of South America increased by 21 million mt,51
Waste paper net trade, scenario A1B Waste paper net trade, scenario A2 52Figure 19—Waste paper net trade by world region, observed and projected with the <strong>Global</strong> Forest Products Model. (continued on next page)
Paper and paperboard prices, scenario B2 Paper and paperboard prices, scenario A1B-Low Fuelwood Figure 20 (continued)—World prices of paper and paperboard by world region, observed and projected with the <strong>Global</strong> Forest Products Model.55
Total paper and paperboard consumption, scenario A1BTotal paper and paperboard consumption, scenario A2Figure 21—Paper and paperboard consumption by world region, observed and projected with the <strong>Global</strong> Forest Products Model. (continued on next page)56
Total paper and paperboard consumption, scenario B2Total paper and paperboard consumption, scenario A1B-Low FuelwoodFigure 21 (continued)—Paper and paperboard consumption by world region, observed and projected with the <strong>Global</strong> Forest Products Model.57
with more than half in Brazil. The annual consumption ofpaper and paperboard grew in Africa by 18 million mt, and inOceania by 4 million mt, mostly in Australia.Paper and paperboard net tradeFigure 22 shows the annual net trade (exports minus imports)of total paper and paperboard of world regions, from 1961 to<strong>2060</strong>. Tables 45, 46, and 47 show detailed data for newsprint,printing and writing paper, and other paper and paperboard,for selected years and countries.Observed evolution of paper and paperboard net tradeFrom 1992 to 2006, the annual net exports of developedcountries increased by 5 million mt. The main regionalchange of annual net trade was in Europe (+9 million mt, with5 million mt in Finland and 4 million mt each in Germany andSweden). The annual net exports of North/Central Americadecreased by 6 million mt during the same period, mostly dueto a 3 million mt increase of annual net imports in the UnitedStates and a 2 million mt increase in Mexico. Net imports alsoincreased in Africa and Asia by approximately 1 million mt.Projected evolution of paper and paperboard net tradeScenario A1B—Under scenario A1B, the annual net importsof paper and paperboard in developing countries increasesteadily and then decrease to end up 25 million mt higher in<strong>2060</strong> than in 2006 (13 million mt higher in China and3 million mt higher in India). The net exports of Europe andNorth America change symmetrically. In North/CentralAmerica, annual net exports increase by 16 million mt, largelydue to an increase of 14 million mt of the annual net exportsof Canada, while the net imports of the United States decreaseby 3 million mt. In Europe, annual net exports increase by8 million mt, with a decrease of net imports of 6 million mt inthe United Kingdom, an increase of net exports of 3 millionmt each in France and Germany, and a 7 million mt decreasein the net exports of Sweden. The net imports of Africaincrease by 3 million mt, while Oceania changes from beinga net importer to net exporter with an overall change in nettrade of about 1 million mt.Scenario A2—Under scenario A2, the annual net imports ofdeveloping countries increase by about half of the projectionunder scenario A1B. The annual imports of Asia decrease by 11million mt, with a 9 million mt decrease of net imports in Chinaand a 3 million mt decrease of net exports in Indonesia. Theannual net exports of North/Central America increase by8 million mt, with a 6 million mt increase of net exports ofCanada, and a decrease of 2 million mt of net imports of Mexico.Europe increases its annual net exports by 4 million mt, with a6 million mt decrease of net imports in the United Kingdom, anda 3 million mt increase of the net exports from Germany, but withan 8 million mt decrease in the net exports of Sweden.58Scenario B2—Under scenario B2, developing countriesincrease their annual net imports of paper and paperboardslightly less than under scenario A1B. The annual net importsdecrease by 19 million mt in Asia, with a 14 million mtdecrease of net imports in China and a 3 million mt decreaseof net exports in Indonesia. The North/American annual nettrade improves by 15 million mt, with a 13 million mt increasein Canadian annual net exports and a 2 million mt decreasein annual net imports of the United States. The net trade ofEurope also improves by 6 million mt, with a 4 million mtincrease in the annual net exports of Germany, a 3 million mtincrease in the net exports of France, and a 6 million mtdecrease in the net imports of the United Kingdom, but withan 8 million mt decrease in the net exports of Sweden. Theannual net imports of Africa increase by 2 million mt, andthe annual net exports of Oceania increase by 1 million mt,mostly from Australia.Scenario A1B-Low Fuelwood—Scenario A1B-LowFuelwood leads to an 84 million mt increase of the annualnet imports in developing countries, the largest among thefour scenarios. In Asia, annual net imports increase by76 million mt, with 64 million mt in China and 3 million mtin India, while the net exports of Indonesia decrease by3 million mt. Symmetrically, the annual net exports ofNorth/Central America increase by 50 million mt, with37 million mt in Canada and 15 million mt in the UnitedStates. In Europe, net exports increase by 31 million mt,with an 18 million mt increase in the net exports of Finland,an 8 million mt increase in the net exports of Germany, anda 6 million mt decrease in the net imports of the UnitedKingdom, and partly compensated by a decrease in theannual exports of Sweden of 7 million mt. The annual netimports of Africa increase by 3 million mt, while the netexports of Oceania increase by about 1 million mt.Value AddedFigure 23 shows the data on the annual value added to woodand fiber input in forest industries, defined as the value ofproduction minus the value of wood and fiber consumption,in 1992 and 2006, and projected values for 2006 to <strong>2060</strong>, forthe world regions. The value added is in real terms at the 1997value of the U.S. dollar. Table 48 shows the correspondingdata for selected years and countries within each region.Observed evolution of value added to wood and fiber inputFrom 1992 to 2006, the world annual value added increasedby $148 billion, with $80 billion occurred in developingcountries. The largest regional increase was in Asia (+$70billion, with $51 billion in China, $4 billion in the Republicof Korea, and $3 billion in Indonesia). In Europe, the annualvalue added increased by $42 billion over the same period,
with $9 billion in Germany, $5 billion in Finland and $4billion each in Sweden and Spain. Meanwhile, the North/Central American annual value added grew by $24 billion, ofwhich $12 billion came from the United States and $9 billionfrom Canada. The annual value added increased by $9 billionin South America, of which $5 billion occurred in Brazil. InOceania it grew by approximately $2 billion and by $1 billionin Africa.Projected evolution of value added to wood and fiber inputScenario A1B—Under scenario A1B, the world value addedincreases by $86 billion, mostly in developing countries. Themain growth is in Asia (+$64 billion, including +$45 billion inChina and +$7 billion in India, but with a $4 billion decreasein Japan). In South America, annual value added increases by$6 billion, two-thirds of which is in Brazil. The value addedin Africa and Europe also increases by about $6 billion each,spread over several countries, and despite a $6 billion decreasein Germany. In North/Central America, value added increasesby $3 billion with a $7 billion decrease in the United Statesoffset by an almost equal increase in Canada. In Oceania, itincreased by approximately $1 billion, mostly in Australia.Scenario A2—Under scenario A2, the world annual valueadded decreases by $3 billion, with a decrease of $29 billion indeveloped countries. The main regional change is a $24 billiondecrease of value added in North/Central America, with a$33 billion decrease in the United States offset in part by a$7 billion increase in Canada. Meanwhile, the value addedincreases by $10 billion in Asia, with a $15 billion increase inChina, but a $6 billion decrease in Japan. In South America,value added increases by $5 billion from 2006 to <strong>2060</strong>, mostlyin Brazil. It increases by $4 billion in Africa and $1 billionin Europe, where a $7 billion decrease in Germany is partlyoffset by an increase of $3 billion in both Sweden and theUnited Kingdom.Scenario B2—Under scenario B2, the world annual valueadded increases by $16 billion, with a decrease of $25 billionin developed countries. The main regional decrease is inNorth/Central America, with a $27 billion decrease in theUnited States partly offset by an $8 billion increase in Canada.The annual value added also decreases in Europe, by$1 billion, with a $7 billion decrease in Germany partly offsetby rises in several other countries. The annual value addedincreases in Asia (+$22 billion, with an equal increase inChina and despite a $7 billion decrease in Japan). In Africa,annual value added increases by $6 billion.Scenario A1B-Low Fuelwood—Scenario A1B-LowFuelwood leads to the largest increase in annual value added:$120 billion, with $75 billion in developing countries. Valueadded increases in all regions. As under the other scenarios,the main change is in Asia (+$53 billion, with $33 billion inChina and $7 billion in India, but with a $4 billion decreasein Japan). In North/Central America, annual value addedincreases by $28 billion, with increases of $14 billion inCanada and $11 billion in the United States. The annual valueadded in Europe increases by $20 billion, with a $5 billionincrease in Finland and a $4 billion increase in the UnitedKingdom, but with decreases of $2 billion and $3 billionin Germany and Sweden, respectively. The value addedincreases by $7 billion in Africa, and by $1 billion in Oceania,despite an equivalent contraction in New Zealand.Summary and ConclusionThe main finding concerns the important impact of the highdemand for biofuels implied in some of the IntergovernmentalPanel on Climate Change (IPCC) scenarios. In particular,scenario A1B, which implies a 5.5-fold increase in the worldconsumption of fuelwood by <strong>2060</strong>, leads to a rapid growth ofthe real price of fuelwood, which converges with the price ofindustrial roundwood by about 2030. At that point, industrialroundwood, used in the past to manufacture sawnwood,panels, and pulp, starts to be used for energy production. Theprice of all wood then continues to rise steadily up to <strong>2060</strong>,and the price of manufactured product increases in concert.This results in more roundwood diverted into fuelwood forthe rapidly growing economies of Asia, and in response, moreroundwood from South America and Europe.According to the projections of scenario A1B, the largeincrease in fuelwood demand leads to a total annualroundwood consumption of 11.2 billion m 3 in <strong>2060</strong>. This iswell above the sustainable production suggested by previousstudies (Smeets and Faaij 2007). In fact, the A1B scenarioimplies less world growing stock in <strong>2060</strong> than in 2006. Andeven under scenarios A2 and B2, the growing stock of Asia islower in <strong>2060</strong>, suggesting unsustainable levels of harvest. Itis likely that existing forest practice laws and sustained-yieldpolicies would not allow this to happen. Scenario A1B inparticular is liable to run into those constraints. On the otherhand, the economic and demographic assumptions of scenarioA1B coupled with a low fuelwood demand, lead to a globalharvest of 3.6 billion m 3 only, and to growing stock higherthan its current level in <strong>2060</strong>, in all regions.A study for Europe (EEA 2007) up to the year 2030 usedthe EFI-GTM model (Kallio and others 2004) to estimatethe change in the mix of potential sources of biomassfor bioenergy (industrial and harvest residues, imports,competition with other uses) at different prices, taking intoconsideration available biomass resources and competingdemands for wood. Like our study, it predicted that at high59
Total paper and paperboard net trade, scenario A1B Total paper and paperboard net trade, scenario A2 60Figure 22—Paper and paperboard net trade by world region, observed and projected with the <strong>Global</strong> Forest Products Model. (continued on next page)
Total paper and paperboard net trade, scenario B2 Total paper and paperboard net trade, scenario A1B-Low Fuelwood Figure 22 (continued)—Paper and paperboard net trade by world region, observed and projected with the <strong>Global</strong> Forest Products Model.61
Value added, scenario A1B Value added, scenario A2 62Figure 23 —Value added to wood and fiber in forest industries by world region, observed and projected with the <strong>Global</strong> Forest Products Model.(continued on next page)
Value added, scenario B2 Value added, scenario A1B-Low Fuelwood Figure 23 (continued)—Value added to wood and fiber in forest industries by world region, observed and projected with the <strong>Global</strong> Forest Products Model.63
ioenergy prices, wood would be reallocated from other uses,particularly chemical pulp, to bioenergy. As Europe’s woodimports also would rise to meet bioenergy demand, this wouldincrease the possibility of illegal logging and unsustainableforest management in some supplying countries. To helpavert this, governments in importing and exporting countriescould strengthen measures that discourage the production andtrade in illegally logged wood. The Lacey Act Amendment of2008 in the United States and the Forest Law Enforcement,Governance and Trade program of the European Union areexamples of such policies.Another feature of the projections of the present study is themodest growth in the consumption of manufactured woodproducts under most scenarios, leading to moderate changesin the real prices of wood-based panels and pulp and paper.The price of sawnwood is more affected in scenario A1Bbecause of the large share of the wood price, influenced by thehigh fuelwood demand, in the cost of sawnwood production.However, the consumption of all wood products grows rapidlyin Asia, due mostly to the fast economic growth of Chinaand India in all the scenarios used here. As a result, Asiawould be a large importer of industrial roundwood, largelysupplied by South America (Brazil) and Europe (the RussianFederation). Asia would also be the largest importer of paperand paperboard, primarily from Europe but also from NorthAmerica. Despite these imports, Asia would see the largestregional growth of value added to wood and fiber in forestindustries.The projections presented here have three sources ofuncertainty. One is the theoretical <strong>Global</strong> Forest ProductsModel (GFPM) structure and its parameters, such as thedemand elasticities, input-output coefficients, and forestgrowth equation parameters. Another is the data describingthe past and current state of the world. The third stems fromthe exogenous predictions: population and GDP growth rates,biofuel demand growth from the IPCC scenarios, and otherexogenous changes.The GFPM was calibrated in such a way that its base-yearsolution, here for 2006, reproduced the observed data. Earliertests of prediction errors from 1980 to 2000 showed thatthe model replicates the observed trends, if not the year-toyeardetail. As expected, projections of consumption andproduction are more accurate than those of trade, and regionalprojections are more accurate than those for individualcountries (Buongiorno and others 2003, Turner 2004).the calibration procedure corrects some errors in theforestry production data of the FAOSTAT (Buongiornoand others 2001). Strong assumptions have been made inthe projections. In particular, technical change is reflectedmostly by the wood-saving changes in manufacturing andthe increasing use of waste paper in paper and paperboardmanufacture. The possibility of better recovery of woodin the forest has not been considered explicitly. It is alsopossible that future carbon pricing policies may have effectson forests and forest industries that are not taken intoaccount in the IPCC scenarios or the model. In addition,future developments of general energy prices may limit therise in the price of wood energy that occurs under scenarioA1B and the substitution of wood for other energy sources, atopic that merits further investigation.In considering other future studies, the issue of climatechange and its impact on the forest sector comes naturallyto mind [see Kirilenko and Sedjo (2007) for a review]. Asused in this study, the GFPM includes the impact of climatechange on future forest growth explicitly only for the UnitedStates through the shifts of timber supply. For other countries,climate change is incorporated only to the extent that it isreflected by past growth data. Several studies have used theprojections of atmospheric and biological climate change ineconomic forest sector models, for countries (McCarl andothers 2000), regions (Solberg and others 2003), or the world(Perez-Garcia and others 2002, Sohngen and Sedjo 2005).Some studies assume higher growth of forests due to elevatedCO 2 concentrations, higher temperatures, and longer growingseasons (Nabuurs and others 2002), factors that in turn leadto increased timber inventories and supply, particularly inSouth America and Oceania, and hence lower timber prices(Perez-Garcia and others 2002, Sohngen and Mendelsohn1998, Sohngen and Sedjo 2005, Solberg and others 2003). Thisgrowth may be limited by the propagation of pests, diseases,and invasive species (Sohngen and Sedjo 2005).Still, the main source of uncertainty for the time horizonof this study rests in the future world situation stylized bythe IPCC scenarios. Scenario A1B is very different fromA2 and B2 in terms of future population, economic growth,and biofuel demand. Given current knowledge, no definiteprobability may be assigned to each scenario. Yet eachscenario represents a plausible outcome. The results presentedin this report—with due caution and wisdom—should proveuseful in assessing the implications of future world forestryand its implications for the United States.The base-year data used in the GFPM (FAO 2009, WorldBank 2008) are inaccurate, but are the only internationallycomparable data. The goal programming approach of64
Index of TablesTable 1 — Countries and world regions represented in the <strong>Global</strong> Forest Products Model . . . . . . . . . . . . . . . . . . . . 69Table 2 — Elasticity of demand for end products in the <strong>Global</strong> Forest Products Model with respect toGross Domestic Product (GDP), price, and yearly rate of shift . . . . . . . . . . . . . . . . . . . . . . . . . . . . . 70Table 3 — Rates of shift in wood supply and of forest area change in the United States assumed in the<strong>Global</strong> Forest Products Model scenarios . . . . . . . . . . . . . . . . . . . . . . . . . . . . . . . . . . . . . . . . . 70Table 4 — Intergovernmental Panel on Climate Change global scenario characteristics . . . . . . . . . . . . . . . . . . . . . 70Table 5 — Projected percent growth rate of Gross Domestic Product for world regions and selected countriesin the <strong>Global</strong> Forest Products Model . . . . . . . . . . . . . . . . . . . . . . . . . . . . . . . . . . . . . . . . . . . 71Table 6 — Observed and projected Gross Domestic Product per capita for world regions and selected countriesin the <strong>Global</strong> Forest Products Model ($U.S. of 1990). . . . . . . . . . . . . . . . . . . . . . . . . . . . . . . . . . 72Table 7 — Observed and projected forest area (thousand ha) for world regions and selected countriesin the <strong>Global</strong> Forest Products Model . . . . . . . . . . . . . . . . . . . . . . . . . . . . . . . . . . . . . . . . . . . 73Table 8 — Observed and projected forest stock (million m 3 ) for world regions and selected countriesin the <strong>Global</strong> Forest Products Model . . . . . . . . . . . . . . . . . . . . . . . . . . . . . . . . . . . . . . . . . . . 74Table 9 — Observed and projected fuelwood prices (1997$/ m 3 ) for selected countries in the <strong>Global</strong> Forest Products Model. . . 75Table 10 — Observed and projected industrial roundwood prices (1997$/ m 3 ) for selected countriesin the <strong>Global</strong> Forest Products Model . . . . . . . . . . . . . . . . . . . . . . . . . . . . . . . . . . . . . . . . . . . 76Table 11 — Observed and projected sawnwood prices (1997$/m 3 ) for selected countries in the <strong>Global</strong> Forest Products Model . . . 77Table 12 — Observed and projected fuelwood consumption (thousand m 3 ) for world regions and selected countriesin the <strong>Global</strong> Forest Products Model . . . . . . . . . . . . . . . . . . . . . . . . . . . . . . . . . . . . . . . . . . . 78Table 13 — Observed and projected fuelwood net trade (thousand m 3 ) for world regions and selected countriesin the <strong>Global</strong> Forest Products Model . . . . . . . . . . . . . . . . . . . . . . . . . . . . . . . . . . . . . . . . . . . 79Table 14 — Observed and projected industrial roundwood consumption (except energy wood) (thousand m 3 )for world regions and selected countries in the <strong>Global</strong> Forest Products Model . . . . . . . . . . . . . . . . . . . . . 80Table 15 — Observed and projected industrial roundwood net trade (thousand m 3 ) for world regionsand selected countries in the <strong>Global</strong> Forest Products Model . . . . . . . . . . . . . . . . . . . . . . . . . . . . . . . 81Table 16 — Observed and projected sawnwood consumption (thousand m 3 ) for world regions and selectedcountries in the <strong>Global</strong> Forest Products Model . . . . . . . . . . . . . . . . . . . . . . . . . . . . . . . . . . . . . . 82Table 17 — Observed and projected sawnwood net trade (thousand m 3 ) for world region and selectedcountries in the <strong>Global</strong> Forest Products Model . . . . . . . . . . . . . . . . . . . . . . . . . . . . . . . . . . . . . . 83Table 18 — Observed and projected veneer and plywood prices (1997$/ m 3 ) for selected countriesin the <strong>Global</strong> Forest Products Model . . . . . . . . . . . . . . . . . . . . . . . . . . . . . . . . . . . . . . . . . . . 84Table 19 — Observed and projected particleboard prices (1997$/ m 3 ) for selected countriesin the <strong>Global</strong> Forest Products Model . . . . . . . . . . . . . . . . . . . . . . . . . . . . . . . . . . . . . . . . . . . 85Table 20 — Observed and projected fiberboard prices (1997$/ m 3 ) for selected countriesin the <strong>Global</strong> Forest Products Model . . . . . . . . . . . . . . . . . . . . . . . . . . . . . . . . . . . . . . . . . . . 8666
Index of Tables (continued)Table 21 — Observed and projected veneer and plywood consumption (thousand m 3 ) for world regionsand selected countries in the <strong>Global</strong> Forest Products Model . . . . . . . . . . . . . . . . . . . . . . . . . . . . . . . 87Table 22 — Observed and projected particleboard consumption (thousand m 3 ) by world regionand country in the <strong>Global</strong> Forest Products Model . . . . . . . . . . . . . . . . . . . . . . . . . . . . . . . . . . . . 88Table 23 — Observed and projected fiberboard consumption (thousand m 3 ) for world regionsand selected countries in the <strong>Global</strong> Forest Products Model . . . . . . . . . . . . . . . . . . . . . . . . . . . . . . . 89Table 24 — Observed and projected veneer and plywood net trade (thousand m 3 ) for world regions andselected countries in the <strong>Global</strong> Forest Products Model . . . . . . . . . . . . . . . . . . . . . . . . . . . . . . . . . 90Table 25 — Observed and projected particleboard net trade (thousand m 3 ) for world regionsand selected countries in the <strong>Global</strong> Forest Products Model . . . . . . . . . . . . . . . . . . . . . . . . . . . . . . . 91Table 26 — Observed and projected fiberboard net trade (thousand m 3 ) for world regionsand selected countries in the <strong>Global</strong> Forest Products Model . . . . . . . . . . . . . . . . . . . . . . . . . . . . . . . 92Table 27 — Observed and projected mechanical pulp prices (1997$/mt) for selected countriesin the <strong>Global</strong> Forest Products Model . . . . . . . . . . . . . . . . . . . . . . . . . . . . . . . . . . . . . . . . . . . 93Table 28—Observed and projected chemical pulp prices (1997$/mt) for selected countriesin the <strong>Global</strong> Forest Products Model . . . . . . . . . . . . . . . . . . . . . . . . . . . . . . . . . . . . . . . . . . . 94Table 29—Observed and projected other fiber pulp prices (1997$/mt) for selected countries in the <strong>Global</strong> Forest Products Model . 95Table 30—Observed and projected waste paper prices (1997$/mt) for selected countries in the <strong>Global</strong> Forest Products Model. 96Table 31—Observed and projected mechanical pulp consumption (thousand mt) for world regionsand selected countries in the <strong>Global</strong> Forest Products Model . . . . . . . . . . . . . . . . . . . . . . . . . . . . . . . 97Table 32 — Observed and projected chemical pulp consumption (thousand mt) for world regionsand selected countries in the <strong>Global</strong> Forest Products Model . . . . . . . . . . . . . . . . . . . . . . . . . . . . . . . 98Table 33 — Observed and projected mechanical pulp net trade (thousand mt) for world regionsand selected countries in the <strong>Global</strong> Forest Products Model . . . . . . . . . . . . . . . . . . . . . . . . . . . . . . . 99Table 34 — Observed and projected chemical pulp net trade (thousand mt) for world regionsand selected countries in the <strong>Global</strong> Forest Products Model . . . . . . . . . . . . . . . . . . . . . . . . . . . . . . 100Table 35 — Observed and projected other fiber pulp consumption (thousand mt) for world regionsand selected countries in the <strong>Global</strong> Forest Products Model . . . . . . . . . . . . . . . . . . . . . . . . . . . . . . 101Table 36 — Observed and projected waste paper consumption (thousand mt) for world regionsand selected countries in the <strong>Global</strong> Forest Products Model . . . . . . . . . . . . . . . . . . . . . . . . . . . . . . 102Table 37 — Observed and projected other fiber pulp net trade (thousand mt) for world regionsand selected countries in the <strong>Global</strong> Forest Products Model . . . . . . . . . . . . . . . . . . . . . . . . . . . . . . 103Table 38 — Observed and projected waste paper net trade (thousand mt) for world regions and selectedcountries in the <strong>Global</strong> Forest Products Model . . . . . . . . . . . . . . . . . . . . . . . . . . . . . . . . . . . . . 104Table 39 — Observed and projected newsprint prices (1997$/mt) for selected countries in the <strong>Global</strong> Forest Products Model . . . 105Table 40 — Observed and projected printing and writing paper prices (1997$/mt) for selected countriesin the <strong>Global</strong> Forest Products Model . . . . . . . . . . . . . . . . . . . . . . . . . . . . . . . . . . . . . . . . . . 10667
Index of Tables (continued)Table 41 — Observed and projected other paper and paperboard prices (1997$/mt) for selected countriesin the <strong>Global</strong> Forest Products Model . . . . . . . . . . . . . . . . . . . . . . . . . . . . . . . . . . . . . . . . . . 107Table 42 — Observed and projected newsprint consumption (thousand mt) for world regions and selectedcountries in the <strong>Global</strong> Forest Products Model . . . . . . . . . . . . . . . . . . . . . . . . . . . . . . . . . . . . . 108Table 43 — Observed and projected printing and writing paper consumption (thousand mt) for world regionsand selected countries in the <strong>Global</strong> Forest Products Model . . . . . . . . . . . . . . . . . . . . . . . . . . . . . . 109Table 44 — Observed and projected other paper and paperboard consumption (thousand mt) for world regionsand selected countries in the <strong>Global</strong> Forest Products Model . . . . . . . . . . . . . . . . . . . . . . . . . . . . . . 110Table 45 — Observed and projected newsprint net trade (thousand mt) for world regions and selected countriesin the <strong>Global</strong> Forest Products Model . . . . . . . . . . . . . . . . . . . . . . . . . . . . . . . . . . . . . . . . . . 111Table 46 — Observed and projected printing and writing paper net trade (thousand mt) for world regionsand selected countries in the <strong>Global</strong> Forest Products Model . . . . . . . . . . . . . . . . . . . . . . . . . . . . . . 112Table 47 — Observed and projected other paper and paperboard net trade (thousand mt) for world regionsand selected countries in the <strong>Global</strong> Forest Products Model . . . . . . . . . . . . . . . . . . . . . . . . . . . . . . 113Table 48 — Observed and projected value added to wood and fiber input in forest industries (million 1997$)for world regions and selected countries in the <strong>Global</strong> Forest Products Model . . . . . . . . . . . . . . . . . . . . 11468
Table 1—Countries and world regions represented in the <strong>Global</strong> Forest Products ModelAFRICA Uganda Brunei Darussalam New ZealandAlgeria Congo, Dem. Rep. Zambia Cambodia Papua New GuineaAngola Zimbabwe China SamoaBenin NORTH/CENTRAL AMERICA Cyprus Solomon IslandsBotswana Bahamas Georgia TongaBurkina Faso Barbados Hong Kong VanuatuBurundi Belize India EUROPECameroon Canada Indonesia AlbaniaCape Verde Cayman Islands Iran, Islamic Rep. of AustriaCentral African Rep Costa Rica Iraq BelgiumChad Cuba Israel BelarusCongo, Rep Dominica Japan Bosnia and HerzegovinaCôte d’Ivoire Dominican Rep Jordan BulgariaDjibouti El Salvador Kazakhstan CroatiaEgypt Guatemala Korea, Dem. Peop Rep Czech RepublicEquatorial Guinea Haiti Korea, Rep DenmarkEthiopia Honduras Kuwait EstoniaGabon Jamaica Kyrgyzstan FinlandGambia Martinique Lao People’s Dem. Rep. FranceGhana Mexico Lebanon GermanyGuinea Netherlands Antilles Macau GreeceGuinea-Bissau Nicaragua Malaysia HungaryKenya Panama Mongolia IcelandLesotho Saint Vincent/Grenadines Myanmar IrelandLiberia Trinidad and Tobago Nepal ItalyLibyan Arab Jam. United States of America Oman LatviaMadagascar SOUTH AMERICA Pakistan LithuaniaMalawi Argentina Philippines Macedonia, The fmr Yug. Rep. ofMali Bolivia, Plurinational State of Qatar MaltaMauritania Brazil Saudi Arabia Moldova, RepMauritius Chile Singapore NetherlandsMorocco Colombia Sri Lanka NorwayMozambique Ecuador Syrian Arab Rep. PolandNiger French Guiana Tajikistan PortugalNigeria Guyana Thailand RomaniaRéunion Paraguay Turkey Russian FederationRwanda Peru Turkmenistan SlovakiaSão Tomé and Príncipe Suriname United Arab Emirates SloveniaSenegal Uruguay Uzbekistan SpainSierra Leone Venezuela, Boliv Rep. Vietnam SwedenSomalia ASIA Yemen SwitzerlandSouth Africa Afghanistan OCEANIA UkraineSudan Armenia Australia United KingdomSwaziland Azerbaijan, Rep. Cook Islands Serbia and MontenegroTanzania, United Rep. Bahrain Fiji IslandsTogo Bangladesh French PolynesiaTunisia Bhutan New Caledonia69
Table 2—Elasticity of demand for end products in the<strong>Global</strong> Forest Products Model with respect to GrossDomestic Product (GDP), price, and yearly rate of shiftGDP Price YearFuelwood-developing countries 0.05 1 -0.10 2Fuelwood-developed countries 0.22 1 -0.10 2Sawnwood 0.22 -0.10 -0.003Standard error 0.03 0.02 0.001Plywood & veneer 0.41 -0.29 -0.009Standard error 0.04 0.02 0.002Particleboard 0.54 -0.29 -0.006Standard error 0.07 0.02 0.002Fiberboard 0.35 -0.46 -0.002Standard error 0.06 0.02 0.002Newsprint 0.58 -0.25 -0.008Standard error 0.04 0.02 0.001Printing & Writing 0.45 -0.37 0.003Standard error 0.03 0.02 0.001Other paper & Paperboard 0.43 -0.23 -0.004Standard error 0.03 0.02 0.001Table 4—Intergovernmental Panel on Climate Changeglobal scenario characteristicsScenarioA1B A2 B2Population growth low high mediumGDP 1 growth very high medium mediumEnergy use very high high mediumLand- use changes low medium/high mediumResource availability medium low mediumPace of technological change rapid slow medium1 Gross Domestic Product1 Used only in Scenario A1B-Low Fuelwood2 Annual rates of shift set to conform with Intergovernmental Climate Control Panelbiofuel projections (see text)Table 3—Rates of shift in wood supply and of forest area change in the United States assumed in the<strong>Global</strong> Forest Products Model scenarios2006-2007 2007-2010 2010-2015 2015-2030 2030-2045 2045-<strong>2060</strong>Annual rate of wood supply shiftScenarios A1B and A1B-Low Fuelwood 0.0000 0.0000 0.0175 0.0047 0.0135 -0.0094Scenario A2 0.0000 0.0000 0.0038 0.0070 0.0065 0.0030Scenario B2 0.0000 0.0000 0.0184 0.0050 0.0033 0.0038Annual rate of forest area changeScenarios A1B and A1B-Low Fuelwood -0.0044 -0.0045 -0.0015 -0.0009 0.0006 -0.0046Scenario A2 -0.0053 -0.0053 -0.0012 -0.0045 0.0028 0.0044Scenario B2 -0.0037 -0.0037 -0.0013 -0.0012 0.0014 -0.004370
Table 5—Projected percent growth rate of Gross Domestic Product for world regions and selected countries inthe <strong>Global</strong> Forest Products Model 1 Scenario A1B Scenario A2 Scenario B22006-2030 2030-<strong>2060</strong> 2006-2030 2030-<strong>2060</strong> 2006-2030 2030-<strong>2060</strong>AFRICA 7.1 5.4 3.4 4.1 5.0 5.9Egypt 7.2 5.1 3.8 4.4 4.6 5.2Nigeria 8.9 6.1 5.0 4.7 7.0 7.0South Africa 4.1 3.1 0.6 1.7 3.2 3.6NORTH/CENTRAL AMERICA 2.6 2.3 1.9 1.8 1.7 1.4Canada 2.2 1.9 1.7 1.3 1.6 0.8Mexico 5.2 3.2 1.8 2.1 2.5 3.1United States 2.3 2.1 1.9 1.8 1.6 1.1SOUTH AMERICA 5.3 3.3 2.0 2.5 2.7 3.4Argentina 4.7 2.8 1.4 1.9 2.0 2.7Brazil 5.2 3.2 1.8 2.2 2.4 3.0Chile 4.9 2.9 2.1 2.5 3.0 3.6ASIA 5.5 3.8 2.5 2.4 3.7 2.8China 7.4 3.8 3.9 3.2 5.6 2.8India 8.8 5.1 4.2 3.2 6.8 4.0Indonesia 8.2 4.5 3.9 2.8 5.7 2.9Japan 1.4 1.2 0.9 0.6 0.6 0.1Korea, Republic of 4.9 1.7 0.8 -0.1 2.9 0.3Malaysia 6.5 2.7 2.7 1.4 4.5 1.5OCEANIA 2.9 2.1 2.2 1.6 2.2 0.9Australia 2.6 1.9 2.1 1.6 2.0 0.8New Zealand 2.6 2.0 2.3 1.8 2.4 1.1EUROPE 2.3 2.0 1.2 1.1 1.3 1.3EU-27 1.9 1.7 1.2 1.0 1.1 0.9Austria 1.4 1.2 0.9 0.5 0.9 0.4Finland 1.3 1.1 0.9 0.5 0.9 0.5France 1.9 1.6 1.4 1.0 1.1 0.6Germany 1.5 1.3 1.0 0.7 0.8 0.3Italy 1.3 1.2 0.8 0.5 0.6 0.2Spain 1.7 1.6 1.3 0.9 1.1 0.6Sweden 1.3 1.1 0.8 0.5 1.1 0.6United Kingdom 2.0 1.7 1.5 1.1 1.3 0.8Russian Federation 5.7 3.2 1.1 2.9 2.9 3.0DEVELOPED, ALL 2.3 2.0 1.5 1.4 1.4 1.2DEVELOPING, ALL 6.7 4.2 3.1 3.0 4.6 3.7WORLD 3.9 3.2 1.9 2.0 2.4 2.41 Projections based on population projections of the International Panel on Climate Change and on the projections of gross domestic productper capita in Table 6.71
Table 6—Observed and projected Gross Domestic Product per capita for world regions andselected countries in the <strong>Global</strong> Forest Products Model ($U.S. of 1990) 1Scenario A1B Scenario A2 Scenario B22006 2030 <strong>2060</strong> 2030 <strong>2060</strong> 2030 <strong>2060</strong>AFRICA 1027 3449 13545 1417 3307 1987 7755Egypt 1240 4756 17495 1929 4256 2724 9996Nigeria 475 2326 11626 966 2927 1400 7430South Africa 4451 12318 30137 5226 7615 6492 14278NORTH/CENTRAL AMERICA 19677 29684 50391 23592 30083 22940 27454Canada 27162 39205 61551 34505 43524 34798 43857Mexico 4558 12537 30442 5044 6844 6533 14059United States 28679 41021 62485 35884 46269 32933 34262SOUTH AMERICA 4378 11953 29322 5023 7408 6564 15364Argentina 6778 16849 36044 6982 8638 8845 16925Brazil 4528 12477 30358 4997 6790 6501 14019Chile 5865 15128 33892 7084 10777 9584 24292ASIA 2352 7016 20939 3141 4908 4515 9226China 1016 5431 19510 2051 4170 3295 7499India 616 3741 15767 1255 2579 2365 6646Indonesia 1030 5490 19630 1865 3267 3132 6568Japan 29518 41711 63769 36580 44166 36747 44684Korea, Republic of 11909 33965 55616 13072 11392 21685 23975Malaysia 5773 19809 40868 7547 8541 12349 16696OCEANIA 18860 28943 49811 23107 29233 25107 32288Australia 24629 36449 59039 31751 41582 32768 43297New Zealand 18744 29742 52562 26272 38419 26805 38764EUROPE 15225 26595 51409 20035 27489 21823 35509EU-27 20291 31703 55194 26676 35845 27343 39164Austria 27521 39591 61896 35505 44611 35179 44214Finland 36042 48398 69424 43606 50531 44063 52379France 28108 40217 62453 35577 44425 35823 44859Germany 28416 40545 62744 36207 45066 36161 45196Italy 25384 37278 59803 33241 42779 32829 41868Spain 18861 29880 52702 27012 39209 26428 37256Sweden 36520 48875 69814 44029 50815 44519 52731United Kingdom 22360 33918 56660 30001 40373 29647 39004Russian Federation 3786 15034 43203 4961 10464 8434 23430DEVELOPED, ALL 18808 30362 53982 24132 32046 24595 33838DEVELOPING, ALL 1607 5939 18836 2357 4239 3510 8675WORLD 5158 10275 24889 6013 8289 7143 125761 Data for 2006 are from World Bank (2008), and projections are based on projections of the Intergovernmental Panel for Climate Changewith the method described in Appendix B.72
Table 7—Observed and projected forest area (thousand ha) for world regions and selected countries in the <strong>Global</strong> ForestProducts Model 1 Observed Scenario A1B Scenario A2 Scenario B2Scenario A1B-Low Fuelwood1992 2006 2030 <strong>2060</strong> 2030 <strong>2060</strong> 2030 <strong>2060</strong> 2030 <strong>2060</strong>AFRICA 678886 621478 557314 601973 542215 494239 543351 528537 557314 601973Egypt 47 69 90 166 87 130 87 142 90 166Nigeria 16323 10724 5237 2506 5144 2108 5159 2266 5237 2506South Africa 9203 9203 10189 13995 9474 10610 9468 11429 10189 13995NORTH/CENTRAL AMERICA 709453 705105 687181 686483 683035 665927 683561 679249 687181 686483Canada 310134 310134 310134 310134 310134 310134 310134 310134 310134 310134Mexico 68306 63982 64557 78295 59686 57918 59861 63649 64557 78295United States of America 299374 303393 289317 274456 291161 278722 291414 284490 289317 274456SOUTH AMERICA 883014 827570 746999 799827 697526 610124 699499 667058 746999 799827Argentina 34958 32889 33345 36816 30646 29423 30680 32105 33345 36816Brazil 514550 474832 416039 423027 384549 312091 385710 343158 416039 423027Chile 15376 16186 19709 28814 18413 23991 18564 26654 19709 28814ASIA 571242 572212 538150 650391 517377 509967 524906 556983 538150 650391China 160926 201631 210764 297789 202732 226462 205279 244506 210764 297789India 64646 67701 71072 95958 68918 74077 69843 81819 71072 95958Indonesia 112557 86726 58360 45368 55816 33198 56623 36225 58360 45368Japan 24935 24868 24868 24868 24868 24868 24868 24868 24868 24868Korea, Republic of 6357 6259 6533 6533 6339 6356 6575 7251 6533 6533Malaysia 22217 20744 20252 21049 18572 16789 19302 19732 20252 21049OCEANIA 211391 205720 203331 207719 201607 198256 202212 201284 203331 207719Australia 167247 163515 163678 163678 163678 163678 163678 163678 163678 163678New Zealand 7819 8326 8769 8769 8814 8889 8825 8963 8769 8769EUROPE 990882 1002045 969796 1050580 872526 827293 914467 996283 969796 1050580EU-25 136105 145990 156797 171371 154033 165226 155754 175161 156797 171371Austria 3788 3866 3871 3871 3865 3865 3870 3870 3871 3871Finland 22250 22500 22500 22500 22500 22500 22500 22500 22500 22500France 14697 15601 15807 15807 15762 15762 15872 15872 15807 15807Germany 10807 11076 11076 11076 11076 11076 11076 11076 11076 11076Italy 8586 10089 12151 12272 12380 13361 12518 14130 12151 12272Russian Federation 809014 808790 763025 816943 672553 612273 710711 761223 763025 816943Spain 14024 18220 20301 20658 20413 21479 20449 22236 20301 20658Sweden 27388 27528 27528 27528 27528 27528 27528 27528 27528 27528United Kingdom 2646 2857 3037 3037 3075 3094 3097 3161 3037 3037DEVELOPED, ALL 1825647 1837684 1793207 1867801 1695758 1639910 1738676 1819737 1793207 1867801DEVELOPING, ALL 2219221 2096446 1909564 2129172 1818528 1665897 1829318 1809658 1909564 2129172WORLD 4044868 3934130 3702771 3996973 3514286 3305807 3567994 3629395 3702771 39969731 Observations derived from FAO (2001), projections obtained with the <strong>Global</strong> Forest Products Model.73
Table 8—Observed and projected forest stock (million m 3 ) for world regions and selected countries in the <strong>Global</strong> ForestProducts Model 1Observed Scenario A1B Scenario A2 Scenario B2Scenario A1B-Low Fuelwood1992 2006 2030 <strong>2060</strong> 2030 <strong>2060</strong> 2030 <strong>2060</strong> 2030 <strong>2060</strong>AFRICA 67818 64970 60721 60342 60870 58456 60565 61007 62473 73653Egypt 6 9 0 0 0 0 0 0 0 0Nigeria 1962 1467 291 10 443 39 406 32 426 90South Africa 635 653 262 33 294 97 271 88 316 216NORTH/CENTRAL AMERICA 72449 75574 76266 60810 77514 76049 76991 75354 77690 84877Canada 32983 33214 32591 27882 32801 32722 32769 32195 32688 33673Mexico 3144 3144 2285 633 2226 1061 2256 1071 2503 2061United States of America 32543 35856 38814 30663 39852 40283 39364 40041 39739 46420SOUTH AMERICA 128286 121704 129673 139228 122626 122041 122605 130605 131206 165942Argentina 2091 1825 2048 1721 1922 1863 1922 2010 2097 2619Brazil 87732 81321 88267 94029 83009 81767 82966 87556 89363 113693Chile 1587 1945 2384 1374 2384 2728 2367 2708 2508 3959ASIA 50474 47015 39509 28534 40872 35930 40674 36376 42477 47956China 10831 13295 9725 3403 10275 6123 10171 5793 10853 10974India 4421 4698 2102 254 2646 893 2521 780 2717 1887Indonesia 12123 4893 2327 271 2598 652 2462 584 2684 1231Japan 3247 4249 6456 8058 6514 9587 6507 9358 6472 9847Korea, Republic of 274 529 1186 1194 1199 1950 1227 2045 1224 2176Malaysia 5011 5311 6375 6982 5916 6659 6127 7627 6412 8586OCEANIA 12616 12559 12620 10959 12681 12396 12697 12398 12747 13302Australia 10203 10203 10666 9861 10718 10944 10723 10935 10738 11409New Zealand 1181 1181 970 449 997 741 998 720 989 820EUROPE 104210 109662 116775 109632 107755 109748 112210 127601 118497 146481EU-25 17439 21023 25861 17164 26290 29174 26474 29867 26791 36576Austria 974 1192 1413 1002 1447 1672 1449 1579 1455 1871Finland 1939 2158 2464 1431 2559 2886 2546 2641 2523 3218France 2113 2559 2897 841 3181 2430 3137 2329 3157 3441Germany 2899 2899 3828 2219 3982 4280 3949 4178 3957 5291Italy 1095 1475 2127 1801 2231 2700 2239 2720 2220 2780Russian Federation 80086 80479 80236 81495 71374 67897 75243 83139 80728 92458Spain 627 913 1247 844 1295 1541 1291 1482 1286 1662Sweden 2838 3155 3284 1835 3403 3219 3380 3214 3361 3865United Kingdom 274 355 405 185 428 395 429 377 414 460DEVELOPED, ALL 186017 196091 207720 188215 200048 205422 203996 222540 210634 250657DEVELOPING, ALL 249836 235393 227844 221289 222270 209197 221746 220802 234457 281553WORLD 435853 431484 435563 409504 422318 414619 425741 443342 445091 5322101 Observations derived from FAO (2006), projections obtained with the <strong>Global</strong> Forest Products Model.74
Table 9—Observed and projected fuelwood prices (1997$/m 3 ) for selected countries in the <strong>Global</strong> Forest ProductsAFRICAObserved Scenario A1B Scenario A2 Scenario B2Scenario A1B-Low Fuelwood1992 2006 2030 <strong>2060</strong> 2030 <strong>2060</strong> 2030 <strong>2060</strong> 2030 <strong>2060</strong>Egypt 56 46 101 266 71 128 78 135 69 73Nigeria 44 46 101 266 71 128 78 135 69 73South Africa 53 46 101 266 71 128 78 135 69 73NORTH/CENTRAL AMERICACanada 44 46 99 256 70 118 77 125 59 63Mexico 53 46 95 265 70 127 71 134 59 63United States of America 53 56 88 338 77 194 77 189 48 60SOUTH AMERICAArgentina 44 46 91 266 71 128 76 127 59 63Brazil 44 46 91 256 61 118 68 125 59 63Chile 44 46 91 256 61 118 68 125 59 63ASIAChina 44 61 107 282 75 136 83 144 68 73India 44 56 100 265 70 127 77 134 68 72Indonesia 44 46 101 266 71 128 78 135 69 73Japan 53 56 100 265 70 127 77 134 59 63Korea, Republic of 44 46 91 266 61 118 68 135 59 63Malaysia 44 67 91 256 73 118 75 125 59 63OCEANIAAustralia 53 46 91 256 71 128 75 125 59 63New Zealand 44 0 91 262 71 121 76 127 59 66EUROPEEU-25Austria 53 56 91 256 68 118 68 125 59 63Finland 53 56 91 256 61 118 68 125 59 63France 44 46 91 265 64 127 68 125 59 63Germany 53 56 91 265 70 127 77 129 59 63Italy 53 56 100 265 70 127 77 134 59 63Russian Federation 44 46 91 256 61 118 68 125 59 63Spain 53 46 100 265 70 127 77 134 59 63Sweden 44 56 91 256 70 127 71 125 59 63United Kingdom 44 46 100 265 70 127 77 134 59 63DEVELOPED, ALLDEVELOPING, ALLWORLD 52 39 91 256 61 118 68 125 59 631 Observations derived from FAO (2009), projections obtained with the <strong>Global</strong> Forest Products Model.75
Table 10—Observed and projected industrial roundwood prices (1997$/m 3 ) for selected countries in the <strong>Global</strong> ForestProducts Model 1AFRICAObserved Scenario A1B Scenario A2 Scenario B2Scenario A1B-Low Fuelwood1992 2006 2030 <strong>2060</strong> 2030 <strong>2060</strong> 2030 <strong>2060</strong> 2030 <strong>2060</strong>Egypt 96 91 107 281 92 138 94 146 97 82Nigeria 86 80 150 642 123 342 128 376 131 232South Africa 86 80 117 318 102 166 107 164 101 91NORTH/CENTRAL AMERICACanada 101 94 92 255 81 117 82 124 84 62Mexico 111 102 112 291 96 144 98 154 101 86United States of America 86 80 87 336 76 193 76 188 67 59SOUTH AMERICAArgentina 86 80 91 264 74 127 75 126 78 64Brazil 86 80 88 254 74 115 75 123 78 63Chile 86 80 88 256 73 118 75 125 78 63ASIAChina 96 91 103 265 90 134 92 141 93 80India 98 94 103 272 87 133 89 140 92 78Indonesia 86 80 108 310 91 164 96 174 98 101Japan 101 94 99 265 82 127 83 134 90 72Korea, Republic of 102 95 102 261 86 115 88 132 91 76Malaysia 86 80 91 255 74 117 75 124 78 64OCEANIAAustralia 86 80 90 256 74 127 75 124 77 62New Zealand 86 80 86 240 73 111 74 117 75 69EUROPEEU-25Austria 101 95 91 256 80 118 81 125 84 64Finland 102 95 93 256 80 118 83 125 86 63France 86 80 88 264 73 126 75 125 77 64Germany 86 80 90 263 72 125 74 127 76 62Italy 100 93 100 264 85 128 86 134 89 76Russian Federation 86 80 87 251 76 113 77 121 78 65Spain 101 94 98 263 85 125 85 133 89 76Sweden 102 95 102 255 88 126 90 125 92 63United Kingdom 104 80 100 273 85 135 85 141 88 80DEVELOPED, ALLDEVELOPING, ALLWORLD 117 72 88 256 73 118 75 125 78 631 Observations derived from FAO (2009), projections obtained with the <strong>Global</strong> Forest Products Model.76
Table 11—Observed and projected sawnwood prices (1997$/m 3 ) for selected countries in the <strong>Global</strong> Forest ProductsModel 1Observed Scenario A1B Scenario A2 Scenario B2Scenario A1B-Low Fuelwood1992 2006 2030 <strong>2060</strong> 2030 <strong>2060</strong> 2030 <strong>2060</strong> 2030 <strong>2060</strong>AFRICAEgypt 266 281 220 346 188 189 192 198 198 126Nigeria 228 241 257 407 222 235 227 245 233 168South Africa 253 268 273 400 229 220 247 236 236 158NORTH/CENTRAL AMERICACanada 228 241 222 392 207 244 207 251 210 183Mexico 228 281 260 436 241 271 241 288 244 211United States of America 253 268 244 482 229 320 229 320 217 181SOUTH AMERICAArgentina 276 241 234 408 209 255 211 254 215 184Brazil 228 241 232 397 209 245 212 253 216 185Chile 228 241 231 397 207 245 210 253 214 184ASIAChina 261 276 251 394 236 254 236 262 240 199India 329 348 290 414 269 260 272 268 276 199Indonesia 228 241 240 392 222 253 227 261 230 198Japan 258 273 246 386 229 248 230 255 237 194Korea, Republic of 266 281 254 388 238 239 240 256 243 200Malaysia 228 241 229 378 211 240 213 247 216 184OCEANIAAustralia 266 281 258 396 230 255 232 252 236 183New Zealand 228 241 228 384 210 243 212 249 215 192EUROPEEU-25Austria 228 241 222 384 210 243 211 249 214 187Finland 228 241 222 395 206 245 209 251 214 183France 256 271 241 394 224 250 226 248 229 185Germany 256 241 228 387 211 248 213 250 215 184Italy 256 271 251 395 231 256 231 271 235 206Russian Federation 228 241 229 396 204 246 207 252 212 183Spain 256 271 246 387 231 248 231 256 235 199Sweden 228 241 222 392 199 250 202 249 206 178United Kingdom 256 271 251 392 231 254 231 260 235 201DEVELOPED, ALLDEVELOPING, ALLWORLD 238 228 222 392 203 250 203 249 206 1781 Observations derived from FAO (2009), projections obtained with the <strong>Global</strong> Forest Products Model.77
Table 12—Observed and projected fuelwood consumption (thousand m 3 ) for world regions and selected countries in the<strong>Global</strong> Forest Products Model 1Observed Scenario A1B Scenario A2 Scenario B2Scenario A1B-Low Fuelwood1992 2006 2030 <strong>2060</strong> 2030 <strong>2060</strong> 2030 <strong>2060</strong> 2030 <strong>2060</strong>AFRICA 385835 593599 701913 1136946 468373 474802 461414 461605 603427 659620Egypt 14635 17059 37967 105943 27998 53116 22403 32768 17400 18652Nigeria 52854 61628 87065 137594 55595 49764 59776 59725 64160 69740South Africa 12609 12000 25152 64528 16258 24005 22801 52391 14057 17148NORTH/CENTRAL AMERICA 172042 131625 359046 1694285 303738 1320517 281122 1132446 139808 150294Canada 6227 2869 14293 114737 13010 92903 11082 66010 2953 3316Mexico 34918 38516 78882 194067 60174 106273 54677 85437 39308 40899United States of America 90452 44949 205517 1276662 186870 1070749 176209 939550 50700 56765SOUTH AMERICA 166209 192331 318148 673299 239628 344650 208271 257774 197120 205488Argentina 2872 4372 16911 85196 12503 44118 11243 35335 4679 4844Brazil 123251 138783 201735 322909 157362 182356 135590 133380 140890 146642Chile 9000 13488 19905 32809 13495 13517 11618 9866 13542 14045ASIA 790243 790676 1486215 4662336 866970 1727169 1152119 2504305 846462 902026China 196145 203510 429999 1053636 253936 320514 351141 676775 220920 231820India 283869 306331 526808 1027229 289151 264957 392849 538087 327066 350364Indonesia 115666 70718 128186 260601 75088 77586 102530 159581 76630 81368Japan 184 106 4017 351145 3670 285244 3023 187861 118 127Korea, Republic of 2611 2469 14793 137346 7259 27456 10285 60951 2515 2562Malaysia 3845 3025 12318 65785 6485 16091 9061 34157 3320 3434OCEANIA 9875 10915 29488 104306 24309 79725 21998 55230 13664 14942Australia 4021 5042 17613 75600 16357 65079 12883 38704 6020 6782New Zealand 50 1 3396 11338 3158 9879 2723 7148 1414 1590EUROPE 114722 153397 364106 1593968 265344 953840 271521 856294 163305 191523EU-25 42367 82300 208174 1132441 174397 808950 159009 631966 75841 84611Austria 3271 4977 8576 20425 7493 15301 7043 13262 4407 4741Finland 2895 5455 8877 16264 8019 12797 7086 9906 5613 5981France 9692 32682 58799 193232 53339 154308 44467 104523 23880 26263Germany 3836 8758 33417 224435 29402 171556 25325 125412 7493 8115Italy 5145 6703 24834 131345 21899 98438 19105 73791 6823 7337Russian Federation 63879 45800 98321 248860 56558 70830 71749 123689 60063 73551Spain 2433 1461 10129 83955 8789 60564 7905 48648 1992 2194Sweden 3788 6088 12103 27430 10659 20933 10076 18557 6420 6849United Kingdom 225 176 3007 166158 2723 131933 2372 98630 132 146DEVELOPED, ALL 228775 219234 639883 3687497 508318 2578852 504363 2230209 239768 278916DEVELOPING, ALL 1410152 1653310 2619033 6177644 1660044 2321849 1892082 3037445 1724019 1844979WORLD 1638927 1872543 3258916 9865141 2168362 4900701 2396445 5267654 1963787 21238941 Observations derived from FAO (2009), projections obtained with the <strong>Global</strong> Forest Products Model.78
Table 13—Observed and projected fuelwood net trade (thousand m 3 ) for world regions and selected countries in the<strong>Global</strong> Forest Products Model 1 Observed Scenario A1B Scenario A2 Scenario B2Scenario A1B-Low Fuelwood1992 2006 2030 <strong>2060</strong> 2030 <strong>2060</strong> 2030 <strong>2060</strong> 2030 <strong>2060</strong>AFRICA -8 2 -22124 137885 18087 137508 75914 192186 -142116 -271513Egypt -5 0 -37956 -105909 -27998 -53115 -22400 -32762 -17400 -18652Nigeria 0 1 -47538 -133642 -15303 -42829 -18211 -53750 -27048 -61607South Africa -9 0 -11080 -59797 -5904 -17591 -12046 -46253 -3357 -10006NORTH/CENTRAL AMERICA 2 94 7923 221624 -14381 -43588 6621 77377 10031 3446Canada 161 128 0 372114 -7310 35457 -4612 92684 1620 1818Mexico -8 5 0 -124768 -7273 -55480 0 -31113 8495 0United States of America -152 -35 -196 -46 -1657 -29099 -601 -526 562 10038SOUTH AMERICA 16 0 278957 2175234 102585 576349 184171 854061 147901 296522Argentina 0 0 633 -5659 -2531 -10496 0 0 3872 9635Brazil 0 0 229398 1895183 86755 449178 147027 653857 109704 212791Chile 16 0 28674 133588 14592 108135 20621 131503 14611 39089ASIA -44 -326 -416088 -3413247 -106748 -837568 -311396 -1595339 -115959 -283345China 0 -5 -79319 -693683 -14853 -35681 -82998 -391468 0 0India 1 -79 -222719 -928776 -39464 -103789 -123863 -391067 -80424 -181764Indonesia 0 1 -24538 -225503 0 -38946 -21913 -123372 -1610 -45722Japan -22 -1 -2962 -191596 -3399 -232073 -2714 -126106 98 246Korea, Republic of 0 0 2739 -57670 3463 21551 2381 -48 7950 18844Malaysia 7 -12 17037 91514 0 36963 0 32393 434 7963OCEANIA -1 -1 15626 77444 -2446 2180 3039 24861 5351 11512Australia -1 0 3465 58219 -4681 -9192 0 16273 3228 7349New Zealand 0 0 4411 0 -1018 0 0 0 263 0EUROPE -137 757 136466 801820 3663 165880 42411 447615 95553 244138EU-25 -272 -740 56980 -227761 -27638 -114468 6832 77903 54830 138217Austria -277 -272 2058 7246 0 15018 550 20747 1887 4271Finland -17 -165 3990 10740 18 57287 2179 50334 1963 5381France 108 516 19433 -103092 0 -33436 13146 8277 24163 31084Germany -41 -468 16026 -56781 -14594 -43737 -6484 0 4277 15270Italy -313 -1097 -4610 -72777 -8428 -63031 -3733 -35742 3940 7609Russian Federation 21 200 34774 760488 14008 136870 14102 203548 15792 26805Spain -133 146 -906 -37542 -2935 -30151 -1271 -15157 2690 4526Sweden 12 -188 1216 1 -763 0 0 1230 1407 3063United Kingdom 0 141 -1872 -164489 -1958 -130422 -1500 -97090 465 582DEVELOPED, ALL -166 844 128237 819806 -22541 -149956 19975 320671 98122 254136DEVELOPING, ALL -6 -318 -127477 -819047 23301 150716 -19215 -319912 -97362 -253376WORLD -172 526 760 760 760 760 760 760 760 7601 Observations derived from FAO (2009), projections obtained with the <strong>Global</strong> Forest Products Model.79
Table 14—Observed and projected industrial roundwood consumption (except energy wood) (thousand m 3 ) for worldregions and selected countries in the <strong>Global</strong> Forest Products Model 1Observed Scenario A1B Scenario A2 Scenario B2Scenario A1B-Low Fuelwood1992 2006 2030 <strong>2060</strong> 2030 <strong>2060</strong> 2030 <strong>2060</strong> 2030 <strong>2060</strong>AFRICA 52971 65082 65908 48101 61897 51787 63988 53110 68458 62163Egypt 223 321 4516 3734 3624 3112 3811 3458 4596 4190Nigeria 8258 8770 8695 5768 7610 5002 8287 6333 9044 7389South Africa 14455 17923 11660 5471 11058 5689 11218 7172 11863 7698NORTH/CENTRAL AMERICA 554822 602667 567997 357308 510785 212955 539576 280653 590147 444764Canada 165929 186345 182408 108805 160897 136851 162125 123611 166861 109436Mexico 7113 6296 7887 4008 11255 10824 8244 3385 8751 10338United States of America 378169 405418 372506 238842 334051 60224 364466 148127 409262 318677SOUTH AMERICA 111002 158217 155835 90991 146305 96523 147417 96844 165241 110503Argentina 7024 9466 9671 6544 8787 5158 8668 5734 10268 7500Brazil 78909 100681 109613 59571 103595 65317 104555 63686 118343 75002Chile 13166 33106 21295 11835 20492 12404 20424 12629 21370 12970ASIA 306059 321210 381658 424614 303524 339337 324668 358790 375046 462807China 100229 148261 185017 211081 146102 172242 155702 181930 184094 240757India 25630 27232 35145 36003 26833 24644 31214 30156 35330 37988Indonesia 42621 27534 23708 17656 19944 13183 21129 14090 24220 20384Japan 65900 38660 45947 50914 36809 45937 37431 42315 41218 48810Korea, Republic of 9431 10314 15278 21009 11006 12941 12124 15193 14033 18668Malaysia 27208 18407 12681 12741 10692 9853 11560 10298 12852 13277OCEANIA 21278 38081 35903 31691 34305 24205 34434 27022 35784 26860Australia 10248 21919 21704 12210 20899 12301 20840 11445 21718 14460New Zealand 10241 15589 13413 18809 12742 11327 12866 14959 13276 11681EUROPE 432219 492240 495197 383611 460390 449167 467174 398800 500742 418194EU-25Austria 14371 22815 16194 12209 13950 14496 14240 11533 14985 13868Finland 40966 59466 53870 29897 46373 36717 47918 30082 50213 36277France 30887 27498 32376 27325 31019 27566 30431 26584 31977 31447Germany 27893 51873 52821 48531 48163 47498 48444 49298 52820 60691Italy 9174 8622 10344 15832 8745 14537 7866 11573 9184 13556Russian Federation 153539 94219 70875 49949 65304 49210 64462 44901 71376 54761Spain 13811 17726 19829 18522 17595 18697 17541 16902 18627 20093Sweden 54408 62361 83121 46514 97115 104880 97900 73129 99139 44195United Kingdom 6263 7884 12847 20441 11024 19426 11052 18250 11262 18834DEVELOPED, ALL 1077553 1179684 1146285 822594 1039369 725147 1079127 750697 1168436 934272DEVELOPING, ALL 400799 497813 556213 513722 477837 448826 498129 464521 566982 591018WORLD 1478352 1677497 1702499 1336316 1517206 1173974 1577256 1215219 1735418 15252901 Observations derived from FAO (2009), projections obtained with the <strong>Global</strong> Forest Products Model.80
Table 15—Observed and projected industrial roundwood net trade (thousand m 3 ) for world regions and selected countriesin the <strong>Global</strong> Forest Products Model 1Observed Scenario A1B Scenario A2 Scenario B2Scenario A1B-Low Fuelwood1992 2006 2030 <strong>2060</strong> 2030 <strong>2060</strong> 2030 <strong>2060</strong> 2030 <strong>2060</strong>AFRICA 4026 3150 -19455 -14923 -12425 -15026 -14524 -19948 -15976 -25995Egypt -98 -116 -4511 -3729 -3622 -3109 -3809 -3456 -4593 -4186Nigeria 5 41 -4531 -4621 -2725 -3350 -3522 -4624 -3877 -4951South Africa 818 140 0 -1417 0 0 -329 -1808 0 -1213NORTH/CENTRAL AMERICA 22463 5519 5531 7449 -5940 -10747 -912 -2420 17673 98929Canada -2421 -1148 0 663 0 5 0 21 0 7004Mexico -68 -165 -2860 0 -7185 -7758 -4005 -97 -3881 -7213United States of America 24933 6717 9768 9730 2368 -655 4329 296 22944 102647SOUTH AMERICA 7248 2495 48819 12995 16551 89436 19706 39333 21203 65505Argentina 553 33 0 0 424 0 437 0 522 1Brazil 355 87 28027 574 1793 77884 4099 37488 2817 38796Chile 6191 111 21539 22 15349 12028 16280 14 19117 28527ASIA -38810 -51465 -156336 -233579 -87621 -154626 -107394 -182844 -134577 -247235China -7788 -33023 -98323 -131247 -66275 -98822 -75100 -108979 -97598 -166694India -723 -4040 -24694 -32580 -15883 -19005 -20543 -24993 -23339 -31832Indonesia 490 565 -1586 -9294 0 -3765 -1124 -5108 -1688 -10574Japan -38786 -10550 0 0 0 0 0 0 0 0Korea, Republic of -8308 -6367 -5431 0 -2835 0 -3537 0 -5106 -5567Malaysia 17830 4771 0 122 12705 3 11282 13 16534 11432OCEANIA 13907 9650 -329 282 4733 -181 4624 -169 5424 -274Australia 6406 1063 0 460 0 0 179 17 487 1New Zealand 4774 5568 0 0 2924 0 2639 0 2917 0EUROPE -937 31018 119986 225991 82916 89358 96715 164262 104467 107285EU-25 -11623 -23166 28948 202351 20268 -7924 23855 75847 24589 43374Austria -4516 -8384 0 28809 0 4 0 17 0 0Finland -5361 -13946 0 77974 0 1267 0 15964 0 6136France 1697 1094 4864 0 3432 0 4612 11 4883 0Germany 5165 3888 0 0 17720 0 16905 0 17463 5787Italy -5649 -4471 -4878 -1660 -3921 -5453 -2896 -1813 -4151 -8603Russian Federation 10461 50384 83810 2304 49339 93578 58827 80633 64673 59666Spain -2187 -3617 0 0 0 0 0 0 0 -296Sweden -4688 -3660 0 93223 -26052 0 -25379 31675 -24331 7810United Kingdom -72 229 0 -1174 0 -1347 0 0 0 -7871DEVELOPED, ALL -5493 32158 125813 207740 86517 76272 101414 145740 128271 211298DEVELOPING, ALL 13390 -31790 -127598 -209525 -88302 -78057 -103199 -147525 -130056 -213083WORLD 7897 368 -1785 -1785 -1785 -1785 -1785 -1785 -1785 -17851 Observations derived from FAO (2009), projections obtained with the <strong>Global</strong> Forest Products Model.81
Table 16—Observed and projected sawnwood consumption (thousand m 3 ) for world regions and selected countries in the<strong>Global</strong> Forest Products Model 1 Observed Scenario A1B Scenario A2 Scenario B2Scenario A1B-Low Fuelwood1992 2006 2030 <strong>2060</strong> 2030 <strong>2060</strong> 2030 <strong>2060</strong> 2030 <strong>2060</strong>AFRICA 10452 12638 16671 19805 14050 16057 15204 19252 16823 21589Egypt 1633 1465 2055 2463 1756 2101 1825 2291 2075 2724Nigeria 2675 1979 2827 3596 2373 2876 2615 3655 2853 3931South Africa 2254 2515 3046 3240 2584 2611 2930 3365 3090 3557NORTH/CENTRAL AMERICA 118741 159609 168456 162902 164431 161674 162201 153425 170224 179840Canada 12543 21271 22093 21212 21662 20991 21563 20109 22215 22968Mexico 2675 6779 7825 8223 6622 6785 6876 7469 7874 8866United States of America 101286 128405 135263 129913 133317 130816 130796 122403 136840 144176SOUTH AMERICA 25256 32503 37260 39109 31869 33064 33022 36153 37527 42319Argentina 1663 1833 1811 1850 1547 1547 1595 1682 1827 2010Brazil 18137 20764 24524 25669 20822 21319 21511 23167 24702 27790Chile 2181 5377 6152 6344 5376 5632 5634 6300 6198 6871ASIA 106710 101150 122794 134483 105880 112497 113497 121030 123361 144479China 21336 32438 36548 40195 30765 33867 33487 35930 36719 43122India 17472 14943 20848 25158 16744 18621 19057 22308 20949 27079Indonesia 7683 2610 3623 4143 2949 3161 3233 3470 3640 4447Japan 36566 21042 21443 19963 20973 19493 20692 18578 21521 21440Korea, Republic of 4338 5155 6163 5947 5026 4504 5603 5122 6190 6367Malaysia 3994 3525 4085 4175 3399 3326 3720 3645 4109 4499OCEANIA 6209 7641 8550 8366 8397 8325 8422 7979 8618 9034Australia 4187 5010 5472 5358 5408 5353 5376 5057 5521 5795New Zealand 1648 2324 2649 2576 2630 2625 2651 2534 2664 2769EUROPE 134916 120144 126706 122519 118162 113979 120461 116084 127437 131877EU-25 74241 102783 105068 100253 99982 95107 100790 95173 105658 107795Austria 3821 5499 5272 4863 5165 4752 5162 4710 5291 5242Finland 2797 5077 5397 4915 5314 4877 5302 4849 5418 5327France 11429 12426 12638 11987 12411 11821 12195 11364 12699 12963Germany 17540 20851 19348 18010 18988 17622 18832 17050 19463 19460Italy 8215 9441 9114 8490 8934 8253 8831 7949 9173 9081Russian Federation 47368 6242 9287 9756 7432 7944 8140 8755 9361 10567Spain 4378 7062 7126 6799 6996 6671 6923 6455 7159 7282Sweden 4028 5467 6029 5502 5944 5406 6028 5525 6073 5974United Kingdom 9208 10455 11117 10702 10919 10531 10764 10153 11189 11472DEVELOPED, ALL 293914 302904 319198 307594 306785 298183 306761 290853 321832 335609DEVELOPING, ALL 108370 130781 161240 179590 136004 147413 146045 163070 162158 193529WORLD 402283 433685 480437 487184 442789 445595 452807 453922 483990 5291381 Observations derived from FAO (2009), projections obtained with the <strong>Global</strong> Forest Products Model.82
Table 17—Observed and projected sawnwood net trade (thousand m 3 ) for world region and selected countries in the<strong>Global</strong> Forest Products Model 1 Observed Scenario A1B Scenario A2 Scenario B2Scenario A1B-Low Fuelwood1992 2006 2030 <strong>2060</strong> 2030 <strong>2060</strong> 2030 <strong>2060</strong> 2030 <strong>2060</strong>AFRICA -2354 -3424 -2265 -850 -599 6072 -1547 1021 -1908 2274Egypt -1633 -1463 -440 -95 -440 -95 -440 -95 -440 -95Nigeria 40 21 6 1 6 10 6 4 6 10South Africa -436 -424 -1357 -1189 -416 -59 -1198 -419 -1357 -379NORTH/CENTRAL AMERICA 11004 -2770 -2082 -12182 -15239 -99824 -1556 -34477 -3953 -3068Canada 27595 37438 16513 3545 12899 12842 13173 2828 14042 3015Mexico 21 -4129 -6050 -7879 -1996 -594 -4333 -7119 -5677 -4201United States of America -16136 -35501 -12029 -7501 -25743 -111915 -9945 -29840 -11817 -1572SOUTH AMERICA 1449 6983 2194 1162 2463 3565 2398 2196 2198 1527Argentina -191 270 69 15 69 15 69 15 69 15Brazil 491 3033 945 203 945 566 945 203 945 203Chile 839 3341 875 188 930 904 918 197 875 188ASIA -9492 -21081 -11690 -6528 -14093 -5173 -21409 -8558 -15173 -7678China -1580 -6662 -2518 -829 -3597 -772 -10628 -2513 -5213 -1237India -12 -154 -26 -6 -26 -6 -26 -6 -26 -6Indonesia 755 1623 506 109 506 109 506 99 506 109Japan -9289 -8488 -2756 -590 -4086 -875 -4098 -880 -3047 -654Korea, Republic of -825 -789 -232 -49 -232 -48 -232 -50 -232 -50Malaysia 5375 1604 550 764 550 764 550 238 550 118OCEANIA -303 1631 390 556 392 433 392 304 389 229Australia -1146 -226 -133 -103 -133 -29 -133 -29 -133 -29New Zealand 896 1910 523 514 523 310 523 187 523 112EUROPE -797 25547 17523 21914 31147 99000 25793 43587 22518 10787EU-25 -7605 5057 11695 20199 19123 86695 18401 41947 16955 9749Austria 3199 5008 2029 2302 1635 2277 1635 351 1635 351Finland 4533 7150 2217 476 2121 5904 2121 455 2121 455France -941 -2434 -732 -157 -732 -98 -732 -98 -732 -157Germany -4044 3569 720 1785 720 959 720 155 720 155Italy -6392 -7693 -6808 -2699 -7514 -2820 -7699 -4962 -7568 -5895Russian Federation 6002 15884 4411 947 9728 9374 6085 1306 4424 950Spain -1910 -3256 -2283 -479 -3452 -730 -3410 -732 -3139 -855Sweden 8100 12833 27581 24090 38050 84361 38050 53535 36674 26615United Kingdom -7113 -7548 -6233 -1513 -7547 -2541 -7221 -2086 -7430 -5130DEVELOPED, ALL 173 18388 16648 15000 12864 -1543 22657 14009 19083 9904DEVELOPING, ALL -667 -11502 -12577 -10928 -8793 5616 -18586 -9937 -15013 -5832WORLD -494 6886 4071 4072 4071 4072 4071 4072 4071 40721 Observations derived from FAO (2009), projections obtained with the <strong>Global</strong> Forest Products Model.83
Table 18—Observed and projected veneer and plywood prices (1997$/m 3 ) for selected countries in the <strong>Global</strong> ForestProducts Model 1 Observed Scenario A1B Scenario A2 Scenario B2Scenario A1B-Low FuelwoodAFRICANORTH/CENTRAL AMERICA1992 2006 2030 <strong>2060</strong> 2030 <strong>2060</strong> 2030 <strong>2060</strong> 2030 <strong>2060</strong>Egypt 545 571 488 621 441 452 447 462 456 386Nigeria 524 422 408 565 353 381 360 393 371 310South Africa 461 483 452 665 425 488 428 498 429 416Canada 403 422 395 594 370 430 372 438 373 364Mexico 444 465 431 631 393 458 398 468 405 390United States of America 436 457 428 688 405 462 404 472 391 365SOUTH AMERICAArgentina 465 487 424 569 376 406 381 406 389 331Brazil 403 422 395 594 358 430 363 438 370 363Chile 403 422 404 594 370 430 374 439 381 366ASIAChina 469 422 418 618 394 451 398 460 403 385India 403 422 419 604 394 448 398 457 403 388Indonesia 403 422 428 616 400 448 407 457 412 383Japan 448 470 440 606 413 446 416 454 417 405Korea, Republic of 465 487 456 588 429 429 432 448 433 397Malaysia 403 422 411 610 381 433 385 443 389 364OCEANIAAustralia 440 461 431 595 387 444 389 440 397 368New Zealand 403 422 410 601 389 436 391 443 394 378EUROPEEU-25Austria 403 422 391 641 366 429 369 438 373 343Finland 403 422 394 594 370 430 372 438 373 363France 448 470 438 605 409 442 412 440 417 370Germany 448 470 440 652 413 462 416 462 417 372Italy 448 470 440 609 413 462 416 463 417 405Russian Federation 403 422 410 595 381 432 385 441 391 368Spain 448 470 436 667 408 449 408 461 417 373Sweden 448 470 440 594 413 441 416 440 417 376United Kingdom 448 470 440 648 413 475 416 485 417 405DEVELOPED, ALLDEVELOPING, ALLWORLD 491 442 395 594 370 430 372 438 373 3631 Observations derived from FAO (2009), projections obtained with the <strong>Global</strong> Forest Products Model.84
Table 19—Observed and projected particleboard prices (1997$/m 3 ) for selected countries in the <strong>Global</strong> Forest ProductsModel 1 Observed Scenario A1B Scenario A2 Scenario B2Scenario A1B-Low FuelwoodAFRICANORTH/CENTRAL AMERICA1992 2006 2030 <strong>2060</strong> 2030 <strong>2060</strong> 2030 <strong>2060</strong> 2030 <strong>2060</strong>Egypt 235 319 300 415 270 271 274 280 280 215Nigeria 235 304 353 446 317 289 322 299 329 228South Africa 235 284 330 469 286 284 304 301 294 229Canada 235 236 235 402 219 253 220 261 222 192Mexico 268 270 269 439 253 281 253 294 256 222United States of America 246 248 249 486 232 323 232 322 219 192SOUTH AMERICAArgentina 276 236 249 404 223 265 226 264 231 201Brazil 235 236 263 415 239 276 243 284 247 221Chile 235 236 240 388 217 251 220 259 223 195ASIAChina 283 284 275 408 258 269 261 276 264 214India 235 319 300 407 278 268 283 276 287 214Indonesia 235 257 260 401 241 262 246 270 250 208Japan 259 260 258 400 241 262 242 269 247 208Korea, Republic of 264 265 265 402 248 253 248 271 251 218Malaysia 235 236 239 393 221 255 223 262 226 197OCEANIAAustralia 256 257 258 391 227 262 229 259 234 198New Zealand 235 236 242 397 224 257 226 263 229 207EUROPEEU-25Austria 235 236 235 392 222 254 223 261 226 200Finland 235 236 235 393 219 255 222 262 227 199France 235 236 244 423 224 269 226 267 230 199Germany 264 236 242 400 224 262 226 264 229 198Italy 264 265 262 407 247 268 248 276 251 213Russian Federation 235 294 279 391 255 253 259 260 263 198Spain 266 267 260 400 247 262 246 269 251 213Sweden 264 236 259 386 235 256 238 255 243 193United Kingdom 264 265 265 421 248 272 248 279 251 216DEVELOPED, ALLDEVELOPING, ALLWORLD 278 260 235 402 219 310 220 309 222 1921 Observations derived from FAO (2009), projections obtained with the <strong>Global</strong> Forest Products Model.85
Table 20—Observed and projected fiberboard prices (1997$/m 3 ) for selected countries in the <strong>Global</strong> Forest ProductsModel 1 Observed Scenario A1B Scenario A2 Scenario B2Scenario A1B-Low FuelwoodAFRICANORTH/CENTRAL AMERICA1992 2006 2030 <strong>2060</strong> 2030 <strong>2060</strong> 2030 <strong>2060</strong> 2030 <strong>2060</strong>Egypt 376 455 397 501 364 357 369 366 376 301Nigeria 391 474 426 600 404 436 406 447 413 370South Africa 301 421 379 538 358 389 360 398 366 328Canada 301 364 328 476 308 337 310 346 315 282Mexico 313 379 342 490 322 351 324 360 329 296United States of America 301 383 343 555 325 355 327 404 316 280SOUTH AMERICAArgentina 301 364 335 484 308 345 310 346 315 282Brazil 301 364 334 476 308 337 310 346 315 283Chile 301 364 333 476 309 338 312 346 317 283ASIAChina 360 364 352 475 336 336 338 344 342 282India 301 493 406 490 384 352 388 360 392 298Indonesia 301 364 343 490 324 352 329 359 333 298Japan 322 390 346 483 331 345 331 353 337 292Korea, Republic of 338 409 360 485 343 337 346 354 350 298Malaysia 376 364 333 476 314 337 316 346 320 284OCEANIAAustralia 329 364 335 476 308 347 310 345 315 282New Zealand 301 364 328 478 311 340 313 346 315 291EUROPEEU-25Austria 301 364 326 524 308 342 310 352 315 280Finland 301 409 349 474 332 336 335 344 340 282France 301 364 332 484 311 346 314 346 318 285Germany 338 364 330 483 313 346 315 348 318 283Italy 338 409 358 491 343 352 344 359 348 297Russian Federation 301 455 381 475 358 338 361 345 366 283Spain 301 409 333 494 319 349 319 356 324 298Sweden 338 409 363 474 340 344 343 343 348 281United Kingdom 338 409 367 512 345 356 345 364 351 295DEVELOPED, ALLDEVELOPING, ALLWORLD 366 328 328 476 308 337 310 346 315 2821 Observations derived from FAO (2009), projections obtained with the <strong>Global</strong> Forest Products Model.86
Table 21—Observed and projected veneer and plywood consumption (thousand m 3 ) for world regions and selectedcountries in the <strong>Global</strong> Forest Products Model 1Observed Scenario A1B Scenario A2 Scenario B2Scenario A1B-Low Fuelwood1992 2006 2030 <strong>2060</strong> 2030 <strong>2060</strong> 2030 <strong>2060</strong> 2030 <strong>2060</strong>AFRICA 930 737 1168 1521 849 1024 980 1440 1188 1765Egypt 157 145 249 328 187 239 200 281 254 377Nigeria 75 55 102 146 75 97 89 151 105 172South Africa 84 96 102 102 74 67 95 108 104 117NORTH/CENTRAL AMERICA 19864 22723 23263 19962 22372 20400 21759 18336 23834 24047Canada 2020 1987 1879 1589 1821 1565 1803 1443 1910 1841Mexico 337 944 1168 1165 866 817 925 982 1188 1346United States of America 17305 19552 19898 16882 19443 17772 18767 15609 20412 20484SOUTH AMERICA 1825 643 1657 1657 1254 1230 1339 1456 1689 1923Argentina 101 107 117 115 88 83 93 97 120 134Brazil 1088 184 877 866 652 614 692 718 894 1003Chile 55 125 237 230 186 185 203 227 242 266ASIA 21274 37242 54105 56306 40726 41060 46528 46041 54761 64665China 5469 20987 34078 36410 24866 26754 29067 29859 34460 41993India 239 2108 3672 4612 2450 2638 3116 3693 3713 5270Indonesia 386 817 1520 1774 1041 1084 1234 1288 1537 2046Japan 9917 8348 7399 5924 7138 5708 6951 5216 7513 6685Korea, Republic of 1871 1798 2463 2140 1695 1276 2073 1621 2501 2404Malaysia 849 550 823 774 588 515 695 609 836 904OCEANIA 356 745 723 629 705 631 709 583 736 725Australia 217 370 372 325 367 325 363 293 381 375New Zealand 65 352 323 279 319 291 323 272 326 321EUROPE 8702 8707 9075 7964 7906 6908 8202 7232 9205 9214EU-25 6864 7063 6995 5921 6460 5457 6505 5462 7097 6855Austria 140 7 41 31 40 31 40 30 42 38Finland 136 272 217 166 211 164 211 162 220 193France 768 651 610 510 594 499 574 463 619 590Germany 1726 1228 1109 880 1074 861 1058 811 1127 1042Italy 1165 671 716 573 692 543 676 512 727 648Russian Federation 1141 1083 1435 1443 947 987 1122 1182 1455 1666Spain 179 501 472 383 460 383 451 359 478 457Sweden 164 237 215 171 209 166 215 173 219 196United Kingdom 1420 1360 1345 1123 1304 1098 1268 1025 1366 1293DEVELOPED, ALL 38406 39686 39542 33593 37406 32996 36902 30642 40349 39642DEVELOPING, ALL 14546 31111 50450 54446 36405 38257 42615 44445 51063 62698WORLD 52952 70797 89992 88039 73811 71253 79517 75087 91413 1023401 Observations derived from FAO (2009), projections obtained with the <strong>Global</strong> Forest Products Model.87
Table 22—Observed and projected particleboard consumption (thousand m 3 ) by world region and country in the<strong>Global</strong> Forest Products Model 1 Observed Scenario A1B Scenario A2 Scenario B2Scenario A1B-Low Fuelwood1992 2006 2030 <strong>2060</strong> 2030 <strong>2060</strong> 2030 <strong>2060</strong> 2030 <strong>2060</strong>AFRICA 613 1146 1965 3167 1290 1856 1613 3006 2012 3880Egypt 41 15 31 52 21 34 23 43 31 63Nigeria 40 42 106 213 68 122 87 220 108 259South Africa 277 582 790 970 528 572 718 1068 817 1201NORTH/CENTRAL AMERICA 17374 36049 40900 38493 39396 39533 37750 34031 42325 51072Canada 1667 3625 3420 3242 3266 3223 3231 2892 3476 4061Mexico 440 176 410 486 272 308 298 390 416 597United States of America 15160 32112 36807 34414 35677 35767 34019 30439 38164 45986SOUTH AMERICA 1370 4331 6738 8254 4607 5499 5007 6796 6870 10004Argentina 188 421 632 706 430 459 463 563 646 872Brazil 634 2372 3826 4567 2564 2892 2776 3549 3896 5518Chile 210 497 707 807 509 608 571 800 722 993ASIA 5384 18245 31739 41755 22510 29784 26161 33559 32109 50695China 1383 9222 17024 22823 11185 15211 13744 17578 17215 27678India 58 101 227 383 133 184 182 287 230 462Indonesia 228 207 471 694 285 363 357 456 476 845Japan 1288 1691 1730 1520 1642 1457 1587 1294 1752 1852Korea, Republic of 727 1731 2691 2579 1635 1326 2138 1812 2731 3101Malaysia 119 0 28 30 18 18 22 22 28 37OCEANIA 741 1178 1435 1426 1394 1425 1384 1256 1473 1745Australia 646 1034 1241 1236 1216 1242 1198 1082 1277 1514New Zealand 92 137 157 154 155 164 158 150 160 188EUROPE 30988 46375 58468 59764 46153 46526 50344 53187 59292 72281EU-25 23743 36838 44287 42319 37645 35555 39490 38099 44899 50915Austria 877 930 940 809 896 777 895 759 950 994Finland 273 270 281 237 271 234 270 231 284 291France 2641 3110 3611 3242 3481 3206 3330 2912 3673 4079Germany 8279 9196 9456 8299 9050 7996 8872 7373 9609 10278Italy 2652 3781 3936 3466 3738 3287 3631 3020 3985 4211Russian Federation 4507 5209 8154 10202 4703 6204 5882 7862 8287 12447Spain 1912 3548 3864 3618 3694 3507 3601 3233 3901 4374Sweden 598 463 774 676 748 654 774 689 788 831United Kingdom 2829 3555 4058 3837 3879 3767 3746 3441 4119 4697DEVELOPED, ALL 50205 86471 104407 103807 89684 90480 92686 92529 106760 130169DEVELOPING, ALL 6265 20853 36838 49052 25665 34141 29573 39305 37321 59508WORLD 56470 107324 141245 152858 115349 124622 122259 131834 144081 1896771 Observations derived from FAO (2009), projections obtained with the <strong>Global</strong> Forest Products Model.88
Table 23—Observed and projected fiberboard consumption (thousand m 3 ) for world regions and selected countries in the<strong>Global</strong> Forest Products Model 1 Observed Scenario A1B Scenario A2 Scenario B2Scenario A1B-Low Fuelwood1992 2006 2030 <strong>2060</strong> 2030 <strong>2060</strong> 2030 <strong>2060</strong> 2030 <strong>2060</strong>AFRICA 177 907 1357 1817 1051 1435 1186 1843 1380 2298Egypt 5 232 381 548 301 451 319 516 390 692Nigeria 16 40 87 131 66 98 77 142 89 165South Africa 49 320 374 414 288 312 354 466 380 523NORTH/CENTRAL AMERICA 7188 12909 14807 13993 14338 15746 14018 13865 15307 19211Canada 545 1349 1358 1303 1338 1397 1326 1295 1382 1673Mexico 42 916 1159 1280 901 1022 954 1189 1178 1627United States of America 6498 10408 11919 10990 11799 12964 11417 10948 12366 15370SOUTH AMERICA 645 3577 4194 4637 3340 3882 3532 4465 4297 5921Argentina 84 234 399 422 317 346 332 394 411 546Brazil 416 1921 2451 2710 1927 2192 2027 2488 2516 3468Chile 98 624 658 710 541 639 581 759 673 908ASIA 4063 33880 52872 62871 41398 52909 46528 57711 53600 80370China 1752 23962 37934 45859 29183 38323 33314 41888 38453 58647India 47 276 469 684 336 459 411 608 477 859Indonesia 8 33 230 290 168 206 194 237 233 367Japan 1055 936 1533 1398 1493 1471 1462 1356 1551 1778Korea, Republic of 415 2068 2935 2872 2146 2028 2545 2458 2974 3613Malaysia 20 1401 2221 2344 1681 1787 1936 2053 2262 3001OCEANIA 268 747 847 827 842 895 842 832 868 1056Australia 100 533 571 558 572 603 566 551 587 715New Zealand 157 199 250 242 250 272 253 256 254 308EUROPE 5686 18080 20735 21020 18180 19710 19122 21212 21071 26956EU-25 3453 14743 16259 15918 14879 15580 15299 16231 16517 20431Austria 67 575 480 408 472 450 471 439 487 553Finland 101 248 253 231 250 248 248 245 256 295France 257 937 903 837 893 892 867 838 921 1078Germany 729 3789 3625 3271 3559 3451 3510 3270 3691 4226Italy 261 1537 1648 1520 1608 1587 1576 1496 1671 1927Russian Federation 1518 1672 2319 2754 1641 2152 1895 2498 2360 3495Spain 335 1401 1180 1087 1158 1161 1139 1096 1195 1387Sweden 174 299 367 342 363 359 370 372 374 436United Kingdom 493 1706 1874 1803 1848 1944 1807 1825 1912 2340DEVELOPED, ALL 14198 32193 37328 36650 34345 37295 35005 36819 38191 48240DEVELOPING, ALL 3829 37907 57483 68515 44803 57282 50223 63108 58333 87570WORLD 18027 70100 94811 105165 79148 94577 85228 99927 96524 1358111 Observations derived from FAO (2009), projections obtained with the <strong>Global</strong> Forest Products Model.89
Table 24—Observed and projected veneer and plywood net trade (thousand m 3 ) for world regions and selected countriesin the <strong>Global</strong> Forest Products Model 1Observed Scenario A1B Scenario A2 Scenario B2Scenario A1B-Low Fuelwood1992 2006 2030 <strong>2060</strong> 2030 <strong>2060</strong> 2030 <strong>2060</strong> 2030 <strong>2060</strong>AFRICA -82 33 288 1051 606 1308 532 1194 305 1020Egypt -122 -120 -35 -7 -35 -7 -35 -7 -35 -7Nigeria -3 0 0 0 0 0 0 0 0 0South Africa -37 -58 -102 -101 -74 -66 -95 -107 -104 -116NORTH/CENTRAL AMERICA -57 -6635 -2648 -1127 -5736 -17115 -4104 -12640 -372 -366Canada 319 265 3295 2455 2583 902 2920 3253 1883 380Mexico -167 -810 -200 -54 -193 -39 -192 -39 -200 -40United States of America -106 -5901 -5487 -3260 -7933 -17772 -6623 -15609 -1795 -385SOUTH AMERICA 450 3646 8173 2803 10254 15144 10028 11569 9840 10106Argentina -30 -16 -1 0 -1 1 -1 2 -1 5Brazil 446 2860 7631 1843 9320 13889 9320 10250 9320 9478Chile 30 679 260 59 598 129 390 79 262 53ASIA 3135 7344 -3322 -2014 -3613 -2671 -4048 -2673 -5871 -7690China -3342 7112 1302 262 1302 262 1302 262 1302 262India 10 22 9 2 9 2 9 2 9 2Indonesia 9769 2995 1163 234 1135 229 1162 234 1164 235Japan -3689 -5034 -4042 -815 -4819 -1629 -4646 -1370 -5755 -4743Korea, Republic of -923 -1285 -1140 -227 -1006 -311 -1398 -373 -1727 -1148Malaysia 2451 4883 1348 272 1329 268 1337 269 1348 272OCEANIA -45 -183 -50 -42 -42 -18 -45 -18 -51 -40Australia -81 -225 -56 -44 -56 -11 -56 -11 -56 -11New Zealand 44 52 24 19 24 3 24 5 24 -9EUROPE -2877 -1282 -863 907 109 4928 -786 4145 -2276 -1453EU-25 -3050 -2866 -1499 -203 -587 3609 -1464 2800 -2899 -2256Austria 35 171 206 72 287 1505 218 1090 144 717Finland 347 1143 1404 1376 2269 3382 1464 2479 711 158France -226 -220 -60 -28 -61 -12 -60 -12 -75 -38Germany -878 -993 -627 -236 -704 -338 -713 -186 -778 -400Italy -255 -337 -309 -66 -494 -304 -486 -212 -516 -602Russian Federation 219 1531 404 81 441 89 439 89 404 81Spain -9 -33 -8 -32 -7 -2 -7 -2 -68 -55Sweden -96 -145 -81 -16 -47 -23 -70 -19 -117 -89United Kingdom -1413 -1360 -1345 -1123 -1304 -1098 -1268 -1025 -1366 -1293DEVELOPED, ALL -6414 -12341 -7517 -1140 -10360 -13860 -9509 -9998 -8368 -6695DEVELOPING, ALL 6938 15264 9093 2717 11937 15437 11087 11576 9944 8273WORLD 524 2923 1577 1577 1577 1576 1577 1578 1577 15781 Observations derived from FAO (2009), projections obtained with the <strong>Global</strong> Forest Products Model.90
Table 25—Observed and projected particleboard net trade (thousand m 3 ) for world regions and selected countries in the<strong>Global</strong> Forest Products Model 1 Observed Scenario A1B Scenario A2 Scenario B2Scenario A1B-Low Fuelwood1992 2006 2030 <strong>2060</strong> 2030 <strong>2060</strong> 2030 <strong>2060</strong> 2030 <strong>2060</strong>AFRICA -2 -196 -429 -1060 -350 -208 -374 -429 -435 -456Egypt 0 -9 -1 0 -1 0 -1 0 -1 0Nigeria 0 -2 -10 -19 -10 -5 -10 -9 -10 -9South Africa 19 -60 -192 -798 -192 -124 -192 -281 -192 -246NORTH/CENTRAL AMERICA 402 -943 6512 3743 3679 -1217 5980 917 8661 10662Canada 1890 8909 15960 12844 13897 33957 11238 27504 11821 10843Mexico -26 -76 -384 -253 -219 -47 -266 -134 -388 -578United States of America -1453 -9737 -8918 -8683 -9902 -35029 -4882 -26314 -2622 659SOUTH AMERICA 21 198 -92 -171 366 1016 288 807 -62 -139Argentina -10 164 29 12 29 31 29 23 29 12Brazil 26 128 4 5 4 11 4 11 4 5Chile 24 25 47 37 439 1076 370 910 76 79ASIA -667 -1439 -3968 -1648 -2304 -433 -3589 -1009 -4829 -3030China -141 -706 -167 -11 -168 0 -163 1 -167 -11India 2 -77 -34 -4 -20 -2 -29 -3 -34 -4Indonesia 122 -82 -66 -12 -17 6 -70 -10 -57 -49Japan -125 -446 -326 -36 -370 -40 -395 -44 -698 -88Korea, Republic of -451 -954 -1551 -272 -799 -114 -1464 -255 -1885 -1434Malaysia 31 453 91 132 76 142 77 132 84 43OCEANIA 63 62 -33 -26 -10 10 -15 6 -22 -34Australia -4 -32 -17 -18 -7 3 -7 3 -7 0New Zealand 70 101 21 28 20 27 20 28 21 9EUROPE -1879 3595 -1240 -89 -630 1582 -1542 459 -2563 -6252EU-25 -2302 4539 -609 416 -292 1448 -999 730 -1827 -5364Austria 729 1495 442 909 280 663 280 678 284 132Finland 81 170 30 38 43 128 30 96 30 15France 27 1650 221 127 221 337 221 337 221 127Germany -828 1644 294 758 294 553 294 758 294 204Italy -387 -56 -37 18 -171 47 -638 -28 -307 -39Russian Federation 15 -492 -66 13 -66 34 -66 22 -66 6Spain -232 -232 -50 39 -97 53 -154 27 -50 15Sweden -17 78 -45 26 -45 39 -45 39 -45 9United Kingdom -1092 -929 -982 -105 -944 -109 -804 -73 -1468 -1311DEVELOPED, ALL -1511 1634 4071 2208 2132 11 3255 710 4529 4017DEVELOPING, ALL -551 -357 -3321 -1458 -1381 740 -2506 41 -3779 -3267WORLD -2062 1277 750 750 750 750 750 751 750 7501 Observations derived from FAO (2009), projections obtained with the <strong>Global</strong> Forest Products Model.91
Table 26—Observed and projected fiberboard net trade (thousand m 3 ) for world regions and selected countries in the<strong>Global</strong> Forest Products Model 1 Observed Scenario A1B Scenario A2 Scenario B2Scenario A1B-Low Fuelwood1992 2006 2030 <strong>2060</strong> 2030 <strong>2060</strong> 2030 <strong>2060</strong> 2030 <strong>2060</strong>AFRICA -83 -662 -912 -962 -675 -715 -790 -1000 -914 -1207Egypt -2 -214 -104 -16 -72 -11 -78 -12 -102 -16Nigeria -16 -40 -87 -131 -66 -98 -77 -142 -89 -165South Africa 8 -162 -374 -413 -288 -311 -354 -466 -380 -522NORTH/CENTRAL AMERICA 403 -2785 142 949 -3996 -12433 -998 -3146 -53 106Canada 127 598 2244 3000 784 1744 1058 3173 2015 1363Mexico -7 -762 -1066 -1279 -727 -1000 -811 -1182 -1028 -1598United States of America 301 -2475 -817 -523 -3877 -12964 -1056 -4884 -817 655SOUTH AMERICA 350 1249 603 15 2729 1284 1934 455 1184 514Argentina 12 421 303 47 759 128 562 114 490 290Brazil 282 373 254 43 1775 1186 1252 381 650 310Chile 73 512 184 29 282 44 216 45 199 31ASIA -834 -32 -2911 -2796 -2491 -2592 -2627 -2901 -2988 -4091China -270 740 -49 138 -49 44 -49 44 -49 44India 1 -146 -23 -4 -23 -4 -23 -4 -23 -4Indonesia 45 394 79 12 75 12 77 12 80 13Japan -126 -41 -162 -25 -336 -53 -274 -43 -176 -27Korea, Republic of -61 -420 -88 -14 -91 -10 -91 -14 -88 -14Malaysia -10 1223 281 387 246 78 256 140 278 43OCEANIA 360 1002 667 434 382 43 502 104 894 671Australia -1 309 302 83 181 28 293 92 549 646New Zealand 372 708 391 378 222 35 233 36 371 58EUROPE -55 1121 1742 1692 3382 13744 1310 5819 1208 3338EU-25 -106 1458 1261 1205 2920 11844 1081 4373 930 3220Austria 26 406 328 79 181 548 201 294 267 1601Finland 0 -118 -19 -1 -19 -1 -19 -1 -19 -1France 168 453 185 29 162 25 161 66 195 31Germany -141 2144 977 829 524 82 597 199 859 134Italy -11 -326 -82 -13 -83 -13 -82 -13 -82 -13Russian Federation 47 -220 -32 6 -32 -5 -32 6 -32 -5Spain 65 -103 52 8 52 8 52 8 52 8Sweden -11 -145 -43 -5 -43 -7 -44 -5 -43 -5United Kingdom -337 -834 -221 -35 -217 -34 -222 -35 -221 -35DEVELOPED, ALL 528 -287 2931 3848 -220 1953 868 3379 2367 5082DEVELOPING, ALL -387 180 -3600 -4517 -448 -2622 -1537 -4048 -3036 -5751WORLD 141 -107 -669 -669 -668 -669 -669 -669 -669 -6691 Observations derived from FAO (2009), projections obtained with the <strong>Global</strong> Forest Products Model.92
Table 27—Observed and projected mechanical pulp prices (1997$/mt) for selected countries in the <strong>Global</strong> Forest ProductsModel 1 Observed Scenario A1B Scenario A2 Scenario B2Scenario A1B-Low Fuelwood1992 2006 2030 <strong>2060</strong> 2030 <strong>2060</strong> 2030 <strong>2060</strong> 2030 <strong>2060</strong>AFRICAEgypt 337 442 378 680 331 396 337 412 345 289Nigeria 330 463 397 719 379 428 394 443 403 326South Africa 337 390 436 736 375 419 400 448 385 309NORTH/CENTRAL AMERICACanada 337 390 343 633 318 361 320 376 324 255Mexico 382 442 403 703 366 417 371 431 378 302United States of America 364 421 360 792 337 512 336 501 318 250SOUTH AMERICAArgentina 390 390 358 628 313 357 318 355 325 230Brazil 337 451 376 657 337 386 342 401 349 278Chile 337 455 379 632 346 361 349 376 355 254ASIAChina 364 421 371 671 345 397 348 412 354 288India 364 1155 368 675 342 398 345 412 349 301Indonesia 364 421 368 665 342 394 346 409 352 287Japan 364 421 358 654 332 383 334 398 344 277Korea, Republic of 364 421 362 656 338 365 342 399 347 288Malaysia 337 421 363 643 331 370 336 386 343 265OCEANIAAustralia 337 421 381 636 335 385 337 379 344 258New Zealand 337 390 339 646 313 369 316 383 320 272EUROPEEU-25Austria 364 421 360 758 332 403 335 422 342 266Finland 337 390 342 631 314 362 319 376 328 255France 364 421 366 654 333 383 337 380 343 261Germany 364 421 354 702 325 402 329 407 333 264Italy 364 421 362 669 340 396 342 411 346 288Russian Federation 337 390 349 633 315 362 320 376 326 254Spain 337 421 377 817 347 442 347 462 357 308Sweden 337 390 359 631 327 374 332 374 338 254United Kingdom 364 421 378 671 348 397 348 411 356 288DEVELOPED, ALLDEVELOPING, ALLWORLD 406 349 339 646 313 369 316 383 320 2721 Observations derived from FAO (2009), projections obtained with the <strong>Global</strong> Forest Products Model.93
Table 28—Observed and projected chemical pulp prices (1997$/mt) for selected countries in the <strong>Global</strong> Forest ProductsModel 1 Observed Scenario A1B Scenario A2 Scenario B2Scenario A1B-Low Fuelwood1992 2006 2030 <strong>2060</strong> 2030 <strong>2060</strong> 2030 <strong>2060</strong> 2030 <strong>2060</strong>AFRICAEgypt 532 598 565 855 521 604 525 617 536 499Nigeria 543 592 665 881 598 603 606 624 619 495South Africa 469 512 585 871 521 585 548 612 533 488NORTH/CENTRAL AMERICACanada 469 512 480 778 449 537 451 549 457 439Mexico 507 553 539 820 494 577 500 589 508 476United States of America 469 553 526 920 495 666 495 657 471 436SOUTH AMERICAArgentina 469 512 508 798 456 555 461 554 470 442Brazil 469 512 500 779 456 537 462 550 471 440Chile 469 512 501 779 460 537 466 550 472 441ASIAChina 507 553 539 818 496 577 500 589 511 476India 507 553 539 818 496 577 501 589 514 476Indonesia 507 512 539 809 491 561 502 575 510 465Japan 507 553 527 796 496 554 500 567 511 459Korea, Republic of 507 553 539 800 496 553 500 589 511 476Malaysia 507 553 539 797 496 546 500 564 511 456OCEANIAAustralia 507 553 521 778 459 553 463 548 472 441New Zealand 469 512 502 789 471 542 475 552 480 454EUROPEEU-25Austria 507 553 501 778 467 533 472 546 480 437Finland 469 512 478 778 442 537 449 549 460 438France 507 553 531 798 489 554 495 551 501 446Germany 507 553 539 818 496 577 500 586 510 438Italy 507 553 539 818 496 577 500 589 511 476Russian Federation 469 512 504 779 465 537 470 550 478 440Spain 469 512 495 793 458 551 459 564 471 465Sweden 469 512 499 778 459 547 464 549 472 437United Kingdom 508 638 539 818 496 577 500 589 511 476DEVELOPED, ALLDEVELOPING, ALLWORLD 565 481 499 778 456 537 460 549 471 4361 Observations derived from FAO (2009), projections obtained with the <strong>Global</strong> Forest Products Model.94
Table 29—Observed and projected other fiber pulp prices (1997$/mt) for selected countries in the <strong>Global</strong> Forest ProductsModel 1 Observed Scenario A1B Scenario A2 Scenario B2Scenario A1B-Low Fuelwood1992 2006 2030 <strong>2060</strong> 2030 <strong>2060</strong> 2030 <strong>2060</strong> 2030 <strong>2060</strong>AFRICAEgypt 1083 1247 1135 1089 989 895 1051 937 1110 967NigeriaSouth Africa 920 1062 979 919 826 740 883 779 980 806NORTH/CENTRAL AMERICACanada 994 1147 1058 919 826 740 915 779 1059 806Mexico 920 1147 979 919 829 740 883 779 980 806United States of America 920 1062 979 919 826 740 883 779 980 806SOUTH AMERICAArgentina 920 1227 1132 966 856 569 931 703 1133 949Brazil 920 1147 979 919 826 740 883 779 980 806ChileASIAChina 994 1147 1058 998 905 819 962 858 1059 885India 994 1148 1004 839 826 611 909 713 1004 816Indonesia 921 1062 979 919 826 740 883 779 980 806Japan 994 1147 1058 998 905 819 962 858 1059 885Korea, Republic of 1058 998 905 819 962 858 1059 885Malaysia 920 1147 1058 998 905 819 962 858 1059 885OCEANIAAustralia 920 1058 998 905 819 962 858 1059 885New ZealandEUROPEEU-25Austria 921 1058 998 905 819 962 858 1059 885Finland 1058 998 905 819 962 858 1059 885France 994 1062 979 919 826 740 883 779 980 806Germany 994 1058 998 905 819 962 858 1059 885Italy 994 1147 1056 658 905 589 960 532 1059 709Russian Federation 920 1143 1079 980 887 1041 928 1144 958Spain 920 1062 979 919 826 740 883 779 980 806Sweden 1058 998 905 819 962 858 1059 885United Kingdom 1058 998 905 819 962 858 1059 885DEVELOPED, ALLDEVELOPING, ALLWORLD 1096 979 979 919 826 740 883 779 980 8061 Observations derived from FAO (2009), projections obtained with the <strong>Global</strong> Forest Products Model.95
Table 30—Observed and projected waste paper prices (1997$/mt) for selected countries in the <strong>Global</strong> Forest ProductsModel 1Observed Scenario A1B Scenario A2 Scenario B2Scenario A1B-Low Fuelwood1992 2006 2030 <strong>2060</strong> 2030 <strong>2060</strong> 2030 <strong>2060</strong> 2030 <strong>2060</strong>AFRICAEgypt 150 162 184 298 190 195 178 229 174 291Nigeria 150 0 108 298 101 195 106 229 109 309South Africa 138 124 138 250 105 154 130 186 138 260NORTH/CENTRAL AMERICACanada 138 149 178 275 150 179 157 211 180 285Mexico 138 149 178 269 150 179 157 210 180 260United States of America 115 124 153 250 125 154 132 186 155 260SOUTH AMERICAArgentina 148 159 190 288 161 190 168 223 192 298Brazil 138 149 209 275 150 179 166 211 210 285Chile 149 161 192 296 162 193 170 227 194 306ASIAChina 138 149 178 250 139 154 154 186 180 260India 138 140 178 275 150 179 157 211 180 285Indonesia 126 149 178 256 150 154 157 186 180 263Japan 138 124 153 250 125 154 132 186 155 260Korea, Republic of 138 149 159 272 138 179 136 209 155 260Malaysia 115 149 178 275 150 179 157 211 181 285OCEANIAAustralia 115 124 153 250 127 154 132 186 155 260New Zealand 115 124 175 250 130 154 144 186 162 267EUROPEEU-25Austria 138 149 178 275 150 179 157 211 180 285Finland 138 124 178 275 150 179 157 211 180 285France 138 124 153 250 125 154 132 186 155 260Germany 115 124 173 250 134 154 143 187 155 285Italy 138 124 153 250 132 154 132 186 155 260Russian Federation 115 124 153 250 125 154 132 186 155 260Spain 138 149 178 250 150 179 157 186 180 260Sweden 138 149 178 275 150 179 157 211 180 285United Kingdom 115 124 153 250 125 154 132 186 155 260DEVELOPED, ALLDEVELOPING, ALLWORLD 138 119 153 250 125 154 132 186 155 2601 Observations derived from FAO (2009), projections obtained with the <strong>Global</strong> Forest Products Model.96
Table 31—Observed and projected mechanical pulp consumption (thousand mt) for world regions and selected countriesin the <strong>Global</strong> Forest Products Model 1Observed Scenario A1B Scenario A2 Scenario B2Scenario A1B-Low Fuelwood1992 2006 2030 <strong>2060</strong> 2030 <strong>2060</strong> 2030 <strong>2060</strong> 2030 <strong>2060</strong>AFRICA 352 465 1041 1451 741 919 919 1413 1048 1533Egypt 8 2 15 85 17 80 12 88 16 62Nigeria 0 16 48 113 40 73 43 120 48 150South Africa 285 348 708 750 505 457 648 772 713 801NORTH/CENTRAL AMERICA 15968 15389 19814 12772 16600 10157 17768 11301 18655 17426Canada 9968 11262 15109 8092 12146 6082 13272 7397 13662 12392Mexico 56 50 398 1297 335 1022 321 1020 395 1060United States of America 5935 4042 4176 2920 4014 2715 4066 2470 4470 3493SOUTH AMERICA 671 1122 1411 1343 1144 946 1165 1115 1358 1399Argentina 39 66 216 364 148 236 159 279 217 378Brazil 412 500 564 526 423 351 450 414 566 564Chile 179 515 499 168 474 146 448 159 443 161ASIA 3491 4330 12408 31675 9562 21912 10486 23699 12324 28370China 512 874 5155 17216 3722 11797 4264 12911 5160 13701India 185 4 278 1304 195 661 210 884 279 1123Indonesia 91 455 672 1381 462 769 540 920 673 1428Japan 2235 1677 2840 4918 2704 4575 2627 4113 2848 5208Korea, Republic of 165 883 1571 2399 1195 1501 1342 1737 1503 2375Malaysia 12 11 92 504 62 338 74 372 89 543OCEANIA 823 975 1289 1109 1095 1030 1121 927 1189 1200Australia 459 377 759 987 712 952 698 845 706 1092New Zealand 364 595 524 116 379 75 418 79 477 103EUROPE 13073 20638 24668 24738 20337 21764 21506 21449 23697 30281EU-25 10206 17153 21335 22140 17676 19699 18607 19162 20369 27376Austria 539 855 888 557 681 464 740 489 811 690Finland 3140 6016 6196 2671 4505 2417 5077 2472 5672 6188France 957 648 1565 2838 1477 2575 1446 2506 1510 3024Germany 1554 2967 4952 5720 4290 5429 4492 5142 4835 6733Italy 451 483 950 1782 900 1635 885 1522 939 1852Russian Federation 1366 1300 1206 641 820 410 952 482 1211 634Spain 102 167 609 1458 584 1357 565 1269 593 1538Sweden 2349 3386 2037 483 1636 198 1790 250 1946 493United Kingdom 626 424 1313 3160 1235 2916 1182 2674 1288 3314DEVELOPED, ALL 32345 38976 48875 42691 40862 36727 43309 37247 46662 53545DEVELOPING, ALL 2032 3943 11755 30397 8617 20001 9656 22656 11609 26664WORLD 34377 42919 60630 73088 49479 56728 52965 59903 58270 802091 Observations derived from FAO (2009), projections obtained with the <strong>Global</strong> Forest Products Model.97
Table 32—Observed and projected chemical pulp consumption (thousand mt) for world regions and selected countries inthe <strong>Global</strong> Forest Products Model 1Observed Scenario A1B Scenario A2 Scenario B2Scenario A1B-Low Fuelwood1992 2006 2030 <strong>2060</strong> 2030 <strong>2060</strong> 2030 <strong>2060</strong> 2030 <strong>2060</strong>AFRICA 1339 1552 1981 2777 1510 1778 1752 2633 1995 2877Egypt 53 59 103 273 157 241 103 270 109 216Nigeria 9 15 58 304 55 194 58 318 59 372South Africa 966 1133 1002 879 713 533 917 893 1009 920NORTH/CENTRAL AMERICA 55496 50655 46891 30306 43794 27305 44299 25465 51103 36270Canada 4172 3106 5138 4242 3942 2872 4431 3588 4935 6171Mexico 649 1208 1293 1398 1156 1150 1140 1133 1276 1162United States of America 50641 46267 40313 24470 38581 23142 38603 20567 44747 28735SOUTH AMERICA 4605 6295 7788 6073 5810 4237 6189 4966 7811 6447Argentina 554 505 1016 1011 724 677 772 792 1022 1054Brazil 3138 4809 5502 3822 4101 2605 4364 3047 5526 4126Chile 181 333 302 228 248 176 258 213 292 232ASIA 18965 30059 38388 40041 30811 28323 33190 30682 38358 37181China 2490 9415 14476 17478 11105 12364 12419 13544 14527 14249India 783 391 1356 1998 917 1028 1085 1409 1357 1849Indonesia 1160 2362 2843 2669 2029 1519 2318 1806 2854 2769Japan 11646 11247 10329 7725 9809 7105 9530 6391 10353 8004Korea, Republic of 1679 2993 2772 2046 2026 1146 2373 1469 2746 2127Malaysia 90 302 461 901 319 621 375 681 448 989OCEANIA 1071 1403 1958 1447 1755 1331 1751 1228 1780 1604Australia 763 1164 1596 1247 1493 1190 1461 1080 1450 1400New Zealand 308 233 352 189 254 133 282 140 321 193EUROPE 31178 39221 41853 30775 34207 25291 36227 26615 40908 36386EU-25 25791 33932 35680 25444 29920 21694 31231 22238 34721 30783Austria 1271 1675 1381 531 1012 442 1111 465 1274 660Finland 4248 5678 6340 3018 4531 2696 5096 2825 5941 6875France 3407 3125 3655 3017 3434 2712 3378 2661 3485 3190Germany 4259 5212 5224 3714 4610 3501 4695 3286 5225 4226Italy 2465 3507 3454 2695 3279 2460 3217 2291 3434 2786Russian Federation 4025 3404 3880 3095 2571 1982 3014 2371 3897 3217Spain 1321 1798 2118 1764 2030 1636 1968 1531 2079 1860Sweden 4595 6018 3813 1220 3087 787 3369 877 3677 1227United Kingdom 1856 1184 2477 2782 2316 2583 2229 2374 2441 2940DEVELOPED, ALL 99761 102564 101005 70025 89303 60583 91793 59663 104131 82323DEVELOPING, ALL 12892 26622 37853 41393 28583 27681 31614 31926 37824 38442WORLD 112653 129185 138858 111418 117886 88264 123407 91588 141955 1207651 Observations derived from FAO (2009), projections obtained with the <strong>Global</strong> Forest Products Model.98
Table 33—Observed and projected mechanical pulp net trade (thousand mt) for world regions and selectedcountries in the <strong>Global</strong> Forest Products Model 1Observed Scenario A1B Scenario A2 Scenario B2Scenario A1B-Low Fuelwood1992 2006 2030 <strong>2060</strong> 2030 <strong>2060</strong> 2030 <strong>2060</strong> 2030 <strong>2060</strong>AFRICA -17 -19 -55 -133 -45 -84 -50 -138 -55 -170Egypt 0 -1 0 -1 0 0 0 0 0 0Nigeria 0 -16 -48 -113 -40 -73 -43 -120 -48 -150South Africa 3 0 0 0 0 0 0 0 0 0NORTH/CENTRAL AMERICA 189 10 -59 -484 -48 -183 -36 -359 -41 174Canada 244 101 25 7 35 62 27 89 25 45Mexico -17 -10 -74 -463 -74 -201 -74 -439 -74 -40United States of America -37 -81 -6 -21 -6 -44 13 -8 10 170SOUTH AMERICA 3 -5 0 0 0 0 0 0 0 0Argentina -6 0 0 0 0 0 0 0 0 0Brazil 9 -3 1 0 1 0 1 0 1 0Chile 2 -2 0 0 0 0 0 0 0 0ASIA -571 -556 -1079 -3271 -862 -1389 -996 -2787 -1096 -1909China -77 -84 -370 -1088 -370 -155 -370 -1172 -370 -180India -22 -4 -278 -1304 -195 -661 -210 -884 -279 -1123Indonesia -42 -153 -165 -39 -32 -7 -147 -38 -177 -63Japan -374 -256 -62 -9 -91 -13 -79 -11 -64 -9Korea, Republic of -4 -1 -1 0 -1 0 -1 0 -1 0Malaysia 0 -4 -8 -1 -5 -1 -6 -1 -7 -1OCEANIA 318 217 1314 5024 1122 1479 1188 3288 1311 1707Australia 0 -6 -21 -37 -6 -3 -3 0 -6 -1New Zealand 318 223 1335 5062 1128 1482 1191 3288 1317 1707EUROPE -27 58 -242 -1258 -288 57 -228 -125 -240 76EU-25 -195 -176 -396 -1285 -396 -434 -383 -976 -394 -694Austria -7 -5 -10 -34 -7 -2 -4 -2 -10 -2Finland 30 25 5 2 5 37 5 37 5 5France -35 -33 -16 -51 -9 -1 -10 -1 -14 -2Germany -93 -78 -10 -8 -10 -4 -10 -1 -10 5Italy -109 -110 -36 -5 -55 -8 -45 -7 -37 -5Russian Federation 1 0 0 0 0 0 0 0 0 0Spain 6 -12 -71 -471 -71 -133 -71 -442 -71 -471Sweden 176 103 25 8 25 4 26 34 25 17United Kingdom -130 -61 -239 -583 -239 -311 -239 -495 -239 -226DEVELOPED, ALL 101 23 969 3577 729 1450 877 3126 986 1838DEVELOPING, ALL -206 -318 -1090 -3698 -850 -1571 -998 -3247 -1107 -1959WORLD -105 -295 -121 -121 -121 -121 -121 -121 -121 -1211 Observations derived from FAO (2009), projections obtained with the <strong>Global</strong> Forest Products Model.99
Table 34—Observed and projected chemical pulp net trade (thousand mt) for world regions and selected countries in the<strong>Global</strong> Forest Products Model 1 Observed Scenario A1B Scenario A2 Scenario B2Scenario A1B-Low Fuelwood1992 2006 2030 <strong>2060</strong> 2030 <strong>2060</strong> 2030 <strong>2060</strong> 2030 <strong>2060</strong>AFRICA 222 303 1 -619 45 -246 51 -463 -4 -479Egypt -53 -59 -103 -273 -157 -241 -103 -270 -109 -216Nigeria -2 -1 -3 -11 -3 -7 -3 -7 -3 -7South Africa 165 173 120 -175 148 -73 120 -175 120 -175NORTH/CENTRAL AMERICA 9309 6843 13232 15181 13381 12015 14361 11665 13841 19268Canada 8205 8495 14112 17180 14112 19590 14112 18334 14112 12677Mexico -369 -1066 -601 -1241 -467 -563 -476 -965 -539 -377United States of America 1487 -539 -194 -662 -194 -6942 802 -5619 354 7049SOUTH AMERICA 2503 8253 6204 3043 6494 3652 6191 3392 7279 3929Argentina 37 131 174 104 281 163 241 141 239 140Brazil 1612 5841 4771 2635 4944 2836 4726 2610 5807 3200Chile 1318 2638 1786 975 1643 898 1661 907 1795 980ASIA -6042 -10706 -19008 -20592 -18641 -16893 -19678 -19418 -21062 -22199China -963 -7045 -13182 -16542 -10639 -12226 -11916 -13459 -13537 -14092India -119 -366 -816 -984 -747 -873 -831 -1266 -834 -1543Indonesia -310 2253 1187 384 1319 708 1218 421 1298 688Japan -2479 -1675 -1124 -249 -3718 -949 -2820 -952 -2397 -1110Korea, Republic of -1516 -2216 -2126 -693 -1870 -839 -2182 -1150 -2334 -2052Malaysia -49 -243 -223 -138 -117 -28 -172 -62 -172 -45OCEANIA 89 155 165 230 166 123 166 123 165 123Australia -203 -316 -104 -40 -104 -25 -104 -25 -104 -23New Zealand 292 474 274 273 274 150 274 150 274 150EUROPE -4904 -4332 -1658 1694 -2509 285 -2153 3637 -1282 -1706EU-25 -5655 -5727 -2723 712 -3407 -611 -3025 2788 -2302 -2538Austria -268 -385 -46 52 -46 74 -46 52 -46 33Finland 1123 2268 3510 6373 3362 6050 3510 6136 3510 2730France -1605 -1571 -582 -674 -625 -105 -580 -65 -581 -65Germany -3468 -3741 -2362 -3714 -2744 -2808 -2727 -842 -2297 -469Italy -2380 -3461 -3402 -2468 -3265 -2453 -3201 -2283 -3399 -2778Russian Federation 801 1734 1078 591 1078 602 1078 591 1078 591Spain 88 124 479 341 327 345 458 371 414 305Sweden 2470 2448 3190 5324 2866 1593 2697 2536 3579 1982United Kingdom -1730 -1184 -2477 -2782 -2316 -2583 -2229 -2374 -2441 -2940DEVELOPED, ALL 2476 2154 11157 17693 7801 11827 10015 15114 10820 16522DEVELOPING, ALL -1299 -1638 -12220 -18756 -8864 -12891 -11078 -16178 -11883 -17586WORLD 1177 516 -1063 -1063 -1063 -1064 -1063 -1064 -1063 -10631 Observations derived from FAO (2009), projections obtained with the <strong>Global</strong> Forest Products Model.100
Table 35—Observed and projected other fiber pulp consumption (thousand mt) for world regions and selected countriesin the <strong>Global</strong> Forest Products Model 1Observed Scenario A1B Scenario A2 Scenario B2Scenario A1B-Low Fuelwood1992 2006 2030 <strong>2060</strong> 2030 <strong>2060</strong> 2030 <strong>2060</strong> 2030 <strong>2060</strong>AFRICA 253 282 424 888 492 679 443 828 421 789Egypt 120 159 231 627 347 514 268 584 227 526Nigeria 0 0 0 0 0 0 0 0 0 0South Africa 87 94 138 123 100 76 127 125 139 128NORTH/CENTRAL AMERICA 426 356 352 308 369 300 358 265 350 250Canada 46 51 54 37 39 21 45 28 54 47Mexico 238 133 131 173 170 191 150 151 127 99United States of America 82 154 139 56 135 55 136 50 142 63SOUTH AMERICA 553 400 529 582 390 409 414 470 531 603Argentina 112 132 253 276 181 186 193 218 255 291Brazil 127 73 111 122 81 81 86 96 112 131Chile 0 0 0 0 0 0 0 0 0 0ASIA 15367 16836 25267 30113 18184 19186 20965 22317 25243 24831China 13395 13368 18645 21035 13573 14327 15419 15616 18676 16138India 1109 2009 3879 4877 2593 2525 3163 3490 3881 4614Indonesia 115 104 62 48 49 28 52 33 62 51Japan 33 95 102 79 98 75 95 67 103 86Korea, Republic of 4 10 8 10 6 6 7 7 8 10Malaysia 1 4 6 28 6 24 6 25 6 36OCEANIA 11 3 14 137 14 59 13 130 11 8Australia 9 1 5 7 4 7 4 6 5 8New Zealand 0 0 0 0 0 0 0 0 0 0EUROPE 388 341 446 479 409 419 406 410 446 506EU-25 347 331 420 433 388 383 383 374 420 465Austria 1 9 10 5 7 4 8 4 9 7Finland 1 0 1 1 1 1 1 1 1 2France 32 0 0 0 0 0 0 0 0 0Germany 37 24 29 34 26 32 26 30 30 37Italy 100 190 198 161 189 148 184 138 199 170Russian Federation 0 3 4 6 2 4 3 5 4 7Spain 93 0 1 2 1 2 1 2 1 2Sweden 0 7 4 2 3 1 3 1 5 2United Kingdom 27 43 103 126 95 119 92 110 102 136DEVELOPED, ALL 647 738 884 782 784 653 814 685 888 837DEVELOPING, ALL 16352 17480 26148 31726 19074 20399 21784 23735 26114 26149WORLD 16999 18218 27032 32507 19858 21052 22598 24420 27002 269871 Observations derived from FAO (2009), projections obtained with the <strong>Global</strong> Forest Products Model.101
Table 36—Observed and projected waste paper consumption (thousand mt) for world regions and selected countries inthe <strong>Global</strong> Forest Products Model 1Observed Scenario A1B Scenario A2 Scenario B2Scenario A1B-Low Fuelwood1992 2006 2030 <strong>2060</strong> 2030 <strong>2060</strong> 2030 <strong>2060</strong> 2030 <strong>2060</strong>AFRICA 986 1776 4804 12401 3624 7907 4273 11529 4780 12615Egypt 63 235 620 2307 639 1758 600 2032 585 2079Nigeria 11 1 56 822 53 512 56 851 57 964South Africa 455 1130 2563 4355 1827 2637 2346 4401 2579 4520NORTH/CENTRAL AMERICA 21603 39083 68995 108090 62077 95223 63313 92220 74666 136999Canada 1942 3678 13203 23261 10569 18685 11571 22001 12299 40124Mexico 1863 3969 7035 11012 5262 7637 5526 8617 6989 10462United States of America 17681 31132 47458 70704 45249 66664 45142 58870 54118 83295SOUTH AMERICA 2168 2372 9187 18357 6871 12800 7293 15014 9153 19181Argentina 269 736 1810 3339 1269 2205 1357 2587 1816 3456Brazil 1173 329 4357 9596 3234 6511 3442 7608 4377 10224Chile 71 264 842 1362 727 1078 731 1274 792 1367ASIA 24580 78380 132740 241301 98876 160383 110546 177659 132047 210493China 3393 45107 74323 136204 52521 91120 60507 99629 74346 106178India 408 1723 5748 15733 3923 8060 4545 10945 5752 14142Indonesia 867 3722 6885 11703 4668 6569 5518 7849 6898 12037Japan 14027 14163 19230 25139 18255 23001 17742 20712 19267 25806Korea, Republic of 3624 6089 9414 11833 7000 6917 8110 8493 9196 11905Malaysia 481 753 1916 3759 1283 2284 1525 2624 1805 3777OCEANIA 834 1562 4023 5438 3600 4891 3576 4590 3542 6052Australia 756 1473 3363 4426 3123 4173 3047 3835 2938 5008New Zealand 77 84 645 974 467 691 517 726 589 1007EUROPE 25522 46319 79892 114254 67725 95484 70973 99284 77038 132152EU-25 24054 41964 70504 95499 60959 82573 63173 83609 67645 111770Austria 1144 2336 2734 2380 2140 1969 2314 2067 2488 2690Finland 870 853 5989 8113 4347 7156 4896 7677 5504 18061France 3168 5470 8379 11401 7729 9760 7745 10075 7618 11576Germany 6738 12608 18231 20018 15544 19121 16566 18307 17580 24418Italy 2907 5155 7269 9690 6890 8779 6771 8185 7202 9864Russian Federation 360 2396 4802 9934 3247 6342 3774 7560 4820 10155Spain 1893 4865 5734 7253 5524 6651 5346 6230 5573 7507Sweden 1233 1934 3844 3537 3213 2547 3460 2772 3675 3540United Kingdom 2592 3455 7495 11951 7100 10785 6800 9921 7378 12276DEVELOPED, ALL 60559 98156 166902 244467 147641 212202 151803 210897 169334 293263DEVELOPING, ALL 15134 71336 132739 255373 95131 164486 108171 189399 131891 224229WORLD 75693 169491 299640 499840 242772 376688 259974 400296 301225 5174911 Observations derived from FAO (2009), projections obtained with the <strong>Global</strong> Forest Products Model.102
Table 37—Observed and projected other fiber pulp net trade (thousand mt) for world regions and selected countries in the<strong>Global</strong> Forest Products Model 1Observed Scenario A1B Scenario A2 Scenario B2Scenario A1B-Low Fuelwood1992 2006 2030 <strong>2060</strong> 2030 <strong>2060</strong> 2030 <strong>2060</strong> 2030 <strong>2060</strong>AFRICA -58 -24 86 -47 -39 22 32 -79 85 -15Egypt -73 -39 0 -218 -138 -160 -50 -219 0 -151Nigeria 0 0 0 0 0 0 0 0 0 0South Africa 12 9 69 164 83 169 65 129 69 132NORTH/CENTRAL AMERICA 99 63 223 423 134 321 172 380 225 414Canada -6 -11 -3 20 3 27 0 22 -4 5Mexico 2 -17 61 94 0 36 28 85 65 143United States of America 105 91 166 318 134 263 146 281 164 275SOUTH AMERICA -1 -4 172 398 211 379 221 372 169 309Argentina 0 -1 -30 0 0 0 0 0 -31 -18Brazil 0 -3 16 54 31 68 31 59 16 29Chile 0 0 0 0 0 0 0 0 0 0ASIA -114 -77 -464 -726 -289 -691 -424 -648 -463 -623China -26 -22 -411 -822 -295 -767 -376 -729 -416 -305India -10 -13 0 0 0 0 0 0 0 0Indonesia 1 1 128 233 84 152 101 167 128 164Japan -29 -35 -29 -5 -45 -24 -35 -12 -30 -27Korea, Republic of -4 -10 -8 -10 -6 -6 -7 -7 -8 -10Malaysia 0 -3 -4 -26 -4 -22 -4 -23 -4 -34OCEANIA 0 -1 -5 -7 -4 -7 -4 -6 -5 -8Australia 0 -1 -5 -7 -4 -7 -4 -6 -5 -8New Zealand 0 0 0 0 0 0 0 0 0 0EUROPE -45 -59 -98 -128 -101 -109 -83 -105 -98 -164EU-25 -35 -53 -90 -109 -95 -96 -77 -92 -90 -147Austria 0 -9 -9 -3 -6 -3 -6 -3 -8 -5Finland -1 0 -1 -1 -1 -1 -1 -1 -1 -2France -9 56 70 81 62 69 65 71 70 73Germany -5 -24 -29 -34 -26 -32 -26 -30 -30 -37Italy -14 -9 0 0 -12 0 0 0 0 0Russian Federation 2 -3 -4 -6 -2 -4 -3 -5 -4 -7Spain 6 14 13 14 11 12 12 13 13 12Sweden 0 -7 -4 -2 -3 -1 -3 -1 -5 -2United Kingdom -27 -43 -102 -124 -94 -118 -91 -108 -101 -135DEVELOPED, ALL 37 14 130 400 93 344 115 337 127 244DEVELOPING, ALL -156 -116 -217 -486 -180 -431 -202 -424 -214 -331WORLD -119 -102 -87 -87 -87 -87 -87 -87 -87 -871 Observations derived from FAO (2009), projections obtained with the <strong>Global</strong> Forest Products Model.103
Table 38—Observed and projected waste paper net trade (thousand mt) for world regions and selected countries in the<strong>Global</strong> Forest Products Model 1 Observed Scenario A1B Scenario A2 Scenario B2Scenario A1B-Low Fuelwood1992 2006 2030 <strong>2060</strong> 2030 <strong>2060</strong> 2030 <strong>2060</strong> 2030 <strong>2060</strong>AFRICA -56 -41 -55 -1674 112 -1204 84 -1901 -53 -1632Egypt -3 -8 0 -174 0 -368 -1 -396 0 0Nigeria -1 -1 0 -442 0 -263 0 -556 0 -571South Africa -13 18 246 476 315 374 312 444 246 485NORTH/CENTRAL AMERICA 4210 12746 13533 -1266 5497 1753 7907 -2291 8550 -26683Canada -464 -1028 -9438 -15600 -7398 -13697 -8256 -16127 -8505 -32189Mexico -1001 -1703 -2461 0 -1409 -298 -1498 0 -2380 188United States of America 5724 15470 25658 15109 14465 16402 17832 14652 19641 6043SOUTH AMERICA -320 -270 -1628 -1679 -1072 -1892 -1055 -2139 -1551 -1936Argentina -33 -37 -349 0 -38 0 -68 0 -345 0Brazil -18 -11 -578 -1672 -515 -1352 -437 -1533 -578 -2018Chile -3 -46 -291 -55 -262 -226 -245 -272 -237 -14ASIA -4985 -23351 -16508 -1836 -7237 -3543 -10257 2697 -15215 37645China -1591 -20511 -10417 20013 -2802 5136 -5348 16483 -9958 56159India -252 -1722 -5748 -15733 -3923 -8060 -4545 -10945 -5752 -14142Indonesia -866 -2067 -2644 0 -1095 454 -1783 540 -2625 0Japan -405 3815 7394 6378 3488 6196 5188 5915 7590 6820Korea, Republic of -1503 -1086 -126 0 -116 -337 -122 0 -126 261Malaysia 49 -189 -505 -504 -97 -164 -282 -129 -376 -406OCEANIA 77 1146 618 738 179 925 396 815 1085 381Australia 33 906 580 722 136 803 348 616 1039 365New Zealand 44 242 33 0 37 112 42 187 41 0EUROPE -1373 7578 3215 4893 1697 3135 2100 1995 6360 -8600EU-25 -1537 7148 3104 6752 644 4856 1527 4422 6184 -5672Austria -510 -901 -855 -260 -557 -9 -659 -154 -594 -497Finland -91 163 -4617 -6436 -2989 -5569 -3562 -6117 -4122 -16323France -409 952 1274 1438 154 2365 569 1031 2119 1813Germany 1179 225 71 1151 55 606 137 0 494 -2471Italy -720 423 758 2424 25 875 142 2199 895 2655Russian Federation 31 189 830 461 1352 142 1076 296 862 555Spain -492 -732 -553 1504 -1159 -74 -783 595 -353 1562Sweden -333 -599 -1999 -1669 -1659 -823 -1835 -986 -1827 -1617United Kingdom 171 3856 4102 3078 2371 3338 3188 3123 4321 3332DEVELOPED, ALL 3508 26868 27273 10921 12408 12653 17216 6850 26039 -28123DEVELOPING, ALL -5955 -29060 -28099 -11746 -13233 -13478 -18041 -7675 -26864 27298WORLD -2447 -2192 -825 -825 -825 -825 -825 -825 -825 -8251 Observations derived from FAO (2009), projections obtained with the <strong>Global</strong> Forest Products Model.104
Table 39—Observed and projected newsprint prices (1997$/mt) for selected countries in the <strong>Global</strong> Forest ProductsModel 1 Observed Scenario A1B Scenario A2 Scenario B2Scenario A1B-Low Fuelwood1992 2006 2030 <strong>2060</strong> 2030 <strong>2060</strong> 2030 <strong>2060</strong> 2030 <strong>2060</strong>AFRICAEgypt 602 660 551 612 504 458 515 486 532 503Nigeria 613 686 545 625 514 467 525 499 534 515South Africa 546 606 516 581 469 424 496 455 495 468NORTH/CENTRAL AMERICACanada 546 606 480 556 451 408 456 435 466 452Mexico 573 636 511 573 479 427 484 455 504 454United States of America 573 636 508 602 479 436 484 463 493 467SOUTH AMERICAArgentina 659 731 564 582 517 432 527 459 553 484Brazil 573 636 523 584 475 441 484 467 503 486Chile 546 606 482 570 451 418 456 446 469 466ASIAChina 573 636 488 465 444 352 460 382 487 438India 630 700 587 595 522 454 545 494 584 540Indonesia 541 606 507 562 472 412 481 438 500 458Japan 573 636 510 567 480 424 485 450 504 470Korea, Republic of 573 606 473 556 449 406 450 435 465 440Malaysia 573 636 523 579 483 436 493 463 516 480OCEANIAAustralia 573 636 502 550 466 411 470 431 488 449New Zealand 546 606 488 556 454 408 462 435 471 459EUROPEEU-25Austria 546 606 490 585 461 428 466 455 483 468Finland 546 606 486 568 456 425 462 451 477 468France 573 606 495 563 463 419 469 440 486 459Germany 573 636 503 559 465 407 472 431 483 457Italy 573 636 508 568 479 423 484 449 494 472Russian Federation 546 606 488 548 454 405 461 432 478 449Spain 573 636 507 556 476 424 481 434 494 459Sweden 546 606 505 582 472 442 478 465 494 482United Kingdom 568 644 492 536 461 397 466 424 487 448DEVELOPED, ALLDEVELOPING, ALLWORLD 659 535 480 556 451 408 456 435 466 4521 Observations derived from FAO (2009), projections obtained with the <strong>Global</strong> Forest Products Model.105
Table 40—Observed and projected printing and writing paper prices (1997$/mt) for selected countries in the <strong>Global</strong>Forest Products Model 1 Observed Scenario A1B Scenario A2 Scenario B2Scenario A1B-Low Fuelwood1992 2006 2030 <strong>2060</strong> 2030 <strong>2060</strong> 2030 <strong>2060</strong> 2030 <strong>2060</strong>AFRICAEgypt 1194 1102 964 949 913 783 935 816 952 846Nigeria 1194 1099 964 898 926 707 935 743 952 714South Africa 995 863 780 836 731 652 758 682 758 662NORTH/CENTRAL AMERICACanada 939 863 750 804 716 642 724 663 738 653Mexico 995 915 805 855 767 691 775 714 793 704United States of America 995 915 784 875 757 711 758 722 751 659SOUTH AMERICAArgentina 1164 1071 924 872 839 693 858 726 906 754Brazil 939 863 784 833 732 674 743 697 766 686Chile 995 915 801 855 767 693 775 714 789 704ASIAChina 995 863 822 838 761 684 779 708 813 708India 939 1096 952 860 863 702 899 745 946 782Indonesia 937 863 787 830 744 666 756 689 772 682Japan 939 915 776 806 748 643 753 665 769 653Korea, Republic of 935 859 761 827 728 661 732 692 746 669Malaysia 995 915 801 855 767 679 775 708 789 701OCEANIAAustralia 995 913 780 802 740 646 743 659 757 645New Zealand 995 915 801 855 767 693 775 714 789 704EUROPEEU-25Austria 939 859 750 835 716 652 724 675 738 653Finland 939 863 750 804 716 642 724 663 738 653France 995 915 777 808 746 643 750 658 763 645Germany 995 860 759 821 724 651 730 671 739 656Italy 995 915 785 813 755 653 758 673 775 663Russian Federation 1144 1046 807 784 771 625 778 647 790 634Spain 995 915 785 842 755 668 758 679 775 660Sweden 939 861 750 804 716 647 724 663 738 653United Kingdom 979 912 800 817 767 655 771 677 789 664DEVELOPED, ALLDEVELOPING, ALLWORLD 1133 857 750 804 716 642 724 663 738 6531 Observations derived from FAO (2009), projections obtained with the <strong>Global</strong> Forest Products Model.106
Table 41—Observed and projected other paper and paperboard prices (1997$/mt) for selected countries in the <strong>Global</strong>Forest Products Model 1 Observed Scenario A1B Scenario A2 Scenario B2Scenario A1B-Low Fuelwood1992 2006 2030 <strong>2060</strong> 2030 <strong>2060</strong> 2030 <strong>2060</strong> 2030 <strong>2060</strong>AFRICAEgypt 971 1032 866 792 826 671 837 705 849 751Nigeria 928 982 828 765 788 629 800 661 811 695South Africa 796 846 725 713 677 585 705 616 708 650NORTH/CENTRAL AMERICACanada 796 846 694 693 666 569 671 595 684 637Mexico 844 897 725 680 692 571 699 600 722 625United States of America 796 846 707 730 678 608 681 629 687 640SOUTH AMERICAArgentina 971 1032 797 728 758 602 766 628 788 661Brazil 796 846 731 721 679 600 690 627 717 660Chile 844 846 724 739 689 612 696 641 713 678ASIAChina 844 897 774 724 714 609 735 638 773 685India 1013 1073 875 736 788 617 825 662 876 739Indonesia 790 846 724 707 689 578 697 605 718 641Japan 796 897 722 700 694 578 699 604 718 639Korea, Republic of 796 846 696 709 666 585 671 614 687 632Malaysia 844 897 732 678 695 567 705 595 733 644OCEANIAAustralia 796 846 704 694 666 576 672 598 687 635New Zealand 844 846 704 692 666 570 677 595 687 637EUROPEEU-25Austria 796 846 701 715 668 584 677 611 690 640Finland 796 846 701 709 666 588 677 614 687 646France 844 846 700 692 666 569 676 590 690 627Germany 844 846 704 693 666 563 677 590 687 637Italy 844 897 728 702 701 581 702 607 722 642Russian Federation 796 846 710 706 674 584 682 611 698 644Spain 844 897 730 706 701 595 705 603 726 636Sweden 796 846 704 717 672 599 677 623 690 656United Kingdom 844 910 715 685 686 563 691 590 711 626DEVELOPED, ALLDEVELOPING, ALLWORLD 971 788 704 692 666 561 677 590 687 6371 Observations derived from FAO (2009), projections obtained with the <strong>Global</strong> Forest Products Model.107
Table 42—Observed and projected newsprint consumption (thousand mt) for world regions and selected countries in the<strong>Global</strong> Forest Products Model 1 Observed Scenario A1B Scenario A2 Scenario B2Scenario A1B-Low Fuelwood1992 2006 2030 <strong>2060</strong> 2030 <strong>2060</strong> 2030 <strong>2060</strong> 2030 <strong>2060</strong>AFRICA 518 869 1773 3416 1157 1891 1428 3051 1787 3575Egypt 117 127 332 616 216 371 239 464 335 648Nigeria 18 37 107 231 66 119 85 222 108 242South Africa 214 302 425 562 270 293 377 572 429 594NORTH/CENTRAL AMERICA 12970 10322 10353 8800 9543 7888 9217 7084 10425 9353Canada 267 469 589 623 557 573 549 507 593 656Mexico 422 485 760 1012 487 575 537 741 763 1073United States of America 12156 9077 8472 6353 8131 6209 7714 5132 8535 6774SOUTH AMERICA 1013 1203 1988 2680 1314 1642 1441 2057 2002 2809Argentina 302 253 402 513 263 302 284 371 404 537Brazil 297 544 845 1122 547 644 595 799 853 1174Chile 58 74 138 174 96 120 108 160 139 183ASIA 7708 13702 27279 41079 18193 23271 21917 28526 27336 42391China 1050 4204 9508 14589 6074 8808 7539 10167 9512 14808India 566 1590 4036 7582 2284 3233 3190 5140 4041 7771Indonesia 112 296 819 1355 474 635 605 806 821 1426Japan 3707 3889 4079 3887 3834 3471 3693 3034 4089 4076Korea, Republic of 813 1029 1859 1902 1081 867 1442 1217 1868 2020Malaysia 223 337 800 990 492 514 622 649 803 1037OCEANIA 672 848 1090 1185 1035 1116 1029 963 1097 1246Australia 569 685 918 995 879 944 865 801 924 1046New Zealand 101 152 139 151 136 151 139 136 141 159EUROPE 9183 12394 14832 16063 12764 12926 13072 13251 14916 16870EU-25 7712 10769 12335 12860 11215 11026 11144 10663 12406 13504Austria 354 267 273 256 258 229 258 222 274 271Finland 113 154 193 178 185 164 184 160 194 186France 742 905 990 996 942 911 899 809 995 1049Germany 2058 2613 2750 2674 2610 2412 2551 2184 2777 2813Italy 578 832 824 786 776 696 752 631 830 823Russian Federation 854 698 1263 1693 693 930 881 1191 1269 1780Spain 454 486 656 669 624 602 606 553 660 702Sweden 519 783 768 711 731 642 759 670 772 746United Kingdom 1877 2451 2801 2928 2656 2674 2552 2406 2808 3062DEVELOPED, ALL 26306 27211 29875 29220 26829 24890 26715 23879 30049 30788DEVELOPING, ALL 5758 12127 27440 44002 17178 23843 21389 31052 27514 45455WORLD 32064 39338 57315 73222 44007 48733 48104 54931 57563 762431 Observations derived from FAO (2009), projections obtained with the <strong>Global</strong> Forest Products Model.108
Table 43—Observed and projected printing and writing paper consumption (thousand mt) for world regions and selectedcountries in the <strong>Global</strong> Forest Products Model 1Observed Scenario A1B Scenario A2 Scenario B2Scenario A1B-Low Fuelwood1992 2006 2030 <strong>2060</strong> 2030 <strong>2060</strong> 2030 <strong>2060</strong> 2030 <strong>2060</strong>AFRICA 958 1709 3648 7665 2569 4892 3032 6999 3671 8191Egypt 228 325 785 1726 563 1180 607 1398 789 1801Nigeria 65 139 385 974 265 599 323 967 386 1055South Africa 417 714 1034 1699 730 1056 946 1771 1045 1852NORTH/CENTRAL AMERICA 25438 32859 37371 39957 35223 37451 34296 34340 37867 43954Canada 2133 2482 4151 5765 3993 5523 3943 5026 4173 6224Mexico 698 2289 3162 5234 2250 3448 2421 4197 3179 5622United States of America 22168 27708 29281 27485 28406 27407 27301 23780 29736 30529SOUTH AMERICA 1821 3751 6723 11227 4897 7760 5243 9229 6773 12011Argentina 293 547 1339 2203 979 1499 1037 1747 1349 2321Brazil 952 2049 3584 5917 2572 3938 2743 4645 3614 6352Chile 72 184 298 476 225 363 247 455 299 512ASIA 20533 36547 73450 127878 55218 89262 62590 99622 73744 136152China 6387 17067 38623 70246 27557 48516 32529 54385 38781 74700India 1056 1649 4580 10305 2982 5432 3841 7744 4589 10661Indonesia 578 0 1225 2402 807 1363 972 1638 1233 2582Japan 9440 10158 13808 17743 13184 16696 12803 15028 13853 19174Korea, Republic of 988 1316 2119 2861 1400 1588 1747 <strong>2060</strong> 2134 3096Malaysia 324 1588 2835 4414 1945 2737 2335 3268 2849 4748OCEANIA 799 1722 2533 3600 2452 3528 2438 3149 2558 3891Australia 681 1482 2138 3039 2077 2987 2052 2634 2161 3288New Zealand 112 227 347 490 341 497 346 460 348 526EUROPE 21865 32509 46252 64522 41817 56796 42295 57000 46541 69808EU-25 20200 29793 41548 57126 38387 51525 38350 50535 41803 61829Austria 168 439 539 676 519 640 517 624 542 740Finland 684 236 599 747 581 720 578 707 602 807France 3345 4414 6277 8452 6050 8089 5833 7390 6317 9175Germany 5594 6980 9159 11782 8814 11139 8660 10317 9247 12800Italy 2787 3700 4913 6331 4704 5899 4592 5471 4937 6823Russian Federation 862 754 1456 2505 916 1611 1104 1952 1467 2705Spain 1460 2560 3062 4088 2953 3894 2887 3642 3076 4471Sweden 442 139 101 126 97 119 100 124 101 136United Kingdom 3263 4912 6987 9673 6725 9225 6521 8505 7021 10436DEVELOPED, ALL 56953 75652 97748 121999 91048 111767 90249 106709 98599 132751DEVELOPING, ALL 14461 33445 72230 132851 51127 87923 59645 103629 72555 141256WORLD 71414 109097 169978 254850 142175 199689 149894 210338 171154 2740061 Observations derived from FAO (2009), projections obtained with the <strong>Global</strong> Forest Products Model.109
Table 44—Observed and projected other paper and paperboard consumption (thousand mt) for world regions andselected countries in the <strong>Global</strong> Forest Products Model 1Observed Scenario A1B Scenario A2 Scenario B2Scenario A1B-Low Fuelwood1992 2006 2030 <strong>2060</strong> 2030 <strong>2060</strong> 2030 <strong>2060</strong> 2030 <strong>2060</strong>AFRICA 2488 3900 7627 12224 5431 7676 6457 10990 7659 12455Egypt 340 705 1390 2426 1005 1637 1083 1931 1396 2455Nigeria 30 151 348 682 243 412 294 656 350 697South Africa 1095 1633 3075 4116 2190 2503 2814 4119 3091 4204NORTH/CENTRAL AMERICA 50491 65107 79347 94474 74185 86497 72438 78973 79768 97085Canada 2952 3933 5024 5709 4810 5297 4761 4845 5040 5819Mexico 2136 5475 8283 11257 5949 7288 6386 8800 8290 11474United States of America 44723 54411 63619 73866 61619 71298 59313 62113 64011 76110SOUTH AMERICA 5516 6408 12749 17343 9359 11866 10000 13999 12793 17683Argentina 737 1264 1950 2540 1415 1697 1502 1975 1955 2595Brazil 2799 2351 6453 8643 4668 5672 4970 6652 6482 8817Chile 326 749 1189 1535 905 1150 992 1425 1193 1566ASIA 41748 92295 152650 217208 112763 146636 129286 164532 152779 220332China 15554 50578 90033 131913 64675 89769 75894 100275 90050 133594India 1168 2065 4611 8133 3030 4279 3873 6033 4610 8126Indonesia 1255 3777 7971 12586 5311 7095 6359 8471 7986 12868Japan 15157 15917 17410 18295 16596 16647 16147 15086 17430 18677Korea, Republic of 3610 5994 9173 10155 6141 5587 7593 7197 9199 10425Malaysia 932 1370 2232 2874 1551 1747 1848 2077 2231 2907OCEANIA 1658 2271 2843 3280 2737 3107 2730 2800 2858 3345Australia 1269 1797 2237 2567 2164 2443 2139 2164 2249 2619New Zealand 385 439 526 608 517 600 524 557 529 620EUROPE 38327 57409 66523 77121 58208 63652 60047 66088 66721 78754EU-25 32746 49474 54793 61501 50366 53459 50592 53073 54953 62806Austria 880 1685 1672 1739 1606 1583 1602 1548 1678 1784Finland 642 1304 1165 1191 1126 1108 1121 1091 1170 1217France 4946 5639 6371 6967 6134 6453 5917 5913 6390 7124Germany 8245 11797 11658 12392 11201 11353 11003 10547 11720 12632Italy 4406 7162 7861 8280 7506 7479 7340 6967 7876 8449Russian Federation 3831 4504 6930 9343 4433 5914 5301 7120 6955 9539Spain 2965 5945 5803 6402 5582 5854 5462 5504 5811 6555Sweden 1147 1303 1462 1496 1407 1373 1448 1418 1468 1527United Kingdom 4675 4825 5910 6645 5670 6146 5507 5692 5917 6780DEVELOPED, ALL 104239 136131 159341 183559 146737 163244 146465 156001 160001 188106DEVELOPING, ALL 35988 91260 162398 238092 115947 156189 134492 181380 162576 241548WORLD 140226 227391 321739 421650 262683 319433 280957 337381 322577 4296541 Observations derived from FAO (2009), projections obtained with the <strong>Global</strong> Forest Products Model.110
Table 45—Observed and projected newsprint net trade (thousand mt) for world regions and selected countries in the<strong>Global</strong> Forest Products Model 1 Observed Scenario A1B Scenario A2 Scenario B2Scenario A1B-Low Fuelwood1992 2006 2030 <strong>2060</strong> 2030 <strong>2060</strong> 2030 <strong>2060</strong> 2030 <strong>2060</strong>AFRICA -36 -351 -692 -1436 -562 -953 -608 -1236 -694 -1476Egypt -73 -127 -257 -612 -216 -371 -232 -464 -257 -622Nigeria -5 -24 -48 -117 -39 -86 -50 -121 -49 -116South Africa 116 41 26 10 26 10 26 10 26 10NORTH/CENTRAL AMERICA 2691 1890 6936 6722 3531 3278 5728 6493 8069 13231Canada 8664 6653 13305 11268 9861 9852 11379 12179 10896 15053Mexico -133 -214 -385 -183 -238 -128 -344 -237 -385 -487United States of America -5732 -4337 -5653 -3961 -5872 -6209 -5053 -5132 -2104 -903SOUTH AMERICA -341 -544 -723 -1687 -119 -687 -299 -1032 -867 -1430Argentina -96 -70 -32 -13 -32 -13 -32 -13 -32 -13Brazil -71 -409 -468 -999 -168 -335 -198 -484 -486 -651Chile 103 260 351 141 473 201 366 147 230 92ASIA -2290 -2012 -4499 -2937 -2540 -1375 -4076 -3302 -4790 -8000China -460 -375 -382 -1 -311 81 -354 10 -442 -107India -246 -968 -1593 -1165 -431 -173 -1593 -1489 -1593 -3872Indonesia 57 261 114 46 114 46 114 46 106 20Japan -452 -118 -612 -245 -657 -351 -613 -320 -612 -914Korea, Republic of -200 583 542 1309 820 1583 594 1155 345 874Malaysia -223 -87 -329 -319 -329 -424 -329 -489 -329 -691OCEANIA 111 -55 104 188 -6 12 -1 26 45 27Australia -165 -270 -149 -60 -153 -61 -157 -63 -153 -61New Zealand 278 215 259 239 146 59 159 77 204 82EUROPE 162 950 -1070 -794 -247 -219 -688 -892 -1706 -2297EU-25 -643 -622 -1607 -1154 -1074 -706 -1329 -1047 -2202 -2293Austria 41 157 75 23 75 30 75 30 75 30Finland 1144 431 217 87 215 86 216 87 217 87France -72 205 101 41 101 41 101 41 101 41Germany -836 -248 -99 34 -99 132 -99 86 -99 -40Italy -477 -613 -559 -224 -587 -270 -506 -203 -697 -544Russian Federation 89 1295 633 626 694 541 686 502 633 343Spain -334 -106 -224 -8 -146 -59 -208 -54 -460 -262Sweden 1605 1758 877 352 877 301 877 318 877 278United Kingdom -1177 -1359 -736 -201 -681 -210 -748 -237 -880 -343DEVELOPED, ALL 2763 2900 5717 5945 2866 2805 4765 5467 6158 10413DEVELOPING, ALL -2466 -3022 -5661 -5889 -2809 -2749 -4709 -5410 -6101 -10357WORLD 297 -122 56 56 56 56 57 57 57 561 Observations derived from FAO (2009), projections obtained with the <strong>Global</strong> Forest Products Model.111
Table 46—Observed and projected printing and writing paper net trade (thousand mt) for world regions and selectedcountries in the <strong>Global</strong> Forest Products Model 1Observed Scenario A1B Scenario A2 Scenario B2Scenario A1B-Low Fuelwood1992 2006 2030 <strong>2060</strong> 2030 <strong>2060</strong> 2030 <strong>2060</strong> 2030 <strong>2060</strong>AFRICA -435 -691 -1974 -2349 -928 -1033 -1397 -1693 -1941 -2828Egypt -170 -225 -696 -552 -95 -20 -391 -126 -662 -1012Nigeria -65 -138 -383 -383 -264 -196 -322 -330 -384 -257South Africa -82 99 28 6 28 6 29 6 28 6NORTH/CENTRAL AMERICA -977 -4199 1402 5747 328 1242 2512 4367 1398 8500Canada 1434 3632 5834 9713 3287 3519 4504 6892 5889 13519Mexico -153 -864 -1921 -2623 -639 -565 -996 -1920 -1975 -4129United States of America -1887 -6620 -1895 -735 -1895 -1277 -515 -55 -1895 -237SOUTH AMERICA 125 -292 -976 -1810 -676 -1237 -736 -1567 -965 -2001Argentina -96 -155 -39 -8 -39 -8 -39 -8 -39 -8Brazil 442 503 172 36 172 36 179 37 172 36Chile -72 -184 -298 -476 -225 -363 -247 -455 -299 -512ASIA -1554 478 -9634 -10281 -3700 -5118 -6753 -7053 -9598 -27328China -856 470 -3731 -2868 -56 -12 -2042 -1184 -3731 -18683India 4 -118 -69 -14 -34 -7 -46 -10 -75 -16Indonesia 157 2724 788 164 813 169 740 154 797 166Japan 170 -239 -110 4 -110 -23 -110 -23 -110 4Korea, Republic of 53 1442 453 94 445 92 418 87 451 94Malaysia -123 -1452 -2573 -2441 -1674 -1082 -2068 -1529 -2579 -2261OCEANIA -478 -1059 -664 -611 -669 -602 -681 -570 -666 -597Australia -377 -819 -269 -50 -294 -61 -295 -55 -269 6New Zealand -95 -227 -347 -490 -341 -497 -346 -460 -348 -526EUROPE 2819 7746 13994 11452 7794 8897 9205 8666 13921 26402EU-25 2872 8080 14604 10776 8062 7931 9682 8186 14530 25810Austria 1378 2181 2308 673 1413 485 1649 572 2108 1170Finland 4295 8922 12547 10181 8494 9210 9571 9364 12327 24872France -397 -1223 -333 -69 -340 -71 -336 20 -333 171Germany -421 1371 1071 223 394 82 457 95 1224 272Italy -390 -537 -164 -34 -171 -36 -166 -35 -164 -34Russian Federation -17 -151 -21 37 -21 37 -21 37 -21 80Spain -610 -967 -270 -56 -310 -64 -313 -65 -272 -57Sweden 1363 3274 3513 1868 2336 486 2793 723 3815 1925United Kingdom -1672 -3655 -2446 -509 -2531 -526 -2459 -511 -2534 -527DEVELOPED, ALL 1914 3322 16985 19579 8302 10353 12274 14664 16969 38833DEVELOPING, ALL -2414 -1339 -14837 -17431 -6154 -8204 -10125 -12515 -14820 -36684WORLD -500 1983 2148 2149 2148 2149 2149 2149 2148 21491 Observations derived from FAO (2009), projections obtained with the <strong>Global</strong> Forest Products Model.112
Table 47—Observed and projected other paper and paperboard net trade (thousand mt) for world regions and selectedcountries in the <strong>Global</strong> Forest Products Model 1Observed Scenario A1B Scenario A2 Scenario B2Scenario A1B-Low Fuelwood1992 2006 2030 <strong>2060</strong> 2030 <strong>2060</strong> 2030 <strong>2060</strong> 2030 <strong>2060</strong>AFRICA -524 -1114 -1705 -1178 -964 -643 -1133 -931 -1808 -1268Egypt -197 -345 -564 -142 -274 -69 -296 -74 -643 -238Nigeria -22 -133 -245 -89 -122 -31 -171 -43 -246 -65South Africa 40 126 99 25 99 25 99 25 99 25NORTH/CENTRAL AMERICA 4183 2536 5413 3308 4502 3369 6057 4410 12225 28188Canada 1135 1020 5134 3941 4621 3904 4651 4755 4931 19952Mexico -145 -1605 -602 -141 -498 -125 -479 -120 -651 -137United States of America 3732 4077 1989 427 1185 255 2783 640 9102 9373SOUTH AMERICA -51 -47 -91 -83 -9 -48 3 -55 -122 -83Argentina -163 -294 -101 -25 -101 -25 -101 -25 -101 -25Brazil 494 796 276 69 287 72 307 77 276 69Chile -61 19 1 -11 1 -11 1 -11 1 0ASIA -2816 -6287 -22495 -13955 -16197 -12056 -20917 -16047 -23564 -48796China -1626 -2418 -18293 -12780 -14646 -11309 -18293 -15148 -18293 -47041India -20 -33 -16 -4 -17 -4 -14 -3 -16 -4Indonesia 105 192 55 14 55 14 55 14 55 14Japan 302 -148 -40 -10 -40 -10 -40 -10 -40 -10Korea, Republic of 241 341 366 646 885 223 678 476 199 613Malaysia -497 -687 -448 -99 -277 -70 -389 -98 -587 -148OCEANIA -34 447 1723 683 1226 399 1258 667 954 1325Australia 13 346 1143 455 936 333 878 529 463 927New Zealand -43 135 656 328 343 127 445 213 568 499EUROPE 419 3515 15881 9951 10167 7702 13458 10683 11040 19360EU-25 4 3178 14827 9305 9103 7088 12414 10017 10025 17023Austria 431 484 479 280 210 56 340 181 210 254Finland 2274 3093 5515 2105 3989 1591 4757 2210 4231 5519France -873 67 1193 1702 693 347 1080 1809 94 1087Germany -1426 148 5837 3748 3232 4265 4953 4780 4714 8593Italy -864 -533 -248 -62 -248 -62 -248 -62 -248 -62Russian Federation 146 336 125 31 249 63 173 44 125 150Spain -487 -1020 -303 -76 -316 -79 -310 -78 -303 73Sweden 3302 4809 3609 907 2962 745 3178 799 2897 873United Kingdom -1806 -1724 -510 333 -518 -130 -511 -59 -510 146DEVELOPED, ALL 5413 8765 24526 14953 17154 12246 22087 16715 25753 49901DEVELOPING, ALL -4236 -9716 -25801 -16227 -18429 -13521 -23362 -17990 -27029 -51175WORLD 1177 -951 -1275 -1275 -1275 -1275 -1275 -1274 -1275 -12741 Observations derived from FAO (2009), projections obtained with the <strong>Global</strong> Forest Products Model.113
Table 48—Observed and projected value added to wood and fiber input in forest industries (million 1997$) for worldregions and selected countries in the <strong>Global</strong> Forest Products Model 1Observed Scenario A1B Scenario A2 Scenario B2Scenario A1B-Low Fuelwood1992 2006 2030 <strong>2060</strong> 2030 <strong>2060</strong> 2030 <strong>2060</strong> 2030 <strong>2060</strong>AFRICA 2190 3354 5426 9510 4269 7292 4889 9298 5450 10370Egypt 85 216 503 1581 557 1235 500 1422 487 1479Nigeria 165 18 95 862 89 587 96 898 97 1004South Africa 891 1694 2308 2667 1651 1749 2114 2836 2326 2946NORTH/CENTRAL AMERICA 75808 99318 108239 102096 97172 75687 101048 81589 114539 127746Canada 9782 19232 25313 26068 21234 26472 22180 26777 23472 33070Mexico 1754 3878 5080 5646 4322 4953 4233 4510 5112 6064United States of America 63849 75433 76573 68497 70601 42829 73554 48601 84701 86664SOUTH AMERICA 6070 15085 18998 20995 16185 20310 16621 21046 19742 24968Argentina 759 1552 2395 2628 1864 1854 1923 2135 2462 2847Brazil 3482 8803 11613 12610 10090 13305 10330 13151 12325 16002Chile 664 2505 2262 2155 2095 2074 2097 2218 2243 2304ASIA 46381 116149 145313 180137 109543 126402 120737 138433 143098 169561China 3870 54491 74152 99035 53715 69835 60454 76063 73979 87886India 4925 5118 8526 12539 6012 7086 7238 9453 8553 12466Indonesia 4169 6715 7406 8153 5416 4925 6132 5679 7463 8619Japan 23665 24747 23614 20947 21038 19012 20776 17250 22595 20797Korea, Republic of 3750 7999 9008 8456 6409 4824 7402 5977 8555 8116Malaysia 1714 3808 3054 3723 2389 2624 2659 2877 3019 3968OCEANIA 2376 4561 5752 5746 5196 4881 5244 4815 5409 5893Australia 1590 2597 3831 3818 3595 3698 3550 3403 3561 4487New Zealand 733 1938 1879 1865 1569 1131 1660 1356 1810 1340EUROPE 63837 106127 112359 112033 95352 107124 99211 105603 109398 125951EU-25 49535 90043 95107 93073 82224 91554 84717 88693 92190 105161Austria 3086 5152 4114 2707 3291 2850 3486 2509 3755 3175Finland 5933 11101 12829 9606 9788 10072 10671 9482 11856 16352France 6527 9230 10425 9547 9763 8821 9681 8791 9860 10361Germany 12711 21915 21089 15896 18375 15195 19115 15055 20719 19664Italy 4394 7545 7584 7257 6993 6572 6726 5893 7353 7138Russian Federation 10010 8653 9038 9583 6698 7478 7352 7693 9101 10364Spain 2647 6502 6498 6195 6022 5851 5892 5477 6288 6635Sweden 4951 9427 7378 7402 6852 12172 7210 9189 7771 6650United Kingdom 3578 4703 7207 8462 6613 7793 6428 7245 6910 8548DEVELOPED, ALL 164502 232137 246698 237173 215639 202955 223719 206969 248655 276713DEVELOPING, ALL 32160 112455 149389 193344 112078 138743 124031 153816 148981 187777WORLD 196662 344593 396087 430517 327717 341697 347750 360784 397637 4644901 Observations derived from FAO (2009), projections obtained with the <strong>Global</strong> Forest Products Model.114
APPENDIX A<strong>Global</strong> Forest Products Model formulationThe <strong>Global</strong> Forest Products Model (GFPM) has a static phasethat computes the spatial economic equilibrium among theforest sectors of countries in a given year, and a dynamicphase that describes the changes in the conditions of thisequilibrium over time.Spatial global equilibriumFor each projected year, the GFPM computes a spatialequilibrium by maximizing the consumers and producerssurplus:D ikmax Z = Σ Σ ∫ P ik (D ik ) dD ik - Σ Σ ∫ P ik (S ik ) dS iki k 0 i k 0Y ik [1]- Σ Σ ∫ m ik (Y ik ) dY ik - Σ Σ ∫ c ijk T ijki k 0i j kwhere: i,j = country, k = product, P = price in U.S. dollars ofconstant value, D = final product demand, S = raw materialsupply, Y = quantity manufactured, m = manufacturing cost,T = quantity transported, and c = cost of transportation,including tariff. All variables refer to a specific year.End-product demandPD ikik = D * ik ( ———) δ ik[2]P ik-1where: D* = current demand at last year’s price, P -1 = lastyear’s price, and δ= price elasticity of demand. As shown inthe section on market dynamics, below, D* depends on lastyear’s demand, and the growth of GDP in the country. In thebase year, D* is equal to the observed base-year consumption,and P -1 is equal to the observed base-year price.Primary product supplyPS ikik = S ik ( ———) λ ik[3]P ik-1where: S* = current supply at last year’s price, and λ = priceelasticity of supply. As shown in the section on marketdynamics, below, S* depend on last year’s supply, and onexogenous or endogenous supply shifters. In the base year,S* is equal to the base-year supply, and P -1 is equal to theobserved base year price.Total forest drainS i = (S ir + S in - Θ i S if ) μ I [4]r = industrial roundwood,n = other industrial roundwood,f = fuelwood,S ik0 ≤ Θ ≤ 1 = fraction of fuelwood that comes from the forest,μ ≥ 1 = ratio of drain to harvest.S i ≤ I iI i = forest stock.Material balanceFor each product and country, demand equals supply.Σ T jik + S ik + Y ik - D ik - Σ a ikn Y in - Σ T ijk Y in = 0 i, k [5]where: a ikn = input of product k per unit of product n.Trade Inertia constraints are used to dampen the annualchanges in trade:T L ijk ≤ T jik ≤ T U ijk [6]where the superscripts L and U refer to a lower bound, andupper bound, respectively.PricesThe shadow prices of the material balance constraints [5] givethe market-clearing prices for each commodity and country.Manufacturing costManufacturing is represented by activity analysis, withinput-output coefficients and a manufacturing cost. Themanufacturing cost is the marginal cost of the inputs notrecognized explicitly by the model (labor, energy, capital, etc.);Y ikm = m * ik ( ——— ) s ik[7]Y ik-1where: m* = current manufacturing cost, at last year’s output,and s = elasticity of manufacturing cost with respect to output.As shown in the next section, m* depend on last year’smanufacturing cost, and on the exogenous rate of changeof manufacturing cost. In the base year, m* is equal to theobserved base-year manufacturing cost and Y ik,-1 is equal tothe observed base-year quantity manufactured.Transport costThe transport cost per unit of volume for commodity k fromcountry i to country j in any given year is given by:C ijk = f ijk + t I jk( f ijk + P ijk ) [8]where: c = transport cost, per unit of volume, f = freight cost,per unit of volume, t I = import ad-valorem tariff, and P -1 isequal to the previous year world export price.115
Market dynamicsUnless otherwise indicated, the following variables refer toone country, one commodity, and one year.Demand shiftsD* = D -1 (1 + a y g y + a 0 ) [9]g y = GDP annual growth rate, a y = elasticity with respect toGDP, a 0 = annual trend.Supply shiftsThe supply of fuelwood and industrial roundwood shifts overtime with the changes in growing stock:S* = S -1 (1 + β I g I ) for k = r, n, f [10]where: g I = annual rate of change of forest stock (endogenous,see below), and β = elasticity.The supply of waste paper and other fiber pulp shifts withGDP growth:S* = S -1 (1 + β y g y ) [11]Changes in forest area and forest stockA = (1 + g a ) A -1 [12]where: A = forest area, and g a = annual rate of forest areachange equation [9] and the annual rate of forest area change,g a defined by:g a = a 0 + a 1 y’ + a 2 y’ 2 for y’ < = y’*, else g a = 0 [13]Where, for each country, α 0 is calibrated so that in the baseyear the observed g a is equal to the g a , predicted by [15] giventhe income per capita y’.y’ = income per capita, predicted from:y’ = (1 + g y’ ) y’ -1 [14]y’* is defined by g a = a 0 + a 1 y’* =+ a 2 y’* 2 = 0 [15]and y’*>-a 1 ∕2a 2Forest stock evolves over time according to a growth-drainequation:I = I -1 + G -1 − S -1 [16]where G = ( g a + g u ) I is the periodic change of forest stockwithout harvest, g u = periodic rate of forest growth on a givenarea, without harvest 1 .The annual rate of forest growth, g u , is defined by:Ig u = γ 0 ( ——) σ [17]Awhere σ is negative, so that g u decreases with stock per unitarea. For each country, γ 0 is calibrated so that in the base yearthe observed g u is equal to the g u predicted by [17] given thestock per unit area, I/A.1 The forest stock, I, is: I t = U t A t where A t is the area and U t is the stock perunit area (stock density). Without harvest, the stock annual growth rate is dI/ I = dU / U + dA / or g I = g u + g a . Thus, the level of stock, without harvest,changes according to I t = I t-1 (1 + g I ) = I t-1 (1 + g u + g a ). With a harvest S t-1from t-1 to t this becomes I t = I t-1 (1 + g u + g a ) − S t-1 . With the above notations,I t-1 (1 + g u + g a ) = G t-1 the change in forest stock without harvest, which leadsto equation [18].116The annual rate of change of forest stock net of harvest, usedin equation [10] is then:I − Ig -1I = ——— [18]I -1Changes in manufacturing coefficients and costsThe input-output coefficients a in equation [5], may changeexogenously over time, for example to reflect increasing use ofrecycled paper in paper manufacturing:a = a -1 + ∆a [19]where ∆a = annual change in input-output coefficient.The manufacturing cost function shifts exogenously overtime:m* = m -1 (1 + g m ) [20]where g m = the exogenous rate of annual change inmanufacturing cost.Changes in transport costThe transport cost function [8] shifts exogenously over timeaccording to the recursion:c* = c -1 + ∆f + t I ( f + P -1 ) − t I -1 ( f -1 + P -2 )with:f = f -1 + ∆f, t = t -1 + ∆t [21]where Δf and Δt are periodic changes in freight cost andtaxes, respectively.Changes in trade inertia boundsT L = T -1 ( 1 − ε ) p [22]T U = T -1 ( 1 + ε ) pε = absolute value of maximum annual relative change in tradeflow (exogenous).Linear approximation of demand, supply,and manufacturing costFor example, consider a demand equation such as [2].Omitting the subscripts for region and product, the inversedemand equation in any given year is:DP = P -1 ( ——) D*1/σThe linear approximation is:PP = a + bD with a = P -1-1 − bD* and b = —— for D* ≥ 1, elseσD*Pb = —— -1for D* ≥ 1, and a = P -1 [23]σb = 0 if σ = 0. The same method is used for the supply, and themanufacturing cost equations.
APPENDIX BGross Domestic Product growth assumptionsThe national population projections were taken directlyfrom the Intergovernmental Panel on Climate Change(IPCC) scenarios. National Gross Domestic Product (GDP)projections were obtained by first predicting national GDPper capita and then multiplying by national population, exceptfor the United States for which future GDP growth rateswere established separately (USDA Forest Service, 2012).Wanted was GDP per capita from 2006 to <strong>2060</strong> for each of theother 179 countries used in the GFPM. Given were the GDPper capita of each country in 2006, and the GDP per capitaprojections of the IPCC for each scenario A1B, A2 and B2.The main assumption was that the GDP per capita of thedifferent countries would converge during the period 2006 to<strong>2060</strong> (Sala-i-Martin 2006). Specifically by the year 2100, thatis 40 years after the time horizon of the study, the GDP percapita of all the countries within a region would be the same,and equal to the average regional GDP per capita predicted byeach IPCC scenario.Figure B1 shows the projections from 2006 to 2100 forselected countries of Asia, for scenario A1B. Only the years2006 to <strong>2060</strong> were used in this study.Algebraically, let y it be GDP per capita in country i and yeart, y Rt the GDP per capita in region R in year t,ε, t=0 the baseyear, 2006, T=2100-2006 the number of years from the base tothe horizon.The initial ratio of country to region GDP per capita was:yr i0i0 = —— y R0Logarithmic convergence of this ratio was obtained by:rr iTi0 = r i,t-1 (——) 1/T for t = 1 to T,r i0where r iT was the target ratio at the horizon, r iT was equal to 1in this application.Then:y it = r it y Rt for t = 1 to T.A secondary assumption was that the ratio of the GDP percapita of a particular country to the GDP per capita of itsregion would evolve from its observed value in <strong>2060</strong> to theassumed value of 1.0 in 2100 according to a logarithmicdifference equation described below.10000010000GDP ($/capita)10001001012000 2020 2040 <strong>2060</strong> 2080 2100YearASIA China Korea, Rep IndiaFigure B1 —Projection of GDP per capita in China, the Republic of Korea,and India, given the IPCC projection of GDP per capita for Asia.117
APPENDIX CFuelwood demand assumptionsFor fuelwood demand the objective was to match the fuelwoodconsumption from 2006 to <strong>2060</strong> projected with the <strong>Global</strong>Forest Products Model (GPFM) for each of the 180 countries,and the Intergovernmental Panel on Climate Change (IPCC)assumptions regarding the future world demand for biofuels.Given were the fuelwood consumption of each countryin 2006, the assumptions on GDP growth by country(see Appendix B), and the IPCC projections of biofuelconsumption in scenarios A1B, A2 and B2.It was assumed that from 2006 to <strong>2060</strong> the world fuelwoodconsumption would grow by the same factor as the worldbiofuel demand predicted by the IPCC, i.e., approximately 5.5times for scenario A1B, 2.7 times for scenario A2 and 2.9 timesfor scenario B2. Another assumption was that the internationalfuelwood consumption would converge in the sense that by<strong>2060</strong> the ratio of national to world fuelwood consumption wasequal to the ratio of national GDP to world GDP.An initial estimate of the exogenous annual growth rate offuelwood demand, ri 0 , to cause a country to reach c i,60 was:cr 0 i,60 —ii = (c——) 54 − 1i,60Due to the price change, this growth rate led to a consumptionlevel in <strong>2060</strong>, c 0 i,60 , generally different from c i,60 . Then, the rateof shift of demand was revised to ri 1 , to achieve the target, c i,60 :cr 1 i,60 —ii = ( ——) 54 (1 + ri 0 ) − 1c i,600A new GFPM projection was then computed with the demandrate of shift ri. 1 Repeating this gave GFPM projections thatconverged to the target fuelwood consumption levels c i,60 .These assumptions gave the national fuelwood consumptionsin <strong>2060</strong> and the annual growth rates of demand neededfrom 2006 to <strong>2060</strong> at constant price to achieve this <strong>2060</strong>consumption.This demand growth rate applied to the GFPM led to a worldconsumption that differed from the IPCC level due to theendogenous change in prices. This gap was decreased byadjusting the national demand growth rates and running theGFPM again. This was repeated until the IPCC level of globalconsumption was nearly achieved.The algebraic procedure can be summarized as follows. Thegoal was fuelwood consumption growing to the same fractionof each country’s GDP in <strong>2060</strong>.c ∑ c j,60—— i,60 j= ——— , iy i,60 ∑ y j,60jWhere c i,60 was fuelwood consumption in country i in <strong>2060</strong>,and y i,60 is the gross domestic computed above. The worldfuelwood consumption in <strong>2060</strong> was:∑ c j,60 = g ∑ c j,60jWhere g was the growth of biofuel consumption from 2006 to<strong>2060</strong> predicted by the IPCC. Thus, the fuelwood consumptionin <strong>2060</strong> for each country was:yc j,60i,60 = —— g ∑ c∑ y j,60j,60118jj
APPENDIX DTechnical change assumptionsFor wood products other than paper and paperboard,manufacture is represented in the <strong>Global</strong> Forest ProductsModel with an input of industrial roundwood and all otherinputs are covered by the manufacturing cost.To minimize the effects of statistical errors, the best currenttechnology was deducted from the data of the major producingcountries only, those that produced more than 5 percent of theglobal output in 2006.Among these countries, the country with the bestmanufacturing technology, Bk, was the country with the leasttotal unit cost of production:p w a Bk,k + m Bk,k = min (p w a ik + m i,k )iWhere:p w world price of industrial roundwood in 2006a i,k m 3 of industrial roundwood per m 3 of product k for country i,m i,k manufacturing cost excluding wood input per m 3 ofproduct k.a Bk,k best current technology input-output coefficient forproduct k,m Bk,k best current technology manufacturing cost for product k.This best technology was assumed to improve further by<strong>2060</strong>, to the levels a 60,k and m 60,k . Then, the input-outputcoefficient and manufacturing cost of each country convergedfrom their value in 2006 to these best <strong>2060</strong> values at aconstant annual rate.For paper and paperboard the same procedure was applied,with the assumption that the least expensive input, wastepaper, increased 2006 to <strong>2060</strong> and the most expensive inputs,chemical pulp and other fiber pulp decreased from by the sameproportion, while mechanical pulp compensated to change thetotal fiber input to a common total.119
The Forest Service, United States Department of Agriculture (USDA), isdedicated to the principle of multiple use management of the Nation’sforest resources for sustained yields of wood, water, forage, wildlife,and recreation. Through forestry research, cooperation with the Statesand private forest owners, and management of the National Forests andNational Grasslands, it strives—as directed by Congress—to provide increasinglygreater service to a growing Nation.The USDA prohibits discrimination in all its programs and activities on the basis of race,color, national origin, age, disability, and where applicable, sex, marital status, familialstatus, parental status, religion, sexual orientation, genetic information, political beliefs,reprisal, or because all or part of an individual’s income is derived from any publicassistance program. (Not all prohibited bases apply to all programs.) Persons withdisabilities who require alternative means for communication of program information(Braille, large print, audiotape, etc.) should contact USDA’s TARGET Center at(202) 720-2600 (voice and TDD).To file a complaint of discrimination, write to USDA, Director, Office of Civil Rights, 1400Independence Avenue, SW, Washington, D.C. 20250-9410, or call (800) 795-3272(voice) or (202) 720-6382 ( TDD). USDA is an equal opportunity provider and employer.Buongiorno, Joseph; Zhu, Shushuai; Raunikar, Ronald; Prestemon, Jeffrey P.2012. <strong>Outlook</strong> to <strong>2060</strong> for world forests and forest industries: a technicaldocument supporting the Forest Service 2010 RPA assessment. Gen. Tech.Rep. SRS-151. Asheville, NC: U.S. Department of Agriculture Forest Service,Southern Research Station. 119 p.Four RPA scenarios corresponding with scenarios from the Third and FourthAssessments of the Intergovernmental Panel on Climate Change were simulated withthe <strong>Global</strong> Forest Products Model to project forest area, volume, products demand andsupply, international trade, prices, and value added up to <strong>2060</strong> for Africa, Asia, Europe,North America, Oceania, South America, and selected countries. Scenario A1B presentsa 5.5-fold increase in world fuelwood use that leads to high prices of fuelwood andindustrial roundwood, driven by especially strong demand in Asia for large imports fromSouth America and Europe. World roundwood consumption reaches 11.2 billion m 3 in<strong>2060</strong>, exceeding the increment of forests, particularly in Asia. Even under scenarios A2and B2, the harvest in Asia is unsustainable. However, scenario A1B and a low fuelwooddemand lead to a global harvest of 3.6 billion m 3 only and to a sustainable forest volume.The world consumption of manufactured wood products grows modestly under mostscenarios, with slight changes in prices. Consumption and value added in industriesincreases more rapidly in Asia, due to the fast economic growth of China and India inall scenarios. As a result, Asia is a large importer of industrial roundwood from SouthAmerica and Europe and of paper and paperboard from Europe and North America.Keywords: Energy, forecasting, <strong>Global</strong> Forest Products Model, industries,Intergovernmental Panel on Climate Change, markets, policy.How do you rate this publication?Scan this code to submit your feedbackor go to www.srs.fs.usda.gov/pubevalYou may request additional copies of this publication by email at pubrequest@srs.fs.usda.gov
United States Department of AgricultureForest ServiceSouthern Research StationGeneral Technical Report SRS-151April 2012