2 Overview 6 Union Pacific Franchise 10 System Map 12 Agricultural
2 Overview 6 Union Pacific Franchise 10 System Map 12 Agricultural
2 Overview 6 Union Pacific Franchise 10 System Map 12 Agricultural
- No tags were found...

Create successful ePaper yourself
Turn your PDF publications into a flip-book with our unique Google optimized e-Paper software.
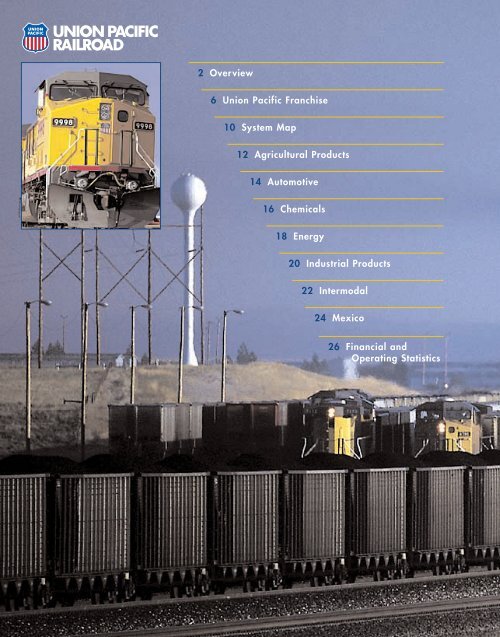
2 <strong>Overview</strong>6 <strong>Union</strong> <strong>Pacific</strong> <strong>Franchise</strong><strong>10</strong> <strong>System</strong> <strong>Map</strong><strong>12</strong> <strong>Agricultural</strong> Products14 Automotive16 Chemicals18 Energy20 Industrial Products22 Intermodal24 Mexico26 Financial andOperating Statistics
31 Highlights32 <strong>Overview</strong>34 Selected Operating Statistics35 Financial Statements
UNION PACIFIC RAILROADOVERVIEW<strong>Union</strong> <strong>Pacific</strong> is the largest railroad in North America, covering 23 statesacross the western two-thirds of the United States. The merger of <strong>Union</strong> <strong>Pacific</strong>,Southern <strong>Pacific</strong> and Chicago and North Western created a strategicallyadvantageous route structure that serves customers in critical and fast-growingof <strong>Union</strong> <strong>Pacific</strong> and Southern <strong>Pacific</strong>routes in the South and Southwest produceda single-line rail network servingthe rapidly growing population inthis part of the country. Leveraging thestrengths of this broad franchiseallows <strong>Union</strong> <strong>Pacific</strong> to improve customerservice, grow market share andachieve improved financial returns.markets. That network, combined with a well-balanced and diverse trafficmix, makes <strong>Union</strong> <strong>Pacific</strong> the premier rail franchise in North America.A key strength of the franchise is access to the coal fields in the Powder RiverBasin (PRB) region of northeastern Wyoming. Growth of PRB coal tonnage hauledby UP has averaged 8% over the past seven years, due to its low-production costand low-sulfur content. UP’s rail lines in the Midwest and Plains states providedirect routes from major grain-producing areas to domestic markets, Mexico andto ports of export in the Gulf Coast and <strong>Pacific</strong> Northwest. <strong>Union</strong> <strong>Pacific</strong> also hasbroad coverage of the large chemical-producing areas along the Gulf Coast.To handle growing east-west intermodal and automotive traffic, <strong>Union</strong> <strong>Pacific</strong>has competitive long-haul routes between all major West Coast ports and easterngateways. In addition to directly serving all six major gateways to Mexico, theRailroad has the fastest and most direct route to and from Mexico. The mergerFINANCIAL REVIEWFinancial performance improvedsignificantly in 1999, as the Railroadrebounded from the effects of theservice difficulties of late 1997 and1998. Commodity revenue grew 9%,from customers returning businessto the Railroad and from generalgrowth, particularly in coal, intermodaland automobile shipments.Service improvements drove operatingexpenses down 7%, reflectingincreased system velocity and areduction in service failures. Netincome from continuing operationsgrew to $754 million in 1999,capping six consecutive quartersUNION PACIFIC CORPORATIONFinancial Summary(excluding Overnite and Skyway)Quarterly Operating Ratio1999 1998 1997Operating Revenue (millions of dollars) $<strong>10</strong>,211 $9,368 $9,981Operating Income (millions of dollars) $1,784 $348 $1,144(percent)<strong>10</strong>3.098.8<strong>10</strong>6.1Operating Ratio 82.5% 96.3% 88.5%91.289.485.8Total Carloads (thousands) 8,556 7,998 8,453Average Employees 52,539 53,<strong>12</strong>1 52,58783.080.6 80.8Capital Investments* (millions of dollars) $1,942 $2,392 $2,297Q497Q198Q298Q398Q498Q199Q299Q399Q499*includes long-term operating leasesCustomer Claims Provision2
Power of UP <strong>Franchise</strong>The power of the UP rail franchiseresults from a system of strategicroutes, a diverse traffic mix andaccess to key ports, cities andgateways. Strength also lies in UP’sability to directly serve the fastestgrowing regions of the country.Annual Population Growth.0% to .25%.25% to .75%.75% to 1.25%>1.25%of improvement. Capital spendingdecreased to approximately $1.9billion, as merger-related spendingbegan to taper off.For <strong>Union</strong> <strong>Pacific</strong> Corporation,free cash flow before dividends grewto $255 million in 1999, a $1.6billion improvement over 1998. Thelease-adjusted debt-to-capital ratioimproved from 58.7% at the end of1998 to 56.9% at the end of 1999.<strong>Union</strong> <strong>Pacific</strong>Former SPFormer CNWQUALITY TRANSPORTATIONThe Railroad’s ability to grow and tocompete with other modes of transportationdepends on providing qualitytransportation service. In 1999, UPregained a focused approach toimproving service, reducing failurecosts and raising customer satisfaction.UP strives continuously to improveservice quality by actively identifyingproblems and acting quickly to fixthem. For example, UP tracks operationalperformance measures closelyand focuses resources on regionswhere goals are not being met. Inmany cases, performance is as goodas or better than before the <strong>Union</strong><strong>Pacific</strong>/Southern <strong>Pacific</strong> merger. Butfurther improvement can be made asfailure costs continue to decline,capacity bottlenecks are removedand the remaining merger benefitsare realized.Commodity Revenue Growth(percent)13.8Intermodal11.8Automotive8.9<strong>Agricultural</strong>8.6Energy6.2Industrial3.9Chemicals8.6TotalCapital Expenditures*(millions of dollars)$2,297$2,392$1,9421997 1998 1999Maintenance-of-WayLocomotivesCapacityFreight Cars & Other* includes long-termoperating leasesConsolidated Debt(billions of dollars)UP Corporation8.08.556.5%55.6%Lease-AdjustedDebt/Capital<strong>10</strong>.2 <strong>10</strong>.158.7%56.9%Convertible Preferred1996 1997 1998 1999Convertible preferred of $1.5 billionconsidered 50% debt and 50% equity.3
UNION PACIFIC RAILROADOPERATING PERFORMANCECustomer service and financial performanceare improving as a result ofmore efficient use of railroad assetsincluding track, locomotives, freightcars, terminals and crews. Key indicators,such as train speed, freight carterminal dwell time, recrew rate andfreight car cycle time, gauge assetutilization. Showing particularimprovement is the recrew rate, whichreflects the percentage of crewsrelieved before their train completesits run. This dropped 77% from itsworst level in March of 1998. Freightcar terminal dwell measures the timea car sits in a rail yard before beingswitched into an outbound train. Thisimproved 34% to a best-ever 26.5hours in April 1999.CUSTOMER SATISFACTION<strong>Union</strong> <strong>Pacific</strong>’s mission statementestablishes customer satisfaction as atop priority. Monthly customer surveysprovide feedback regarding theRailroad’s service performance. AsOperating PerformanceVelocityMiles Per Hour19.1<strong>12</strong>.7Freight Car Cycle TimeDays16.3Best Ever 19.7Best Ever <strong>12</strong>.0Recrew RatePercentage 22.4%9.4%Best Ever 5.1%Mar '97 Mar '98Mar '00 Mar '97 Mar '98Mar '00<strong>12</strong>.1<strong>12</strong>.1Freight Car Terminal DwellHours40.028.6Best Ever 26.526.8Mar '97 Mar '98Mar '00 Mar '97 Mar '98Mar '00UP achieved dramatic improvement in operations during 1999. This forward momentum hascontinued, with further improvement reported for the first quarter of 2000. “Best-ever” resultsreflect best monthly average performance since the UP/SP merger in September 1996.Customer Satisfaction IndexCoal Train Cycle Performance(percent)756272<strong>10</strong>0200019991998904480701996 1997 1998 1999Jan Feb Mar Apr May Jun Jul Aug Sep Oct Nov Dec4
service improved during 1999, thepercent of satisfied customers climbedfrom 58% in January to 77% inDecember. Of critical importance tofuture improvement, the number ofdissatisfied customers declined from23% in January to 2% in December.SERVICE DELIVERY INDEXThe most direct measure of how wellthe Railroad is meeting customerexpectations is the Service DeliveryIndex (SDI). Depending on the commodity,the SDI measures how closelya car followed its scheduled trip planor how well a train performedagainst contractual obligations oragreed-upon transit times.As the Railroad climbed out of itsservice difficulties, the SDI rose from59 in January of 1999 to 73 in Marchof 2000. Performance out of thePowder River Basin was particularlystrong and helped drive coal traincycle performance from 79.8% inJanuary of 1999 to 99.2% in Marchof 2000. Results were driven byimprovements in capacity and by theefforts of a process improvement teamthat used targeted problem-solvingtechniques to reduce service failures.SERVICE VARIABILITYQuality service for customers meansthat shipments arrive quickly andconsistently on time. Cars thatarrive too early or too late can causelogistical problems for customerseven if the average cycle time meetsestablished standards. Eliminatingexcessive variability also benefits theRailroad. When trains run on schedule,cars make required connections,terminals become less congested andthe efficiency of crews, locomotivesand track capacity improves. Trainspeeds and car cycle times arecurrently reaching record levels sincethe UP/SP merger in October 1996.By continuing to focus on reducingperformance variability, furtherimprovements in customer service,train performance and assetutilization should be achievable.Our Mission<strong>Union</strong> <strong>Pacific</strong> is committed to be arailroad where:■■■Customers want to do businessEmployees are proud to workShareholder value is createdCOST OF QUALITYFailure to meet standards of operationalperformance, customer satisfactionor service performance results infinancial costs to the Railroad in theform of higher expenses, poor assetutilization or lost revenue opportunities.At <strong>Union</strong> <strong>Pacific</strong>, failure costs arecaptured by the Cost of Quality system,which consists of over <strong>10</strong>0 separateaccounts for tracking performance.Measured as a percentage of revenue,the Cost of Quality declined by onethirdto 14% in 1999.Service Delivery IndexService VariabilityCost of Quality67.360.665.371.6Frequency(conceptual representation)IncreasedCustomerSatisfaction(percent of revenue)192149.2ExcessiveVariability13151413111996 1997 1998 1999 2000Q11996 through 1998 results are pro formaUP/SP prior to and during computer systemscutovers.Early On-TimeLate 1995 1996 1997 1998 1999 YTD 2000Service LevelFeb Goal5
UNION PACIFIC RAILROADUNION PACIFIC FRANCHISEThe merger between <strong>Union</strong> <strong>Pacific</strong>and Southern <strong>Pacific</strong> created a railfranchise with substantial benefits tothe Railroad and its customers.Improved equipment utilization andconsolidation of work forces andfacilities are key benefits that willcontinue to improve operationalperformance and financial returnsfor shareholders. Customers nowbenefit from new or expandedfacilities and train services. Manyof these are available followingcompletion of several major mergerimplementation projects duringthe past two years.ROSEVILLE YARDIn May 1999, the J.R. Davis Yardopened in Roseville, California, aftera two-year, $145 million reconstructionproject. Many smaller rail yardsin the area were closed or downsizedas rail traffic was consolidated intoRoseville. This allows the Railroad tobuild longer, dedicated trains that canPortlandEugeneRosevilleSacramentoMilpitasSan JoseWest ColtonHinkleSparksStocktonEastportTo North Platte& eastern gatewaysTo Arizona, Texas& eastern gatewaysYards closedor downsizedMajor yardsROSEVILLE RATIONALIZATIONRoseville is the premier classification yardon the West Coast. It was built to consolidaterail traffic from many smaller yards in thearea and sized to handle years of expectedgrowth. The savings from reduced labor costsand improved equipment utilization aloneare estimated to provide a 30% return oninvestment.move directly to final destination orinterchange with fewer time-consumingintermediate stops. The Railroad isplanning to use this advantage tointroduce new premium manifesttrains that will provide high priorityservice for perishables and othergoods moving east through Chicago.I-5 MANIFEST SERVICEThe <strong>Union</strong> <strong>Pacific</strong>/Southern <strong>Pacific</strong>merger created truck-competitive,single-line rail service along theI-5 corridor between the <strong>Pacific</strong>Northwest and California, Nevadaand Arizona. Lumber and papertraffic from the PNW is the targetof another customer offering called“5-7-9” Service. To meet customerneeds, the Railroad will offer servicefrom the PNW to Northern Californiain five days, Southern California inseven days and Las Vegas andPhoenix in nine days. Consistentlymeeting that schedule should winincreased market share from trucks.PREMIUM MANIFEST SERVICE“5-7-9” MANIFEST SERVICERosevilleYardChicagoGatewaySt. LouisGateway5-Day Service7-Day Service9-Day Service6
I-5 INTERMODAL SERVICENo business segment offers a greateropportunity to grow market share thanintermodal. Trucks currently handleabout 90% of an approximately $40billion western market. Long-termgrowth depends upon improvementsin service reliability and new serviceofferings. One such offering currentlybeing tested in the I-5 corridor is the“Cascade Connection.” This operatesbetween Southern California andPortland and Seattle. A uniquefeature of the service is a fixedtrain configuration that is designedto best meet customer demand andavoid service delays caused byequipment shortages. Variable pricingwill be used to smooth seasonal andday-of-week demand fluctuationsand to maximize profitability. The“Cascade Connection” has alreadygreatly improved customer serviceand the concept will be consideredfor implementation in othercorridors.MEMPHIS-TEXAS-CALIFORNIAINTERMODALIn April 1999, UPRR introduced a newpremium intermodal service betweenMemphis and Northern Californiavia Dallas and Los Angeles. By using<strong>Union</strong> <strong>Pacific</strong> lines in Texas andArkansas and the former Southern<strong>Pacific</strong> Sunset Route, the new servicesaves almost 600 miles over <strong>Union</strong><strong>Pacific</strong>’s old Central Corridor route.The rail transit time is competitivewith the fastest truck service but atTruck versus Rail(generic lane comparison)Time(Hours)Labor(Cost)Fuel(Gallons)TruckRaila lower cost to the shipper, while thepremium service offers better marginsto UP. Per container, this priority intermodalservice requires approximatelyone-third the fuel and 1 /30 th thelabor as comparable truck service.INTERNATIONAL SERVICEDriven by the North AmericanFree Trade Agreement (NAFTA),international trade between Mexico,the U.S. and Canada continues tooutpace domestic economic growth.UPRR’s network stretches from theCanadian border to Mexico and iswell-positioned to benefit from thegrowing trade. The Railroad directlyserves all six major gateways toMexico and has the shortest andfastest route between the key Laredo,Texas, gateway and the northerninterchanges at St. Louis and Chicago.Speed and efficiency are enhancedon this route by use of directionalrunning and the recently completedhub-and-spoke network. Directionalrunning places all southbound trainsCASCADE CONNECTION INTERMODALSeattleMEMPHIS TO OAKLAND INTERMODALPortlandOaklandOaklandLos AngelesLos AngelesMemphisDallasIntermediate StopsIntermediate Stops7
UNION PACIFIC RAILROADon the former SP route betweenCENTRAL CORRIDOR CAPACITYIllinois and Texas and all northboundThe heaviest density of rail freight intrains on the parallel UP route. Thisthe world can be found traversingeliminates thousands of train meetsthe <strong>Union</strong> <strong>Pacific</strong>’s Central Corridorand passes. The hub-and-spoke networkgreatly increases crew efficiency multi-year project to install <strong>10</strong>8 milesin Nebraska. In August 1999, ain major cities by qualifying crews of triple track was completed, removinga key bottleneck. The fluid capacityon multiple line segments.By taking advantage of theseof this segment grew from approximately95 trains per day to 160 toefficiencies, UP and the TFM inMexico have teamed up to offer180 trains per day, and average trainfive-day premium intermodal service speed grew 40% to 34 miles per hour.between Mexico City and Chicago. Track capacity is also being addedThe primary target of this service is between the PRB mines in Wyomingnorthbound auto parts shipments and North Platte, Nebraska, anddestined for U.S. assembly plants. between Gibbon, Nebraska, andIntermodal, coal and manifest trains at the outskirts of Bailey Yard west of North Platte, Nebraska.Marysville, Kansas, and over theKansas <strong>Pacific</strong> line. The benefits ofall this new capacity support anticipatedgrowth in coal traffic and allother traffic relying on these routes.INFORMATION TECHNOLOGY& THE INTERNETTECHNOLOGY APPLICATIONSAt <strong>Union</strong> <strong>Pacific</strong>, technology hasalways been embraced as a valuabletool for increasing productivity, improvingcustomer service and simplifyingbusiness practices. Because of theRailroad’s large asset base and heavyreliance on transaction-based processes,new technologies can be scaledupward immediately to deliver strongfinancial returns. Examples includetwo new systems recently developedto monitor train events and managethe locomotive fleet. These systemsprovide managers with real-timeinformation regarding train andlocomotive location and status, andassists them in making decisions toimprove both utilization and on-timeUPRR Southbound 1,401 milesUPRR Northbound 1,339 milesBNSF1,670 milesCN/IC1,655 milesUPRRBNSFBNSF Trackage RightsCN/ICCN/IC Trackage RightsROUTES TO MEXICOChicagoSt. LouisMemphisLittle RockPine BluffJacksonon KCSPowderRiverBasinCheyenneDenverCENTRAL CORRIDOR CAPACITYSouth MorrillOmahaGibbonNorth PlatteMarysvilleTopeka Kansas CityChicagoSan AntonioLaredoHoustonon UPRRDouble Track Under Construction8on TexMex
performance. Exciting new applicationsare now being developed, highlightedby a next-generation computer-aideddispatching system, CAD III.THE INTERNETUse of Internet applications to simplifyand improve business-to-businesstransactions is one of the fastest growingareas in the technology industrytoday. <strong>Union</strong> <strong>Pacific</strong> is a railroadindustry leader in developing innovativebusiness-to-business applications.At <strong>Union</strong> <strong>Pacific</strong>, the Internet is viewedas a tool both to improve the efficiencyand accuracy of tens of thousands ofdaily business-to-business transactionsand to make these transactions simplerfor customers. Many powerful servicesare already available. Customers canperform price inquiries, order freightcars, submit shipping instructions andtrace car movements to destination.Once customers are finished loading orunloading a car, they can submitinstructions via the Internet to have itpicked up by the Railroad.Customers have reacted positively,as use of the Railroad’s web site hasincreased by over 480% during thepast two years.Applications are not limited just tocustomers. Many employee serviceshave also migrated to the web.For example, crews can check trainline-ups from home to help themanticipate work assignments. Andmany new applications andcustomer-specific sites are beingdeveloped.Internet Document Hits (monthly)2,313,000399,000Jan 1998 Jan 20009
SeattleKentTacomaSpokaneEastportPortlandBarnesHinkleSilver BowBoiseMPocatelloShawnee Jct.PowderRiverBasinSacramentoOakland RosevilleSan FranciscoBeneciaFresnoFremontRenoOgdenClearfieldSalt Lake CityCheyenneRollaDenverPuebloNorth PlatteGibbonMarysvilleOTopeLas VegasWichitaLos AngelesLong BeachMiraLomaColtonPhoenixSanta RosaAmarilloOklahoma CityTulsaCalexicoTucsonNogalesEl PasoFortWorthArlingtSingle and Double TrackTriple and Quadruple TrackMajor Classification YardsSan AntonioKirbyMajor Intermodal Trailer/Container TerminalsEagle PassAuto FacilitiesAuto Assembly CentersLaredoBrownsville<strong>10</strong>
DuluthinneapolisSt. PaulMilwaukeeREVENUE MIXCommodity Revenue: $9.9 BillionmahaJanesvilleBelvidereDes MoinesChicagoChicagoHeightsIntermodal18%Agricultral Products14%kaSt. JosephKansas CitySt. LouisFairfaxIndustrialProducts19%Automotive11%Chemicals16%Little RockPine BluffMemphisEnergy22%Reisor<strong>12</strong> <strong>Agricultural</strong> Products20 Industrial ProductsDallason MesquiteLivoniaBaton RougePort Allen14 Automotive16 Chemicals22 Intermodal24 MexicoWestfieldHoustonNew Orleans18 Energy11
AGRICULTURAL PRODUCTS1999 Review■ Driven by strong crop productionand a 44% increase in feed grainexports, whole grain carloadsincreased 15% over 1998 levels.■ Service improvements in 1999resulted in a 25% improvement inunit train transit times comparedto 1998.■ Better service also helped foodproducts volume grow 5%. Growthin beer and frozen products wereparticularly strong. Canned goodsshipments were down 2%, primarilythe result of a poor tomato cropduring 1998.■ Carloads of grain productsincreased by 1%, as strong growthin Meals & Oils and Malt wastempered by a decline in sugarbeets due to crop conditionsand growing patterns.■ Service improvements decreased carcycle times and allowed the Railroadto handle customer transportationrequirements efficiently during thefall grain harvest.■ Railroad investment in commercialfacilities designed to improve theefficiency of the unit-train networkcontinued, with over $4.2 millioninvested in 1999.1999 CarloadsWhole GrainCorn & Feed Grains (33%)Wheat & Food Grains (18%)Grain ProductsSweeteners (11%)Meals & Oils (11%)Livestock & Feed (5%)Food Grain Products (6%)33%8%8%6%FoodCanned/Packaged/Beverages (8%)Fresh & Frozen Products (8%)5%Arrow colors correspondto pie chart colors.18%11%11%Note: Grain Products and Foodmove in the same lanes.<strong>12</strong>
Key Market Factors■ <strong>Union</strong> <strong>Pacific</strong> offers a critical linkbetween producing areas in theMidwest and West and the <strong>Pacific</strong>Northwest and primary Gulf ports,as well as to Mexico. UP’s domesticmarkets include grain processorsand feeders in the Midwest, Southand Rocky Mountain states.■ Food products and beveragesconstitute another major productline, with producers and consumersbeing distributed broadly acrossthe Railroad system.■ Factors affecting export grainmovements include domestic andforeign crop production, differencesbetween Gulf Coast andPNW shipping rates and grainprices. Domestic business is morestable and driven primarily bythe consistency of serviceperformance.■ Grain moves most efficiently inunit trains that shuttle continuouslybetween producers and exportterminals or domestic markets.Smaller shipments, along with foodproducts and beverages, typicallymove in the manifest train network.2000 Outlook■ Implementation of a premiummanifest train network with the newRoseville yard as the cornerstone isplanned. <strong>Union</strong> <strong>Pacific</strong> will targetthe large volume of food productscurrently moving by truck fromCalifornia to major populationcenters in the East.■ Low commodity prices and increasingcompetition from foreign grainproducingcountries are expectedto keep the export grain marketrelatively flat in 2000.■ To provide more competitive graintransportation service, <strong>Union</strong> <strong>Pacific</strong>will continue to work with receiversin Mexico to develop a highefficiencyunit grain trainnetwork.COMMODITY REVENUE (millions of dollars)1999 1998 19971 2 3 4 1 2 3 4 1 2 3 4Quarterly 347 328 367 377 314 291 333 365 401 359 340 338Cumulative 347 675 1,042 1,419 314 605 938 1,303 401 760 1,<strong>10</strong>0 1,438REVENUE TON-MILES (millions)1999 1998 19971 2 3 4 1 2 3 4 1 2 3 4Quarterly 16,914 16,329 17,874 18,298 15,570 14,074 15,541 15,543 20,9<strong>10</strong> 15,244 14,271 18,6<strong>10</strong>Cumulative 16,914 33,243 51,117 69,415 15,570 29,644 45,185 60,728 20,9<strong>10</strong> 36,154 50,425 69,035CARLOADS (thousands)1999 1998 19971 2 3 4 1 2 3 4 1 2 3 4Quarterly 223 214 233 241 201 192 2<strong>12</strong> 235 245 224 222 216Cumulative 223 437 670 911 201 393 605 840 245 469 691 907AVERAGE REVENUE/CARLOAD (dollars)1999 1998 19971 2 3 4 1 2 3 4 1 2 3 4Quarterly 1,552 1,536 1,576 1,565 1,561 1,513 1,574 1,556 1,637 1,601 1,531 1,566Cumulative 1,552 1,544 1,555 1,558 1,561 1,538 1,550 1,552 1,637 1,620 1,592 1,585<strong>Pacific</strong> Northwest Gulf MexicoExport Grain by Terminal (percent of total grain traffic)1995 1996 1997 1998 19998 8414 17 14551816171714<strong>10</strong>8Total 39 39 35 29 33UNION PACIFIC RAILROAD 13
1999 ReviewAUTOMOTIVE■ Vehicle shipments grew 14%compared to a 7% increase indomestic vehicle sales. The growthwas driven by gains in market shareand improved service in a year ofrecord-setting vehicle sales.■ UP Automotive facilities averaged abest-in-class 98% performance ratingin 18 Association of AmericanRailroads Quality Audits that wereperformed in 1999, consistentlyscoring higher than the industryaverage.■ The Railroad continued to increasethe size of its freight car fleet, whichgrew to 17,642 with the additionof 2,342 new bi-level autoracks.<strong>Union</strong> <strong>Pacific</strong> has the largest fleetof autoracks in North America.■ <strong>Union</strong> <strong>Pacific</strong> and General Motorsreached agreement on a multi-yearcontract extension, with UP remainingGM’s primary transportationprovider in the west.■ <strong>Union</strong> <strong>Pacific</strong> and DaimlerChryslerreached agreement on a breakthroughmulti-year strategic alliancemaking UP its sole provider of railtransportation services in the Westwith focus on reliability, velocityand technology.■ The Automotive Delivery andInformation Management <strong>System</strong>(ADIMS), designed to manageUPRR’s automotive facilities, wasused as a platform to developVINVision. VINVision is a commerciallyavailable Internet-accessibleproduct that provides completetracking capability by VehicleIdentification Number throughoutthe entire distribution network.Memphis34%66%FacilitiesAssembly CentersArrow colors correspondto pie chart colors.1999 CarloadsAssembled AutosAuto Materials14
Key Market Factors■ <strong>Union</strong> <strong>Pacific</strong> is the largest automotivecarrier west of the MississippiRiver. The Railroad has facilitiesthat serve 80% of western U.S.cities, including 43 vehicle distributioncenters. <strong>Union</strong> <strong>Pacific</strong> alsodirectly serves six assembly centersand distributes import vehicles fromfour West Coast ports and twoGulf ports.■ Mexico is an important automotivemarket for the Railroad as companiescontinue to locate both vehiclemanufacturing and materialfacilities throughout the country.Automotive materials flow northand south across the border boundfor assembly centers in Mexico,the U.S. and Canada.2000 Outlook■ Vehicle sales remained at recordsettinglevels in the first quarter of2000. Growth for the remainderof the year will follow the strengthof the economy and consumerconfidence.■ The newly developed VINVisionis the first in a new line of logisticsproducts that will enhance customers’Fast-to-Market strategies.These products, combined withfurther advances in technology,will facilitate improvements invelocity and reliability for theentire distribution network.■ <strong>Union</strong> <strong>Pacific</strong> and Thrall CarManufacturing Company entereda strategic alliance to improve anddevelop new freight car technologyto better meet changing customerneeds. A new high-capacity multilevelautorack, the Q2, is the firstproduct of the alliance and will beintroduced later this year.■ Materials business should providean opportunity for growth as theRailroad develops supply chainmanagement solutions that helpwin market share from trucks.COMMODITY REVENUEU.S. Light Vehicle Sales/UP Finished Vehicle Carloads*1994Annual Growth Rate5.9%2.3%34815.136414.8(millions of dollars)1999 1998 19971 2 3 4 1 2 3 4 1 2 3 4Quarterly 253 275 239 281 230 243 203 261 237 250 217 246Cumulative 253 528 767 1,048 230 473 676 937 237 487 704 950REVENUE TON-MILES(millions)1999 1998 19971 2 3 4 1 2 3 4 1 2 3 4Quarterly 3,748 3,965 3,555 4,080 3,295 3,431 2,966 3,806 3,972 4,228 3,366 3,636Cumulative 3,748 7,713 11,268 15,348 3,295 6,726 9,692 13,498 3,972 8,200 11,566 15,202CARLOADS(thousands)1999 1998 19971 2 3 4 1 2 3 4 1 2 3 4Quarterly 170 184 167 186 159 165 140 177 157 166 148 167Cumulative 170 354 521 707 159 324 464 641 157 323 471 638AVERAGE REVENUE/CARLOAD(dollars)1999 1998 19971 2 3 4 1 2 3 4 1 2 3 4Quarterly 1,491 1,492 1,430 1,507 1,448 1,473 1,450 1,471 1,513 1,513 1,463 1,471Cumulative 1,491 1,492 1,472 1,481 1,448 1,461 1,458 1,461 1,513 1,513 1,497 1,4901995 1996 1997 1998 1999385UP Carloadings (thousands)39515.1 15.2* UP, SP & CNW pro forma for years 1994 through 1996.40815.646416.9Light Vehicle Sales (millions)UNION PACIFIC RAILROAD 15
Key Market Factors■ Plastics customers depend onreliable rail service and railroadprovidedstorage-in-transit (SIT)yards for intermediate storageof plastic resins.■ Fertilizer and related products areproduced in the Gulf Coast and thewestern U.S. and Canada and areshipped to major agricultural areas.■ The liquid and dry market consistsof 22 different segments of variousintermediate chemicals producedby and shipped to a multitude oflarge and small customers.■ UP directly serves Green River,Wyoming, the primary soda ashproducing region in the UnitedStates. Domestic demand forsoda ash is relatively constant.Export markets to Asia, Europeand Mexico, though volatile,provide growth opportunity.2000 Outlook■ Plastics shipments should remainstrong as the economy drivesnew plant expansions, and theRailroad continues to gainbusiness moving on trucks tothe Northeast and West Coast.■ Fertilizer business is expectedto be flat, due to crop surplusesand weak agricultural markets.■ To optimize capacity and meetexpected growth in the GulfCoast chemical region, UP is:■ Improving efficiency at its twomajor Houston switching yards.■ Expanding capacity in keysatellite zones around Houston.■ Adding more plastics storagein-transitfacilities.COMMODITY REVENUESoda Ash Growth OpportunityDomestic Soda AshProductionUP DomesticTons HandledOtherUP ExportTons Handled(millions of dollars)1999 1998 19971 2 3 4 1 2 3 4 1 2 3 4Quarterly 401 396 398 400 390 383 384 378 434 454 430 397Cumulative 401 797 1,195 1,595 390 773 1,157 1,535 434 888 1,318 1,715REVENUE TON-MILES(millions)1999 1998 19971 2 3 4 1 2 3 4 1 2 3 4Quarterly 13,153 13,096 13,238 13,761 <strong>12</strong>,553 <strong>12</strong>,571 <strong>12</strong>,576 11,642 14,184 14,429 13,4<strong>12</strong> <strong>12</strong>,576Cumulative 13,153 26,249 39,487 53,248 <strong>12</strong>,553 25,<strong>12</strong>4 37,700 49,342 14,184 28,613 42,025 54,601CARLOADS(thousands)1999 1998 19971 2 3 4 1 2 3 4 1 2 3 4Quarterly 225 233 238 234 223 226 232 218 237 258 250 227Cumulative 225 458 696 930 223 449 681 899 237 495 745 972AVERAGE REVENUE/CARLOAD(dollars)1999 1998 19971 2 3 4 1 2 3 4 1 2 3 4Quarterly 1,781 1,701 1,673 1,708 1,750 1,692 1,658 1,733 1,828 1,760 1,725 1,746Cumulative 1,781 1,741 1,717 1,715 1,750 1,721 1,699 1,708 1,828 1,793 1,770 1,764World Soda AshProductionU.S.ProductionThe Green River Basinin southern Wyomingholds the world’s largestproducing deposits oftrona, or natural sodaash. Synthetic soda ashproduction supplies mostworld markets outsidethe U.S. and representspotential growth for UP.<strong>10</strong> Million Tons 32 Million TonsUNION PACIFIC RAILROAD 17
ENERGY1999 Review■ In 1999, <strong>Union</strong> <strong>Pacific</strong> coalvolume grew 9% to 204 milliontons. Growth in Wyoming’s PowderRiver Basin (PRB) coal led the waywith a record 135 million tonsoriginated, a 13% increase over1998.■ Colorado/Utah coal volumeincreased 2% from 40 milliontons in 1998 to 41 million tonsin 1999.■ PRB coal train productivity improved3.3% to 13,660 tons per train in1999 compared to 13,250 tonsper train in 1998. Since 1996,PRB train productivity has grownnearly <strong>10</strong>%, reflecting the increaseduse of longer trains and highcapacityaluminum cars.■ Approximately 66 miles of newtrack was added in Nebraska andKansas during 1999 to removebottlenecks on the railroad and toprovide capacity for future growth.■ Coal train cycle performance showedstrong improvement during the year,improving from less than 80% inJanuary to nearly 97% by December.3% 3%2%20%18Arrow colors correspondto pie chart colors.72%1999 CarloadsPowder River BasinColorado/UtahSouthern IllinoisSouthern WyomingOther (includes coke)
Key Market Factors■ <strong>Union</strong> <strong>Pacific</strong> provides transportationservice between most of the coalproducingregions in the westernU.S. and utilities and industrialfacilities in 27 states. The PRBrepresents the largest and fastestgrowing segment of the market, asutilities continue to favor the lowcost and low-sulfur content of thecoal mined there.■ The Railroad also moves high-BTU,low-sulfur coal from Colorado andUtah to domestic utilities and throughWest Coast ports for export to the<strong>Pacific</strong> Rim. Colorado coal is exportedto Mexico via Eagle Pass, Texas,and PRB coal is exported to Europethrough Mississippi River bargeterminals.2000 Outlook■ Continued growth is expectedfor PRB coal volumes, as recentcapacity improvements and strongservice performance support growingdemand for low-sulfur westerncoal. Growth is expected fromnew customers and incrementalgrowth with existing customers.■ Track capacity expansion willcontinue to focus on alleviatingbottlenecks in key coal corridors.A 145-mile line between Gibbon,Nebraska, and Marysville, Kansas,will be completely double-trackedby March 2000.■ A number of operational initiativeswere recently implemented thatwere designed to increase PRB trainloading capabilities, including mineslotting with the Burlington NorthernSanta Fe, which better matches minecapacity with customer demand.■ Productivity growth should continueas more and longer distributedpower(DP) trains are utilized.Radio-controlled locomotives areplaced at the rear of DP trainsto allow train size to be expandedand asset utilization to be increased.COMMODITY REVENUE (millions of dollars)1999 1998 19971 2 3 4 1 2 3 4 1 2 3 4Quarterly 564 533 560 511 497 488 516 495 5<strong>12</strong> 495 483 424Cumulative 564 1,097 1,657 2,168 497 985 1,501 1,996 5<strong>12</strong> 1,007 1,490 1,914REVENUE TON-MILES (millions)1999 1998 19971 2 3 4 1 2 3 4 1 2 3 4Quarterly 47,608 45,654 48,222 47,890 41,634 41,480 45,370 44,609 41,901 42,196 41,905 37,280Cumulative 47,608 93,262 141,484 189,374 41,634 83,114 <strong>12</strong>8,484 173,093 41,901 84,097 <strong>12</strong>6,002 163,282CARLOADS (thousands)1999 1998 19971 2 3 4 1 2 3 4 1 2 3 4Quarterly 477 448 478 469 442 427 449 449 456 436 440 404Cumulative 477 925 1,403 1,872 442 869 1,318 1,767 456 892 1,332 1,736AVERAGE REVENUE/CARLOAD (dollars)1999 1998 19971 2 3 4 1 2 3 4 1 2 3 4Quarterly 1,183 1,188 1,172 1,090 1,<strong>12</strong>4 1,143 1,148 1,<strong>10</strong>4 1,<strong>12</strong>2 1,135 1,097 1,050Cumulative 1,183 1,185 1,181 1,158 1,<strong>12</strong>4 1,133 1,138 1,130 1,<strong>12</strong>2 1,<strong>12</strong>8 1,118 1,<strong>10</strong>2Originated OtherPowder River Basin Coal Moved by UPRR (millions of tons)1992 1993 1994 1995 1996 1997 1998 199914135141513 131<strong>10</strong> 11311915 <strong>10</strong>115 8615 7471Total 86 89 <strong>10</strong>1 116 <strong>12</strong>3 <strong>12</strong>6 133 149UNION PACIFIC RAILROAD 19
INDUSTRIAL PRODUCTS1999 Review■ Mild weather and a strongconstruction market in the highpopulation growth areas of theWest and Southwest combined todrive lumber revenue up over<strong>10</strong>% for the year.■ Stone and cement revenues wereup 17% and 15%, respectively,reflecting improved service as wellas strong construction activity,primarily in Texas and in majormetropolitan areas.■ Although down 6% for the yeardue to record imports, steelrevenue rose over 22% in thefourth quarter, as improved Asianeconomies slowed imports andimport quotas began totake hold.■ Newsprint, fibre and paperboardsaw revenue gains of nearly 8%,due to a strong domestic economyand improving worldwide economicconditions that reduced imports.■ In May, the newly rebuilt Roseville,California yard opened, providingthe cornerstone for improvingservice along the I-5 corridorfrom Los Angeles to Seattle.5%8%38%14%Arrow colors correspondto pie chart colors.19%16%1999 CarloadsMineralsMetals & OresPaper/Paper ProductsLumber/Building MaterialsConsumer/GovernmentWaste20
Key Market Factors■ Industrial Products covers a broadrange of commodities – from bulkproducts like stone, cement, minerals,waste and scrap to higher-valueshipments like lumber, paper andconsumer goods. For most commodities,trucks provide a competitivetransportation alternative. Marketshare growth hinges on providingconsistent, reliable service.■ Bulk commodities like rock oftenmove in unit train service fromorigin to a transload facility inmajor metropolitan areas. Demandis driven by construction activity andpeaks during the warmer months.■ Most other commodities move inmanifest train service and rely onUP’s extensive network of rail terminalsto move between thousandsof shippers and customers acrossNorth America. Demand is drivenprimarily by macro-economicconditions but experiencesseasonal peaks.2000 Outlook■ The newly rebuilt Roseville yardwill help the Railroad implementits new “5-7-9” Strategy to capturetraffic from trucks. The strategy callsfor delivery times of 5 days fromthe PNW to Northern California,7 days to Southern California and9 days to Phoenix and Tucson.■ Population growth in the South andSouthwest, a strong economy andlarge highway construction projectshave created a growing constructionmarket for lumber, cement, aggregates,roofing products and metals.■ Steel, ferrous scrap and metallicminerals should all benefit fromdeclining imports of foreign steel.■ Rising crude oil prices have causedan increase in domestic drillingactivity, which should also drive updemand for tubular steel andnon-metallic minerals.COMMODITY REVENUEIndustrial Products: Western Market ShareOtherRail 54%UP 46%Western Rail Share(millions of dollars)1999 1998 19971 2 3 4 1 2 3 4 1 2 3 4Quarterly 449 474 493 480 433 466 455 431 476 531 508 439Cumulative 449 923 1,416 1,896 433 899 1,354 1,785 476 1,007 1,515 1,954REVENUE TON-MILES(millions)1999 1998 19971 2 3 4 1 2 3 4 1 2 3 4Quarterly 17,950 19,180 19,573 19,794 17,627 18,356 18,417 16,875 19,967 20,794 19,360 17,574Cumulative 17,950 37,130 56,703 76,497 17,627 35,983 54,400 71,275 19,967 40,761 60,<strong>12</strong>1 77,695CARLOADS(thousands)1999 1998 19971 2 3 4 1 2 3 4 1 2 3 4Quarterly 327 353 365 353 314 342 349 315 353 389 367 321Cumulative 327 680 1,045 1,398 314 656 1,005 1,320 353 742 1,<strong>10</strong>9 1,430AVERAGE REVENUE/CARLOAD(dollars)1999 1998 19971 2 3 4 1 2 3 4 1 2 3 4Quarterly 1,373 1,345 1,350 1,360 1,381 1,362 1,303 1,365 1,348 1,366 1,385 1,364Cumulative 1,373 1,359 1,356 1,357 1,381 1,371 1,348 1,352 1,348 1,357 1,366 1,366Water7%Rail 15%Truck 78%Transportation ModeA majority of the westernindustrial products marketcurrently moves by truck.This provides significantopportunity to increasemarket share through newservice offerings andimprovements in cycle timeand service variability.UNION PACIFIC RAILROAD 21
1999 ReviewINTERMODAL■ A strong economy, record importsand better cycle times combinedto produce an 8% increase incarloads and a 14% increasein revenue in 1999.■ Average revenue per car increased5%, as a result of demand-drivenprice increases and higher volumein the Premium business segment.■ Third-party and Truckload volumegrew 6%, primarily due to serviceimprovements and EMP growth(see table page 23). The size of theEMP fleet grew to approximately19,600 units, resulting in a 47%increase in volume during the year.■ Less-Than-Truckload and Premiumintermodal volume was up 13%,led by a new premium serviceoffering between Memphis/Dallasand California, which beganin April.■ Service improvements and trackcapacity additions in the LosAngeles basin combined to enableUP to handle an 18% growth inintermodal volume out of theregion.7%42% 51%1999 CarloadsDomesticContainer and TrailerPremiumInternational22
Key Market Factors■ International: International containertraffic handled by steamship customers.The strength in foreign –especially Asian – economies, U.S.demand for foreign goods and internationaltrade policies drive demandand affect the balance of eastboundversus westbound traffic.■ Domestic: Two key domestic marketsegments:■ Domestic Container and Trailer:Includes container traffic handled byIntermodal Marketing Companies(IMC) and truckload carriers, as wellas the domestic container segmentsof Pacer and CSXI. An effort isunderway to convert trailer businessto EMP containers and is expectedto raise significantly the efficiencyand profitability of this segment.■ Premium: Primarily less-thantruckloadand package carrierswith time-sensitive business needs.Premium business growth is drivenby service performance and reliability.Significant growth is availablefrom trucks as service performancecontinues to improve.2000 Outlook■ Continued strong import business isanticipated to keep the Internationalsegment growing.■ The Premium service segment offersthe greatest opportunity for growthwith continued service performanceimprovement in existing lanes andintroduction of a second Premiumtrain between Oakland andChicago in March, 2000.■ IMC and Truckload volumes shouldcontinue to grow, aided by full-yearutilization of 6,500 EMP containerspurchased last year.■ Construction of a new intermodalterminal in the Chicago area hasbeen authorized. The new facilitywill provide needed capacity forgrowth in all intermodal marketsegments.COMMODITY REVENUEEMP Domestic Container Loads (in thousands)1995531996111(millions of dollars)1999 1998 19971 2 3 4 1 2 3 4 1 2 3 4Quarterly 388 426 459 452 362 379 385 390 418 461 473 389Cumulative 388 814 1,273 1,725 362 741 1,<strong>12</strong>6 1,516 418 879 1,352 1,741REVENUE TON-MILES(millions)1999 1998 19971 2 3 4 1 2 3 4 1 2 3 4Quarterly 16,014 17,472 17,886 17,847 15,482 16,276 16,148 16,224 17,880 20,896 20,559 <strong>12</strong>,703Cumulative 16,014 33,486 51,372 69,219 15,482 31,758 47,906 64,130 17,880 38,776 59,335 72,038CARLOADS(thousands)1999 1998 19971 2 3 4 1 2 3 4 1 2 3 4Quarterly 625 682 720 711 599 643 640 649 679 733 745 613Cumulative 625 1,307 2,027 2,738 599 1,242 1,882 2,531 679 1,4<strong>12</strong> 2,157 2,770AVERAGE REVENUE/CARLOAD(dollars)1999 1998 19971 2 3 4 1 2 3 4 1 2 3 4Quarterly 620 624 638 636 603 590 602 601 615 628 636 635Cumulative 620 622 628 630 603 596 598 599 615 622 627 629199716319981961999EMP is an equipment management program sponsored by <strong>Union</strong> <strong>Pacific</strong> and NorfolkSouthern that provides intermodal containers to shippers using an Internet reservationsystem. EMP offers customers a truck-equivalent container and the economic benefits ofdouble-stack train service. Full-year utilization of last year’s fleet additions and improvementsin cycle times are expected to help meet projected growth in demand in 2000.289UNION PACIFIC RAILROAD 23
1999 ReviewMEXICO■ Rail business with Mexico increased<strong>10</strong>% to $708 million in 1999, drivenby significant improvements inservice performance both north andsouth of the border. Top volumegainers include Chemicals, up 27%;<strong>Agricultural</strong> Products, up 19%; andAutomotive, up 11%.■ The recently-privatized Mexicanrailroads made considerable effortsto improve service through infrastructureand equipment upgrades,heightened security and improvedprocesses. One example is implementationof Despacho Anticipado,a northbound clearing process thatis the first step in implementation ofthe Automated Manifest <strong>System</strong>(AMS), which, when completed, willimprove border crossing efficiency.■ Overall cycle times were reduceddramatically, with UP achieving a27% (3 day) improvement over1998.■ Improvements in cycle time andservice increased the customersatisfaction index for Mexicancustomers from 55 to 82 yearover-year.■ Capital improvements were completedto clear capacity bottlenecksat the Laredo gateway and a newCustoms Inspection Facility wasbuilt at Port Laredo.■ <strong>Union</strong> <strong>Pacific</strong> increased its investmentin the Ferromex (FXE) railroad from13% to 26%. The FXE is a 4,000-mile rail network serving four ofthe six gateways to the United States.SeattleMinneapolisOmahaChicagoOaklandSaltLake CityDenverKansas CitySt. LouisMemphisLos AngelesCalexicoNogalesEl PasoDallasFort WorthLittle RockNewOrleans3%4%11%Arrow colors correspondto pie chart colors.EaglePassLaredoMonterreyHoustonBrownsville44%16%1999 Carloads22%AutomotiveGuadalajaraIntermodalIndustrial ProductsMexico City<strong>Agricultural</strong> ProductsChemicalsEnergy24
Key Market Factors■ <strong>Union</strong> <strong>Pacific</strong> serves all six majorgateways to Mexico, connecting tothe two largest Mexican railways.<strong>Union</strong> <strong>Pacific</strong> has the shortest andfastest route between Mexicoand the Chicago connections toCanada and the eastern railroads(see map, page <strong>10</strong>).■ The Railroad transports all six majorcommodity groups into and out ofMexico, led by the Automotivegroup with a 44% share.CalexicoNogalesHermosilloFXETFMFSRShortlines (2)FXE Trackage Rights on TFMTFM Trackage Rights on FXECuliacánEl PasoChihuahuaTorreónGuadalajaraManzanilloAguascalientesLázaroCárdenasMonclovaSaltilloSan LuisPotosíMexicoCity■ The Mexican rail network comprisesfive railroads (see map below) andis now 90% privatized. The privatizationprocess has resulted in amore efficient transportation systemwell-positioned to compete for thenorthbound and southbound businessopportunities created by theNorth American Free TradeAgreement (NAFTA). The Mexicanrailroads are and have been makingsubstantial investments in trackstructure, equipment and facilitiesto improve service, equipmentEagle PassMonterreyQueretaroLaredoPueblaBrownsvilleTampicoSalina CruzVeracruzCoatzacoalcosMéridautilization, safety and damageprevention.■ The Mexico transportation marketis estimated to be $4 billion peryear in size and consists of abroad range of commodities fromraw materials to finished goods.Trucks are the dominant transportationmode with a 75% share.Water transportation is a thirdcompetitive option.■ The rail market is well-positionedfor growth as the Mexican economyexpands and rail service withinthe country continues to improve.Continued foreign investment inmanufacturing and further privatizationin the petrochemical and utilityindustries provide opportunities.■ Additional progress is expected in2000 to facilitate Mexico growth,including implementation of morerun-though trains and electronicdata interchange between U.S.and Mexican carriers.NorthboundSouthboundUP Mexican Carloads (thousands)1994 1995 1996 1997 1998 1999335286297317281306196229243252248278531 515 540 569 529 584UNION PACIFIC RAILROAD 25
FINANCIAL AND OPERATING STATISTICSUNION PACIFIC CORPORATION(excluding Overnite Transportation Co. and Skyway)for the year ended December 31 1999 19981 2 3 4 TOTAL 1 2 3 4 TOTALFINANCIAL AND REVENUE STATISTICSOperating Revenues (millions of dollars) $2,487 $2,500 $2,616 $2,608 $<strong>10</strong>,211 $2,284 $2,317 $2,360 $2,407 $9,368Operating Expenses (millions of dollars) (a) $2,135 $2,074 $2,<strong>10</strong>9 $2,<strong>10</strong>9 $8,427 $2,257 $2,459 $2,152 $2,152 $9,020Operating Ratio (%) 85.8 83.0 80.6 80.8 82.5 98.8 <strong>10</strong>6.1 91.2 89.4 96.3Salaries and Benefits (millions of dollars) $918 $890 $930 $896 $3,634 $909 $914 $9<strong>10</strong> $947 $3,680Salaries and Benefits (% of commodity revenue) 38.2 36.6 37.0 35.8 36.9 40.8 40.6 40.0 40.8 40.6Commodity Revenue/Employee (thousands of dollars) $45.7 $45.6 $47.7 $48.6 $187.6 $42.2 $41.9 $42.3 $44.5 $170.8Fuel Expense (millions of dollars) $153 $170 $176 $193 $692 $180 $182 $170 $176 $708Average Fuel Cost Per Gallon (cents) 50 56 56 60 56 64 63 60 60 62Commodity Revenue (millions of dollars) $2,402 $2,432 $2,515 $2,502 $9,851 $2,226 $2,250 $2,277 $2,319 $9,072Average Commodity Revenue Per Car (dollars) $1,173 $1,151 $1,144 $1,140 $1,151 $1,149 $1,<strong>12</strong>8 $1,<strong>12</strong>6 $1,135 $1,134Average Commodity Revenue/Revenue Ton Mile (cents) 2.08 2.<strong>10</strong> 2.09 2.06 2.08 2.09 2.<strong>12</strong> 2.05 2.11 2.<strong>10</strong>Passenger Revenue (millions of dollars) $27 $25 $26 $27 $<strong>10</strong>5 $24 $25 $23 $25 $97OPERATING STATISTICSRevenue Carloads (thousands) 2,048 2,113 2,200 2,195 8,556 1,938 1,995 2,022 2,043 7,998Revenue Ton-Miles (billions) 115 116 <strong>12</strong>0 <strong>12</strong>2 473 <strong>10</strong>6 <strong>10</strong>6 111 <strong>10</strong>9 432Gross Ton-Miles (billions) 218 221 229 230 898 199 205 209 213 826Fuel Consumed (millions of gallons) 303 307 3<strong>12</strong> 322 1,244 283 290 283 294 1,150Average Employees (thousands) 52.6 53.3 52.7 51.5 52.5 52.7 53.7 53.8 52.1 53.1Gross Ton-Miles Per Employee (millions) 4.14 4.15 4.35 4.47 17.<strong>10</strong> 3.78 3.82 3.88 4.09 15.56SURFACE TRANSPORTATION BOARD-BASIS OPERATING EXPENSE (millions of dollars) (b)Transportation Expense $920 $895 $917 $975 $3,707 $942 $941 $936 $919 $3,738Engineering Expense 366 350 360 356 1,432 368 352 345 380 1,445Mechanical Expense 608 587 604 607 2,406 627 613 592 583 2,415General and Administrative Expense 191 191 178 117 677 266 500 232 225 1,223a) Includes claims from customers for damages related to shipments delayed by Railroad congestion of$370 million pre-tax ($230 million after-tax) in 1998.b) UPRR only.Refer to the <strong>Union</strong> <strong>Pacific</strong> Corporation 1999 Annual Report for additional information.26
FINANCIAL AND OPERATING STATISTICSUNION PACIFIC CORPORATION (excluding Overnite Transportation Co. and Skyway) (millions of dollars, unaudited)for the year ended December 31, 1999 1 2 3 4 TOTALOPERATING REVENUES Transportation $2,487 $2,500 $2,616 $2,608 $<strong>10</strong>,211OPERATING EXPENSES Salaries and Benefits 918 890 930 896 3,634Equipment and Other Rents 313 303 317 308 1,241Depreciation 259 256 259 263 1,037Fuel and Utilities 178 191 199 215 783Materials and Supplies 133 134 136 138 541Other Costs (a) 334 300 268 289 1,191Total Operating Expenses 2,135 2,074 2,<strong>10</strong>9 2,<strong>10</strong>9 8,427Operating Income $352 $426 $507 $499 $1,784for the year ended December 31, 1998 1 2 3 4 TOTALOPERATING REVENUES Transportation $2,284 $2,317 $2,360 $2,407 $9,368OPERATING EXPENSES Salaries and Benefits 909 914 9<strong>10</strong> 947 3,680Equipment and Other Rents 357 344 325 304 1,330Depreciation 246 250 252 258 1,006Fuel and Utilities 208 201 191 193 793Materials and Supplies 133 133 130 117 513Other Costs (a) 404 617 344 333 1,698Total Operating Expenses 2,257 2,459 2,152 2,152 9,020Operating Income (Loss) $27 $(142) $208 $255 $348a) Includes claims from customers for damages related to shipments delayed by Railroad congestionof $370 Million pre-tax ($230 million after-tax).Refer to the <strong>Union</strong> <strong>Pacific</strong> Corporation 1999 Annual Report for additional information.27
FINANCIAL AND OPERATING STATISTICSUNION PACIFIC RAILROAD COMPANY(millions of dollars, unaudited)as of December 31 1999 1998 1997ASSETSCURRENT ASSETS Cash and Temporary Investments $83 $35 $50Accounts Receivable 418 494 552Inventories 329 337 288Other Current Assets <strong>12</strong>6 215 251Total Current Assets 956 1,081 1,141INVESTMENTS Investments 752 691 624PROPERTIES Cost 33,536 32,334 30,694Accumulated Depreciation (6,490) (5,871) (5,208)Net Properties 27,046 26,463 25,486O T H E R Other Assets <strong>12</strong>6 <strong>12</strong>2 92Total Assets $28,880 $28,357 $27,343LIABILITIES AND STOCKHOLDERS’ EQUITYCURRENT LIABILITIES Accounts Payable $496 $493 $660Accrued Wages and Vacations 377 380 382Accrued Casualty Costs 344 364 364Taxes Payable 252 297 263Debt Due Within One Year – Third Parties 2<strong>10</strong> 178 229Interest Payable 97 1<strong>10</strong> <strong>10</strong>4Other Current Liabilities 669 730 861Total Current Liabilities 2,445 2,552 2,863OTHER LIABILITIES AND Intercompany Borrowings – Net 5,357 5,368 3,993STOCKHOLDERS’ EQUITYDebt Due After One Year – Third Parties 2,419 2,606 2,361Deferred Income Taxes 7,266 6,759 6,698Accrued Casualty costs 911 928 929Retiree Benefits Obligation 677 707 695Other Liabilities 533 811 883Redeemable Preference Shares 25 27 29Stockholders’ Equity 9,247 8,599 8,892Total Liabilities and Stockholders’ Equity $28,880 $28,357 $27,343Refer to the <strong>Union</strong> <strong>Pacific</strong> Corporation 1999 Annual Report for additional information.28
FINANCIAL AND OPERATING STATISTICSUNION PACIFIC RAILROAD COMPANY(millions of dollars, unaudited)for the year ended December 31 1999 1998 1997CASH FROM OPERATIONS Net Income $854 $27 $620Depreciation 1,034 1,003 972Deferred Income Taxes 592 7 336Other – Net (560) (218) (289)Change in Working Capital 66 (266) <strong>12</strong>0Cash From Operations 1,986 553 1,759INVESTING ACTIVITIES Capital Investments (1,777) (2,044) (2,035)Proceeds from Asset Sales and Other Activities 211 2<strong>12</strong> 265Cash Used In Investing Activities (1,566) (1,832) (1,770)EQUITY AND FINANCING Dividends Paid (200) (320) (420)ACTIVITIESDebt Repaid (239) (276) (2<strong>10</strong>)Financings and Other – Net 67 1,860 615Cash (Used In) Provided by Equity and Financing Activities (372) 1,264 (15)Net Change in Cash and Temporary Investments $48 $(15) $ (26)Cash and Temporary Investments at Beginning of Year 35 50 76Cash and Temporary Investments at End of Year $83 $35 $50CHANGES IN WORKING Accounts Receivable $76 $58 $(<strong>10</strong>5)CAPITALInventories 8 (49) 7Other Current Assets 89 36 21Accounts, Wages and Vacation Payable – (169) 205Debt Due Within One Year 32 (51) <strong>10</strong>6Other Current Liabilities (139) (91) (114)Net Change In Working Capital $66 $(266) $<strong>12</strong>0Refer to the <strong>Union</strong> <strong>Pacific</strong> Corporation 1999 Annual Report for additional information.29
FINANCIAL AND OPERATING STATISTICSUNION PACIFIC RAILROAD COMPANYfor the year ended December 31 1999 1998 1997 1996 1995CAPITAL EXPENDITURES (millions of dollars, includes long-term operating leases)Track $961 $989 $1,030 $647 $481Locomotive 468 655 622 506 224Freight Cars 85 200 <strong>12</strong>9 246 180Facilities and Other 425 549 504 283 274T O TA L $1,939 $2,393 $2,285 $1,682 $1,159EQUIPMENT OWNED OR LEASED AT YEAR-ENDLocomotives 6,974 7,083 6,966 6,755 4,136Freight Cars: (a)■ Covered Hoppers 39,2<strong>12</strong> 40,097 41,149 42,406 37,341■ Box cars 20,864 23,263 24,718 22,934 20,559■ Open-Top Hoppers 19,828 20,324 20,674 20,989 15,941■ Gondolas 18,099 17,828 16,083 15,325 <strong>12</strong>,218■ Other 16,726 18,264 17,143 19,675 8,428Work Equipment 9,927 9,218 <strong>10</strong>,045 11,631 <strong>10</strong>,013Bad Order Ratio (percent) 5.4 4.5 4.4 4.1 4.4AVERAGE AGE OF EQUIPMENTLocomotives 15.4 14.4 14.4 13.7 13.1Freight Cars 19.3 20.1 19.3 19.2 20.9TRACK MILES AT YEAR-ENDMain Line 26,963 27,197 27,421 27,406 16,599Branch Line 6,378 6,509 7,526 8,431 6,186Yards, Sidings, and Other Main Line 21,660 21,597 21,588 21,915 14,977T O TA L 55,001 55,303 56,535 57,752 37,762Track Miles of Continuous Welded Rail at Year-End 24,771 23,647 23,392 23,172 14,246Track Miles Under Centralized Traffic-Control at Year-End 16,199 15,944 15,590 15,277 9,932TRACK MILES OF RAIL REPLACED■ New 950 858 716 451 492■ Used 444 341 273 362 475Track Miles Re-Ballasted 4,579 3,259 3,557 4,503 3,532Ties Replaced (thousands) 3,293 2,691 3,853 2,919 2,194(a) Includes owned and leased freight cars with <strong>Union</strong> <strong>Pacific</strong> system marks.Capital Expenditure amounts and Equipment and Track statistics include the effects of the Southern <strong>Pacific</strong>and Chicago & North Western acquisitions as of October 1, 1996 and May 1, 1995, respectively.Refer to the <strong>Union</strong> <strong>Pacific</strong> Corporation 1999 Annual Report for additional information.30
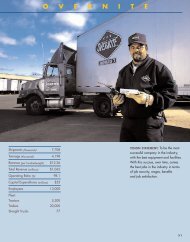
O V E R N I T EShipments (thousands) 7,708Tonnage (thousands) 4,198Revenue (per hundredweight) $<strong>12</strong>.26Total Revenue (millions) $1,062Operating Ratio (%) 98.1VISION STATEMENT: To be the mostsuccessful company in the industry,with the best equipment and facilities.With this success, over time, comesthe best jobs in the industry in termsof job security, wages, benefitsand job satisfaction.Capital Expenditures (millions) $55Employees 13,000Fleet:Tractors 5,300Trailers 20,000Straight Trucks 7731
OVERNITE TRANSPORTATIONOVERVIEWOvernite Transportation is one of thenation’s largest less-than-truckload (LTL)carriers. With 13,000 employees,20,000 trailers and 5,300 tractors,Overnite serves over 45,000 pointsin all 50 states, Canada, Mexico andU.S. territories. More than 90 percentof the company’s revenues arederived from its LTL business, withthe remainder derived from truckloadservices and value-added services thatsupport the core LTL business. Through166 service centers, Overnite canoffer customized intrastate, regional,national, next day and two-daymajor-market transportation services.During 1999, Overnite continued to make significant progress indeveloping and implementing innovative, new transportation servicesfor its customers. Financial results in the fourth quarter were adverselyaffected by disruptions caused by the organizing efforts of the InternationalBrotherhood of Teamsters. Despite this distraction, Overnite maintained itsfocus on delivering value through customer service and finished the yearwith a record on-time performance level of 97%.FINANCIAL REVIEWOperating revenues grew $28 millionor 3% in 1999 to $1.1 billion. Growthwas attributable to yield-enhancinginitiatives and strong volumes in thesecond and third quarters. Operatingexpenses grew 6% or $62 million,primarily as a result of increasedwages and benefits and higherexpenses incurred to maintain customerservice and security during theTeamsters job action ($27 million). Netincome fell 30% to $28.5 million, andthe operating ratio rose to 98.1%from 94.8% in 1998.Fuel and utility expense was up$3 million or 7%, as a result of higherprices and higher consumption.32
Equipment and other rent expenseincreased 14% or $<strong>12</strong> million, dueto implementation of work stoppagecontingency plans in the fourth quarterand higher ocean freight expenserelated to a large volume of businessgained from a competitor in PuertoRico. Other costs increased $11 millionfrom higher spending on securityand travel and lodging. On thepositive side, material and suppliesexpense decreased slightly.LABOR RELATIONSA Teamster campaign to organize allOvernite employees culminated in theunion calling for a nationwide walkouton October 24. The job action,which continued into 2000, wasignored by 94% of Overnite employees.The union is the certified andrecognized bargaining agent forabout 1,800 Overnite drivers andfreight handlers out of a 13,000employee workforce. More than 60%of Teamster-represented employeeshave worked through the walkout.Employees at half of the 22 Teamsterrepresentedservice centers have peti-rformanceOn-Time Service Performance(percent)96.494.895.896.998.0tioned the National Labor RelationsBoard to decertify the Teamsters astheir bargaining agent.Despite the walkout, all locationscontinue to be served and on-timeservice levels continue to improve.The Company is currently engagedin negotiations with the Teamsters,but has not entered into anybargaining agreements.DELIVERING VALUE INTRANSPORTATIONOver the past several years, Overnitehas expanded its efforts to improvethe quality of its customer serviceand to focus on higher-margin businesssegments. The outcome of theseefforts is a series of innovative newtransportation products that bettermeet the demands of customers forsimpler, faster and more reliableservice. As evidence of Overnite’ssuccess, on-time performancereached a record 98% in the firstquarter of 2000. Some of the newor expanded services include:Overnite Advantage: Overnite’severyday service reliability, whileproviding nationwide coverage toover 45,000 points including <strong>10</strong>0%direct full-state coverage in 27 states,more than 15,000 one- and two-daylanes and three- and four-daytranscontinental sleeper service.Overnite Advantage Expedited:This service is for customers needingguaranteed service for their emergency,time-critical shipments to anypoint in the world through a singletransportation provider. Overniteprovides a team of freight specialiststo handle coordination and instantaneoustracking for all segments ofthe move, from origin to destination.It’s on-time or it’s free.Special Services Division: Overnite’sdedicated truckload service divisionutilizes Overnite’s LTL expertise toexpand into niche segments of thegrowing truckload market.Assembly & Distribution: A speciallogistical function for shippers whoneed consolidation and distributionservices. Overnite’s Assembly andDistribution service provides thesefunctions for their customers byleveraging the broad distributioncapabilities of the Overnite network.Cross Borders and Ocean: A singlecarrier contact that provides transportationservices to Alaska, Hawaii,Guam, Canada, Puerto Rico and theU.S. Virgin Islands, with competitivetransit times and price.Revenue(millions of dollars)2771999 273199896.494.895.896.99Overnite Advantage Guaranteed:This service product is intended fortime-sensitive shipments. OverniteAdvantage Guaranteed service will257253262257258259guarantee delivery based on Overnite’s1Q19992 Q19993Q19994Q19991Q2000published transit time. It’s on-timeor it’s free.1Q 2Q 3Q 4Q33
SELECTED OPERATING STATISTICSOVERNITE TRANSPORTATION COMPANYfor the year ended December 31 1999 19981 2 3 4 TOTAL 1 2 3 4 TOTALFINANCIAL AND REVENUE STATISTICSTotal Operating Revenues (millions of dollars) 253 273 277 259 1,062 257 262 257 258 1,034Total Operating Expenses (millions of dollars) (a) 243 258 269 272 1,042 244 249 245 242 980Operating Ratio (excluding goodwill) (%) 95.9 94.5 97.1 <strong>10</strong>5.3 98.1 94.9 95.1 95.3 93.6 94.8Millions of Pounds HauledLess-Than-Truckload 1,942 2,090 2,080 1,837 7,949 2,004 2,019 2,005 1,938 7,966Truckload <strong>10</strong>7 <strong>10</strong>6 117 117 447 116 1<strong>10</strong> 111 116 453TOTAL 2,049 2,196 2,197 1,954 8,396 2,<strong>12</strong>0 2,<strong>12</strong>9 2,116 2,054 8,419Average Revenue Per HundredweightLess-Than-Truckload $<strong>12</strong>.35 $<strong>12</strong>.42 $<strong>12</strong>.60 $13.25 $<strong>12</strong>.64 $<strong>12</strong>.24 $<strong>12</strong>.38 $<strong>12</strong>.18 $<strong>12</strong>.64 $<strong>12</strong>.36Truckload 5.22 5.21 5.67 6.30 5.62 5.50 5.34 5.32 5.42 5.40TOTAL $ 11.97 $ <strong>12</strong>.07 $ <strong>12</strong>.23 $ <strong>12</strong>.83 $<strong>12</strong>.26 $ 11.87 $ <strong>12</strong>.01 $ 11.82 $ <strong>12</strong>.24 $11.98Shipments (thousands)Less-Than-Truckload 1,885 2,030 2,025 1,746 7,686 1,952 1,988 1,949 1,879 7,768Truckload 5 5 6 6 22 5 6 5 5 21TOTAL 1,890 2,035 2,031 1,752 7,708 1,957 1,994 1,954 1,884 7,789Average Fuel Price Per Gallon (cents) 44 51 57 65 54 58 52 48 53 53Total Fuel Consumed (thousands of gallons) 13,932 14,425 14,444 13,017 55,818 13,774 13,227 13,3<strong>10</strong> 13,241 53,552Average Employee Count 11,518 11,704 11,994 11,562 11,695 11,443 11,589 11,508 11,475 11,504a) 1998 results exclude goodwill amortization of $15 million and goodwill revaluation of $547 million.Refer to the <strong>Union</strong> <strong>Pacific</strong> Corporation 1999 Annual Report for additional information.34
STATEMENT OF CONSOLIDATED INCOMEOVERNITE TRANSPORTATION COMPANY(millions of dollars, unaudited)for the year ended December 31, 1999 1 2 3 4 TOTALOPERATING REVENUES Transportation $253 $273 $277 $259 $1,062OPERATING EXPENSES Salaries and Benefits 158 167 169 157 651Equipment and Other Rents 18 22 24 31 95Depreciation 11 <strong>12</strong> <strong>12</strong> 11 46Fuel and Utilities 11 11 13 14 49Materials and Supplies 11 <strong>12</strong> 13 13 49Other Costs 34 34 38 46 152Total Operating Expenses 243 258 269 272 1,042Operating Income (Loss) $<strong>10</strong> $15 $8 $(13) $20Net Income $9 $11 $8 $1 $29for the year ended December 31, 1998 1 2 3 4 TOTALOPERATING REVENUES Transportation $257 $262 $257 $258 $1,034OPERATING EXPENSES Salaries and Benefits 154 159 155 148 616Equipment and Other Rents 22 21 20 20 83Depreciation (a) 11 <strong>12</strong> 11 11 45Fuel and Utilities <strong>12</strong> 11 11 <strong>12</strong> 46Materials and Supplies 11 11 <strong>12</strong> 15 49Other Costs 34 35 36 36 141Total Operating Expenses 244 249 245 242 980Operating Income $13 $13 $<strong>12</strong> $16 $54Net Income $<strong>10</strong> $<strong>10</strong> $9 $11 $40(a) 1998 results exclude goodwill amortization of $15 million and goodwill revaluation of $547 million.Refer to the <strong>Union</strong> <strong>Pacific</strong> Corporation 1999 Annual Report for additional information.35
STATEMENT OF CONSOLIDATED FINANCIAL POSITIONOVERNITE TRANSPORTATION COMPANY(millions of dollars, unaudited)as of December 31 1999 1998 1997ASSETS Current Assets $393 $358 $335Net Properties 459 461 453Other Assets (a) 51 39 600Total Assets $903 $858 $1,388LIABILITIES AND STOCKHOLDERS’ EQUITYCurrent Liabilities $164 $144 $168Debt Due After One Year – Third Parties – 3 5Other Liabilities 154 139 <strong>10</strong>5Stockholders’ Equity 585 572 1,1<strong>10</strong>Total Liabilities and Stockholders’ Equity $903 $858 $1,388a) Includes $547 million goodwill revaluation in 1998.STATEMENT OF CONSOLIDATED CASH FLOWSOVERNITE TRANSPORTATION COMPANY(millions of dollars, unaudited)for the year ended December 31 1999 1998 1997Cash From Operations $89 $82 $79Cash Used in Investing Activities (46) (52) (30)Cash Used in Financing Activities (46) (27) (49)Net Change In Cash and Temporary Investments $(3) $3 $ –Refer to the <strong>Union</strong> <strong>Pacific</strong> Corporation 1999 Annual Report for additional information.36
CAUTIONARY INFORMATIONCertain statements in this report are forwardlookingwithin the meaning of the SecuritiesAct of 1933 and the Securities Exchange Actof 1934. These forward-looking statementsinclude, without limitation, statements regarding:expectations as to operational improvements;expectations as to market growth, cost savings,revenue growth and earnings; the time bywhich certain objectives will be achieved; andstatements concerning projections, predictions,expectations, estimates or forecasts as to theCorporation’s and its subsidiaries’ business,financial and operational results, and futureeconomic performance, statements of management’sgoals and objectives and other similarexpressions concerning matters that are nothistorical facts.Forward-looking statements should not beread as a guarantee of future performance orresults, and will not necessarily be accurateindications of the times at, or by which, suchperformance or results will be achieved.Forward-looking information is based oninformation available at the time and/ormanagement’s good faith belief with respectto future events, and is subject to risks anduncertainties that could cause actualperformance or results to differ materiallyfrom those expressed in the statements.Important factors that could cause suchdifferences include, but are not limited to,whether the Corporation and its subsidiariesare fully successful in implementing theirfinancial and operational initiatives; industrycompetition, conditions, performance andconsolidation; legislative and/or regulatorydevelopments, including possible enactmentof initiatives to re-regulate the rail business;natural events such as severe weather, floodsand earthquakes; the effects of adversegeneral economic conditions, both withinthe United States and globally; changes infuel prices; changes in labor costs; laborstoppages; the impact of latent year 2000systems problems; and the outcome ofclaims and litigation, including claimsarising from environmental investigationsor proceedings.Forward-looking statements speak onlyas of the date the statement was made. TheCorporation assumes no obligation to updateforward-looking information to reflect actualresults, changes in assumptions or changesin other factors affecting forward-lookinginformation. If the Corporation does updateone or more forward-looking statements,no inference should be drawn that theCorporation will make additional updateswith respect thereto or with respect toother forward-looking statements.CONTACT FOR PORTFOLIOMANAGERS ANDFINANCIAL ANALYSTS<strong>Union</strong> <strong>Pacific</strong>’s analyst relationsare coordinated by the CorporateTreasurer at the executive offices.Requests for interviews, generalinformation, offering memoranda,bond circulars and other publicationsshould be directed to:Investor Relations(402) 271-4227