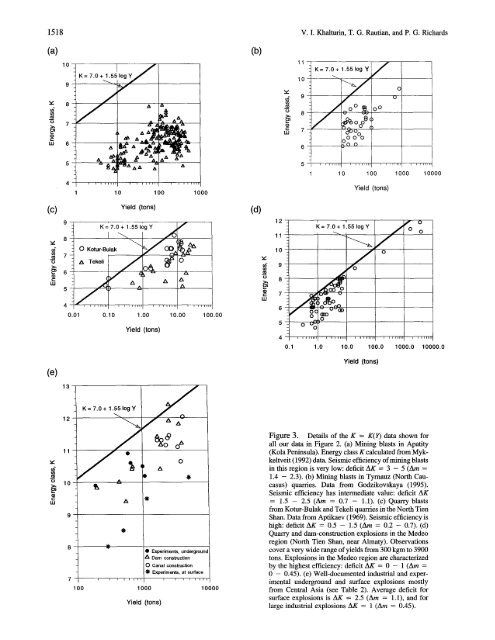
1518V. I. Khalturin, T. G. Rautian, and P. G. Richards(a)10I, JlK= 7.0+ 1.55 ogY~(b)1110K = 7 . 0 + 1 . 5 5 1 o g Y/v 8(no 7¢7)i-tu 6v9== 7LUoOO oO OC10 1001000 100000i i s ii~lli i i i lit,100 1000Yield (tons)(c)vWYield (tons)K = 7.0 + 1.55 log YO Kotur-Bulak y OO~/~ Tekeli ~ ~ / k ~ A ~fAZ~A0.01 0.10 1.00 10.00 100.00Yield (tons)(d)t~cLU12111098765| iK=7.0+l.551ogY/o0040.1 1.0 10.0100.0 1000.0 10000.0(e)Yield (tons)13K= 7.0+ 1,55 log Y12-_ ?v ~ 11- ~"° 10-¢..LM87100iAD1000A• Experiments, undergroumA Dam constructionO Canal construction"~ Experiments, at surfaceYield (tons)10000Figure 3. Details <strong>of</strong> the K = K(Y) data shown forall our data in Figure 2. (a) Mining blasts in Apatity(Kola Peninsula). Energy class K calculated from Mykkeltveit(1992) data. <strong>Seismic</strong> efficiency <strong>of</strong> mining blastsin this region is very low: deficit AK = 3 - 5 (Am =1.4 - 2.3). (b) Mining blasts in Tyrnauz (North Caucasus)quarries. Data from Godzikovskaya (1995).<strong>Seismic</strong> efficiency has intermediate value: deficit AK= 1.5 - 2.5 (Am = 0.7 - 1.1). (c) Quarry blastsfrom Kotur-Bulak and Tekeli quarries in the North TienShan. Data from Aptikaev (1969). <strong>Seismic</strong> efficiency ishigh: deficit AK = 0.5 - 1.5 (Am = 0.2 - 0.7). (d)Quarry and dam-construction explosions in the Medeoregion (North Tien Shan, near Almaty). Observationscover a very wide range <strong>of</strong> yields from 300 kgm to 3900tons. <strong>Explosions</strong> in the Medeo region are characterizedby the highest efficiency: deficit AK = 0 - 1 (Am =0 - 0.45). (e) Well-documented industrial and experimentalunderground and surface explosions mostlyfrom Central Asia (see Table 2). Average deficit forsurface explosions is AK = 2.5 (Am = 1.1), and forlarge industrial explosions AK = 1 (Am = 0.45).
<strong>The</strong> <strong>Seismic</strong> <strong>Signal</strong> <strong>Strength</strong> <strong>of</strong> <strong>Chemical</strong> <strong>Explosions</strong> 1519ern Kazakhstan explosions. Dam explosions in the Caucasusregion were less effective than similar explosions in CentralAsia. Effects <strong>of</strong> regional variation, presumably due to regionalwave propagation variability, are even more apparentin our magnitude--yield data than for energy class--yield,because <strong>of</strong> the wider range <strong>of</strong> geophysical regions for whichmagnitude data are available. This result is demonstrated inthe following section.Upper Limit <strong>of</strong> Magnitude versus YieldFigure 4 shows our summary data on magnitude and logY for numerous chemical and nuclear explosions. We foundM(Y)ma ~ = 2.45 + 0.73 * log Y (tons)= 4.64 + 0.73 log Y (kt)(8)for the straight line representing the upper level <strong>of</strong> magnitudeat given Y.Equation (8) runs quite closely through two small single-firedchemical explosions in Kazakhstan (these were calibrationshots a few hundred kilometers from the SemipalatinskTest Site, arranged in 1987 by the Natural ResourcesDefense Council and the USSR Academy <strong>of</strong> Sciences, executedin a way that maximized the seismic coupling--seeGiven et al., 1990). <strong>The</strong> line is also close to the controlleddetonation <strong>of</strong> a World War 2 mine (in England on 25 May1994; ISC data). Unfortunately, at low yield, these were theonly three well-tamped chemical explosions with knownmagnitude in high-Q regions. Other explosions such as theApatiti and Israeli sets were ripple fired with low efficiency.<strong>The</strong> line runs just above most <strong>of</strong> the UNE data and close tomost <strong>of</strong> the large single-fired chemical explosions. In choosingline (8), we had in mind, in addition to the values shown* Mine blasts, Kola peninsulax Small single ChemEx, underground(~Zhuchai construction blast, Chinao Gold mine blasting, Nevadaz, Israeli quarry blastsv Israeli construction blastsO Krivoi Rog mine blasts, Ukraine-~ Kursk M. A. mine blasts, Russia,Jt-Oo"• ~4M = 2.45 + 0.73"1og Y\ []\\ -o []An~Aoo o co o oO0~Q 0 "re'O" 0o~8~oUNE at SemipalatinskX Large single ChemEx[] ChemEx (NPE), underground at NTS[] Large ChemEx, surface,White Sands, US® WW2 mine detonation, EnglandO Mine explosions, Vogtland, GermanyLL0.1 10 100 1000 10000 100000 1000000Yield in tonsFigure 4. Magnitude versus yield (in tons) for several sets <strong>of</strong> data. <strong>The</strong> solid line,M(Y) = 2.45 + 0.73 log Y (tons) = 4.64 + 0.73 log Y (kt), is the upper limit <strong>of</strong>magnitude versus Y for our observed data. Further details are given in Figure 5. <strong>The</strong>level <strong>of</strong> this line is determined by underground nuclear explosions at the SemipalatinskTest Site, by two well-coupled experimental chemical explosions in northern Kazakhstan,by a mine detonation in England, and also by inference from K values to mb, forthe small Medeo explosions shown in Figure 2. Teleseismic mb values here are obtainedfrom the International Seismological Centre (ISC) and the British Atomic WeaponsEstablishment (AWE). Other magnitudes are mb(Lg) from NORSAR, and regional versions<strong>of</strong> local magnitude ML and coda magnitude MC.