HEALTH CARE COSTS: A PRimER - The Henry J. Kaiser Family ...
HEALTH CARE COSTS: A PRimER - The Henry J. Kaiser Family ...
HEALTH CARE COSTS: A PRimER - The Henry J. Kaiser Family ...

Create successful ePaper yourself
Turn your PDF publications into a flip-book with our unique Google optimized e-Paper software.
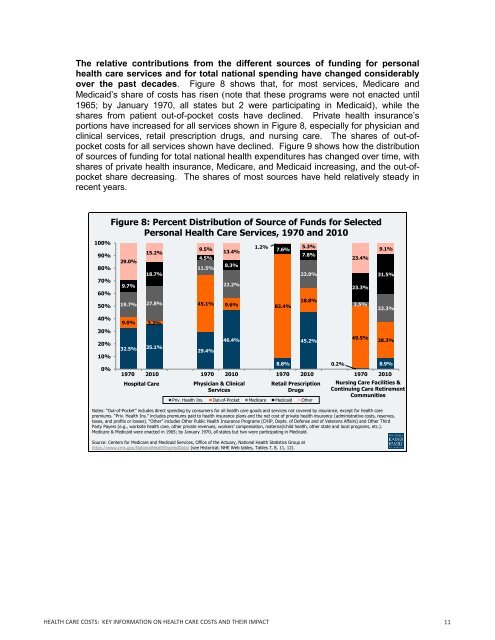
<strong>The</strong> relative contributions from the different sources of funding for personal<br />
health care services and for total national spending have changed considerably<br />
over the past decades. Figure 8 shows that, for most services, Medicare and<br />
Medicaid’s share of costs has risen (note that these programs were not enacted until<br />
1965; by January 1970, all states but 2 were participating in Medicaid), while the<br />
shares from patient out-of-pocket costs have declined. Private health insurance’s<br />
portions have increased for all services shown in Figure 8, especially for physician and<br />
clinical services, retail prescription drugs, and nursing care. <strong>The</strong> shares of out-ofpocket<br />
costs for all services shown have declined. Figure 9 shows how the distribution<br />
of sources of funding for total national health expenditures has changed over time, with<br />
shares of private health insurance, Medicare, and Medicaid increasing, and the out-ofpocket<br />
share decreasing. <strong>The</strong> shares of most sources have held relatively steady in<br />
recent years.<br />
100%<br />
90%<br />
80%<br />
70%<br />
60%<br />
50%<br />
40%<br />
30%<br />
20%<br />
10%<br />
0%<br />
Figure 8: Percent Distribution of Source of Funds for Selected<br />
Personal Health Care Services, 1970 and 2010<br />
29.0%<br />
9.7%<br />
19.7%<br />
9.0% 3.2%<br />
32.5%<br />
15.2%<br />
18.7%<br />
27.8%<br />
35.1%<br />
9.5% 13.4%<br />
4.5%<br />
11.5%<br />
45.1% 9.6% 82.4%<br />
29.4%<br />
8.3%<br />
22.2%<br />
46.4%<br />
1.2%<br />
<strong>HEALTH</strong> <strong>CARE</strong> <strong>COSTS</strong>: KEY INFORMATION ON <strong>HEALTH</strong> <strong>CARE</strong> <strong>COSTS</strong> AND THEIR IMPACT<br />
7.6%<br />
8.8%<br />
5.3%<br />
7.8%<br />
23.0%<br />
18.8%<br />
45.2%<br />
23.4%<br />
23.3%<br />
9.1%<br />
31.5%<br />
3.5% 22.3%<br />
49.5% 28.3%<br />
0.2% 8.9%<br />
1970 2010 1970 2010 1970 2010 1970 2010<br />
Hospital Care Physician & Clinical<br />
Services<br />
Retail Prescription<br />
Drugs<br />
Priv. Health Ins. Out-of-Pocket Medicare Medicaid Other<br />
Notes: “Out-of-Pocket” includes direct spending by consumers for all health care goods and services not covered by insurance, except for health care<br />
premiums. “Priv. Health Ins.” includes premiums paid to health insurance plans and the net cost of private health insurance (administrative costs, reserves,<br />
taxes, and profits or losses). “Other” includes Other Public Health Insurance Programs (CHIP, Depts. of Defense and of Veterans Affairs) and Other Third<br />
Party Payers (e.g., worksite health care, other private revenues, workers’ compensation, maternal/child health, other state and local programs, etc.).<br />
Medicare & Medicaid were enacted in 1965; by January 1970, all states but two were participating in Medicaid.<br />
Source: Centers for Medicare and Medicaid Services, Office of the Actuary, National Health Statistics Group at<br />
https://www.cms.gov/NationalHealthExpendData/ (see Historical; NHE Web tables, Tables 7, 8, 11, 12).<br />
Nursing Care Facilities &<br />
Continuing Care Retirement<br />
Communities<br />
11