Measuring capacity and capacity utilization in ... - ResearchGate
Measuring capacity and capacity utilization in ... - ResearchGate
Measuring capacity and capacity utilization in ... - ResearchGate

You also want an ePaper? Increase the reach of your titles
YUMPU automatically turns print PDFs into web optimized ePapers that Google loves.
136137138139140141142143144145146147148149150151152153154155156157158159160161162163164165166167168169170171172173174175tors of production is not restricted”. 2 This concept of<strong>capacity</strong> conforms to that of full-<strong>in</strong>put <strong>utilization</strong> (i.e.,maximum <strong>utilization</strong> of the variable <strong>in</strong>puts given thefixed factors of production) on a production function,with the qualification that <strong>capacity</strong> represents a susta<strong>in</strong>ablemaximum level of output (Kle<strong>in</strong> <strong>and</strong> Long,1973). The Johansen concept of <strong>capacity</strong>, however,was unbounded. The technological-economic measurewas <strong>in</strong>itially offered by Färe (1984) <strong>and</strong> is a weakerversion of the Johansen measure because output orproduction is bounded by the fixed factors of production.In the context of fisheries, this weaker concept ofthe Johansen measure of <strong>capacity</strong> corresponds to themaximum catch a vessel can produce if <strong>in</strong>puts arefully utilized given the biomass, the fixed <strong>in</strong>puts, theage structure of the fish stock, <strong>and</strong> the present stateof technology. This concept of <strong>capacity</strong> output cannotequal the output level that can be realized only atprohibitively high cost of <strong>in</strong>put usage, <strong>and</strong> hence, iseconomically unrealistic. The <strong>capacity</strong> output is measuredrelative to the observed best-practice frontier(i.e., based on observed po<strong>in</strong>ts) <strong>and</strong> based on observed<strong>in</strong>put <strong>and</strong> output levels. It is, therefore, not an absolutetechnically derived number based on an eng<strong>in</strong>eer<strong>in</strong>g 3notion of maximum possible catch; <strong>in</strong>stead, the observed<strong>in</strong>put <strong>and</strong> output levels reflect changes <strong>in</strong>ducedby economic behavior of firms. That is, the observedbest-practice frontier is established by the exist<strong>in</strong>g fleet<strong>and</strong> implicitly reflects economic decisions made byvessel operators.The decision to ma<strong>in</strong>ta<strong>in</strong> a given level of <strong>capacity</strong>or vessel size is a long-run decision based on expectationsabout future production possibilities (e.g.resource stock, environmental conditions, <strong>and</strong> regulation),<strong>and</strong> <strong>in</strong>put <strong>and</strong> output prices. Capacity output isdeterm<strong>in</strong>ed relative to a given po<strong>in</strong>t <strong>in</strong> time fixed, <strong>and</strong>hence, is a short-run concept. This is consistent withthe def<strong>in</strong>ition offered by Johansen (Prochaska, 1978).CU is also a short-run concept, s<strong>in</strong>ce current output or2 Kle<strong>in</strong> <strong>and</strong> Long (1973, p. 744) state that, “Full <strong>capacity</strong>should be def<strong>in</strong>ed as an atta<strong>in</strong>able level of output that can bereached under normal <strong>in</strong>put conditions—without lengthen<strong>in</strong>g acceptedwork<strong>in</strong>g weeks, <strong>and</strong> allow<strong>in</strong>g for usual vacations <strong>and</strong> fornormal ma<strong>in</strong>tenance.” In addition, Färe (1984) developed a formalproof of the existence for Johansen’s def<strong>in</strong>ition of <strong>capacity</strong>.3 Which means what is possible to produce if the vessel iswork<strong>in</strong>g at maximum physical load.N. Vestergaard et al. / Fisheries Research 1445 (2002) 1–12 3production can be adjusted given changes <strong>in</strong> <strong>in</strong>put <strong>and</strong> 176output prices, but only subject to fixed <strong>in</strong>puts <strong>and</strong> the 177available technology. Over the long run, there is not a 178<strong>capacity</strong> problem <strong>in</strong> most <strong>in</strong>dustries, because the firm 179adjusts its capital stock <strong>and</strong> production level to the ap- 180propriate levels <strong>and</strong> all available <strong>in</strong>puts are utilized <strong>in</strong> 181terms of their most effective long-run equilibrium lev- 182els. However, <strong>in</strong> open-access fisheries, because of the 183“Tragedy of the Commons,” excess <strong>capacity</strong> is gen- 184erally expected <strong>in</strong> which the firms or vessels collec- 185tively, as the fleet, tend to harvest a level of catch that 186exceeds the susta<strong>in</strong>able long-term target level <strong>and</strong> the 187fish stocks tend to become overfished. 188In the case of fisheries, the concept of <strong>capacity</strong> 189needs to address several specific issues. 4 An addi- 190tional issue for fisheries, as compared to many other 191<strong>in</strong>dustries, is that the fishermen harvest from a fixed 192pool of resources where nature limits production 193<strong>and</strong> the <strong>in</strong>dividual fisher’s ability to control catches 194(Prochaska, 1978). <strong>Measur<strong>in</strong>g</strong> <strong>capacity</strong> <strong>in</strong> a renewable 195resource <strong>in</strong>dustry is, therefore, more complicated than 196measur<strong>in</strong>g <strong>capacity</strong> output <strong>in</strong> a more “conventional” 197<strong>in</strong>dustry because the measure must be conditional 198upon the resource stock. The production technology 199for a fishery is stock-flow, <strong>in</strong> which <strong>in</strong>puts are ap- 200plied to the resource stock to yield a flow of catch 201(output). Hence, if the <strong>capacity</strong> output is measured 202over a time period, the measure must reflect changes 203<strong>in</strong> the resource stock as well as changes <strong>in</strong> the capital 204stock. 205Resource abundance <strong>and</strong> availability, however, may 206vary because of unexpected or seasonal changes <strong>in</strong> en- 207vironmental conditions. If output or production levels 208vary seasonally or change because of extremely un- 209usual environmental changes, <strong>capacity</strong> measures need 210to <strong>in</strong>corporate <strong>and</strong> recognize these changes. 211Many fisheries throughout the world <strong>in</strong>volve pro- 212duction of more than one output. Hence, multi-product 213or multi-species production is likely to be the norm 214rather than the exception (Clark, 1985), <strong>and</strong> any em- 215pirical method for estimat<strong>in</strong>g <strong>and</strong> assess<strong>in</strong>g <strong>capacity</strong> 216must be able to account explicitly for multiple outputs. 217Another issue important for determ<strong>in</strong><strong>in</strong>g a method for 218assess<strong>in</strong>g <strong>capacity</strong> <strong>in</strong> fisheries is the mobile nature of 219the vessel. Vessel operators may often switch from 2204 For an overview of <strong>capacity</strong> <strong>in</strong> fisheries see Kirkley <strong>and</strong> Squires(1999).UNCORRECTED PROOF
2212222232242252262272282292302312322332342352362372382392402412422432442452462472482492502512522532542552562572582592602612622632642654 N. Vestergaard et al. / Fisheries Research 1445 (2002) 1–12one fishery to another dur<strong>in</strong>g a given period of time,or from one period to another.The ability to change fisheries raises complex issuesabout aggregat<strong>in</strong>g measures of <strong>capacity</strong> for differentfisheries. That is, what level of aggregation should beconsidered when assess<strong>in</strong>g <strong>capacity</strong> output? The levelof aggregation determ<strong>in</strong>es the outcome of the analysis.A high level of aggregation <strong>in</strong>clud<strong>in</strong>g all fisherieswith<strong>in</strong> the year of the whole fleet shows the overalllevel of <strong>capacity</strong> <strong>and</strong> CU. However, the problem is thatthere may be fisheries with very high CU <strong>and</strong> fisherieswith low CU that can counterbalance so the comb<strong>in</strong>edCU result is not alarm<strong>in</strong>g. The fisheries with high-lowCU are typically high value fisheries, <strong>and</strong> hence, themost important economically. If the fisheries are technologicallydist<strong>in</strong>ct, they may be treated separately.In open-access fisheries, <strong>in</strong> which the access to eachs<strong>in</strong>gle fishery is not excluded, a problem called latent<strong>capacity</strong> might arise. This problem has its orig<strong>in</strong> <strong>in</strong> thefact that the fish<strong>in</strong>g effort can change allocation betweenthe fisheries dur<strong>in</strong>g the season. A fishery witha high CU might <strong>in</strong> the next period have a low CUbecause of <strong>in</strong>com<strong>in</strong>g vessels result<strong>in</strong>g <strong>in</strong> other fisherieshav<strong>in</strong>g a high CU, all th<strong>in</strong>gs equal. An assessmentof the excess <strong>capacity</strong> <strong>in</strong> this k<strong>in</strong>d of fishery hasto take the regulation <strong>in</strong>to account. A decommission<strong>in</strong>gscheme oriented towards reduc<strong>in</strong>g <strong>capacity</strong> <strong>in</strong> afishery with both high- <strong>and</strong> low-valued species, therefore,may subsequently only reduce the <strong>capacity</strong> of thelow-valued components, while not effectively reduc<strong>in</strong>g<strong>capacity</strong> relative to the high-valued species.3. Empirical methodologyThe methodology used <strong>in</strong> this paper to empiricallyestimate <strong>and</strong> assess <strong>capacity</strong> is DEA. The DEA approachis a mathematical programm<strong>in</strong>g technique forwhich an optimal solution is determ<strong>in</strong>ed given a setof constra<strong>in</strong>ts. The approach has been widely used tof<strong>in</strong>d the technical efficiency of firms (Charnes et al.,1994). This approach can also be used to measure <strong>capacity</strong><strong>and</strong> CU follow<strong>in</strong>g Färe et al. (1989, 1994). Theapproach readily <strong>in</strong>corporates multiple output <strong>and</strong> <strong>in</strong>puttechnologies.Färe et al. (1989) demonstrated that an outputorientedmeasure of technical efficiency could beused to estimate the <strong>capacity</strong> output <strong>and</strong> optimumvariable factor usage. An output-oriented measure of 266technical efficiency determ<strong>in</strong>es the maximum possi- 267ble expansion of outputs (i.e., the frontier production) 268with no change <strong>in</strong> the fixed factors of production. 269The frontier or best-practice technology is a refer- 270ence technology or production frontier that depicts 271the most technically efficient comb<strong>in</strong>ation of <strong>in</strong>puts 272<strong>and</strong> outputs. The production frontier is formed as 273a non-parametric, piece-wise, l<strong>in</strong>ear comb<strong>in</strong>ation of 274observed best-practice activities. 275Under the Färe et al. (1989) framework, only the 276fixed <strong>in</strong>puts are bounded at their observed level, al- 277low<strong>in</strong>g the variable <strong>in</strong>puts to vary <strong>and</strong> be fully utilized. 278This is slightly different from the concept offered by 279Johansen, because it explicitly allows the fixed factors 280to restrict output. The approach provides a scalar mea- 281sure or efficiency score, θ1 ∗ , that <strong>in</strong>dicates the percent- 282age by which the production of each output of each 283firm may be <strong>in</strong>creased (i.e., the score measures the dis- 284tance between the observed output <strong>and</strong> the frontier). If 285the solution is 1.25, the <strong>capacity</strong> output is 1.25 times 286the observed output. The CU is then simply 1/1.25 = 2870.8. The DEA approach also provides the optimal uti- 288lization rate of variable <strong>in</strong>puts, λ ∗ jn, or the <strong>utilization</strong> of 289the variable <strong>in</strong>puts required to produce at full <strong>capacity</strong> 290output. 291Estimation of <strong>capacity</strong> output may be obta<strong>in</strong>ed by 292solv<strong>in</strong>g a mathematical or l<strong>in</strong>ear programm<strong>in</strong>g prob- 293lem. Initially, designate the vector of outputs as u <strong>and</strong> 294the vector of <strong>in</strong>puts by x. There are m outputs, n <strong>in</strong>- 295puts, <strong>and</strong> j firms or observations. Capacity output <strong>and</strong> 296the optimum or full <strong>in</strong>put <strong>utilization</strong> values require 297solv<strong>in</strong>g the follow<strong>in</strong>g equations: 298Maxθ,z,λ θ 1subject to 300θ 1 u jm ≤J∑z j u jm ,j=1J∑z j x jn ≤ x jn , n ∈ α,j=1J∑z j x jn = λ jn x jn ,j=1m = 1, 2,... ,M,n ∈ˆα,UNCORRECTED PROOF299301302303
304305z j ≥ 0,λ jn ≥ 0,j = 1, 2,...J,n ∈ˆα,306 where z j is the <strong>in</strong>tensity variable for the jth observa-307 tion; θ 1 the technical efficiency score or the proportion308 by which output may be exp<strong>and</strong>ed when production309 is at full <strong>capacity</strong>; <strong>and</strong> λ ∗ jnthe ratio of optimum use of310 <strong>in</strong>put x jn to observed <strong>in</strong>put use of x jn .311 Capacity output is then determ<strong>in</strong>ed by multiply<strong>in</strong>g312 θ1 ∗ by actual production. CU, based on observed out-313 put, may be calculated as follows:314CU(observed) =uθ1 ∗u = 1315 This measure provides a ray measure of <strong>capacity</strong> out-316 put <strong>and</strong> CU <strong>in</strong> which the multiple outputs are exp<strong>and</strong>ed317 <strong>in</strong> fixed proportions relative to their observed values318 (Segerson <strong>and</strong> Squires, 1990). The ray measure con-319 verts the multiple-output problem to a s<strong>in</strong>gle-product320 problem by keep<strong>in</strong>g all outputs <strong>in</strong> fixed proportions.321 This ray measure corresponds to a Farrell (1957) mea-322 sure of output-oriented technical efficiency due to the323 radial expansion of outputs. 5324 Färe et al. (1994) noted that this ray CU measure325 may be biased downward, because the numerator <strong>in</strong>326 the CU measure, the observed outputs, may not be327 produced <strong>in</strong> a technically efficient manner. A techni-328 cally efficient measure of outputs may be obta<strong>in</strong>ed by329 solv<strong>in</strong>g a problem where both the variable <strong>and</strong> fixed330 <strong>in</strong>puts are constra<strong>in</strong>ed to their current levels. The331 outcome (which can be called θ2 ∗ ) shows the amount332 by which production can be <strong>in</strong>creased if production333 is technically efficient. The technically efficient com-334 b<strong>in</strong>ation of outputs, conditional on observed <strong>in</strong>put335 levels, may be determ<strong>in</strong>ed by solv<strong>in</strong>g another l<strong>in</strong>ear336 programm<strong>in</strong>g problem, which is similar to the <strong>capacity</strong>337 problem:338339340Maxθ,z θ 2subject toθ 2 u jm ≤J∑z j u jm ,j=1θ ∗ 1m = 1, 2,... ,M,5 A non-radial expansion of outputs would correspond toKoopmans (1951) notion of technical efficiency.N. Vestergaard et al. / Fisheries Research 1445 (2002) 1–12 5J∑z j x jn ≤ x jn ,j=1n = 1, 2,... ,N,z j ≥ 0, j = 1, 2,... ,J. 342The technically efficient output vector is calculated by 343multiply<strong>in</strong>g θ2 ∗ by observed production for each out- 344put. The technically efficient or “unbiased” ray mea- 345sure of CU is then the follow<strong>in</strong>g: 346CU(efficient) = θ 2 ∗uθ1 ∗u = θ 2∗UNCORRECTED PROOFθ ∗ 1The output-oriented measure can be used <strong>in</strong> several 348ways. For each vessel, the <strong>capacity</strong> output is deter- 349m<strong>in</strong>ed. Summ<strong>in</strong>g over vessels by given criteria (e.g. 350regional or gear-type) the necessary number of ves- 351sels can be found where the total reach some spec- 352ified target (e.g. total allowable catch, TAC). In the 353multi-species case, this can be done for each species. 354We stress, however, that summ<strong>in</strong>g over each vessel 355presents a lower bound for the <strong>in</strong>dustry or fleet level 356of <strong>capacity</strong> (i.e., the <strong>in</strong>dustry or fleet level of <strong>capacity</strong> 357is greater than or equal to the sum of the vessel levels 358of <strong>capacity</strong>). 359The variable <strong>in</strong>put <strong>utilization</strong> outcome, λ ∗ jn, mea- 360sures the ratio of optimal use of variable <strong>in</strong>put to 361observed use; the optimal variable <strong>in</strong>put usage is the 362variable <strong>in</strong>put level which gives full technical effi- 363ciency at the full <strong>capacity</strong> output level. If the ratio of 364the optimal variable <strong>in</strong>put level to the observed vari- 365able <strong>in</strong>put level exceeds (falls short of) 1.0 <strong>in</strong> value, 366there is a shortage (surplus) of the ith variable <strong>in</strong>put 367currently employed <strong>and</strong> the firm should exp<strong>and</strong> (con- 368tract) use of that <strong>in</strong>put. 3693.1. Second-stage analysis 370Several external factors not <strong>in</strong>cluded <strong>in</strong> the analy- 371sis might <strong>in</strong>fluence the CU scores. Coelli et al. (1998) 372suggest a second-stage analysis, where the scores ob- 373ta<strong>in</strong>ed by the DEA analysis <strong>in</strong> the first stage are re- 374gressed on variables that are expected to <strong>in</strong>fluence the 375scores. Us<strong>in</strong>g the results from the second-stage re- 376gression, the efficiency scores can be adjusted. In the 377case of a fishery, the variables could be season, size 378of vessel, home port, etc. In our case of the Danish 379Gill-net fleet, where only 1 year is <strong>in</strong>cluded <strong>and</strong> also 380341347
3813823833843853863873883893903913923933943953963973983994004014024034044054064074084094104114124134144154164174184194204214224236 N. Vestergaard et al. / Fisheries Research 1445 (2002) 1–12the vessels are relatively equal <strong>in</strong> size, only the portis <strong>in</strong>cluded <strong>in</strong> the second-stage analysis. Capacity <strong>and</strong>CU might, however, vary widely by port, which <strong>in</strong>turn reflects differences <strong>in</strong> <strong>in</strong>stitutional practices, resourceavailability <strong>and</strong> abundance, <strong>and</strong> market conditions(Squires <strong>and</strong> Kirkley, 1996). This variation <strong>in</strong><strong>capacity</strong> <strong>and</strong> CU can be evaluated us<strong>in</strong>g a Tobit analysis.Tobit analysis accounts for censor<strong>in</strong>g of the <strong>capacity</strong>measure at zero <strong>and</strong> of CU measure at both zero<strong>and</strong> 1. The <strong>capacity</strong> <strong>and</strong> CU measures regressed uponport dummy variables, without an <strong>in</strong>tercept, gives aone-way analysis of variance with 5−1 = 4 degrees offreedom when the null hypothesis of equal coefficientsbetween all port dummy variables is applied. Themodel we consider for the Tobit regression for CU is asfollows:CU =5∑α i D ii=1where i <strong>in</strong>dexes <strong>in</strong>dividual ports <strong>and</strong> 5 denotes the totalnumber of ports. The null hypothesis of equal CU forall ports is H 0 : α I =···=α i =···=α 5 . With a Tobitregression, the appropriate test of the null hypothesisis the Wald test with a χ 2 distribution with 4 degreesof freedom. If the null hypothesis is rejected, then asequence of other tests is needed where the ports arecompared <strong>in</strong> pairs. With five different ports the numberof pairs will be 10.3.2. Partial <strong>capacity</strong> measuresSeveral measures permitt<strong>in</strong>g non-radial or non-proportionalchanges <strong>in</strong> outputs have been developed,e.g. Russell (1985) <strong>and</strong> Zieschang (1984), but theyhave not, so far, been used to estimate <strong>capacity</strong>. PartialCU measures developed by Segerson <strong>and</strong> Squires(1990) <strong>in</strong> the parametric case are here applied <strong>in</strong> thenon-parametric framework. A partial CU approachvaries only a s<strong>in</strong>gle output. All other outputs are heldfixed at their actual levels. The partial measure canbe seen as the first stage <strong>in</strong> the asymmetric Färe efficiencymeasure (Färe et al., 1983) adjusted to the caseof <strong>capacity</strong>. A partial CU measure is def<strong>in</strong>ed as theobserved output level divided by the <strong>capacity</strong> level ofthe output of concern given the actual output levelsof all other products <strong>and</strong> fixed factor. The numericalvalue of this CU measure will vary across productsso it is not unique for a given firm. The partial CU 424measures might <strong>in</strong>dicate that the degree of over cap- 425italization <strong>in</strong> the fishery can vary considerably across 426products (Segerson <strong>and</strong> Squires, 1990). There may be 427more excess <strong>capacity</strong> or higher rates of CU <strong>in</strong> the 428fishery of one species than another. The stocks <strong>in</strong> the 429North Sea are managed on a species-by-species ba- 430sis. For species that are closer to full partial CU (i.e., 431close to 1) or have lower levels of excess <strong>capacity</strong>, the 432future dem<strong>and</strong> for that species is likely to be of more 433importance <strong>in</strong> determ<strong>in</strong><strong>in</strong>g the future expansionary or 434contractionary forces <strong>in</strong> the fishery than is the dem<strong>and</strong> 435for the species with lower CU or higher excess capac- 436ity. The partial CU measure is estimated for cod <strong>and</strong> 437plaice, s<strong>in</strong>ce these are the most important species <strong>in</strong> 438the fishery. The partial CU for a given firm <strong>and</strong> species 439is as follows: 440CU(partial) = 1UNCORRECTED PROOFθ ∗ 3where θ3 ∗ is the score obta<strong>in</strong>ed by solv<strong>in</strong>g the follow<strong>in</strong>g 442DEA-problem: 443Maxθ,z θ 3subject to 445θ 3 u j1 ≤u jm =J∑z j u j1 ,j=1J∑z j u jm ,j=1J∑z j x jn ≤ x jn , n ∈ α,j=1m = 2,... ,M,z j ≥ 0, j = 1, 2,... ,J, 449where species 1 is the species for which the partial 450measure is found. 4514. The Gill-net fleet <strong>and</strong> fishery—background 452<strong>and</strong> data 453The Danish fisheries are normally divided <strong>in</strong>to hu- 454man consumption <strong>and</strong> <strong>in</strong>dustrial fisheries. The human 455441444446447448
456457458459460461462463464465466467468469470471472473474475476477478479480481482483484485486487488489490491492493494495496497498499500501consumption fisheries, which comprise many fisheries,are def<strong>in</strong>ed as those where no species are l<strong>and</strong>ed for<strong>in</strong>dustrial purpose. The <strong>in</strong>dustrial fisheries are fisherieswhere some of the species are l<strong>and</strong>ed for <strong>in</strong>dustrialpurpose (process<strong>in</strong>g of meal <strong>and</strong> oil), mean<strong>in</strong>g thatspecies caught <strong>in</strong> these fisheries can also be l<strong>and</strong>ed forhuman consumption. The human consumption fisheriesare, <strong>in</strong> general, multi-species fisheries (i.e., morethan one species is caught <strong>in</strong> one sett<strong>in</strong>g of the gearor <strong>in</strong> one trip). In several of the fisheries, differentgear types (e.g. trawl, gill-netters, Danish Se<strong>in</strong>ers) areused.A large part of the Danish human consumption fleetis multipurpose, which can participate <strong>in</strong> several fisheriesdur<strong>in</strong>g the year, <strong>in</strong>clud<strong>in</strong>g <strong>in</strong>dustrial fisheries.Relative prices between species <strong>and</strong> <strong>in</strong>puts, regulatoryconstra<strong>in</strong>ts, production costs, biological conditions,<strong>and</strong> change <strong>in</strong> seasons are factors that determ<strong>in</strong>ethe choice of fishery. The gill-netters participate<strong>in</strong> the mixed human consumption fishery harvest<strong>in</strong>groundfish <strong>and</strong> flatfish <strong>in</strong> the North Sea <strong>and</strong> Skagerrak.The catch composition varies over the year <strong>and</strong> betweenfish<strong>in</strong>g grounds. The gears <strong>in</strong>volved are trawl,gill-net, <strong>and</strong> Danish Se<strong>in</strong>e. The target species alsovaries over the year <strong>and</strong> accord<strong>in</strong>g to the gear typeused; however, cod, haddock, saithe, plaice, <strong>and</strong> soleare the ma<strong>in</strong> species, with cod be<strong>in</strong>g the most important.Nearly all the gill-netters participate <strong>in</strong> the fishery<strong>in</strong> the North Sea <strong>and</strong> about half of them also participate<strong>in</strong> the Skagerrak fishery. Only a few gill-netterstake part <strong>in</strong> the fishery <strong>in</strong> Kattegat <strong>and</strong> the BalticSea.4.1. The regulation <strong>and</strong> the regulatory processThe EU council annually determ<strong>in</strong>es the TAC forquota species <strong>in</strong> the exclusive economic zones (EEZs)of the EU member states. A fixed scale (called thepr<strong>in</strong>ciple of relative stability) divides the TACs amongthe member states <strong>in</strong>to national quotas. The memberstates then decide the distribution of their respectivenational quota among fishermen. S<strong>in</strong>ce there isno bank<strong>in</strong>g of national quotas, the member states designthe regulation to ensure full <strong>utilization</strong> of theirquotas.The Danish regulation of the fishery for cod, haddock,saithe, <strong>and</strong> sole is based on the Danish share ofthe TAC’s divided <strong>in</strong>to quarterly total quotas for theN. Vestergaard et al. / Fisheries Research 1445 (2002) 1–12 7whole fishery, which <strong>in</strong> turn are divided <strong>in</strong>to rations 502for a given period, 6 <strong>in</strong> some cases depend<strong>in</strong>g on the 503size of vessels. The number of participat<strong>in</strong>g vessels, 504however, is not regulated for these fisheries. Dur<strong>in</strong>g 505a given time period, therefore, rations can decl<strong>in</strong>e or 506the ration period can be shortened. If the Danish quota 507for a species is caught before the end of the year, the 508fishery is simply closed. 7 509In the beg<strong>in</strong>n<strong>in</strong>g of the year, the Danish M<strong>in</strong>istry 510of Fisheries sets both the size of the quarterly quotas 511<strong>and</strong> rations based on the experience from former years 512<strong>and</strong> based on the size of the total Danish quota. Over 513the year, the M<strong>in</strong>istry closely monitors the fishery by 514record<strong>in</strong>g all catches, <strong>and</strong> if necessary the regulation 515is changed, so that the quota is not exceeded. The 516purpose of the regulation is, <strong>in</strong> general, to achieve a 517better distribution of the fisheries over the year <strong>and</strong> a 518better <strong>utilization</strong> of the Danish quotas compared to a 519free fishery of the quotas. The regulatory <strong>in</strong>struments, 520quarterly quotas <strong>and</strong> rations, are used to stretch out 521the fishery over the whole year. In summary, it can be 522concluded that the cod <strong>and</strong> saithe fishery <strong>in</strong> all four 523areas has been constra<strong>in</strong>ed by the limited TAC. Sole 524has been constra<strong>in</strong>ed <strong>in</strong> the North Sea. The TAC for 525plaice <strong>in</strong> the Skagerrak was exploited over 90%, but 526there was no regulation. 527Access to the Danish fisheries is restricted. To 528achieve an entry right, two authorizations are needed, 529one, recognition as a commercial fisherman <strong>and</strong> two, 530a vessel license, where recognition is a necessary 531condition for the vessel license. A vessel license can 532be obta<strong>in</strong>ed only if correspond<strong>in</strong>g <strong>capacity</strong> leaves the 533fishery. 534Only with permission from the M<strong>in</strong>istry is an ex- 535tension of the exist<strong>in</strong>g number of vessels allowed. For 536the purpose of management, <strong>capacity</strong> output has been 537assumed to be related to a number of physical <strong>in</strong>puts 538used by the vessel. The <strong>in</strong>puts are GRT, length, width, 539depth, hold <strong>capacity</strong>, <strong>and</strong> eng<strong>in</strong>e power. However, the 540relationship between these physical measures of ca- 541pacity <strong>and</strong> <strong>capacity</strong> output of vessels is not straightfor- 542ward, <strong>and</strong> <strong>capacity</strong> can be <strong>in</strong>creased through chang<strong>in</strong>g 543the comb<strong>in</strong>ation of these <strong>in</strong>puts, or through changes 5446 It is possible <strong>in</strong> a number of cases for the fishermen to transferration from one period to the next.7 Sometimes a fishery is closed if the quarterly quota is caught.The fishery opens aga<strong>in</strong> at the start of the next quarter.UNCORRECTED PROOF
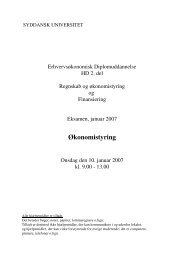
5455465475485495505515525535545555565575585595605615625635645655665675685695705715725735745755765775785795805818 N. Vestergaard et al. / Fisheries Research 1445 (2002) 1–12<strong>in</strong> other <strong>in</strong>puts not <strong>in</strong>cluded <strong>in</strong> the management def<strong>in</strong>itionof physical <strong>capacity</strong>. 8The primary purpose of the regulations is to harmonizethe total <strong>capacity</strong> of the fleet to the resourcestock conditions. Regulation of the total exist<strong>in</strong>g <strong>capacity</strong>is based on control of the physical <strong>in</strong>puts relat<strong>in</strong>gto the <strong>capacity</strong> of the <strong>in</strong>dividual vessels. Thissystem can regulate the <strong>in</strong>dividual vessels, but cannotcontrol the total fish<strong>in</strong>g effort, because the access toeach fishery, <strong>in</strong> general, is non-regulated. The mosteconomically attractive fisheries will attract effort <strong>and</strong>each fisherman will try to use his ration first, becauseonce the quarterly quota is exhausted, the fishery isclosed. The conclusion is that the overall limited accessto the Danish fishery <strong>and</strong> limited possibilities toextend the exist<strong>in</strong>g <strong>capacity</strong> will not reduce the over<strong>capacity</strong> <strong>in</strong> the most profitable fisheries, although theeffort <strong>in</strong> the least attractive fisheries may be reduced.From the po<strong>in</strong>t of efficiency, the result is that too mucheffort is attracted <strong>in</strong>to certa<strong>in</strong> fisheries. Therefore, thesituation emerges where the overall <strong>capacity</strong> problemis solved on the sector level but not <strong>in</strong> all fisheries.4.2. DataData necessary for analyz<strong>in</strong>g <strong>capacity</strong> output <strong>and</strong>CU were available only for gill-net vessels larger than20 GRT. As a consequence, the analysis was limitedto 69 vessels (i.e., only those vessels larger than 20GRT). Available data perta<strong>in</strong>ed to trip-level data <strong>and</strong>vessel operations dur<strong>in</strong>g 1993, <strong>and</strong> consisted of thefollow<strong>in</strong>g <strong>in</strong>formation: (1) the volume <strong>and</strong> value ofthe l<strong>and</strong>ed catch of each of the follow<strong>in</strong>g species: cod,haddock, saithe, plaice, sole <strong>and</strong> other species (addedtogether); (2) the month of l<strong>and</strong><strong>in</strong>g; <strong>and</strong> (3) the fish<strong>in</strong>garea.The trip <strong>in</strong>formation allows for a division of theannual fishery activity based on month <strong>and</strong> area. Thegill-netters participate only <strong>in</strong> the mixed human con-8 Equat<strong>in</strong>g the capital stock (physical <strong>in</strong>puts such as vesselsize <strong>and</strong> eng<strong>in</strong>e power) to <strong>capacity</strong> implicitly assumes a l<strong>in</strong>earrelationship between the capital stock <strong>and</strong> <strong>capacity</strong>. In general,these co<strong>in</strong>cide only if there is but one fixed <strong>in</strong>put or stock ofcapital, all variable <strong>in</strong>puts are <strong>in</strong> fixed proportions to the fixed<strong>in</strong>put, production is characterized by constant returns to scale (a1% <strong>in</strong>crease <strong>in</strong> all <strong>in</strong>puts, both variable <strong>and</strong> fixed, <strong>in</strong>creases catchby one percent) (Berndt <strong>and</strong> Fuss, 1989). In fisheries, there is anadded condition, that of a constant fish stock(s).sumption fishery <strong>in</strong> the North Sea <strong>and</strong> Skagerrak, 582which can probably be divided <strong>in</strong>to several different 583fisheries; given the available data, however, it is not 584possible to precisely further divide the fishery <strong>in</strong>to 585other fisheries. 586There is no <strong>in</strong>formation available about the length 587of the trips, 9 <strong>and</strong> hence, no <strong>in</strong>formation on the variable 588<strong>in</strong>puts per trip was available. It was decided to aggre- 589gate the trip-level <strong>in</strong>formation to annual activity per 590vessel. For each vessel, therefore, the total l<strong>and</strong><strong>in</strong>gs 591(output) <strong>and</strong> the number of trips (represent<strong>in</strong>g variable 592<strong>in</strong>put), together with <strong>in</strong>formation on the KW <strong>and</strong> GRT 593(represent<strong>in</strong>g fixed factors or the capital stock), were 594used <strong>in</strong> the analysis. 10 5955. Results <strong>and</strong> discussions 596Of the 69 Danish gill-net vessels, 36 (38) vessels 597had a (ray) CU based on technically efficient produc- 598tion (CU based on observed production) less than 1 599(Fig. 1). Nearly 2/3 (43 vessels out of 69) of the fleet 600had a CU higher than 0.9, while 10 vessels had a CU 601less than 0.8. Us<strong>in</strong>g the CU measure based on ob- 602served output shows that 40 vessels had a CU higher 603than 0.9 <strong>and</strong> 20 vessels had a CU less than 0.8. The 604average CU was 0.92 (0.88) with a st<strong>and</strong>ard deviation 605of 0.11 (0.16) (Table 1). These CU values illustrate 606that a m<strong>in</strong>or, but significant part, of the gill-net fleet 607had relatively low levels of CU. These results are <strong>in</strong> 608accordance with those obta<strong>in</strong>ed <strong>in</strong> Vestergaard (1998), 609where the gill-net was shown to be more efficient than 610other types of gear <strong>in</strong> the Danish human consumption 611fishery. 612The second-stage analysis sought to determ<strong>in</strong>e 613whether or not the homeport might expla<strong>in</strong> some of 614the variance <strong>in</strong> CU-scores. Of the 69 vessels, 48 were 615from the port of Hvide S<strong>and</strong>e. Of these 48 vessels, 61630 had a CU less than 1. The observation that 30 out 617of 48 vessels from the port of Hvide S<strong>and</strong>e had a CU 618score less than 1 suggests that this fleet may have 619more excess <strong>capacity</strong> than the rest of the fleet. The 6209 S<strong>in</strong>ce the fisheries <strong>in</strong> question are human consumption fisheries,where the trip length varies between 1 <strong>and</strong> 5 days, it is not assumedthat the use of trips <strong>in</strong>stead of number of days will give biasedresults when look<strong>in</strong>g at similar vessels.10 Because of the lack of better data on the variable <strong>in</strong>puts, therelatively homogenous vessel group of gill-netters was selected.UNCORRECTED PROOF
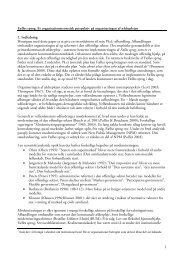
621622623624625626627628629630631632633634635636637638639N. Vestergaard et al. / Fisheries Research 1445 (2002) 1–12 9Fig. 1. Distribution of <strong>capacity</strong> <strong>utilization</strong> scores.Table 1Average CU, variable <strong>in</strong>put <strong>utilization</strong>, number of vessels with CU equal or different to 1 aCU(observed) CU(efficient) VIU CU cod CU PlaiceAverage (st<strong>and</strong>ard deviation) 0.88 (0.16) 0.92 (0.11) 1.27 (0.39) 0.93 (0.15) 0.85 (0.28)NR with CU = 1 31 33 57 50NR with CU < 1 38 36 12 19NR with VIU = 1 31NR with VIU < 1 2NR with VIU > 1 36a CU: ray CU; VIU: variable <strong>in</strong>put <strong>utilization</strong>; Cu cod <strong>and</strong> Cu plaice : partial CU of cod <strong>and</strong> plaice, respectively.result of the test of the null hypothesis that CU wasequal for all ports could not be rejected (a χ 2 value of8.19 with a probability of 0.085), at the significancelevel of 5%.The distribution of the variable <strong>in</strong>put <strong>utilization</strong>rates had the same pattern as the CU rates (Fig. 2).About half of the vessels could <strong>in</strong>crease the use ofvariable <strong>in</strong>puts, although do<strong>in</strong>g so would <strong>in</strong>crease outputby only one-half the difference between observedoutput <strong>and</strong> <strong>capacity</strong> output (Table 2). On average, thevariable <strong>in</strong>put <strong>utilization</strong> rate is 1.27 (st<strong>and</strong>ard deviationis 0.16), <strong>in</strong>dicat<strong>in</strong>g that vessels should <strong>in</strong>creasethe number of trips compared to the optimal numberof trips by 27% (Table 1) if vessel operators desire tooperate at full <strong>capacity</strong> output.Capacity output <strong>and</strong> technically efficient outputwere calculated us<strong>in</strong>g the estimated scores obta<strong>in</strong>edfrom the DEA problems. The <strong>capacity</strong> <strong>and</strong> technicallyefficient output levels were calculated for eachspecies <strong>and</strong> aggregated to obta<strong>in</strong> an estimate of ex- 640cess <strong>capacity</strong> for each species (Table 2). For example, 641the total fleet production of cod could at full <strong>capacity</strong> 642have been 651,730 kg higher, which corresponds to an 643Fig. 2. Distribution of variable <strong>in</strong>put <strong>utilization</strong> scores (VIU).UNCORRECTED PROOF
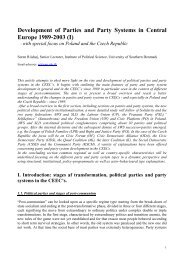
64464564664764864965065165265365465565665765865910 N. Vestergaard et al. / Fisheries Research 1445 (2002) 1–12Table 2Fleet <strong>capacity</strong> <strong>and</strong> CU (gill-netters, Kilo)Cod Haddock Saithe Plaice Sole OtherCatch 4,369,095 123,121 412,577 1,566,142 268,426 1,227,071Technical efficient output 4,617,355 125,389 426,275 1,644,746 285,472 1,279,219Capacity output 5,020,825 132,631 451,611 1,764,363 314,116 1,375,729Excess <strong>capacity</strong> 651,730 9,510 39,033 198,221 45,690 148,658Excess <strong>capacity</strong> (%) 14.9 7.7 9.5 12.7 17.0 12.1Ray CU(observed) 0.87 0.93 0.91 0.89 0.85 0.89Ray CU(efficient) 0.92 0.95 0.94 0.93 0.91 0.93Partial <strong>capacity</strong> output 4,777,448 1,883,159CU(cod), CU(plaice) 0.91 0.83excess <strong>capacity</strong> for cod of 15.9%. In total, the excess<strong>capacity</strong> for each species shows fundamentally thesame results <strong>and</strong> varies with<strong>in</strong> the same range as thoseon the vessel basis with CUs around 0.85–0.95. Cod<strong>and</strong> sole have the highest excess <strong>capacity</strong>, which is<strong>in</strong> accordance with how the regulation proceeded thisyear. Surpris<strong>in</strong>gly, saithe has a lower excess <strong>capacity</strong>than plaice, which could <strong>in</strong>dicate that plaice is a moreimportant species for the gill-net fleet than saithe.Haddock <strong>and</strong> saithe have the lowest excess <strong>capacity</strong>.The distribution of the partial CU measures for cod<strong>and</strong> plaice shows that a very high share of the vesselsdid not have the ability to <strong>in</strong>crease output (Fig. 3).However, the average partial CU for cod <strong>and</strong> plaicewas significantly lower than 1. The partial CU <strong>and</strong>the CU (observed) (or CU(efficient)) measure for codFig. 3. Distribution of partial <strong>capacity</strong> <strong>utilization</strong> scores for cod<strong>and</strong> plaice.were not very different on an aggregate basis (Table 2), 660which <strong>in</strong>dicated that cod was one of the species that 661determ<strong>in</strong>ed the <strong>capacity</strong>. For plaice, the situation was 662slightly different. The partial CU for plaice was less 663than both the CU (observed) <strong>and</strong> CU(efficient), which 664showed that the potential output of plaice was higher 665than both the actual <strong>and</strong> <strong>capacity</strong> output. This result 666suggests that the vessels had excess <strong>capacity</strong> <strong>in</strong> its 667production of plaice. 11 668Analysis <strong>and</strong> results were applied to only a s<strong>in</strong>gle 669year—1993. The measures of <strong>capacity</strong>, therefore, were 670conditional on the regulatory <strong>and</strong> resource conditions 671that prevailed <strong>in</strong> 1993. Changes <strong>in</strong> these conditions 672might alter the results, which our analysis would not 673depict. As a consequence, the results presented <strong>in</strong> this 674paper might not be very <strong>in</strong>dicative of <strong>capacity</strong> output 675levels <strong>and</strong> CU under different regulatory <strong>and</strong> resource 676conditions. An additional shortcom<strong>in</strong>g of the approach 677used <strong>in</strong> this paper to estimate <strong>capacity</strong> output is the 678determ<strong>in</strong>istic nature of DEA. 12 That is, DEA assumes 679all deviations from the frontier are caused by <strong>in</strong>effi- 680cient operations, which <strong>in</strong> fact, some deviations may 681be <strong>in</strong>duced by events beyond the control of the ves- 682sel operator. The use of annual data, however, likely 68311 One reviewer notes that cod <strong>and</strong> plaice might be harvestedus<strong>in</strong>g different fish<strong>in</strong>g techniques. Therefore, if plaice is bycatch<strong>in</strong> cod nets this can expla<strong>in</strong> the lower partial CU. However, thedata do not allow for a division <strong>in</strong>to cod <strong>and</strong> plaice netters.12 A stochastic approach, the stochastic production frontier, canbe used. However, there are also shortcom<strong>in</strong>gs with this approach.It cannot h<strong>and</strong>le the case of multiple output, unless very complexstochastic multiple output distance functions are used, <strong>and</strong> so farit has not been used to estimate <strong>capacity</strong>. The stochastic productionfrontier, with out without a multiple output distance functionspecification, also cannot h<strong>and</strong>le the case of zero-valued outputs.UNCORRECTED PROOF
684685686687688689690691692693694695696697698699700701702703704705706707708709710711712713714715716717718719720721722723reduces the possibility of attribut<strong>in</strong>g deviations fromthe frontier to <strong>in</strong>efficiency.6. ConclusionsThe Danish gill-net fleet exhibits moderate symptomsof over <strong>capacity</strong>. For the most important species,cod, excess <strong>capacity</strong> is 14.9% <strong>and</strong> varies between 7.7<strong>and</strong> 17.0% for the other species. There is some potentialfor reduc<strong>in</strong>g fleet <strong>capacity</strong>. On average, the overallCU is 0.88, <strong>and</strong> when measured with technically efficientproduction, overall CU is 0.92, with nearly halfof the vessels display<strong>in</strong>g a CU less than 1. CU doesnot systematically vary by port.The non-radial measure, the partial CU measure,<strong>in</strong>dicates how much the production of one output canbe <strong>in</strong>creased keep<strong>in</strong>g the other outputs (along with thefixed factors <strong>and</strong> resource stock) fixed. For cod, thepartial CU measure is relatively high, show<strong>in</strong>g comparativelylittle excess production of cod. The partialCU measure for plaice is smaller, <strong>in</strong>dicat<strong>in</strong>g comparativelymore excess <strong>capacity</strong> <strong>and</strong> the possibility to exp<strong>and</strong>the production of plaice.AcknowledgementsThe authors are grateful to comments <strong>and</strong> suggestionsby anonymous reviewers <strong>and</strong> also those receivedat the 1999 Mexico City FAO Technical Consultationon <strong>Measur<strong>in</strong>g</strong> Fish<strong>in</strong>g Capacity <strong>and</strong> at the IIFET Conference<strong>in</strong> Oregon July 2000. The Danish Council ofSocial Research supports the work. The results are notnecessarily those of the US National Mar<strong>in</strong>e FisheriesService.ReferencesBerndt, E., Fuss, M., 1989. Economic <strong>capacity</strong> <strong>utilization</strong> <strong>and</strong>productivity measurement for multiproduct firms with multiplequasi-fixed <strong>in</strong>puts. Work<strong>in</strong>g Paper No. 2932. National Bureauof Economic Research, Cambridge, MA.Berndt, E., Morrison, C., 1981. Capacity <strong>utilization</strong> measures:underly<strong>in</strong>g theory <strong>and</strong> an alternative approach. Am. Econ. Rev.71, 48–52.Cassels, J.M., 1937. Excess <strong>capacity</strong> <strong>and</strong> monopolistic competition.Quart. J. Econ. 51, 426–443.N. Vestergaard et al. / Fisheries Research 1445 (2002) 1–12 11Charnes, A., Cooper, W., Lew<strong>in</strong>, A.Y., Seiford, L.M. (Eds.), 1994. 724Data Envelopment Analysis: Theory, Methodology <strong>and</strong> App- 725lications. Kluwer Academic Publishers, Boston. 726Clark, C.W., 1985. Bioeconomic Modell<strong>in</strong>g <strong>and</strong> Fisheries Mana- 727gement. Wiley, New York, USA. 728Coelli, T., Rao, D.S.P., Battese, G., 1998. An Introduction to 729Efficiency <strong>and</strong> Productivity Analysis. Kluwer Academic Pub- 730lishers, London. 731EEC, 1992. Report 1991 from the Commission to the Council 732<strong>and</strong> the Parliament about the Common Fishery Policy. Sec (91) 7332288. 734FAO, 1999. International Plan of Action for Management of 735Fish<strong>in</strong>g Capacity. FAO Non-Serial Fisheries Publications. ISBN 73692-5-104332-9. 737Färe, R., 1984. The existence of plant <strong>capacity</strong>. Int. Econ. Rev. 73825 (1), 209–213. 739Färe, R., Lovell, C.A.K., Zieschang, K., 1983. <strong>Measur<strong>in</strong>g</strong> the 740technical efficiency of multiple output production technologies. 741In: Eichhorn, W., Neumann, K., Shephard, R. (Eds.), Quant- 742itative Studies on Production <strong>and</strong> Prices. Physica, Würzburg, 743pp. 159–171. 744Färe, R., Grosskopf, S., Kokkelenberg, E., 1989. <strong>Measur<strong>in</strong>g</strong> plant 745<strong>capacity</strong> <strong>utilization</strong> <strong>and</strong> technical change: a nonparametric app- 746roach. Int. Econ. Rev. 30, 655–666. 747Färe, R., Grosskopf, S., Lovell, C.A.K., 1994. Production Frontiers. 748Cambridge University Press, Cambridge. 749Färe, R., Grosskopf, S., Kirkley, J., 2000. Multi-output <strong>capacity</strong> 750measures <strong>and</strong> their relevance for productivity. Bull. Econ. Res. 75152 (2), 3307–3378. 752Farrell, M.J., 1957. The measurement of productive efficiency. J. 753R. Statist. Soc. Ser. A CXX (3), 253–290. 754Fousekis, P., Stefanous, S., 1996. Capacity <strong>utilization</strong> under dy- 755namic profit maximization. Empirical Econ. 21, 335–359. 756Johansen, L., 1968. Production functions <strong>and</strong> the concept of 757<strong>capacity</strong> (Recherches Recentes sur la Fonction de Production). 758Collect. Econ. Math. Econ. 2. 759Kirkley, J., Squires, D., 1999. <strong>Measur<strong>in</strong>g</strong> <strong>capacity</strong> <strong>and</strong> <strong>capacity</strong> 760<strong>utilization</strong> <strong>in</strong> fisheries. In: Greboval, D. (Ed.), Manag<strong>in</strong>g Fish<strong>in</strong>g 761Capacity: Selected Papers on Underly<strong>in</strong>g Concepts <strong>and</strong> Issues. 762FAO Fisheries Technical Paper No. 386. FAO, Rome. 763Kle<strong>in</strong>, L., 1960. Some theoretical issues <strong>in</strong> the measurement of 764<strong>capacity</strong>. Econometrica 28, 272–286. 765Kle<strong>in</strong>, L., Long, V., 1973. Capacity <strong>utilization</strong>: concept, measure- 766ment, <strong>and</strong> recent estimates, <strong>and</strong> recent estimates. Brook<strong>in</strong>gs 767Papers Econ. Activity 73, 743–756. 768Koopmans, T., 1951. An analysis of production as an efficient 769comb<strong>in</strong>ation of activities. In: Koopmans, T. (Ed.), Activity 770Analysis of Production <strong>and</strong> Allocation. Cowles Commission for 771Research <strong>in</strong> Economics, Monograph No. 13. Wiley, New York. 772Morrison, C.J., 1985a. Primal <strong>and</strong> dual <strong>capacity</strong> <strong>utilization</strong>: an 773application to productivity measurement <strong>in</strong> the US Automobile 774Industry. J. Bus. Econ. Stud. 3, 312–324. 775Morrison, C.J., 1985b. On the economic <strong>in</strong>terpretation <strong>and</strong> 776measurement of optimal <strong>capacity</strong> <strong>utilization</strong> with anticipatory 777expectations. Rev. Econ. Stud. 52, 295–310. 778Prochaska, F.J., 1978. Theoretical <strong>and</strong> empirical considerations 779for estimat<strong>in</strong>g <strong>capacity</strong> <strong>and</strong> <strong>capacity</strong> <strong>utilization</strong> <strong>in</strong> commercial 780fisheries. Am. J. Agric. Econ. 60 (5), 1020–1025. 781UNCORRECTED PROOF
78278378478578678778878979079112 N. Vestergaard et al. / Fisheries Research 1445 (2002) 1–12Russell, R.R., 1985. Measures of technical efficiency. J. Econ.Theory 35, 109–126.Segerson, K., Squires, D., 1990. On the measurement of economic<strong>capacity</strong> <strong>utilization</strong> for multiproduct <strong>in</strong>dustries. J. Econ. 75,76–85.Segerson, K., Squires, D., 1993. Capacity <strong>utilization</strong> under regulatoryconstra<strong>in</strong>ts. Rev. Econ. Statist. 75, 76–85.Segerson, K., Squires, D., 1995. Measurement of <strong>capacity</strong> <strong>utilization</strong>for revenue-maximiz<strong>in</strong>g firms. Bull. Econ. Res. 47,77–84.Squires, D., 1987. Long-run profit functions for multiproduct firms. 792Am. J. Agric. Econ. 69, 558–569. 793Squires, D., Kirkley, J., 1996. Individual transferable quotas <strong>in</strong> 794a multiproduct common property <strong>in</strong>dustry. Can. J. Econ. 29, 795318–342. 796Vestergaard, N., 1998. Property rights based regulation <strong>in</strong> fisheries: 797applications <strong>and</strong> theory. Ph.D. Thesis. No. 77. Institute of 798Economics, University of Copenhagen. 799Zieschang, K.D., 1984. An extended färrell efficiency measure. J. 800Econ. Theory 33 (2), 387–396. 801UNCORRECTED PROOF