Long Term Plan 2012-2022. - Hutt City Council
Long Term Plan 2012-2022. - Hutt City Council
Long Term Plan 2012-2022. - Hutt City Council
- No tags were found...

Create successful ePaper yourself
Turn your PDF publications into a flip-book with our unique Google optimized e-Paper software.
TOGETHERWE ARE A CITYA LONG TERM PLAN FOR HUTT CITY <strong>2012</strong>–2022INCLUDING THE ANNUAL PLAN <strong>2012</strong>–2013
HUTT CITY LONG TERM PLAN <strong>2012</strong>-20221GROUP ENVIRONMENT ................................................118Environmental Management .........................................118Emergency Management ...............................................121GROUP ECONOMY .........................................................125Local Urban Environment ..............................................125Economic Development .................................................128GROUP ORGANISATION ................................................133Elected Members ............................................................133Advice and Support ........................................................135Managing Services .........................................................137COUNCIL-CONTROLLED ORGANISATIONS .................143OUR COMMUNITY PARTNERSHIPS .............................146DOLLARS AND CENTS ...................................................149Financial Summary .........................................................149Forecast Financial Statements .......................................150Summary of Significant Accounting Policies ...............162Notes to the Financial Statements ................................171Funding Impact Statement ............................................174Rates for <strong>2012</strong>/2013 ........................................................178Fees and Charges for <strong>2012</strong>/2013 ....................................180DEFINITIONS ...................................................................195CONTACT DETAILS .........................................................198INDEPENDENT AUDITOR’S REPORT ............................202ISSN: 1171-8390 (Print)ISSN: 2253-3079 (Online)
HUTT CITY LONG TERM PLAN <strong>2012</strong>-20223Welcome to our <strong>Long</strong> <strong>Term</strong> <strong>Plan</strong> <strong>2012</strong>–<strong>2022.</strong>
4 HUTT CITY LONG TERM PLAN <strong>2012</strong>-2022This <strong>Long</strong> <strong>Term</strong> <strong>Plan</strong> sets out our plans for the city over the next ten years and beyond.Winner of the 2011 GOLDBusiness Excellence AwardMore than 800 submissions were received onthe Draft <strong>Long</strong> <strong>Term</strong> <strong>Plan</strong>. Five hundred andfifty of these were on the questionnaire form.The results are printed below, along with<strong>Council</strong>’s response on each item.Our Neighbourhoods Make Our <strong>City</strong>PROPOSALSDo you supportthe idea of oneoverall visionfor the city thatcombines theneeds of individualcommunities?Do you agree withthe opportunitiesidentified?YES%NO%DON’TKNOW/NORESPONSE%TOTAL%80 9 11 10064 13 23 100<strong>Council</strong> will continue working to implementits overall vision for the city.Managing Our FinancesDO YOU AGREE WITH … ?Limiting rateincreases to nomore than inflationplus growthYES%NO%DON’TKNOW/NORESPONSE%TOTAL%70 13 17 100Limiting net debt 70 9 21 100Limitingexpenditureincreases to therate of inflation64 16 20 100<strong>Council</strong> has confirmed the financial strategyoutlined in the Draft <strong>Long</strong> <strong>Term</strong> <strong>Plan</strong>.Allocating the Cost of <strong>Council</strong> Services<strong>Council</strong> proposed reallocating the cost ofcouncil services funded through the generalrate among residential, business, utilitynetwork and rural ratepayers.TOTALDO YOU SUPPORT THE PROPOSAL?%Yes 41No 36Don’t Know/No Response 23TOTAL 100%RATEPAYER CATEGORY?TOTAL%Residential 80Business 5Rural 7Utility -Don’t Know/No Response 8TOTAL 100%<strong>Council</strong> has standardised the generalrates paid by business, utility networkand community facilities (category CF3)ratepayers at 2.3 times that of a residentialratepayer, with rural at 0.8 times that of aresidential ratepayer, to be introduced over aten year period.DO YOU SUPPORT THE PROPOSED FIXED RATEOF AROUND $570 (INCLUSIVE OF GST) PERSEPARATELY USED OR INHABITED PORTIONOF RATEABLE PROPERTIES IN THE BUSINESSCENTRAL SECTOR TO FUND A NEW $200,000 CBDDEVELOPMENT AND PROMOTION ACTIVITY?BUSINESSCENTRALRATEPAYERS(N=25)%Yes 24No 64Don’t Know/No Response 12TOTAL 100%<strong>Council</strong> has allocated $100,000 from thegeneral rates to increase its focus on thedevelopment and promotion of the CBD.Advancing the Earthquake Strengtheningof Civic BuildingsTOTALDO YOU AGREE WITH THE PROPOSAL?%Yes 61No 22Don’t Know/No Response 17TOTAL 100%<strong>Council</strong> has agreed to advance the earthquakestrengthening of the Administration Building,Town Hall and Horticultural Hall.PREFERRED FUNDING OPTIONOPTION 1:Increasing the 2015 net debttarget from $40m to $50mOPTION 2:Increasing the 2015 net debttarget from $40m to $45m andalso delaying a number of plannedcapital projectsOPTION 3:Sticking to the 2015 net debttarget of $40m and delaying agreater number of planned capitalprojectsTOTAL%373724Don’t Know/No Response 2TOTAL 100%<strong>Council</strong> has agreed to Option 2 in view ofthe support expressed for this option and forlimiting net debt as part of <strong>Council</strong>’s financialstrategy.
HUTT CITY LONG TERM PLAN <strong>2012</strong>-20227BACKGROUNDGLOBAL CONTEXTIn 2010 the Commonwealth Scientific &Industrial Research Organisation (CSIRO)in Australia presented “Our Future World:an analysis of global trends, shocks andscenarios”. The five interrelated megatrendsidentified in the report are:More from less – this relates to theincreasing demand for natural resourcesthrough economic and population growthwhich will require a focus on resource useefficiency in the coming decades.A personal touch – the services sectorof western economies is becoming morefocused on innovation aimed at tailoring andtargeting services.Divergent demographics – westerneconomy populations are ageing andexperiencing lifestyle and diet related healthproblems. At the same time there are highfertility rates and problems of not enoughfood for millions in poor countries.On the move – people are changing jobsand careers more often, moving housemore often, commuting further to work andtravelling around the world more often.i World – everything in the natural world willhave a digital counterpart. Computing powerand memory storage are improving rapidly.Many more devices are getting connected tothe internet.CSIRO also identified eight “megashocks”.A global risk or “megashock” is a significantand sudden event, the timing and magnitudeof which is very hard to predict. The eightmegashocks identified in the report are:• asset price collapse• slowing Chinese economy• oil and gas price spikes• extreme climate change related weather• pandemic• biodiversity loss• terrorism• nanotechnology risks.THE ROLE OF LOCAL GOVERNMENTNeither New Zealand nor <strong>Hutt</strong> <strong>City</strong> isimmune to trends such as the demand forbroadband, national infrastructure changes anddevelopment, or growing lifestyle and relatedhealth issues like obesity and the ageingpopulation. Given the trends, the currentshape, purpose and role of local governmentwill need to be significantly different in 2020and local government is in a perfect position to:• work with the private sector, to achieve avibrant and internationally competitive <strong>Hutt</strong><strong>City</strong> that is prosperous and sustainable• do more for less through use oftechnology and economies of scale• lead the green revolution• provide services that meet the demandfor electronic connectivity, and• collaborate with other localgovernment organisations to helpNew Zealand compete successfully inthe international economy.Cities will drive economic growthGlobalisation and the knowledge economyhave repositioned cities as the driversof national economies. By 2025 75% ofthe world’s population will live in cities ormetropolitan areas. The exciting challenge forlocal government is, together with the privatesector, to achieve vibrant and internationallycompetitive cities and regions that areprosperous and sustainable.Doing more for lessAdvancement in technology is a key driverthat can change the way we do things - sowe can do things quicker, more accuratelyand at less cost. Arguments based oneconomies of scale are creating pressure forservices to be managed on a regional basisand even for local authorities to amalgamate.However the traditional approach of centralgovernment to design and deliver socialservices on a “top down” basis means theseservices do not realise their full potentialbecause of a lack of local connectionsand knowledge. There is a role for localgovernment in facilitating the effectivedelivery of social services because of its localknowledge and local connections.Leading in the green economyThere is now a sense of urgency to fix theenvironmental problems of the modern world.Public concerns for action are driving theneed for a response by central government,local government and the corporate world.Local government could play a leading rolein promoting a low carbon footprint city ordistrict. It could lead by example in energyefficiency, promotion of walking, cycling andpublic transport and landfill management.More than 5,000 hectaresof parks and reserves
8 HUTT CITY LONG TERM PLAN <strong>2012</strong>-20226 swimming poolsInformation technology-led transformationof service deliveryThe growth of the services sector in westerneconomies is being followed by a secondwave of innovation aimed at tailoring andtargeting services. Mass collaboration ispowering the new economy – social mediaof YouTube, Facebook and Myspace arebased on participation of their communities.Successful brands like Apple are reshapingthe future. Constant connectivity in anon-demand world is the expectation of anew generation growing up and becomingcustomers of local government.International relationshipsThe future prosperity of New Zealand lies incompeting successfully in the internationaleconomy. Local government needs tocollaborate with each other to leveragethe collective strengths brought to theinternational marketplace. The positioningstatement that won New Zealand the hostingof Rugby World Cup 2011 “A stadium of 4million people” can just as readily be appliedto the national economic “game”.ISSUES FOR HUTT CITYWhile the global context is important, thereare a number of issues that are specificto the region and to <strong>Hutt</strong> <strong>City</strong>. One of themore important questions is the regionalgovernance structure into the future.Thought needs to be given to the impactregional governance changes might have on<strong>Hutt</strong> <strong>City</strong> and how the city shapes its ownfuture.Across the local government sector there is agrowing focus on councils working togetherto provide “shared services”. There areexisting shared services agreements, forexample Capacity is the result of a sharedservices agreement with Wellington andUpper <strong>Hutt</strong> <strong>City</strong> <strong>Council</strong>s. We recentlyentered into a five year shared service libraryagreement that involves three other localauthorities. The regional Chief Executiveshave a set of services they are looking atwith regard to shared services, and we’vecontinued to seek opportunities to provideshared services with Upper <strong>Hutt</strong> <strong>City</strong> <strong>Council</strong>.We’ve been active in the area of citydevelopment for a number of years. Thekey decision now is how much and wherethe emphasis should be. <strong>Hutt</strong> <strong>City</strong> is laggingbehind other cities in the region in terms ofgrowth and is projected to have the lowestlevel of growth in the region by 2031.In response we’re starting work on thedevelopment of an urban growth strategy –see page 23 for more information.Fundraising for community assets is anaspect of city development. What is theactual level of funding the <strong>Council</strong> can raise?What other avenues of funding are availablewithin the community? The move towardsestablishing a Community Facilities Trust isan example of <strong>Council</strong> thinking “outside thesquare” to provide 21st century communityservices and facilities for the city.Current key priorities include:• Progressing the development of the CBDvia the CBD Vision 2030 and CBD MakingPlaces programme• Developing interconnected transportcorridors, in particular a solution to thevolume of traffic, particularly heavy traffic,along the Esplanade• Implementation of the SeaviewGracefield Vision• Implementation of the Petone Visionincluding Petone West <strong>Plan</strong> Change• Development of a second generationDistrict <strong>Plan</strong>.The last six years or so have seen thedevelopment of a number of plans, policiesand strategies to set the direction for thecity. This work needs to be integrated with“business as usual” and priorities establishedwithin financial limits. Page 14 outlines ourvision for the city and plans to develop ourneighbourhoods as part of our overall vision forthe city. Page 17 outlines the strategies thatwill help us to achieve our vision for the city.There are key financial priorities to addresssuch as planning for the future replacementof our ageing facilities such as halls, librariesand pools so that they are more relevant,cohesive and flexible spaces that will meetcontemporary and future needs. Our financialstrategy is outlined from page 18 and page 28onwards includes more information about thecity’s assets.Flood management remains vitallyimportant. While we’ve done a lot since2004 the risk remains and will never beeliminated. Our stormwater activity listsa number of projects aimed at improvinglevels of protection against flooding, thelargest of which is an eight year multi-milliondollar project on the Awamutu Stream. Wecontinue to work closely with the Regional<strong>Council</strong> to develop a floodplain managementplan for the Waiwhetu Stream, and to coordinatelocal stormwater improvementswith Greater Wellington’s ongoing <strong>Hutt</strong> Riverflood protection works. Work also continueson a general upgrade of stormwaternetworks and hotspots.
HUTT CITY LONG TERM PLAN <strong>2012</strong>-20229Water supply/demand will be a growingissue if the city’s population increasesbeyond the numbers predicted. Demandmanagement and other conservationmeasures can provide some counter to thisin the short term. Further water storageinfrastructure will be required at some futurepoint if the region’s population increases aspredicted, and Greater Wellington Regional<strong>Council</strong> is planning to make a decision abouta dam in 2014.Government funding for roads is clearlyfocussed on state highways (roads of nationalsignificance). Securing funding is becomingmore difficult. Our roading and traffic projectslisted from page 96 identify the expectedlevels of government subsidy.Social housing is ill matched to currentneeds (e.g. too many bedsits), and age of theasset (many built in the early 1960s) meansa growing maintenance spend. Populationgrowth projections indicate that there will bea growing number of smaller and one personhouseholds despite modest populationgrowth.COMMUNITY PROFILEIn 1961, Lower <strong>Hutt</strong> <strong>City</strong> had a population of53,044, with the populations in the boroughsof Petone, Eastbourne and Wainuiomata 9,888,2,654 and 9,190 respectively.Development of the <strong>Hutt</strong> Valley as suburbsoccurred within the 1930s to 1960s as agovernment development around railway-basedsuburbs, but continued from 1960 to about1975 as private sector, car-based suburbs.Housing shortages and poor quality housingprompted the new government of 1935-1938to initiate an extensive government housebuilding programme. For this reason many ofthe suburbs were well laid out in accordancewith modern town-planning practice. Thepopulation was predominantly Europeanalthough Mäori retained an importantpresence and were very involved in localpolitics during this time.In the 1960s Lower <strong>Hutt</strong> was seen as a cityof lovely homes, abundant parks and playingfields, providing a full range of cultural andbusiness facilities “including a civic centrethat would do credit to a place twice itssize”. 1 Several community centres and publichalls were built to meet neighbourhood needsfor communal activities and public gatheringspaces. Lower <strong>Hutt</strong> was New Zealand’sfirst garden city and had a strong landscapeheritage in formal planted gardens and gardenrelated attractions.Commercially the city occupied an importantcentral position, was handy to all formsof transport and because of this hadbecome one of the largest and busiestof New Zealand’s manufacturing centres.Nowhere was it “drab, depressed or rundown; on the contrary it was a bustling,spacious, pleasant city.” 2The commercial and civic centre of Lower<strong>Hutt</strong> was spacious with ample parking andmany modern buildings were built by theprivate sector. There was a transport centrewhich was the hub of operations and includeda day nursery. There were many beautifulchurches, gardens, parks, sports facilities andscenic reserves. Thousands thrilled to thesport of night trotting at <strong>Hutt</strong> Park raceway,one of the very few in the country.In industrial activity Lower <strong>Hutt</strong> was ratedamong the busiest cities in New Zealandwith almost every kind of manufacturingbeing carried on within its boundaries –television and locomotive manufacturing, milkprocessing, tyre retreading and printing beingsome examples.From about 1960 onwards, the government’ssuburb building in the <strong>Hutt</strong> Valley slowedwith the private sector developing thesuburbs of Wainuiomata and the WesternHills. By this stage car ownership was atone per household and public transportuse was falling by 30 to 50% relative to its1950 patronage. Retail was changing awayfrom businesses that owned their modestpremises to larger shopping centres built andrented out, usually by financial institutions.Suburban retail either comprised such ashopping centre if it was sufficiently selfcontainedor (for example, the western hillssuburbs) with a very basic number of shops,with the expectation that residents wouldshop in the new shopping centres locatedwithin Lower <strong>Hutt</strong> or Wellington <strong>City</strong>. 3Since the 1960s the number of bigmanufacturing industries has decreasedmarkedly and the city has changedconsiderably.1 <strong>City</strong> of Lower <strong>Hutt</strong> New Zealand produced for theLower <strong>Hutt</strong> <strong>City</strong> Corporation by the Thompson-KitchingCompany and printed by Hutcheson, Bowman andStewart Ltd, Wellington, circa 19652 Ibid n.1 above3 Dravitski, V and Powell F, Survival or Decline in LocalShopping: A Wellington Case Study, 2008, presentationat International Cities Town Centres & CommunitiesSociety ICTC 2008 Sydney Olympic Park, Sydney,Australia 7 – 10 October, 200840 km of coastline
HUTT CITY LONG TERM PLAN <strong>2012</strong>-202211It is unlikely that <strong>Hutt</strong> <strong>City</strong> will see majorgrowth if we continue with business asusual. This means that it is unlikely that therewill be a change in the type of employmentavailable to retain young people or largeamounts of the residential, commercial orindustrial development needed to stimulateand maintain economic development.The reverse side of this is that low levelgrowth means that there will be lesspressure to build new infrastructure to meetgrowing demand. On the other hand, lowlevel growth means we must ensure that thecurrent capacity is sufficient to meet existingand slightly more need. For example, withoutintervention to encourage greater growththan projected, the city is unlikely to needmore/bigger stormwater pipes. We need toaddress such issues as:• what is the capacity of the current set up?• what excess capacity is there, if any?• what is the actual condition of the pipes,as not much development is likely?• what is the condition of communityfacilities and how will we meetcommunity needs in the future?These questions will be considered furtheras we develop our urban growth strategy forthe city (see page 23).The areas of high deprivation continue tobe the same, and the areas with higherpopulation growth and a younger populationinclude Naenae, Taita and Epuni. The youngpeople who will be future ratepayers willbe predominantly Asian, Mäori and PacificIsland, and the latter two groups are notcurrently succeeding educationally as wellas is desirable for building an economydependent on science and technology.Whether and how we influence change inthis area will have an impact on the ongoinggrowth and development of the city.Leisure, recreation and wellbeingThere are a number of trends of particularrelevance to sport and recreation, inparticular the ageing population and theincreasing casualisation of sport andrecreation activity through the growthof individual pursuits and new sport andrecreational pursuits.The growing numbers of younger Mäori,Pacific Island and Asian people in <strong>Hutt</strong> <strong>City</strong>may see the traditional sporting codes ofrugby and cricket becoming less popularand the need for grounds – especially highlyspecialised surfaces – reduce. The ageingpopulation might see a rise in the popularityof games like croquet and bowls.Will our current approach to sports groundsand other playing surfaces continue tomeet population needs into the future,or should more emphasis be placed onfacilitating and meeting the growth inindividual participation in recreationalactivities such as walking and cycling?How will we ensure that we continue toencourage physical activity so that wecan contribute to reducing the incidenceof obesity, diabetes and heart disease inpopulations that suffer most from theseailments – Mäori and Pacific Island peopleand low socio-economic populations?Community demand has remained relativelyunchanged over the last 20 years with thosecommunities that were boroughs prior toamalgamation in 1989 focused on retainingall the services that were provided by theborough councils. This has resulted in theuneven allocation of resources across thecity and cannot continue if <strong>Council</strong> and itspartners are going to be able to meet leisureand recreation demands of residents in 2031.Walking and gardening, in that order, werethe two most popular activities for both menand women. Population projections suggestthat, as with the rest of New Zealand, therewill be more women than men living in <strong>Hutt</strong><strong>City</strong>. Together with the ageing populationdo the gender differences have implicationsfor the type of recreational activity and/orspaces we provide into the future? There willbe approximately 2000 more women in <strong>Hutt</strong><strong>City</strong> in 2031 than men.Other issues driving change in this areainclude:• increasing obesity across the wholepopulation• the need to reduce health risks andhelp lower the costs of healthcare• building constructive and positivesocial behaviour and healthy andstrong communities.How will <strong>Hutt</strong> <strong>City</strong> continue to provide topclass facilities such as swimming pools andgymnasiums into the future that will meetthe actual needs of the population rather thanmerely maintaining the status quo?Our active recreation and sport strategy isdue to be updated and will consider suchquestions as these.800 businesses focusedon science and innovation
12 HUTT CITY LONG TERM PLAN <strong>2012</strong>-202213 suburban shopping centres,streets of vibrant retail shopsand a large super mallLiteracy, education and technologyOur provision of services and facilities in theform of libraries means that all citizens haveaccess to information, knowledge, technologyand learning opportunities. The servicesand facilities are a collective resource thatis greater than any individual or family couldafford or accommodate. Libraries supportcommunity learning, literacy and recreation.Libraries are well placed to support theeducational development of the young peoplewho will be future ratepayers, particularly interms of access to technology. 1 Libraries ofthe future have a key role to play in:• delivering consistent and effectiveprogrammes, products and services• developing collections that enrich theprogrammes, products and servicesdelivered to the community• providing a robust and scalable digitalplatform that supports technologicalgrowth and progress in the city.The libraries also play a key role in preservingand showcasing local history.Arts and culture<strong>Hutt</strong> <strong>City</strong> has a nationally significantcontemporary art museum in the Dowse aswell as the public art gallery for Lower <strong>Hutt</strong>city. Opened in 1971, The Dowse has forged areputation for presenting quality exhibitions andevents with a special focus on craft and design.Today, the Dowse’s programming is diverseand exciting, presenting works by local andinternational artists to a range of audiences.1 Taita North, Gracefield and Moera had the lowest rateof access to the internet, a fax machine and a telephoneindicating that access is related to income.Research shows that arts and culture are anessential part of any vibrant city that wantsto develop and grow economically. A strongarts and culture sector attracts talentedpeople who in turn develop entrepreneurialand innovative projects that contribute toeconomic growth. The Dowse is in an idealposition to lead the future development of avibrant focal point within the cultural precinctof the city that integrates the gallery, parkand street and effortlessly connects art withpeople, offering a diversity of visual art,leisure and learning experiences.The Dowse is also in an ideal position to leada drive in <strong>Hutt</strong> <strong>City</strong> towards innovation andcreativity by developing and taking advantageof a new sustainable approach that builds onits foundations as a leader in contemporaryart and its high level of engagement with thecommunity. Green technologies and globalcommunications will enable the Dowse torevolutionise its business and arts relatedpractice while showing leadership in themuseum sector and with the community,attracting the innovative thinkers andentrepreneurs needed to encourageeconomic growth.Given the importance of the arts and culturesector to the development and growth ofsuccessful cities, we need to consider howbest to invest in the Dowse to ensure that<strong>Hutt</strong> <strong>City</strong> is able to build on the drive towardsa creative and innovative economy that isflexible and resilient.Open spaces and green reservesIt is likely that access to open spaces andgreen reserves will increase in importanceas the make up of the population changes,particularly if the city focuses its growthambitions on increasing housing density closeto neighbourhood centres.There will be a high demand for well plannedopen spaces with good walking and cyclinglinks, particularly adjacent to those areas ofintensified residential development focusingaround key nodes including the city heart,Petone West, transport hubs and residentialvillage centres.Parks will need to provide a high level of publicamenity and the recreational opportunitiesprovided by the city’s main asset - Te AwaKairangi – better exploited. Greenways willneed to be developed along street corridors,especially leading to Te Awa Kairangi andPetone Foreshore from the central and urbanareas of <strong>Hutt</strong> <strong>City</strong>, to complement apartmentliving in the CBD for example.The impact of continuing residentialdevelopment on the Western Hills will needto be softened by protecting regeneratingbush gullies and developing ecologicalcorridors to link the bush areas of BelmontRegional Park.Development of tourist or wildernessdestinations will require continued work toreturn the coastal and harbour edges to theirnatural character.The natural environment of the city is astrength and one that could be an importantpart of ensuring people are attracted to thecity to live, work and play thereby increasing<strong>Hutt</strong> <strong>City</strong>’s share of regional growth.
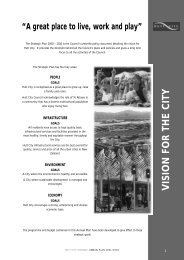
13HUTT CITY LONG TERM PLAN <strong>2012</strong>-2022A city where thereis always somethingfor families and theirvisitors to explore.A city that representsa smart choice forworking or investing.A city that peopleare proud to live in.We have a visionfor our city ...
14 HUTT CITY LONG TERM PLAN <strong>2012</strong>-2022VISION FOR THE CITY250 playing fields in 28sports grounds .We have a vision for this city’s future. Ourvision is that <strong>Hutt</strong> <strong>City</strong> will be a great placeto live, work and play. This means:People are proud to live here<strong>Hutt</strong> <strong>City</strong> is compact, vibrant and diverse,offering the best of city living while beingsafe, friendly and easy to get around. Thereis quality education and healthcare, with achoice of housing options from apartments tofamily homes on the hillsides, in the valleysor near the coast.Working or investing here is asmart choiceOur vibrant economy offers a range ofjob opportunities close to home. We’vebuilt on our traditional industries, createdexport opportunities, and cementedour reputation as a science centre. Thisis a place of new ideas, creativity andinnovation, bringing together the best ofthe arts, industry and science.There’s always something for thefamily to exploreExperience our culture and heritage, visitour museums and libraries, or enjoy ourcafes, restaurants and boutique stores. Headoutdoors to a park or beach, walk alongthe river, take the boat out, hit the hills or amountain bike trail, or enjoy a game of golf.DEVELOPING OUR NEIGHBOURHOODSAS PART OF OUR OVERALL VISION FORTHE CITYThe neighbourhoods we know are part ofthe city we are.The vision we have for the city takes ahigh-level view of the uniqueness of eachneighbourhood, its people and communities,its natural environment and employmentopportunities and the economic, cultural,social and environmental strengths withineach neighbourhood we as a city need inorder to develop a strategy for making thevision a reality.Surrounded by hills and sea with a riverflowing through, Lower <strong>Hutt</strong> offers residentsa rich variety of places they can call home.Some of our residential villages are renownedfor heritage and history by the sea, someare nestled amongst the hills and others arelocated centrally.Working close to home is an option for<strong>Hutt</strong> residents with a number of significantemployment hubs. These include commercialand light industrial at CBD and PetoneCentral, the medical sector at Boulcott,heavy industry at Seaview, and Avalon andGracefield for science, technology andresearch. Smaller businesses and shopsoperate out of neighbourhood shoppingcentres and people work from home.As destinations, visitors come for places thatmake Lower <strong>Hutt</strong> unique in the Wellingtonregion - we have museums, seaside villagesas well as a unique collection of galleries,cafes, restaurants and shopping experiences.We also have neighbourhoods that serve as‘wilderness gateways’ - visitors need nottravel far to enjoy pristine natural forests,bush and the wild southern coastlines.Not everyone is in the <strong>Hutt</strong> for leisure or work– residents and visitors participate in a widerange of sports. Places like Taita and Naenaeboast regionally significant sports facilities.These neighbourhoods attract visitors andresidents as sports destinations, includingWalter Nash Stadium, Fraser Park and theNaenae Swimming and Fitness Complex.<strong>Hutt</strong> also has recreational green spacesincluding golf clubs, the Petone RecreationalGround and <strong>Hutt</strong> Park in Seaview.Everyone who lives, works and plays in<strong>Hutt</strong> <strong>City</strong> has things they treasure and thatare important to them, and our visioningexercises and local community planshighlight the opportunities we have to furtherdevelop our neighbourhoods by workingtogether as citizens.In combining these into one overall visionfor the city, we’ve also considered thechallenges we face over future growth anddevelopment of the city, and changes aheadrelated to leisure, recreation and wellbeing;literacy, education and technology; arts andculture; and open spaces and green space.
HUTT CITY LONG TERM PLAN <strong>2012</strong>-202215Opportunities for leisure andwellbeing include:• maintaining and preserving the heritagecharacter, culture and identity of Petone• preserving the look and feel of the oldparts of Alicetown to ensure continuationof a sense of place• where possible combining <strong>Council</strong> facilitiessuch as libraries, pools, community hallsand community houses across the cityinto hubs for people to enjoy, revitalisingand making these facilities more visibleand better integrating them into their localcommunity• developing the Sportsville concept acrossthe city to bring sporting clubs together toenjoy shared facilities• encouraging the development ofcommunity/social services hubs• enhancing areas that can be used forwalking or recreational use, or as child oryouth activity areas• making safety improvements to supportincreased walking and cycling• maintaining and improving communityfacilities• beautifying neighbourhoods with public artwhere appropriate• making parks more visible for communityuse and improving connectionsto surrounding residences, betteruse of existing pocket parks, anddevelopment of additional community andneighbourhood parksOpportunities for growth anddevelopment include:• CBD development incentives• developing suburban shopping centresacross the city to ensure these areattractive and meet the needs of locals• events and installations related to scienceand technology• developing tourism opportunities (Petoneto Alicetown to <strong>Hutt</strong> Central) and creatinglocal jobs (Wainuiomata wildernessgateway)• developing lifestyle opportunities(western hills)• opening up Homedale for development• developing the Wainuiomata Hill lookoutpoint and walkway• developing a growth plan forSeaview Gracefield• continuing with Making Places andStepping Stones projects such as theCivic Square, Riverside Promenade, trafficprecinct and civic centre improvements• working with Port Nicholson BlockSettlement Trust on developmentopportunities where they arise• working with Housing New Zealand todevelop housing opportunities in Taitaand Pomare• Petone West <strong>Plan</strong> Change• investigating opportunities for better useof semi-industrial areas• developing facilities for older adults inWainuiomataEnvironmental opportunities include:• establishing visitor gateways or entrances• enhancing visual connections to the sea• developing Belmont Regional Parkentry points• investigating opportunities to develop thequarry next to Kelson into a park• investigating opportunities to createnational bird corridors• general beautification activitiesInfrastructure opportunities include:• improving transport, roading andpedestrian connections, access and safetyacross the city• improved or consolidated parking provisionin Waterloo and Naenae• flood protection• improving pedestrian access to the <strong>Hutt</strong>and Wainuiomata rivers• improving alleyway connections• resolving traffic issues on The Esplanade• improved pedestrian and cycleconnections across the city includingconnections across the railway line, to theriver and sea, and connections betweenneighbourhoods• intersection improvements Witako/Waterloo Road• improving the walking environmentand developing or enhancing walkwaysthroughout the city• stop bank works on Harcourt Werry Drive• Western Hills to SH2 connections• continuing Cross Valley Link investigationswww.huttcity.govt.nz/longtermplan hasbackground information about theseopportunities and a greater level of detail
HUTT CITY LONG TERM PLAN <strong>2012</strong>-202217STRATEGIES TO ACHIEVE THE VISIONFrom page 7 we outline the challenges we face over future growth and development ofthe city. We also comment on changes ahead related to leisure, recreation and wellbeing;literacy, education and technology; arts and culture; and open spaces and green space.We’ve considered these issues in developing a vision for each of our neighbourhoods as partof our overall vision for the city.We’ve also been working on the strategies that will help us to achieve our vision for the city.We have an overarching financial strategy supported by other strategies grouped under theheadings of growth and development, leisure and wellbeing, environment and infrastructure.FINANCIAL STRATEGYOutlines factors expected to have a significant impact on <strong>Council</strong>over the next ten years, expected changes in population andland use, costs of providing for those changes, expected capitalexpenditure on network infrastructure required to maintainexisting levels of service, and other significant factors affecting<strong>Council</strong>’s ability to maintain existing levels of service and meetadditional demands for serviceGROWTH AND DEVELOPMENTCBD Making PlacesVision Seaview GracefieldWingate Development <strong>Plan</strong>Petone West <strong>Plan</strong> ChangeUrban Growth StrategyEconomic Development StrategyLEISURE AND WELLBEINGIntegrated Facilities <strong>Plan</strong> – will include integrated local areaplanning; potential hubs of facilities and consideration of thegeographic spread of facilities; includes Community Halls andHousesActive Recreation and Sport Strategy including our walking andcycling strategiesACTIVITIES INVOLVEDAll ActivitiesACTIVITIES INVOLVEDEconomic DevelopmentLocal Urban EnvironmentRoading and TrafficParks and ReservesEnvironmental ManagementACTIVITIES INVOLVEDMuseumsLibrariesAquatics and RecreationParks and ReservesCommunity DevelopmentAquatics and RecreationParks and ReservesRoading and TrafficCommunity development initiatives affecting wellbeing:• Children and Young People• Ageing Together Strategy• Settlement Support• Safe <strong>City</strong>• Disability• Gambling Policy• Social Housing/Housing PolicyCommunity Arts and Culture PolicyReserves Strategic DirectionsHeritage PolicyCommunity Engagement StrategyENVIRONMENTLiteracy, education and technologyArts and cultureEnvironmental Sustainability StrategyWater Conservation and Efficiency <strong>Plan</strong>Waste Management and Minimisation <strong>Plan</strong> 2011-2017District <strong>Plan</strong> Monitoring ProgrammeUrban Forest <strong>Plan</strong>INFRASTRUCTUREOrganisational Infrastructure Asset Management <strong>Plan</strong> – one plancombining high level aspects of existing plansEnvironmental ManagementEmergency ManagementCommunity DevelopmentAquatics and RecreationParks and ReservesLocal Urban EnvironmentAdvice and SupportACTIVITIES INVOLVEDLibrariesMuseumsWater SupplyStormwaterWastewaterSolid WasteLocal Urban EnvironmentEnvironmental ManagementParks and ReservesACTIVITIES INVOLVEDWater SupplyStormwaterWastewaterSolid WasteUrbanPlus <strong>Council</strong> ControlledOrganisationRoading and Traffic
18 HUTT CITY LONG TERM PLAN <strong>2012</strong>-2022Financial StrategyOur 2009 financial strategyOur 2009 long term plan included a financial strategy with targets to reduce net* debt to $30mby 2015 (this figure was subsequently amended to $40m), and to keep annual rate increasesbelow the rate of inflation plus growth. The strategy also included targets covering the cost todeliver services, financial position, funding supply and financial risks. The strategy had a goal ofstrengthening <strong>Council</strong>’s financial position in anticipation of projects and programmes that willneed funding in the next 20-30 years.The current position is identified in the table of limits (page 19). While the financial position isgood, our capacity to meet future requirements is a concern. This is illustrated by the graphbelow, showing the future capital spend as an increasing trend which pushes up debt.Amount ($ millions)Net Debt as at 30 June each year100908070605040302010045m50m<strong>2012</strong> 2014 2016 2018 2020 2022 2024 2026 2028 2030 2032<strong>2012</strong> 2013 2014 2015 2016 2017 2018 2019 2020 2021 2022 2023 2024 2025 2026 2027 2028 2029 2030 2031 2032Net Debt at67 60 51 45 56 65 64 56 44 56 52 44 46 49 59 62 80 81 75 72 60end of the yearDebtTargets45 50 50 80Note: The years 2023 – 2032 have not been audited and are disclosed only to show a trend.*Net debt includes gross debt less cash and other cash investments50m80m<strong>Council</strong> has measured its success by limiting rate increases and ensuring its rates werecompetitive when compared to local authorities with a similar population and a significanturban centre. <strong>Council</strong> also prides itself on delivering services at costs below our peer localauthority average.Amount ($ millions)Annual Rates180160140120100806040200<strong>2012</strong> 2014 2016 2018 2020 2022 2024 2026 2028 2030 2032Total Rates RevenueRates per Capita1700150013001100900700500300100-100Note: The years 2023 – 2032 have not been audited and are disclosed only to show a trend.Our <strong>2012</strong> financial strategyThe goal of our 2009 strategy is still relevant today and we’ve continued this approach in ournew financial strategy, which includes the same rates target, and targets to limit net debtto $45m in 2015 (increased from $40m to part fund earthquake strengthening of the civicbuildings in Laings Road), $50m in 2020, $50m in 2025 and $80m in 2030. We’ve retainedother limits including keeping net debt per capita below $1,000, which would equate to $100mnet debt, and limiting expenditure increases to the rate of inflation.These elements continue in the new strategy, with additional limits placed on net debt andcapital expenditure (spending that will increase the value of the city’s assets). These targetswill create borrowing capacity for the next 20 years and enable <strong>Council</strong> to meet the demandsfor future infrastructure. The net debt levels are also kept at affordable percentages of totaloperational spend. Rate increases are set to ensure that rates remain affordable and move onlyas necessary to reflect inflation. These targets also apportion funding costs between currentand future ratepayers. Keeping capital spend close to depreciation ensures <strong>Council</strong> is notbuilding up large cash balances and is spending enough to maintain existing assets.Rates per Capita ($)
22 HUTT CITY LONG TERM PLAN <strong>2012</strong>-2022Smartlinx3Part of the <strong>Council</strong>’s Economic Development Strategy included the undertaking of a surveyof businesses completed in early 2003, to understand broadband infrastructure needs in <strong>Hutt</strong><strong>City</strong>. The survey indicated a large number of businesses had ongoing issues with either or bothaccess to and the cost of broadband.An outcome of the survey was the establishment of a business led, <strong>Council</strong> supportedcompany (Smartlinx3). It was representative of businesses in <strong>Hutt</strong> <strong>City</strong>, Upper <strong>Hutt</strong> <strong>City</strong> andPorirua <strong>City</strong>, and the three councils.Smartlinx3 has deployed broadband assets in the three cities and provided some competitionto pricing of broadband services. However, the value of <strong>Council</strong>’s investment in thecompany has diminished over time. Recently, new investment into the company by externalorganisations has improved prospects for growth.A formal return on investment is not anticipated in the near future.Capacity Infrastructure ServicesThis company is owned by Wellington and <strong>Hutt</strong> <strong>City</strong> <strong>Council</strong>s. The nature of the business of thecompany is to jointly manage the water services for these two councils and also for Upper <strong>Hutt</strong><strong>City</strong> <strong>Council</strong>. Our objective for this company is for it to manage, for the long term, the provisionof water, wastewater and stormwater services and to operate as a successful business.A formal return on investment is not anticipated in the near future as the business is managedon a non-profit basis.Local Government Funding Agency (LGFA)Debt is a significant funding source for many local authorities. Interest costs are a major itemof expenditure for these councils. <strong>Hutt</strong> <strong>City</strong> <strong>Council</strong> is considering investing in LGFA to helpsupport the sector by providing a potential reduction in the costs of borrowing. While <strong>Hutt</strong> <strong>City</strong><strong>Council</strong>’s debt levels are relatively low, the LGFA also provides an additional borrowing sourceand potential savings in interest costs.In addition, the LGFA will provide local authorities with increased certainty of access to fundingand terms and conditions, including the potential access to longer funding terms, eg. longerthan 10 years.The return anticipated is through benefit of lower borrowing costs and security of longer termfunding rather than a formal dividend.As a shareholder or guarantor <strong>Council</strong> will have increased exposure to liability for repayment ofdebt.Seaview Marina Limited (100% owned CCO)<strong>Council</strong> holds 100% of the shares issued by Seaview Marina Limited. <strong>Council</strong>’s objective isfor it to operate a successful and profitable marina providing berth and associated services,and providing public marine recreation facilities as a facility for the enjoyment of the Lower<strong>Hutt</strong> community, without compromising its commercial objectives and environmentalresponsibilities.Return on investment is 5% before tax on shareholders’ funds in accordance with thecompany’s Statement of Intent. This return is reinvested within the company.Urban Plus Limited (100% owned CCO)<strong>Council</strong>’s objectives for this company is for it to own and operate a portfolio of rental housing,develop property in preparation for sale or lease, and manage council property and buildingassets.Returns are forecast in the company’s Statement of Intent.<strong>Hutt</strong> <strong>City</strong> Community Facilities TrustOn 13 March <strong>2012</strong> <strong>Council</strong> agreed to a proposal to establish a charitable trust to manage anddevelop its leisure and community facilities.Our objective for this Trust is for it to enhance the health and wellbeing of the city’scommunities through the effective and efficient provision, development and operationof leisure and community facilities throughout <strong>Hutt</strong> <strong>City</strong>. This will include establishing adevelopment fund to enable investment and improvement of community facilities, developingnew or enhancing existing facilities, administering any facilities vested in the Trust, andproviding strategic direction, expert advice and championing ongoing investment anddevelopment.No return on investment is agreed at this stage.
24 HUTT CITY LONG TERM PLAN <strong>2012</strong>-2022The vision we have for the city takes a high-level view of the uniqueness of eachneighbourhood, its people and communities, its natural environment and employmentopportunities and the economic, cultural, social and environmental strengths within eachneighbourhood that we need in order to make this vision a reality.Many cities, districts and communities in New Zealand have chosen to develop a growthstrategy as a way of planning for the impacts of national and global trends and makingtheir vision for their cities, districts and communities a reality. A growth strategy makesit possible for those cities, districts and communities to influence the type of growth thatoccurs as well as where it should happen, and to better plan for future investment incommunity infrastructure.We have recently begun thinking about our growth strategy for the next twenty years andmore, and we’ve done initial work on how our population might change and some of thepossible implications.<strong>City</strong> and regionOver the past decade <strong>Hutt</strong> <strong>City</strong> has seen relatively low population growth compared to theWellington region and nationally. Along with other areas of the Wellington region, apart fromWellington city and Kapiti Coast district, we’re only projected to see modest population growthin the years to 2031.With growth mainly driven by Wellington city and Kapiti Coast, Statistics New Zealandis projecting that the region can expect to see average annual growth of 0.6%, with thepopulation growing by around 75,000. Under the high series projections (which use higherbirth rates, lower mortality rates and high net migration), the region would grow by 1.1%annually, with an increase of around 152,000 people by 2031. 1During the same period <strong>Hutt</strong> <strong>City</strong> is projected to see average annual growth of 0.2%, with thepopulation increasing to just over 105,100. Population growth is also projected to be confinedto specific areas of the city, such as Petone Central, Esplanade, <strong>Hutt</strong> Central, Maungaraki,Tirohanga, Belmont, Kelson, Naenae North and Waiwhetu South.If our growth matched the average projected for the region, we would grow by an average of0.6% a year, and by 2031 our population would be around 116,500.Growth of 0.4% a year – a level that is half way between that projected for the city and thatprojected for the region – would see our population reaching around 112,000 by 2031.To match the higher growth scenario projected for the region, our city would need to grow by1.1% per year. If this happened, our population would reach around 131,500 by 2031.1 Statistics New Zealand produces three levels of population projections – low, medium and high – with the mediumseries considered the most likely to occur.A further possibility is that our city doesn’t grow. If birth rates fall further, we experience higherdeath rates and attract low numbers of migrants into the city, projections suggest that thepopulation could fall by an average of 0.5% a year, reaching around 88,000 by 2031.Although our population is expected to remain relatively static under the medium seriesprojections, we still expect to see growth in the number of households to 2031. We expect tosee considerable increases in the number of one person households, and an increase in thenumber of couples without children. These changes have many implications, for example, forplanning the number and type of homes required.Some of our optionsContinuing with business as usual is likely to mean modest growth in the period to 2031. Wewill still need housing development and investment in the infrastructure of our city. Stimulatinghigher growth requires more action to attract a range of economic development andemployment opportunities. One of the challenges we might face is planning growth so that wemaintain and enhance quality of life in the city.The disadvantages of low or no growth include less income to fund infrastructure and a lossin our share of government and regional investment in public facilities including schools andhealth care.In seeking growth, we face some major issues - we have some greenfield land on the fringesof the city - in the Wainuiomata Valley, small pockets on the western and eastern hills andStokes Valley - while most other areas are constrained by geography, mainly hilly terrain. In away we’re land locked, which means that large scale sprawl is not an option for us in the sameway it is for some other cities, and any growth under the traditional ‘sprawl’ developmentpatterns would be challenging to achieve.Opportunities for commercial growth are limited in much the same way.This leaves us with tough questions about whether we want growth and, if so, how this couldbe encouraged and accommodated.If we aim for high growth, this could provide a number of benefits and economic opportunitiesfor the community and for young people in particular, increased vibrancy of centres, the abilityto provide higher levels of service to our citizens, and more people to share in the cost ofrunning the city.Pursuing higher growth is likely to require greater investment by <strong>Council</strong>, innovation in termsof attracting employment and opportunities, and partnerships with business. The possibledisadvantages of high growth could include more traffic, higher density of development, andthe loss of amenity sometimes associated with increasing density.Setting a target somewhere between our expected growth and that expected in the regionwould also require ongoing investment and innovation to attract opportunities.
HUTT CITY LONG TERM PLAN <strong>2012</strong>-202225Continuing business as usual (modest growth) will mean less pressure to build newinfrastructure. On the other hand, we will still need to ensure that the capacity and condition ofour infrastructure, such as stormwater pipes and community facilities, is sufficient to meet ourexisting and future needs.Even without much population growth, we’re still likely to need additional homes, so notmaking provision to accommodate housing growth would mean increasing housing problemsas well as lead to fewer people to add vibrancy, drive the economy or participate in communityactivities, and help pay for the costs of running the city.Whatever direction our strategy takes, we will also need to consider whether we want growthacross the city or concentrated in specific areas. One option could be to allow different scalesof residential intensification ranging from infill housing, mainly stand-alone housing across thecity, to strictly preserving our cherished family lot sizes and accommodating growth only in theCBD and Petone West.Beyond <strong>Hutt</strong> <strong>City</strong>Underlying all these considerations and decisions are major global trends that will affect us.These include climate change, dwindling natural resources and related price increases, theageing and changing nature of our population, as well as increasing urbanisation (it is projectedthat 75% of the world’s population will live in cities or metropolitan areas by 2025), andtechnology driven service delivery.Other external challenges that are likely to affect us at some point include asset pricecollapse, a slowing Chinese economy, the risk of pandemic, loss of biodiversity, terrorism andnanotechnology risks.Next stepsThe principal benefit of developing an Urban Growth Strategy will be establishing a consensuson the city’s growth goals and alignment across the community and <strong>Council</strong>. The Strategy willalso enable:• Identification of critical focus areas and opportunities for growth and• Better coordination of planning and timing of infrastructure renewals and development.The next steps will be:• Identifying key principles/themes that will coordinate and guide the city’s development• Exploring how the city will develop and how <strong>Council</strong> together with its partners will cater for this• Identifying and managing the implications of the strategy for a range of <strong>Council</strong> strategies,plans and services• Ensuring <strong>Council</strong> develops a strategy that has widespread acceptance and commitmentboth politically and from the community.<strong>Council</strong> hopes to have developed a draft strategy for community consultation by the end ofSeptember <strong>2012</strong>.Economic Development Strategy 2009-2014“To grow the wealth of the city” is our adopted outcome for economic development.The Economic Development Strategy 2009-2014 outlines important steps towardsachieving a strong, diverse and enterprising business community with a focus on:• More business activity happening in the city• The city being recognised as a business location and vibrant city• Continued investment in current and new business activities• A strong entrepreneurial skilled and available workforce• A more environmentally sustainable business community and economy.Leisure and WellbeingOur strategies, policies and plans to promote social and cultural wellbeing include thoselisted here.Integrated Facilities and Services <strong>Plan</strong>In August 2011 <strong>Council</strong> agreed that an Integrated Facilities and Services <strong>Plan</strong> for <strong>Hutt</strong> <strong>City</strong>should be developed to include the role of community facilities and services in communitydevelopment, leisure and wellbeing. The plan is to include:• funding principles to be applied when considering funding options for facilities and services• integrated local area planning that consolidates neighbourhood facilities and precincts• the matrix of service that is expected of a community centre• potential hubs of facilities or co-location with libraries, halls and houses, schools, sportsfacilities, aquatic centres, health centres and shopping centres• a geographic spread of facilities.This plan is being developed following the decision to establish a Community Facilities Trustfor <strong>Hutt</strong> <strong>City</strong>.Active Recreation and Sport Strategy 2007-<strong>2012</strong>This strategy focuses on how we’ll help <strong>Hutt</strong> <strong>City</strong> residents to meet their active recreationand sport needs between 2007 and <strong>2012</strong>. It takes into account that, while we’re not the onlyprovider of recreation and sport opportunities for the city, our historic role as a key provider ofopen space and facilities means we have a significant influence.
26 HUTT CITY LONG TERM PLAN <strong>2012</strong>-2022The <strong>Hutt</strong> <strong>City</strong> Sportsville project was developed following adoption of the strategy. Thestrategy will be refreshed following the decision to establish a Community Facilities Trust forthe city, and in conjunction with the new Integrated Facilities and Services <strong>Plan</strong>.Children and Young People’s <strong>Plan</strong>We recognise that children and young people are valued members of our community now andin the future, and we’re working to develop a Children and Young People’s <strong>Plan</strong> in associationwith Youth Infusion (our Youth <strong>Council</strong>), the young people of <strong>Hutt</strong> <strong>City</strong> and the Ministry ofYouth Development. The plan will identify ways in which we can contribute to the well-beingof our children and young people to help them achieve to their full potential and play a positiverole in their communities.Ageing Together StrategyThe Ageing Together Strategy looks at the key issues that affect older people in <strong>Hutt</strong> <strong>City</strong>, andidentifies ways that we can work with the community to address them.Settlement Support Strategic <strong>Plan</strong> 2010-2013The aim of the Settlement Support Strategic <strong>Plan</strong> is to support migrants, refugees and theirfamilies to access appropriate information and services in the <strong>Hutt</strong> Valley area. The Strategic<strong>Plan</strong> is driven by the Settlement Support Steering Group.Safe <strong>City</strong>We have a number of Safe <strong>City</strong> initiatives and policies in place and we work with otherorganisations to make our city a safe place. We are part of the Safe <strong>Hutt</strong> Valley Project and aredesignated as a Safe Community by the Safe Communities Foundation, Karolinska Instituteand the World Health Organisation. Our Safe Cities projects include the Safe <strong>Hutt</strong> ValleyStrategic <strong>Plan</strong> 2011-2016, which outlines safety priorities and responsibilities for the <strong>Hutt</strong>Valley, and the Safe Public Places Action <strong>Plan</strong>, a crime prevention programme for <strong>Hutt</strong> <strong>City</strong>.Sale of Liquor PolicyWe work with Police, Regional Public Health, ACC, Upper <strong>Hutt</strong> <strong>City</strong> <strong>Council</strong>, ALAC, the FireService and the Hospitality Association to manage public consumption of alcohol. This involvescreating and policing liquor ban areas, event management, dealing with enforcement andlicensing issues, alcohol accords and education activities. The Alcohol Reform Bill is expectedto be enacted by September <strong>2012</strong>. Our Sale of Liquor Policy will be updated to reflect any lawchanges that arise.DisabilityThe <strong>Hutt</strong> Valley became New Zealand’s first ‘No Exceptions’ district as part of thegovernment’s No Exceptions Strategy and Implementation <strong>Plan</strong>. Becoming a ‘No Exceptions’district means that partners ensure that our sport and recreation facilities, events, programmesand services are accessible and inclusive of disabled people. Our ‘No Exceptions’ districtpartners are Upper <strong>Hutt</strong> <strong>City</strong> <strong>Council</strong>, <strong>Hutt</strong> Valley District Health Board (DHB), Sport WellingtonRegion and SPARC.<strong>Hutt</strong> <strong>City</strong> <strong>Council</strong> and the <strong>Hutt</strong> Valley DHB work with the Disability Advisory Group to ensurethat the services we provide are as inclusive as possible. The <strong>Hutt</strong> Valley Disability AdvisoryGroup is made up of individuals who have experienced disability, from whom we can seeka better understanding of the barriers that can prevent people with impairments from fullyparticipating in city life. The Disability Advisory Group provides assistance to those involved inplanning, funding, managing and delivering services.Gambling Policy<strong>Hutt</strong> <strong>City</strong> <strong>Council</strong> has adopted a Gambling Policy to limit the number of Class 4 gamingmachines (pokies) and venues, and to place restrictions around how and where TAB racingvenues can operate. The Policy is due to be reviewed in 2013.Social Housing/Housing PolicyThe availability of quality, affordable housing that is suitable for our changing population isa key issue for the city. The Housing Policy outlines how <strong>Council</strong> addresses these issuesby encouraging residential development and investing in social housing for the elderly andsocially disadvantaged.The city’s future housing needs will be considered in the development of the urbangrowth strategy.Community Arts and Culture PolicyWith the creation of our Community Arts and Culture Policy, we recognise the role communityarts and culture plays in enriching the lives of residents and visitors to <strong>Hutt</strong> <strong>City</strong>.The objectives of the Policy are to:• Encourage collaborative arts initiatives between organisations and community groupsacross the city• Ensure accessibility so that every person in <strong>Hutt</strong> <strong>City</strong> has the opportunity to engage incommunity arts activities• Ensure local community arts and culture is visible, enduring, and celebrates the uniquenessof <strong>Hutt</strong> <strong>City</strong>.Reserves Strategic Directions<strong>Hutt</strong> <strong>City</strong>’s green spaces are part of what makes our city special. Parks and reserves helppreserve the city’s natural beauty and provide opportunities for a wide range of recreationalactivities. Due to be reviewed in <strong>2012</strong>-2013, our Reserves Strategic Directions outlinespriorities for the development and management of the city’s parks and reserves network.
HUTT CITY LONG TERM PLAN <strong>2012</strong>-202227Heritage PolicyOur Heritage Policy is currently being reviewed to take account of a wide heritage focus thatmay include built, cultural and natural heritage.Community Engagement StrategyOur Community Engagement Strategy outlines our commitment to engage the communitiesof <strong>Hutt</strong> <strong>City</strong> to meaningfully participate in shaping <strong>Hutt</strong> <strong>City</strong>’s services, facilities and policies.The Strategy guides the interaction between <strong>Council</strong> and the community undertaken fordemocratic decision-making, and the ongoing engagement with the community in the spirit ofpartnership. It summarises at a high level:• Our community engagement goals• The main types of engagement we undertake• How engagement relates to the decision-making process, and how the public can beinvolved with the decision-making process• Our approach to community partnerships• Our commitment to engaging Mäori as a treaty partner• Key opportunities for improving our community engagement.Literacy, Education and TechnologyWe provide library services to enable all citizens to access information, knowledge and learningopportunities that support and strengthen individuals and the community. Libraries are leadingthe way in terms of introducing and using new technology to make it easier for customers andresidents to do business, engage and communicate with them.Arts and CultureThe Dowse Art Museum and the Petone Settlers Museum offer their many communities arange of experiences. Drawing on the wealth of cultural and social capital in our communities,the Dowse brings innovative approaches to the delivery of social and educational benefits,and is highly effective as an educational instrument for community development. PetoneSettlers Museum occupies one of New Zealand’s most significant memorial buildings – theWellington Provincial Centennial Memorial. The memorial was built to commemorate thearrival of the first British immigrants on Pito-one’s shores in 1840. Serving also as a bathingpavilion, the Wellington Provincial Centennial Memorial was officially opened on 22 January1940 and became the heart of Petone’s thriving beach scene. The database at the SettlersMuseum allows users to access primary and secondary source data relating to arrivalsfrom the United Kingdom, parts of Europe and Australia to Wellington (Wellington only andWellington as first port of call) between 1839 and 1897.EnvironmentOur strategies, policies and plans to promote environmental wellbeing include those listed here.See also page 50 for environmental policies we consulted on in <strong>2012</strong>.Environmental Sustainability Strategy 2009-2014Our community has indicated that environmental sustainability should be a top priority. TheEnvironmental Sustainability Strategy 2009-2014 was adopted with the purpose of identifyingmajor environmental sustainability issues for the city and developing actions for responding tothese; and positioning us as a leader in environmental sustainability within the community.The strategy’s main focus areas and the overall goal for each are:FOCUS AREAWasteTransportEnergyWaterUrban FormBiodiversity<strong>Council</strong>OUR GOALMove towards zero wasteTransport choices that reduce fuel use and offer better health and safetyEnergy that does not compromise tomorrowEnsuring water for the futureA city that sustains us and the environmentFlourishing environments, thriving with local native plants and animalsAn environmental sustainability leader within the communityUrban Forest <strong>Plan</strong>The Urban Forest <strong>Plan</strong> sets out objectives and policies for managing vegetation in our bushreserves, urban reserves and street trees citywide. There are three main focus areas in the plan:• Bush Reserves: to protect and maintain native vegetation and to improve the ecologicalconnectivity to support biodiversity• Urban Reserves: to provide large specimen trees in urban areas• Street Trees: improving the quality of street trees in <strong>Hutt</strong> <strong>City</strong> by 2030.District <strong>Plan</strong> Monitoring ProgrammeMonitoring the District <strong>Plan</strong> is an integral component of the <strong>Council</strong>’s overall Monitoring andResearch Strategy. Our reason for undertaking monitoring and research is to influence decisionmaking and planning, improve the development and delivery of services, and support widerlearning and accountability in relation to the <strong>Council</strong>’s activities and outcomes.
28 HUTT CITY LONG TERM PLAN <strong>2012</strong>-2022The purpose of the programme is to set out the framework for monitoring the District <strong>Plan</strong>. Itsets out a rationale for monitoring and research, <strong>Council</strong>’s legislative requirements, the data tobe collected and reporting needs, as well as the overall responsibilities for implementation.Waste Management and Minimisation <strong>Plan</strong> 2011-2017The city and district councils of the Wellington region have prepared and adopted a jointWaste Management and Minimisation <strong>Plan</strong>. The plan represents a commitment by each ofthe councils to work together to promote effective and efficient waste management andminimisation. It outlines the strategy for the region, a regional action plan, individual councilaction plans, and supporting information.Our action plan includes:• our participation in and support for regional waste minimisation initiatives including supportingregional efforts to advocate for product stewardship schemes, increasing the waste levy,strengthening the regulation for clean-fill operators and licensing of waste operators• continuing existing activities including waste minimisation projects and education/networking with schools and businesses, community waste minimisation events/projects,litter and recycling collections, landfill operation and aftercare, recycling and hazardouswaste facilities, wastewater treatment, waste reduction at council facilities, and ongoingmonitoring and reporting on waste.InfrastructureOur Asset Management <strong>Plan</strong>s set out how <strong>Council</strong> delivers its asset-based services to thestandards expected by customers, at the most competitive cost to customers, throughmanagement of assets in a way that is sustainable in the long term, and in compliance withlegal requirements.The Asset Management <strong>Plan</strong>s comprise four key elements - the service standards which<strong>Council</strong> aims to achieve, the asset system used to achieve the service standards, the life cycleof asset management strategies (which set out how <strong>Council</strong> manages the assets), and qualityassurance processes.Service standards set out the services to be delivered and the targets <strong>Council</strong> aims to achievein their delivery. Target service standards include customer service, legislative, technical andenvironmental standards.Customer service standards look at services from a customer’s perspective. <strong>Council</strong>customers have been consulted about some standards, major projects and issues such as thefluoridation of the Petone water supply, and the Trunk Wastewater System (which includes theSeaview Wastewater Treatment <strong>Plan</strong>t and network operations).Technical and environmental service standards are determined by legislation, industry andenvironmental best practice and in consultation with local community special interest groups,iwi and central government agencies.The asset system describes the assets <strong>Council</strong> uses to deliver the services. It includes a highlevel summary of the asset’s condition, an assessment of the asset’s service capabilities and aforecast of the future demand for the services.Life cycle management covers the four key strategies necessary to deliver the required servicestandards - a management/monitoring strategy, a maintenance/operations strategy, an assetrenewal strategy, and an asset development strategy. The first three strategies maintain theservice capability of existing assets, while the asset development strategy aims to close gapsbetween the current service capability and target service standards. Financial programmesassociated with the four strategies are fed into <strong>Council</strong>’s long term financial planning.Quality assurance sets out how <strong>Council</strong> evaluates its asset management planning processesagainst industry best practice. This can be through evaluation of <strong>Council</strong>’s asset managementplanning against accepted criteria, and/or through internal and external reviews. Recentevaluations have indicated that <strong>Council</strong>’s asset management planning generally comparesfavourably with best practice elsewhere in New Zealand.Projections in the Asset Management <strong>Plan</strong>s of the future demand for asset-based servicesinclude assessments of the impacts of predicted climate change on these services wherethese may be significant. For example, allowance has been made for a hotter and drier climatein projections of the future demand for water supplies in the city.GROUPS OF ASSETS MANAGED BY COUNCILCommunity Assets<strong>Council</strong> manages the community’s cultural, social and recreational assets in the form oflibraries, pools, parks, <strong>Council</strong>-owned property and museums. These assets are maintained toagreed levels of service set out in the Asset Management <strong>Plan</strong>.To not only ensure the ongoing maintenance of various community facilities, e.g. WalterNash Stadium, but to also improve the overall quality, <strong>Council</strong> has explored new ownershipand management structures for these assets. <strong>Council</strong> believes these new structures havethe potential to improve the overall quality of the assets as well as provide for greater localcommunity support of them.
HUTT CITY LONG TERM PLAN <strong>2012</strong>-202229Swimming PoolsWith six pool complexes available, <strong>Council</strong> endeavours to maximise benefit to a wide crosssectionof the community by providing aquatic recreational, learning and fitness programmes.The Asset Management <strong>Plan</strong> aims to maintain these important recreational facilities to meetcommunity need and demand. The <strong>Plan</strong> identifies maintenance and replacement programmes,aimed at ensuring the continued running of safe, efficient and enjoyable aquatic facilities.Land and Buildings<strong>Council</strong> provides community buildings such as libraries, halls and toilets as well as social rentalhousing through Urban Plus Limited to:• Ensure local communities have access to venues for recreational, cultural andgovernance activities.• Provide well maintained and safe living environments for tenants that are affordable andmeet their needs.• Be a contributor to the community’s housing needs.The portfolio comprises:• Community and civic halls and venues.• Library buildings.• Public toilets.• Community houses.• <strong>Council</strong>’s administration building.• Housing units for the elderly and socially disadvantaged.• Vacant land.The portfolio is progressively reviewed to ensure that it is used efficiently and meets theneeds of identified internal and external clients.Vacant land properties identified by <strong>Council</strong> for possible disposal go through the appropriateconsultation and statutory processes, and <strong>Council</strong> approvals. Following these processesand approvals, those properties determined by <strong>Council</strong> to be available for sale will either betransferred to Urban Plus Limited for development and/or disposal, or sold to other parties inaccordance with the relevant statutory processes and <strong>Council</strong> decisions.The company undertakes Condition Assessment Surveys annually to:• Review the condition of the asset for assessing capital expenditure and maintenance costs.• Determine whether the asset can maintain the required level of service.• Collect information for development of financial forecasts for <strong>Long</strong> <strong>Term</strong> <strong>Plan</strong> andassociated funding applications.• Update and improve the Asset Management <strong>Plan</strong>.• Deliver ongoing service to internal and external customers.• Adhere to Risk Management processes.The financial programme for capital expenditure, renewals and operating expenditure is basedon these inspections and the projection of each asset’s remaining useful life.Demand for rental housing for the elderly will increase in the future and Urban Plus Limitedis, with <strong>Council</strong>, already beginning to plan for increases in the number and nature of housingunits. This planning also involves other agencies and organisations already involved in providingaccommodation and services for the elderly and socially disadvantaged.Parks and ReservesThe city has 5,305 hectares of parks and reserves, the majority of which is bush reserve.The plan focuses on maintaining parks infrastructure including sports grounds, children’splaygrounds, public toilets, tracks, car parks, wharves, cemeteries and horticultural parks.Greater Wellington Regional <strong>Council</strong> is responsible for managing <strong>Council</strong>-owned land thatfalls within the boundaries of a regional park. This allows the integrated management of landforming part of the East Harbour Regional Park and the Belmont Regional Park.No major issues have been identified that will affect the parks Asset Management <strong>Plan</strong> in theshort to medium term.Infrastructural Assets<strong>Council</strong> manages the community’s infrastructural assets including roading networks, landfills,water supply, stormwater and wastewater collection and treatment. These assets aremaintained to agreed levels of service set out in the Asset Management <strong>Plan</strong>.Roading and TrafficThe road network provides for safe, reliable and efficient travel throughout the city. Levelsof service are defined in the Asset Management <strong>Plan</strong> and achievement against these ismeasured through the Communitrak survey. The asset comprises roads, bridges, footpaths,street lights, traffic improvements (for example, traffic lights, roundabouts, kerb extensions)and barriers.The overall condition of the network can be determined accurately owing to the visible natureof the assets. Specialist consultants carry out annual condition rating surveys, the results ofwhich are used to identify current maintenance needs. Pavement deterioration modelling is alsoundertaken to ensure levels of service will be maintained over the longer term.Extensions and improvements to the network are achieved through:• Subdivisional development work, primarily around the perimeter of the current network.• Improvement projects within the existing network that are ranked in terms of benefit/costanalysis, the benefits being achieved through travel-time savings or safety enhancements.
30 HUTT CITY LONG TERM PLAN <strong>2012</strong>-2022A seismic review has been undertaken on the city’s bridges to determine which would bedamaged in the Wellington Lifelines Group’s one in 250 year regional earthquake. Withthe completion of seismic strengthening work on the Estuary and Melling bridges, all fourbridges across the <strong>Hutt</strong> River now meet the required standard. Attention has shifted to theremaining smaller bridges that have been identified as being “at risk”. It is hoped that thiswork would significantly reduce the disruption to movement around the city in the event ofa major earthquake.Generally traffic growth has been relatively low in recent years at less than 1% p.a. andthis low growth is not expected to change markedly. Conversely it is expected that freightvolumes will double over the next few decades. As the Seaview Gracefield area is theWellington region’s primary industrial and logistics centre, investigations into improvedlinkages with SH2 continue.Water SupplyThrough the supply of water to residents and businesses, <strong>Council</strong> contributes to the healthof the community, and to community safety through the fire-fighting capability of the watersupply system.<strong>Council</strong> purchases bulk water from Greater Wellington Regional <strong>Council</strong> and distributes it tothe community through the water supply system, which comprises 24 reservoirs, 13 pumpingstations and 683 km of underground pipelines. The water supply network throughout the cityis in satisfactory condition and performs well even at peak demand periods.The areas that require improvement are as follows:• Additional capacity for subdivision or development of land.− Additional capacity in the network is required for subdivision or development of landthroughout the city. The recent upgrading works in Upper Belmont/Sweetacres willprovide water to the new subdivision, improve supply to existing customers andfacilitate further development.• Improving emergency response and contingency planning. This comprises:− Maintaining storage in reservoirs.There is an ongoing programme to upgrade and improve the structural integrity ofreservoirs to meet minimum seismic requirements identified in recent and continuingseismic investigation studies. The work will help improve the availability of supplyafter an earthquake. There is an ongoing programme to install auto shut-off valves atkey reservoirs.• Improving reliability of the water supply.− There is an ongoing programme to install bulk link mains in the city to improve thereliability of water supply to customers. Stage One of a link main connecting the <strong>Hutt</strong>Road and Western <strong>Hutt</strong> Road water supply systems was installed in Petone in 2003/04.Stage Two has been completed in conjunction with the upgrading of SH2 by the NZTransport Agency. Link mains in Kelson/Fairway Drive and Tama Street/North Street arebudgeted in <strong>2012</strong>/13.StormwaterThrough the provision of a stormwater drainage system to manage surface water run-off fromurbanised catchments <strong>Council</strong>:• Contributes to the safety of the community by minimising the incidence of flooding.• Minimises property damage from flooding and thus supports the economy of <strong>Hutt</strong> <strong>City</strong>.• Provides a cost-effective stormwater system, which supports development in <strong>Hutt</strong> <strong>City</strong>.The stormwater network comprises a primary system of 546 km of pipes, 27 km of opendrains and canals, and 14 pumping stations. Retention dams, streams, and a secondarysystem of overland flowpaths contribute to a generally satisfactory level of flood protection inthe city.The majority of the open watercourses maintained by <strong>Council</strong> perform satisfactorily, and inrecent years <strong>Council</strong> has undertaken substantial upgrading of the Opahu Stream.• The management of the stormwater system is focused on renewing existing assetsthat have reached the end of their useful lives. Opportunities to increase levels of floodprotection for the community are integrated where possible, and upgrading projects areconsidered annually to mitigate flooding hotspots throughout the city.• Renewal of pipes: The renewal of piping assets, while ensuring that the stormwaterinfrastructure is being maintained at an acceptable level, also enables <strong>Council</strong> to provideincreased piping capacity in line with current urban design standards. Traditionallystormwater piping standards, within <strong>Hutt</strong> <strong>City</strong> and throughout the country, have beendesigned with sufficient capacity for a five-yearly rainfall storm. Current design standards,however, are aimed at providing stormwater piping to have sufficient capacity for a 10-yearrainfall storm. Therefore, as the pipe renewal work progresses the standard of stormwaterprotection will gradually increase across the city.• Flood protection works in Black Creek (involving the replacement of the Fitzherbert Roadbridge) were undertaken in 2011/12 at a cost of $1.64m.• To reduce the incidents of flooding, Major Drive stormwater upgrades were undertaken in2011/12 at a cost of $633k.• Beginning in 2011/12 a 10 year programme to upgrade the Awamutu Stream is beingcarried out at an estimated cost of just over $6m.WastewaterThrough collecting, treating and disposing of wastewater, <strong>Council</strong> provides a service toresidents and businesses which supports development in the city and protects the physicalenvironment and health of the community.Wastewater is collected by the local wastewater system (which consists of 573 km of pipesand 25 pump stations) and delivered to the Trunk Wastewater System.
HUTT CITY LONG TERM PLAN <strong>2012</strong>-202231The Trunk Wastewater System comprises 104 km of trunk pipes, 19 pump stations, twopeak flow storage tanks, the wastewater plant at Seaview and the outfall at Pencarrow. Thewastewater treatment plant at Seaview, commissioned in 2001, has produced significantimprovements for the city environment.• $11m has been set aside to investigate and rehabilitate joints and failures in the mainoutfall pipeline.Parts of the wastewater network, however, are still subject to overloading with inflow ofstormwater and infiltration of groundwater during heavy rain. This can result in overflowsof diluted wastewater from the system. These overflows can be detrimental from health,environment and social perspectives. They are also culturally unacceptable.<strong>Council</strong> has a comprehensive strategy in place to reduce incidences of overflow from thesystem. This comprises:• Reducing wet weather flows by reducing:− Infiltration in <strong>Council</strong> drains. There are ongoing programmes to replace every pipe in thecity over the life cycle of the pipe.− Inflow and infiltration from private drains. Private drains are a significant contributor towet weather overloading and community co-operation is required to resolve the issue.• Providing storage to accommodate wet weather loading.Assumptions, Uncertainties and Risk for Financial EstimatesThe financial programme for renewal of water supply, stormwater and wastewater assetsis based on projections of useful lives and the replacement value of the system. For aboveground assets physical inspection can be carried out to ascertain the useful lives. Usefullives of underground assets are determined by a combination of physical inspection andcondition modelling.Errors in asset valuations can lead to the asset renewal programme being under- or overfunded.Significant errors in assessing useful lives of assets will impact on the timing ofrenewal works but not on the total renewal programme over the life cycle of the assets.To reduce the risk of errors occurring, a quality assurance system is in place to ensure theaccuracy of the asset register. In addition, asset valuations are carried out by independentvaluers and are subject to audit.According to current modelling output, annual costs for the renewal of water pipes will likelyincrease over the next 10 - 20 years, reflecting the age profile of the water network. Morework will be carried out to update the model.Generally the useful lives of assets are consistent with the International Asset ManagementManual. But in some cases adjustments have been made when experience shows that theremaining lives are shortened or extended by local conditions.
HUTT CITY LONG TERM PLAN <strong>2012</strong>-202233OTHER POLICIESTHESE STRATEGIES ARE SUPPORTED BY COUNCIL POLICIES INCLUDING:Revenue and financing policy – identifies how <strong>Council</strong> allocates the costs of its activitiesagainst available sources of funds, including rates and user charges. This policy was reviewedin <strong>2012</strong> – see the full text of the draft policy below.<strong>Hutt</strong> <strong>City</strong> development charges remissions policy – outlines details of a two year city widefees remissions package as part of an initiative aimed at stimulating development in the city –see page 46 for the full text of the policy.Significance policy – guides <strong>Council</strong> when making decisions of varying importance to thecommunity, and lets the community know what to expect in terms of consultation.See page 47 for a summary of the policy.Policies on development and financial contributions – describes the contributions <strong>Council</strong>will require from developers when their property developments increase demand for councilservices. Small changes have been made to the policy on development contributions toupdate the fees payable and the demand loadings, which affect the charges payable for nonresidentialdevelopments.Revenue and Financing PolicyINTRODUCTIONA wide number of funding sources are available to <strong>Council</strong> to help fund its activities, rangingfrom general and targeted rates through to fees and user charges.This policy outlines <strong>Council</strong>’s approach to funding its activities. It provides information on whatfunding tools are used and who pays, as well as describing the process used to make thesedecisions.This policy should be read in conjunction with the Funding Impact Statement containedelsewhere in this <strong>Long</strong> <strong>Term</strong> <strong>Plan</strong> (and in <strong>Council</strong>’s Annual <strong>Plan</strong> in later years). The FundingImpact Statement is the mechanism used to implement the Revenue and Financing Policy andprovides detail on how rates are set.HOW DOES COUNCIL DECIDE WHAT IS FUNDED FROM WHERE?<strong>Council</strong> uses a two-step process when deciding how it will fund its activities, and who will pay.Step One: Activity by Activity allocation of costs.Considerations:• Community outcomes• Who benefits?• What generation of ratepayers benefits?• Who causes the costs?• Administrative feasibility of charging?Funding tools:• General rates• Targeted rates• Fees & charges• Investmentincome• Borrowing• Asset sales• Developmentcontributions• Grants & subsidiesStep Two: <strong>Council</strong> judgement on overall impact on community of funding allocationsConsiderations:• Social, economic, environmental &cultural wellbeing• Rates affordability for households &businessesTools:• Rates differentials• Extent of fixed charges• Extent of user chargesStep OneStep one of the process is an activity-by-activity allocation of costs based on a range ofconsiderations, including who benefits and who causes the costs.From this assessment, the most appropriate funding tools are identified. For example strongpublic benefits from an activity might indicate funding by rates, while strong private benefitsmight indicate user charges.The matters that are taken into account in step one are largely determined by the LocalGovernment Act 2002 (LGA). 1 The main considerations are outlined below.1. Specific requirements are: Local Government Act 101 (3) The funding needs of the local authority must be met fromthose sources that the local authority determines to be appropriate, following consideration of,—(a) in relation to eachactivity to be funded,—(i) the community outcomes to which the activity primarily contributes; and(ii) the distribution of benefits between the community as a whole, any identifiable part of the community, andindividuals; and(iii) the period in or over which those benefits are expected to occur; and(iv) the extent to which the actions or inaction of particular individuals or a group contribute to the need to undertake theactivity; and(v) the costs and benefits, including consequences for transparency and accountability, of funding the activity distinctlyfrom other activities;”
34 HUTT CITY LONG TERM PLAN <strong>2012</strong>-2022Distribution of BenefitsThe LGA requires <strong>Council</strong> to assess the benefits from each activity flowing to the communityas a whole, and those flowing to individuals or identifiable parts of the community. Someterms that are useful in describing who benefits from a particular service are:Non-rival – the enjoyment of a benefit by a person does not prevent the benefit being enjoyedby other people at the same time. An example is street lighting. Rival has the oppositemeaning.Non-excludable – no person or group can be prevented from enjoying the benefit. An exampleis beaches. Excludable has the opposite meaning and implies that users could be identifiedand potentially charged.Public goods – goods or services that can often only be supplied by the community, and areusually both non-rival and non-excludable.Private goods – at the other extreme are pure private goods that have the oppositecharacteristics – rivalry and excludability. If the service provided by the <strong>Council</strong> benefitsidentifiable parties and the costs related to the service can be allocated directly to them, suchservices are called private goods.Positive externalities – The use of private goods and services can also result in benefits to thirdparties – people who don’t directly use them. These are called ‘spill over effects’ or ‘positiveexternalities’. <strong>Council</strong> activities with these characteristics are sometimes also called “meritgoods” where <strong>Council</strong> considers that the service should be provided on the basis of needrather than willingness to pay, or benefits received. The differentiation of private and publicgoods and the identification of externalities are necessary for the strict apportionment of thecosts between private users and the community as a whole. Sometimes such differentiation isnot easy, because very few goods and services can be treated as purely private or public; mostgoods and services have characteristics of both private and public goods.Period of BenefitsThe LGA requires <strong>Council</strong> to assess the period over which the benefits from each activity willflow. This in turn indicates the period over which the operating and capital expenditure shouldbe funded.Operating costs are directly related to providing benefits in the year of expenditure for allactivities. As such, they are appropriately funded on an annual basis from annual revenue.Assets purchased from capital expenditure provide benefits for the duration of their usefullives. Useful lives range from a few years in the case of computer equipment through tomany decades for infrastructural assets such as pipe networks. This introduces the concept ofintergenerational equity. <strong>Council</strong> considers that benefits occurring over time should be fundedover time. This is particularly relevant for larger capital investments such as the wastewatertreatment plant, bridges, landfills and so on.Exacerbator PaysThe LGA requires <strong>Council</strong> to assess the extent to which each activity exists only becauseof the actions or inaction of an individual or group. Examples are fixing a chemical spill, dogcontrol, littering and parking fines.Sometimes known as polluter pays, this principle aims to identify the costs to the communityof controlling the negative effects of individual or group actions. The principle suggests that<strong>Council</strong> should recover any costs directly from those causing the problem. Most activities donot exhibit exacerbator pays characteristics. This heading is only included in the analysis ofthose activities which do demonstrate such characteristics.Costs and Benefits of Distinct FundingThe LGA requires <strong>Council</strong> to consider the costs and benefits of distinct funding for eachactivity. This section is interpreted as requiring <strong>Council</strong> to consider the costs and benefitsof funding each activity in a way that relates exclusively to that activity. An example of thiswould be funding swimming pools entirely from user charges, or refuse collection from atargeted rate. The consideration of the costs and benefits of distinct funding must include theconsequences of the chosen funding method for transparency and accountability.Funding every activity on such a distinct basis would be extremely administratively complex.For some activities the quantity of rates funding to be collected amounts to only a few centsper ratepayer. The administrative costs and lack of significance lead <strong>Council</strong> to fund mostactivities by way of a general rate.Step 2The second step in the process is for <strong>Council</strong> to assess the overall impact that the fundingallocation identified in step one has on the community, and consider if any changes areneeded. 1 Considerations might include, for example, the ability to pay of low incomehouseholds, or the fair treatment of the business sector balancing ability to pay and benefitsactually received.STEP ONE ASSESSMENTThe main sources of funding for <strong>Council</strong>’s activities are outlined below, along with a summaryof the step 1 matters taken into account when determining why these funding sources shouldbe used and who should pay.A more detailed discussion of the use of funding tools and the reasons for the allocation ofcosts to various sectors of the community for each activity is provided in Appendix 1.1 Specific requirements are: LGA 101 (3) (b) the overall impact of any allocation of liability for revenue needs on thecurrent and future social, economic, environmental, and cultural well-being of the community.
HUTT CITY LONG TERM PLAN <strong>2012</strong>-202235FUNDING OF OPERATING EXPENDITUREGeneral ratesGeneral rates, together with targeted rates, are the largest source of funding for <strong>Council</strong>.General rates are used to help fund activities that exhibit strong or dominant public goodcharacteristics. In these cases, all ratepayers pay towards the cost of the activity. Where theactivity also provides private benefits, the rates are used to fund the balance of costs after thepotential for user charges has been exhausted.<strong>Council</strong> sets general rates based on the capital value of properties. Capital value is used because,in the main, it reflects ability to pay better than the alternatives of land value or annual value.What each ratepayer pays depends on the capital value of their property relative to the valueof other properties, and on the share of the general rate that has been allocated to each sectorof the community (Residential, Business, Utilities and Rural). <strong>Council</strong> has determined thatfor most activities, the general rates funded costs should be allocated to each sector of thecommunity in line with each sector’s percentage share of the capital value of the city. For mostactivities, there is little evidence to support alternative approaches where, for example, onesector should be carrying a greater or lesser proportional share.However, for the Roading and Traffic activity, general rates are weighted towards the businessand utility sectors because of the particularly high use of the roads (or road space) by thesesectors. For the same reason, Stormwater general rates are also weighted towards thebusiness sector.To achieve the weighting of general rates allocation towards the business and utility sectorsin these cases, <strong>Council</strong> increases each sector’s assumed share of the overall capital value ofthe city. The rate payable on each category of property is expressed as each sector’s rate inthe dollar of capital value as a ratio of the residential rate in the dollar of capital value. This isdescribed as ‘the differential factor’.The result is the following “step 1” differential factors:• Residential 1.0• Business 2.3• Business Central 2.3• Utility Networks 2.1• Rural 1.0• Community Facilities 3 2.3Interpreting these differential factors above, we see that in order to achieve <strong>Council</strong>’s desiredstep one allocation of costs, the business rate in the dollar of capital value needs to be 2.3times the residential rate in the dollar of capital value.Appendix 2 provides more detail of <strong>Council</strong>’s operating costs, the allocation of general ratescosts to various sectors of the community (such as residential and commercial ratepayers),and how the above differentials are calculated.It is worth noting that the business (previously called “business suburban”), business central,community facilities, utility networks and rural differentials above are different from thedifferentials applied previously.Uniform Annual General Charges<strong>Council</strong> also has the option to levy a uniform annual general charge (UAGC). A UAGC recoversa portion of general rates costs as a fixed amount per property. Such fixed charges tend tohave a disproportionate impact on low income households as the charges make up a higherproportion of such a household’s income. For this reason, <strong>Council</strong> does not currently proposeusing a UAGC. <strong>Council</strong> does, however, use fixed charges for some targeted rates.Targeted RatesTargeted rates are used where <strong>Council</strong> has decided that the cost of a service or functionshould be met by a particular group of ratepayers (possibly even all ratepayers) or in order toprovide greater transparency about the use of the funding. There is considerable scope toset rates for a specific function (e.g. water) or target a rate on a specific geographic area (e.g.Jackson Street) or set different levels of rates for different property types (e.g. promotion levytargeted on business central properties). The targeted rates charged by <strong>Hutt</strong> <strong>City</strong> <strong>Council</strong> are:• Water supply, per property• Wastewater services, per pan• Jackson Street upgrade project, per business property in Jackson Street• Recycling, per propertyFees and ChargesUser charges are used where there are strong private benefits from an activity and it isfeasible to collect fees.User charges contribute to the cost of some facilities (such as swimming pools) and also fullyor partly meet the cost of regulatory services, such as those under the Building and ResourceManagement Acts.Similarly, <strong>Council</strong> has the ability to fine people and businesses for certain rule infringements.The amount of income derived through these fines depends on the level of noncompliance andthe amount of effort <strong>Council</strong> puts into enforcement activities.Other funding sourcesThe other main funding sources for operating expenditure are grants and subsidies.New Zealand Transport Agency funding assistance for road maintenance makes up themajority of this funding.<strong>Council</strong> does not use borrowing, interest received or dividends, proceeds from asset sales, ordevelopment or reserve contributions to help fund operating expenditure.Summary of how activities are fundedThe table on the next page summarises the funding sources for each of <strong>Council</strong>’s activities,including a summary of how any rates are levied. Further information is provided in Appendix 1.
36 HUTT CITY LONG TERM PLAN <strong>2012</strong>-2022Summary of activity-by-activity funding charges leviedOPERATIONAL FUNDING SOURCESUSER CHARGES, SUBSIDIESACTIVITYGENERAL RATESTARGETED RATE& OTHER SOURCESLibraries• Primary funding source• SomeMuseums• Recovered from each sector (Residential, Business, Utilities, Ruraland Community Facilities) in line with each sector’s share of the• SomeAquatics & Recreationcity’s capital value (i.e. no rating differential)• SomeParks & Reserves• SomeCommunity Development• MinimalEnvironmental Management• SomeEmergency Management• SomeElected MembersAdvice & SupportManaging Services• SomeEconomic Development • Jackson Street - separate targeted charge based on capital value of property • SomeLocal Urban Environment• Recycling fixed charge / residential propertyRoading & Traffic• Primary funding source• NZTA subsidies• Recovered with a differential weighting on the business and utilitiessectorsStormwater• Primary funding source• Recovered with a differential weighting on the business sectorSolid Waste• Net incomegeneratingWater Supply • Minimal • Primary funding source - fixed charge per property • SomeWastewater • Minimal • Primary funding source - fixed charge per pan• Private drains charge per property receiving work• Some• Some
HUTT CITY LONG TERM PLAN <strong>2012</strong>-202237FUNDING OF CAPITAL EXPENDITURE<strong>Council</strong> funds capital expenditure from borrowing and then spreads the repayment of thatborrowing over several years. This enables <strong>Council</strong> to better match funding with the periodover which benefits will be derived from assets, and helps ensure intergenerational equity.Borrowing and repayments are managed within the framework specified in the LiabilityManagement Policy.In some cases, <strong>Council</strong>’s overall borrowing requirement is reduced to the extent that otherfunds are available to finance capital expenditure. Such other funds include:• <strong>Council</strong> reserves, including reserves comprising development contributions under theLGA, and financial contributions under the Resource Management Act 1991 (see <strong>Council</strong>’sDevelopment Contributions Policy).• Contributions towards capital expenditure from other parties such as the New ZealandTransport Agency (in relation to certain roading projects) and Upper <strong>Hutt</strong> <strong>City</strong> <strong>Council</strong> (inrelation to joint wastewater activities)• Annual revenue collected through rates to cover depreciation charges.• Proceeds, from the sale of assets, not otherwise used for debt reduction.• Operating surpluses.STEP TWOThe second step in the process is for <strong>Council</strong> to apply its judgment to the overall impact on thecommunity of the funding allocations determined in step one, and consider if any adjustmentsare needed.In exercising this judgment, <strong>Council</strong> has considered the following:• The impact of rates and rates increases on residential properties, and in particular on theaffordability of rates and rates increases for low and average income households.• The impact of rates and rates increases on businesses and on the competitiveness of <strong>Hutt</strong><strong>City</strong> as a business location.• The fairness of rates (and changes in rates) relative to the benefits received for “stand-out”properties with unusually high capital values. In this regard, <strong>Hutt</strong> <strong>City</strong> has considered theimpact of the rating system on the Westfield Queensgate shopping complex, which makesup a significant proportion of central city commercial capital value.• The special characteristics of particular classifications of property - including their purposeand proximity to the city.• The complexity of the rating system and the desirability of improving administrative simplicity.Shifting the differentials for each sector’s share of the city’s overall capital value is the principalmeans of achieving the desired overall rates impact on the wider community.<strong>Council</strong> has chosen to make four adjustments to the funding allocations identified in step one.These are to:• Lower the allocation of rates to the rural sector to a level where the rural differential is equalto 0.8. This change has been made on the basis that rural properties often experience alower level of service because of the longer distances between rural properties and <strong>Council</strong>facilities.• Provide two special categories of community facilities and rate them at a lower differentialto recognise the community benefits provided by such facilities. The two categories arecommunity facilities 1 and community facilities 2 and are defined in the Funding ImpactStatement, along with the differential to apply to each. A third category of communityfacilities is also defined but no adjustment has been made to the differential to be levied onthis category.• Standardise the differential for all other non-residential properties so that such propertiesare rated on the same basis. This requires only a small adjustment to the utility networkdifferential from 2.1 to 2.3• Apply a ten-year transition period for the changes needed to business, business central,community facilities, utility networks, and rural sector general rate differentials. Thetransition period is needed because the changes to the differentials (compared to currentdifferentials) will result in a significant shift in rates incidence between different sectors ofthe community. In particular, the share of rates recovered from the business and utilitiessectors will fall, while the proportion of rates to be recovered from the residential and ruralsector will rise.The calculation over the 10 year period would include a 10% shift each year on a straightline basis towards the target set in <strong>2012</strong>-2013. The calculation would also consider budgetchanges and revaluations, which affect each sector’s share of the city’s capital value.
38 HUTT CITY LONG TERM PLAN <strong>2012</strong>-2022APPENDIX 1Revenue and Financing Policy by Major ActivityACTIVITYLibraries<strong>Council</strong> provides, maintains and manageseight libraries in the city. These are run as asingle city-wide service. Their primary roleis to provide written and recorded materialsuch as books, audiovisual resourcesand access to online information. Libraryservices are used for many purposesincluding learning, research andentertainment.Museums<strong>Council</strong> operates two museums. TheDowse displays art, craft and other culturalmaterials. The Petone Settlers Museumspecialises in the social history of the lower<strong>Hutt</strong> Valley and Petone. These institutionsare open to the public at no charge, otherthan for special exhibitions.Aquatics and Recreation<strong>Council</strong> provides and maintains sixswimming pools in the city as part ofits portfolio of recreational facilities.Recreational programmes are communitybasedprogrammes designed to encourageresidents to engage in a range ofrecreational activities. These services areprovided to promote health and enjoymentand stimulate the community’s interest indifferent recreational opportunities.OUTCOMEThis activity contributes primarilyto the following CommunityOutcomes:• A safe community• A strong and diverse economy• An accessible and connectedcity• Healthy people• Actively engaged in communityactivities• Strong and inclusivecommunitiesThis activity contributes primarilyto the following CommunityOutcomes:• A strong and diverse economy• An accessible and connectedcity• Actively engaged in communityactivities• Strong and inclusivecommunitiesThis activity contributes primarilyto the following CommunityOutcomes:• A safe community• A strong and diverse economy• Healthy people• Actively engaged in communityactivitiesFUNDING SOURCEPROPORTIONPublic – highPrivate – lowOther – lowPublic – highPrivate – lowOther – lowPublic – med/highPrivate – med/lowOther – lowFUNDING RATIONALE [ LGA 2002 SECTION 101(3)(A) ]Who benefits (community as a whole, or individuals, group or users, exacerbators), intergenerational benefits, reasons for funding the activity separately)Who benefits: While there are identifiable private benefits from the provision of library services, the<strong>Council</strong> views the open and low cost access to information and books as being in the best interest ofthe city as a whole. The library system is an efficient way for the community to pool their reading andinformation resources and it is unlikely it could continue to exist if it operated on a strictly user payssystem. Rather charges are levied for late returns, internet access and DVD hire, but these contributeonly a small amount towards total operating cost.Who pays: No particular sector or group is considered to drive these costs beyond those groups thatcan be targeted by user fees. The public good portion of this activity cost is therefore allocated inproportion to each sector’s share of the total capital value of the city.Who benefits: The <strong>Council</strong> believes that the support of the arts, recognition of our social history andcultural endeavours is an important component in making the city a vibrant and attractive city, as wellas providing a means for the community to express a sense of self and place. While individual visitorsto these facilities do gain private benefits, collecting an entry fee would be inefficient due to the costsassociated with establishing and operating a door charge system. <strong>Council</strong> recognises the contributionthe Dowse Foundation and donors are making to the city through the extensive community fundraisingactivities.Who pays: No particular sector or group is considered to drive or benefit from these costs beyondthose groups that can be targeted by user fees. The public good portion of this activity cost istherefore allocated in proportion to each sector’s share of the total capital value of the city.Who benefits: Fees and charges contribute a significant portion of the income for this activity. Thisreflects the fact that individuals benefit from the personal fitness and enjoyment they derive from usingthe facilities. However it is also recognises that there are positive benefits for the community when thepopulation is fit and actively engaged. The pool also provides quality and accessible tuition in essentialwater safety and life skills, which produces both private and public benefits. To this extent funding fromgeneral rates is a key source of income for this activity.Who pays: No particular sector or group is considered to drive or benefit from these costs beyondthose groups that can be targeted by user fees. The public good portion of this activity cost istherefore allocated in proportion to each sector’s share of the total capital value of the city.
HUTT CITY LONG TERM PLAN <strong>2012</strong>-202239ACTIVITYOUTCOMEFUNDING SOURCEPROPORTIONFUNDING RATIONALE [ LGA 2002 SECTION 101(3)(A) ]Who benefits (community as a whole, or individuals, group or users, exacerbators), intergenerational benefits, reasons for funding the activity separately)Parks and Reserves<strong>Council</strong> provides and maintains passiverecreational facilities in the city for theenjoyment and well-being of the public,free of charge. Sports fields are providedand maintained through charges to sportscodes. Recreation areas are both naturaland created, with the majority of efforttargeted at maintenance and retainingareas in their natural state. This activity alsoincludes <strong>Council</strong>’s cemeteries.This activity contributes primarilyto the following CommunityOutcomes:• Healthy people• A healthy natural environment• Actively engaged in communityactivities• A healthy and attractive builtenvironmentPublic – highPrivate – lowOther – lowWho benefits: Parks and Reserves: <strong>Council</strong> views the active participation of residents in outdooractivities as beneficial to the whole community. Some degree of user charging is appropriate, howeveraffordability for sporting clubs is now a factor in limiting participation. The actions of sports codescontribute to the need for <strong>Council</strong> to undertake the maintenance of sports fields. This is therefore anexample of the exacerbator principle.Cemeteries: There is a significant private benefit in this service to the families of deceased peoplewhere burials and interment services are provided. There is also an ongoing community benefit inproviding for the respectful treatment of deceased people who form part of the community’s heritageand whakapapa.While it is recognised that the rural sector often provides its own recreational land, <strong>Council</strong> considersthat this sector is also a beneficiary from this activity and should share the general rates cost.Lands purchased for sports grounds and reserves provide substantial intergenerational benefits.Who pays:No particular sector or group is considered to drive or benefit from these costs beyond those groupsthat can be targeted by user fees. The public good portion of this activity cost is therefore allocated inproportion to each sector’s share of the total capital value of the city.Community Development<strong>Council</strong> has a policy of identifying andunderstanding its communities and theirissues. Through greater knowledge of localneeds <strong>Council</strong> is able to respond suitablyto social issues affecting members andgroups of communities it represents.The support <strong>Council</strong> contributes assistsgroups to achieve their goals when itwould not otherwise have been possibleowing to lack of resources. This supportincludes facilitation, advocacy, consultationand allocation of grants to communityorganisations and groups. Theseservices are carried out through <strong>Council</strong>’sCommunity Development Division orthrough private contracts.This activity contributes primarilyto the following CommunityOutcomes:• A safe community• Healthy people• Actively engaged in communityactivities• Strong and inclusivecommunities• A well-governed cityPublic – highPrivate – lowOther – lowWho benefits: In most cases community support or grants are targeted towards the mostdisadvantaged groups in society. Targeting intervention at the most disadvantaged groups does provideindividual benefits for those people. However the very nature of this service means that the recipientscannot be expected to shoulder the cost. By lifting the status of our most disadvantaged groups, thewhole community benefits through greater social cohesion, higher productivity, and less demand forremedial services. Therefore this activity is appropriately funded from the general rate.There is an intergenerational aspect to this activity, in that the social policy framework was developedover a few years but its benefits will occur over a longer period.Who pays:No particular sector or group is considered to drive or benefit from these costs beyond those groupsthat can be targeted by user fees. The public good portion of this activity cost is therefore allocated inproportion to each sector’s share of the total capital value of the city.
40 HUTT CITY LONG TERM PLAN <strong>2012</strong>-2022ACTIVITYOUTCOMEFUNDING SOURCEPROPORTIONFUNDING RATIONALE [ LGA 2002 SECTION 101(3)(A) ]Who benefits (community as a whole, or individuals, group or users, exacerbators), intergenerational benefits, reasons for funding the activity separately)Roading and TrafficThe roading and traffic significant activityconsists of five sub-functions – roading andfootpaths, street cleaning, street lighting,traffic management and parking. <strong>Council</strong>provides, maintains and cleans sealedroads and footpaths throughout the city.Traffic control measures are utilised toensure the efficient and safe movement ofmotor vehicles, cyclists, pedestrians andother forms of transport. Street lighting isprovided to ensure the safety and securityof road and footpath users at night.Parking involves the provision,maintenance and regulation of on-streetand off-street carparks in the commercialareas of the city. The location andregulation of carparks is designed toensure fair, easy and efficient access to thecity’s commercial areas.This activity contributes primarilyto the following CommunityOutcomes:• A safe community• A strong and diverse economy• An accessible and connectedcity• Healthy people• A healthy and attractive builtenvironmentPublic – med/highPrivate – lowOther – lowWho benefits:Roading: Many of the benefits of roading networks accrue to individuals or businesses. To a large extent, thisis reflected in the subsidies received by <strong>Council</strong> from government for roading, which are ultimately fundedfrom fuel excise, road user charges, and vehicle registration charges. However, for the balance of costswhich <strong>Council</strong> must cover, <strong>Council</strong> has no direct means to charge individual users of the local network on auser-pays basis. Consequently, rates revenue is used to fund <strong>Council</strong>’s share of these costs. Most roadingexpenditure in the city relates to the ongoing maintenance of the existing network and assets, with onlymoderate expenditure on improvements. Most of the expenditure is therefore funded directly from ratesrevenue (and government subsidies) rather than through borrowing. However, major projects with benefitsover several decades, or very high costs, will be debt funded, along with an approximate contribution fromdevelopment contributions charges where possible. This helps ease the immediate burden on rates, helps toensure intergenerational equity, and ensure growth costs are borne by developers.Street Cleaning: Street cleaning has a range of benefits widely dispersed amongst the community, andfor which there is little ability or sense in charging individual for the benefits they receive. The need toundertake street cleaning is partially caused by the actions of individuals littering or dumping and is thusan exacerbator issue. However, it is very difficult to police this activity, and consequently few costs areable to be recovered this way.Parking: The benefits of on-street parking largely accrue to the individuals or groups involved. Howevercharging and actively monitoring parking in most areas, such as most urban neighbourhoods, is simply notpractical or cost effective – although some time restrictions may still apply. Consequently, a large proportionof the cost is simply absorbed into the roading budget, and funded accordingly. In areas with a highconcentration of parking demand, it becomes necessary and cost-effective to manage parking, allowingmuch of the cost associated with these parks to be recouped through parking charges and/or fines.The benefits of road facilities are ongoing and spread over the long term. These intergenerationalbenefits support the ongoing use of debt financing for associated capital works.Who pays: Trip generation is used as an indicator of both the cause and benefit of this activity’s costs.Trip generation of the business / utility and residential sectors is estimated at 72% / 28% respectively.The share of general rates costs are allocated to these sectors on this same basis.Water SupplyThis activity involves the supply of highquality drinkable water for domestic andcommercial use. <strong>Council</strong> purchases bulkwater from Greater Wellington Regional<strong>Council</strong>, and this accounts for 56% ofthe total cost of water supply to the city.Water is then distributed around the citythrough the local pipe network. <strong>Council</strong>’sownership of the pipe network is historical.There is a legal requirement for <strong>Council</strong> toretain control of these assets.This activity contributes primarilyto the following CommunityOutcomes:• A strong and diverse economy• An accessible and connectedcity• Healthy people• A healthy natural environment• Strong and inclusivecommunitiesPublic – lowPrivate – highOther – lowWho benefits: Much of the benefit from this activity is considered to be private to the people whoobtain and use the water. Public health benefits arise out of the treatment of water borne diseases.Water leakage and unaccounted for water accounts for a significant amount of total water use. Thiscost is spread evenly across all users.There are ongoing benefits as long as infrastructure is maintained. These intergenerational benefitssupport the ongoing use of debt financing for associated capital works.Who pays: In the absence of metering, targeted rates can be seen as a proxy for user charges. Allconnections are charged the targeted rate, and this is assumed to cover the supply of the averageresidential user. Commercial water users are charged on a metered rate for water consumption overand above this volume.
HUTT CITY LONG TERM PLAN <strong>2012</strong>-202241ACTIVITYOUTCOMEFUNDING SOURCEPROPORTIONFUNDING RATIONALE [ LGA 2002 SECTION 101(3)(A) ]Who benefits (community as a whole, or individuals, group or users, exacerbators), intergenerational benefits, reasons for funding the activity separately)Wastewater<strong>Council</strong> ensures the treatment anddisposal of household and commercialeffluent according to regional and nationalenvironmental standards. A new treatmentplant was commissioned in 2002 to ensureeffluent is treated to higher standards.This activity contributes primarilyto the following CommunityOutcomes:• A strong and diverse economy• An accessible andconnected city• Healthy people• A healthy natural environment• Strong and inclusivecommunitiesPublic – lowPrivate – highOther – lowWho benefits: The removal of wastewater largely benefits the person whose wastewater is removed.However the public also benefits through improved public health and an unpolluted environment. Theoperation of many social and commercial activities would be curtailed if raw effluent was not properlydealt with.There is also a significant exacerbator component to the treatment of wastewater, as people causecosts through their action (for example commercial businesses that produce trade waste) or inaction(for example not installing a dual flush toilet).Some revenue is collected from the Upper <strong>Hutt</strong> <strong>City</strong> <strong>Council</strong> as an operating contribution towards theshared service.The benefits of wastewater services are ongoing and spread over the long term. Theseintergenerational benefits support the ongoing use of debt financing for associated capital works.Who pays: In the absence of metering of water supplied as a proxy for water discharged, targetedrates can be seen as a proxy for user charges.Stormwater<strong>Council</strong> operates an effective drainagesystem to protect property from floodingdamage. Stormwater infrastructureincludes pipe networks, street-side gutters,retention dams and open watercourses.These are provided and maintainedaccording to the reasonable costs ofmanaging foreseeable flooding events.There is a legal requirement for <strong>Council</strong> toretain control of these assets.This activity contributes primarilyto the following CommunityOutcomes:• A safe community• A strong and diverse economy• An accessible andconnected city• Healthy people• A healthy natural environment• Strong and inclusivecommunities• A healthy and attractive builtenvironmentPublic – highPrivate – lowOther – lowWho benefits: Stormwater reticulation, watercourses, major storm events and watercourse qualitymanagement, addressed under this activity, are partly for private benefit but mainly for public benefit.This is in terms of dealing with public spaces and the public stormwater system, managing damagefrom severe flooding and conducting monitoring and pollution control for the community at large.Economies of scale associated with the provision of the overall system are also recognised.Buildings and pavements increase the necessity for stormwater management and in this respect thebuilt-up areas can be considered to exacerbate the problem.The benefits accrue over a long period, and hence costs need to be appropriately allocated between thecurrent and future users. These intergenerational benefits support the ongoing use of debt financing forassociated capital works.Who pays: The business sector is estimated to represent around 37% of the city’s impervious areaafter allowing for a proportion of road stormwater allocated to the business sector on the same basis asthe roading activity. General rates allocation to the business sector is twice this sector’s share of the citycapital value.
42 HUTT CITY LONG TERM PLAN <strong>2012</strong>-2022ACTIVITYOUTCOMEFUNDING SOURCEPROPORTIONFUNDING RATIONALE [ LGA 2002 SECTION 101(3)(A) ]Who benefits (community as a whole, or individuals, group or users, exacerbators), intergenerational benefits, reasons for funding the activity separately)Solid Waste<strong>Council</strong> contracts out the collection ofmost residential and some commercialsolid waste and household recycling. It alsoowns two landfills for the disposal of thecity’s refuse. <strong>Council</strong>’s Waste Managementand Minimisation <strong>Plan</strong> guides this activity.<strong>Council</strong> wishes to promote recyclingand waste reduction and to provide forthe disposal of the city’s solid waste.Residents and businesses can opt out ofa <strong>Council</strong>-controlled service but as yet noprivate sector operators have put forwardacceptable proposals for significant non-<strong>Council</strong> landfills.This activity contributes primarilyto the following CommunityOutcomes:• Healthy people• A healthy natural environmentPublic – lowPrivate – highOther – lowWho benefits: The primary benefits of this activity are private benefits to people whose refuse isdisposed of, and this is the classic example of polluter pays. Solid waste charges need to be setto incentivise people to reduce, reuse, recover and recycle. If these more beneficial actions can beencouraged we can significantly diminish the amount of waste to landfill.<strong>Council</strong> provides kerbside recycling which is funded through a targeted rate. Recycling produces publicbenefits through sustainable resource use and through the deferral of costs involved in replacing landfills.There are also public benefits in ensuring that refuse is disposed of appropriately. The consequences ofpoorly dealt with waste are immediate public health effects. <strong>Long</strong>er term health effects can also resultfrom interaction with contaminated sites.The benefits of this activity are ongoing and spread over a long period. These intergenerational benefitssupport the ongoing use of debt financing for associated capital works.Who pays: The solid waste function makes an overall surplus, particularly as a result of landfillactivities. This return on investment compensates <strong>Council</strong> as a whole and the whole ratepayer base forthe long-term business risks of landfill operation and aftercare. Any surplus is therefore used to offsetgeneral rates.Environmental Management<strong>Council</strong> develops, implements andmonitors the District <strong>Plan</strong>, relevant bylawsand other environmental policies andplans for the sustainable developmentof the city. <strong>Council</strong>’s statutory resourcemanagement and building approvalfunctions as well as liquor licensing andenvironmental health are also includedunder this activity. Regular inspectionsare carried out to ensure compliance withlegislative requirements, the District <strong>Plan</strong>,resource consent and building consentconditions and by-law requirements.Regular inspections of business premises,certification and liquor licensing areundertaken to promote and protect publichealth in the city.Noise and hazardous substances arecontrolled by this activity. The controlof animals and stock in the city (a largepart of which involves dogs and dogregistrations) and public education aboutthe care and control of animals are alsocovered. There is a legal requirement forthis activity.This activity contributes primarilyto the following CommunityOutcomes:• A safe community• A strong and diverse economy• An accessible andconnected city• Healthy people• A healthy natural environment• A healthy and attractive builtenvironmentPublic – medPrivate – medOther – lowWho benefits: Environmental Policy: District planning has a mix of private and public benefits, as wellas encouraging optimal resource use over time. The District <strong>Plan</strong> is determined by the community interms of the Resource Management Act. It therefore applies to, and represents the environmentalaspirations of the community as a whole.Environmental Consents: The environmental consents activity is undertaken to ensure that publicwelfare is not jeopardised by the actions of individuals or groups now or in the future. Current chargesfor building consents are already considered to be significant. High charges may restrict developmentactivity in the city.Environmental Inspections & Enforcement: The environmental inspections and enforcement activityensures that the policies and regulation of <strong>Council</strong> are being complied with. The service also actsto control the negative effects of non-compliance by individuals or groups, nearly all of which arebusinesses. There is also a general public benefit in the assurance of a safe environment.Animal Control: Animal control is primarily the dog control function with a small amount of serviceinvolved with general livestock control. Dog registration fees are a targeted form of cost recoveryfor this activity. An animal control function is necessary in order to ensure the public is safe from thenegative effects of animal ownership. At one level, the activity can be considered an exacerbator issue,as the actions of animal owners create the need for the service. Often, it can be hard to track down ananimal’s owner – or the animal may be a stray – so recouping the costs of this activity is difficult.Who pays: These activities protect the public interests of both residents and business. Aftermaximising user charges, the public good portion of this activity cost is allocated in proportion to eachsector’s share of the total capital value of the city.
HUTT CITY LONG TERM PLAN <strong>2012</strong>-202243ACTIVITYEmergency Management<strong>Council</strong> develops and implements citywideemergency management plans, andpromotes community preparedness foremergencies. <strong>Plan</strong>s are also in place fordealing with and preventing rural fires.<strong>Council</strong> maintains the in-house capacity toco-ordinate responses to both civil defenceand rural fire emergencies. There is a legalrequirement under the Forest and RuralFires Act and the Civil Defence Act for<strong>Council</strong> to perform these functions.Local Urban Environment<strong>Council</strong> aims to develop an urbanenvironment that will help to attractpeople and investment and enhance thecity’s image. <strong>Council</strong> also recognises thecontribution the city’s heritage buildingsand features play in the city’s image andhistory. The public space of the city ismanaged and developed by <strong>Council</strong> onbehalf of the community. The benefitsof preserving buildings of architectural,heritage and historic value are to thecommunity as a whole, as the workrequired is often of no benefit to theowner or occupier. <strong>Council</strong> thereforepurchases the public benefit on behalf ofthe community.Economic Development<strong>Council</strong> has a leading role in fostering thecity’s growth in a number of ways.These are through creating a businessfriendlyenvironment, facilitating theexpansion and creation of local businessesand employment, increasing tourism tothe city and contributing to regional growththrough regional economic developmentinitiatives. Individual businesses generallyhave insufficient incentives to exploreopportunities that benefit the city as a wholeas well as themselves. The city’s businessesand residents benefit from <strong>Council</strong>’ssupport of the business sector and from thepromotion of the city as a place to visit.OUTCOMEThis activity contributes primarilyto the following CommunityOutcomes:• A safe community• Strong and inclusivecommunitiesThis activity contributes to allCommunity Outcomes.This activity contributes primarilyto the following CommunityOutcomes:• A strong and diverse economy• An accessible and connectedcity• Strong and inclusivecommunitiesFUNDING SOURCEPROPORTIONPublic – med/highPrivate – med/lowOther – medPublic – highPrivate – lowOther – lowPublic – med/highPrivate – lowOther – lowFUNDING RATIONALE [ LGA 2002 SECTION 101(3)(A) ]Who benefits (community as a whole, or individuals, group or users, exacerbators), intergenerational benefits, reasons for funding the activity separately)Who benefits: The whole community benefits from this activity. It is triggered where the disruption tocommunity life is such that a coordinated community response is required.The work regarding rural fire response and prevention applies largely to <strong>Council</strong>-owned land andtherefore any benefits apply to the community. A rural fire response is necessary to deal with fires litaccidentally or deliberately. Where the person responsible for starting a rural fire is identified, they aredealt with through the courts and compensation is obtained where possible.Revenue is collected from the Upper <strong>Hutt</strong> <strong>City</strong> <strong>Council</strong> as an operating contribution towards the sharedservice and this is reflected in the ‘other’ funding source category.Who pays: No particular sector or group is considered to drive or benefit from these costs beyondthose groups that can be targeted by user fees. The public good portion of this activity cost is thereforeallocated in proportion to each sector’s share of the total capital value of the city.Who benefits: <strong>Council</strong> aims to carry out improvements to public areas to improve the amenity value ofthe city. Most of the benefits from this activity accrue to the community as a whole. Certain parts of thecommunity, such as business owners, may gain distinct private benefits as a result of council work inshopping areas etc.Benefits are ongoing, and work particularly around the preservation of heritage elements is intendedfor the benefit of future generations. These intergenerational benefits support the ongoing use of debtfinancing for associated capital works.Who pays: No particular sector or group is considered to drive or benefit from these costs beyondthose groups that can be targeted by user fees. The public good portion of this activity cost istherefore allocated in proportion to each sector’s share of the total capital value of the city.Who benefits: These projects are targeted at regional cooperation and growth industries. The generaleconomic development function of <strong>Council</strong> aims to increase jobs and wealth for the benefit of thewhole city in the long term.Who pays: No particular sector or group is considered to drive or benefit from these costs beyondthose groups that can be targeted by user fees. The public good portion of this activity cost istherefore allocated in proportion to each sector’s share of the total capital value of the city.
44 HUTT CITY LONG TERM PLAN <strong>2012</strong>-2022ACTIVITYOUTCOMEFUNDING SOURCEPROPORTIONFUNDING RATIONALE [ LGA 2002 SECTION 101(3)(A) ]Who benefits (community as a whole, or individuals, group or users, exacerbators), intergenerational benefits, reasons for funding the activity separately)Elected Members<strong>Council</strong> is an elected body that governs thedirection and objectives of the activitiesit is responsible for on behalf of the city.Community representatives on CommunityBoards and Community Committees arepart of <strong>Council</strong> and provide local input intogovernance issues. <strong>Council</strong> is required bylaw to have elected members.This activity contributes to allCommunity Outcomes.Public – highPrivate – lowOther – lowWho benefits: The beneficiaries of this activity are the people and organisations in the city who benefitthrough the democratic governance of the city’s affairs.Who pays: No particular sector or group is considered to drive or benefit from these costs beyondthose groups that can be targeted by user fees. The public good portion of this activity cost istherefore allocated in proportion to each sector’s share of the total capital value of the city.Advice and SupportThis activity involves the processes ofpolicy formation, consultation and publicaccountability on behalf of <strong>Council</strong>. Themost public examples of this are theannual planning and reporting processesand the development of the city’s strategicplans. Professional advice and supportare necessary to assist the communityand their representatives on <strong>Council</strong>,Community Boards and CommunityCommittees to make informed decisionson behalf of the community.This activity contributes to allCommunity Outcomes.Public – highPrivate – lowOther – lowWho benefits: The beneficiaries of this activity are the people and organisations in the city who benefitthrough the democratic governance of the city’s affairs.Who pays: No particular sector or group is considered to drive or benefit from these costs beyondthose groups that can be targeted by user fees. The public good portion of this activity cost istherefore allocated in proportion to each sector’s share of the total capital value of the city.Managing ServicesThis activity incorporates the organisationalsupport functions that help <strong>Council</strong> toprovide its other activities in the mostefficient and effective manner. It includes:• Human Resources Management• Financial Management• Corporate Strategy and Risk• Corporate Counsel• Information ServicesThis activity contributes to allCommunity Outcomes.Public – highPrivate – lowOther – lowWho benefits: The entire community benefits from the <strong>Council</strong> being run as an efficient organisation.Who pays: No particular sector or group is considered to drive or benefit from these costs beyondthose groups that can be targeted by user fees. The public good portion of this activity cost istherefore allocated in proportion to each sector’s share of the total capital value of the city.Key:High 80-100% Med/high 60-79% Med 40-59% Med/low 20-39% Low 0-19%
HUTT CITY LONG TERM PLAN <strong>2012</strong>-202245APPENDIX 2Summary of Funding Sources by ActivityACTIVITYTOTALOPERATINGCOST (EXCLGST)($000)OTHERREVENUESOURCES($000)NET GENERALRATES (EXCLGST)($000)RESIDENTIAL(%)ACCOMMODATION(%)CENTRAL(%)ALLOCATION OF GENERAL RATES COSTS USING 2010 CAPITAL VALUESBUSINESSQUEENS SUBURBANGATE (EASTBOURNE)(%)(%)SUBURBAN(%)SUBURBAN(JSP)TOTALBUSINESS(%)UTILITIES(%)RURAL(%)COMMUNITY FACILITIESSector’s percentage share of city’s total capital value76.9 0.3 3.1 1.8 0.1 11.2 0.9 17.4 3.5 1.6 0.1 0.3 0.1Sector’s percentage share of general rates following step one allocation of costs (see Appendix 1 for detailed reasons)Libraries 8,747 817 7,930 76.9 0.3 3.1 1.8 0.1 11.2 0.9 17.4 3.5 1.6 0.1 0.3 0.1Museums 3,783 783 3,000 76.9 0.3 3.1 1.8 0.1 11.2 0.9 17.4 3.5 1.6 0.1 0.3 0.1Aquatics & Recreation 10,040 4,282 5,758 76.9 0.3 3.1 1.8 0.1 11.2 0.9 17.4 3.5 1.6 0.1 0.3 0.1Parks & Reserves 12,539 1,997 10,542 76.9 0.3 3.1 1.8 0.1 11.2 0.9 17.4 3.5 1.6 0.1 0.3 0.1Community Development 3,317 144 3,173 76.9 0.3 3.1 1.8 0.1 11.2 0.9 17.4 3.5 1.6 0.1 0.3 0.1Roading & Traffic 25,556 7,895 17,661 27.3 1.2 10.5 6.1 0.3 38.5 3.2 59.8 12.2 0.6 0.0 0.1 0.0Stormwater 7,113 110 7,003 60.7 0.7 6.1 3.5 0.2 22.5 1.9 34.8 2.8 1.3 0.1 0.2 0.1Solid Waste 6,256 13,087 (6,831) 76.9 0.3 3.1 1.8 0.1 11.2 0.9 17.4 3.5 1.6 0.1 0.3 0.1Environmental Mngt 9,312 3,532 5,780 76.9 0.3 3.1 1.8 0.1 11.2 0.9 17.4 3.5 1.6 0.1 0.3 0.1Emergency Mngt 1,190 358 832 76.9 0.3 3.1 1.8 0.1 11.2 0.9 17.4 3.5 1.6 0.1 0.3 0.1Local Urban Environment 1,560 300 1,260 76.9 0.3 3.1 1.8 0.1 11.2 0.9 17.4 3.5 1.6 0.1 0.3 0.1Economic Development 3,473 668 2,805 76.9 0.3 3.1 1.8 0.1 11.2 0.9 17.4 3.5 1.6 0.1 0.3 0.1Elected Members 1,960 - 1,960 76.9 0.3 3.1 1.8 0.1 11.2 0.9 17.4 3.5 1.6 0.1 0.3 0.1Advice & Support 4,107 - 4,107 76.9 0.3 3.1 1.8 0.1 11.2 0.9 17.4 3.5 1.6 0.1 0.3 0.1Managing Services (1,677) 1,579 (3,256) 76.9 0.3 3.1 1.8 0.1 11.2 0.9 17.4 3.5 1.6 0.1 0.3 0.1Operational funding 97,276 35,552 61,7241(%)2(%)3(%)TARGETED RATESTOTALOPERATINGCOST(EXCL GST)OTHERSOURCES(USERCHARGESETC)TARGETEDCHARGES(EXCL GST)Water Supply 14,320 2,310 12,010Wastewater 19,677 3,504 16,173Recycling - - 1,200Private drains - - 78Jackson Street - - 110Total targeted rates 33,998 5,814 29,571Grand total 131,275 91,295
46 HUTT CITY LONG TERM PLAN <strong>2012</strong>-2022<strong>Hutt</strong> <strong>City</strong> Development Charges Remissions PolicyObjectiveTo encourage economic development in <strong>Hutt</strong> <strong>City</strong> by remitting the following for specifiedtypes of developments for a maximum of two years:• development contributions;• reserve financial contributions;• resource consents fee and charges; and• building consents fees and charges. 1This policy is part of a wider programme aimed at revitalising the CBD and the city.Remissions granted will be up to 100% of the charges levied by <strong>Hutt</strong> <strong>City</strong> <strong>Council</strong>, andfor up to a maximum period of two years following the granting of building consent.CriteriaTo be eligible for a remission of <strong>Council</strong>’s development charges under this policy, adevelopment must:A: Be either:• A medium or high density residential development; or• a new non-residential development; or• a conversion of a building from any use to residential apartmentsAndB: Have relevant resource and building consents applications lodged between 1 July <strong>2012</strong>and 30 June 2014.DefinitionsFor the purposes of this policy:• Development means:− construction of dwellings or one or more buildings requiring one or more building andresource consents that, as a body of work, occurs within a similar timeframe, and thatstands alone as a complete activity in and of itself; or− in the case of apartment conversion, any conversion involving at least 8 attachedresidential dwelling units or of at least 600 m 2 (whichever is the lesser) 2• Medium and high density housing means any housing development of:− 3 or more adjoined dwellings, including rest homes and other residential facilities; or− 3 or more dwellings within a development with a combined land area of no more than400 m 2 per dwelling on average. 3• New non-residential development means construction of any new non-residential buildingof at least 500 m 2 , including construction of a new building following demolition or removalof existing buildings. It also includes an extension to an existing building where theextension increases the size of the building by at least 500 m 2 .This policy does not exclude the potential for more than one development to occur on thesame site.ConditionsIn granting remissions under this policy, <strong>Hutt</strong> <strong>City</strong> <strong>Council</strong> may in its discretion specify certainconditions. Applicants will be required to agree in writing to these conditions and to pay anyremitted charges if the conditions are violated.Application ProcessApplications must be made in writing using an application form determined by <strong>Hutt</strong> <strong>City</strong><strong>Council</strong>. Applications must be made in sufficient time to be considered prior to consent beinggranted. Preferably, applications should be made at the time resource and building consentsare lodged.Applications must be supported by the information specified in the application form. Inconsidering applications, <strong>Hutt</strong> <strong>City</strong> <strong>Council</strong> may decide to seek independent verification of anyinformation provided with an application.Payment of Rates and ChargesUntil such time as an application for a remission of <strong>Council</strong>’s development charges has beenapproved under this policy and all relevant consents have been granted, applicants will remainliable for any charges and fees covered by this policy as per usual. Charges and fees will beremitted once approval had been granted and all relevant consents are granted. Should aconsent not proceed to grant, the applicant will be liable for resource and building consentcharges as per usual.Liability should construction not commence within two yearsShould construction of a development not commence within two years of being grantedbuilding consent, the remission of charges and fees provided under this policy shall no longerapply. At that stage, all fees and charges will be fully payable for the development as per usual.Commencement of construction will be deemed to have occurred when the activity for whicha resource and building consent has been issued, has commenced.1 Includes the cost of any external expertise sought by <strong>Council</strong> when assessing a resource or building consent and thecost of any hearing but excludes the cost of the building research levy paid to BRANZ or Department of Building andHousing fees. These must still be paid by developers.2 Includes internal car parking space provided as part of the building.3 Any existing residential property remaining on the site can count as one of the dwellings.
HUTT CITY LONG TERM PLAN <strong>2012</strong>-202247DelegationsApplications for a remission of charges will be decided by the Chief Executive or by a personauthorised by the Chief Executive.AppealApplicants may appeal against:• a decision to decline a remission or not grant a full remission; or• conditions imposed when a remission has been approved.Appeals will be heard by the Finance and Audit Committee of <strong>Council</strong>.ExclusionsThis policy shall not apply to any development undertaken by <strong>Council</strong>.Significance Policy1. ObjectiveAll decisions the <strong>Council</strong> makes must be made in accordance with the decision-makingrequirements of the Local Government Act 2002 (set out in sections 76-81). <strong>Council</strong> mustmake a judgement about how to achieve compliance with the Act that reflects the significanceof the matter under consideration. This policy explains the <strong>Council</strong>’s approach to determiningsignificance and lists the thresholds, criteria and procedures that will be used in the assessment.2. IntroductionThe Local Government Act 2002 sets out the framework for <strong>Council</strong>’s consultation anddecision-making processes. Significance is a key concept in this framework. The termsignificance, as used in the Act, is not intended to have a precise definition and insteadrefers to a continuum – from decisions that are trivial in nature to decisions that are of majorimportance. The council must decide where on the continuum a decision sits and what level ofanalysis and consultation is appropriate every time a decision is made.3. Take into account the relationship of Mäori and their culture and traditions, if any of theoptions involves a significant decision in relation to land or a body of water (s.77 (1)(c) refers).The Significance Policy, along with the <strong>Council</strong>’s Engagement Strategy, gives <strong>Council</strong> guidanceon what consultation processes should be followed in relation to a particular decision. The<strong>Council</strong>’s ‘Guide to Good Decision Making’ provides further assistance as to what analysis isappropriate given the significance and nature of a decision. Even where <strong>Council</strong> deems that aparticular decision does not reach the ‘significant’ threshold, they may still choose to adopt theSpecial Consultative Procedure.3. Approach to Decision-Making and SignificanceDetermining significanceA significant decision is one that has a high degree of significance in terms of its impact on• the wellbeing of <strong>Hutt</strong> <strong>City</strong> and/or• persons likely to be affected by or with an interest in that decision and/or• the costs to or the capacity of the <strong>Hutt</strong> <strong>City</strong> <strong>Council</strong> to provide for the wellbeing of the city.When considering the significance of a proposal, decision or other matter, the <strong>Council</strong> will usethe following threshold and criteria: (Note: it is the cumulative effect of all these criteria thatdetermines the overall significance of a matter).• The extent to which the matter flows logically and consequentially from a significantdecision already made or from a decision in the LTP or the Annual <strong>Plan</strong>.Matter had beensignalled in the LTPIncreasing SignificanceMatter has not been signalled inthe LTP or is contrary to aposition taken in the LTP• The magnitude of the matter in terms of its net cost to the <strong>Council</strong>. Where a decisionhas not been highlighted through the LTP or Annual <strong>Plan</strong>, a decision involving a change inspending of more than 10% of the planned capital expenditure for capital items or 5% ofthe planned operating expenditure for operating decisions will be considered significant.Trivial Significance Major ImportanceIncreasing level of analysis and consultation appropriateThe significance continuum has a threshold at which point decisions are deemed to be‘significant’. If an issue requiring decision is determined to be ‘significant’ the council will:1. Undertake consultation in accordance with the Special Consultative Procedure (see s84and 97 of the Act).2. Appropriately observe section 76(1) of the Act, i.e. ensure that every decision is made inaccordance with the decision-making requirements set out in the Act (s.76 (3)(b) refers).Low $ Amount Increasing Significance High $ Amount• The transfer of ownership or control, or the disposal or abandonment of a Strategic Assetas a whole as defined by the LGA or listed in section 4 of this policy will be consideredto be significant. The degree to which transfer of ownership or control, or the disposal orabandonment of a part of a Strategic Asset undermines the integrity/functioning of theasset as a whole or restricts the networking utility of the asset will also be considered.Discrete component – no impact onintegrity of whole strategic assetIncreasing SignificanceUndermines ability of strategic assetto deliver service
48 HUTT CITY LONG TERM PLAN <strong>2012</strong>-2022• The matter includes consideration of a large increase in user fee or the introduction of auser fee for a service that has previously been provided free of charge.Small fee increase – at orbelow inflationIncreasing SignificanceLarge fee increase, or introductionof new user charge especially wherethis will affect vulnerable residents• The matter includes consideration of an alteration to the intended level of service provisionfor any core <strong>Council</strong> activity, including a decision to commence or cease any such activity.Small service level alterationIncreasing SignificanceLarge service level alteration ordecision to commence or ceaseactivity especially where this willaffect vulnerable residents• Reversibility and intergenerational equity. The more irreversible the effects of a decision themore significance it has – particularly where the decision involves the unsustainable useof resources and thus reduces the right of future citizens to inherit the same diversity ofnatural and societal resources enjoyed by current citizens.Effects of the decision arereversibleIncreasing SignificanceEffects of the decision areirreversible• Practicality. The Act provides for the <strong>Council</strong> to take into account the circumstances underwhich a decision is taken and what opportunity there is to consider a range of options ofthe views and preferences of other people. In circumstances in which failure to make adecision urgently would result in the loss of opportunities which are assessed as able tocontribute to achieving the community outcomes, then the <strong>Council</strong> will tailor its decisionmaking processes to allow as much evaluation and consultation as is practicable whileachieving the timeline required.Matter requires that a decisionis made urgentlyIncreasing Significance No particular urgency is required• The extent to which the matter under consideration is controversial within the community.Low degree of public interestand controversyIncreasing SignificanceHigh degree of public interest andcontroversyProcedureAll reports to <strong>Council</strong> will include an assessment of the significance of the report’srecommendations. A statement showing how the <strong>Council</strong> has (or will) appropriately observe(d)the Act, with regard to the appropriate degree and form of consultation and analysis, will alsobe included.If the recommendations are considered to be above the ‘significant’ threshold, an externalpeer review will be sought to confirm that the decision-making process undertaken is inaccordance with the decision-making requirements set out in the s76 of the Act.4. Strategic AssetsThe Act defines a Strategic Asset as:“an asset or group of assets that the local authority needs to retain if the local authority isto maintain the local authority’s capacity to achieve or promote any outcome that the localauthority determines to be important to the current or future wellbeing of the community andincludes—(a) any asset or group of assets listed in accordance with section 90(2) by the local authorityand(b) any land or building owned by the local authority and required to maintain the localauthority’s capacity to provide affordable housing as part of its social policy and(c) any equity securities held by the local authority in –(i) a port company within the meaning of the Port Companies Act 1988:(ii) an airport company within the meaning of the Airport Authorities Act 1966”In accordance with section 90(2) of the Local Government Act 2002 <strong>Hutt</strong> <strong>City</strong> <strong>Council</strong>considers the following assets to be strategic:• Roading Network• Wastewater Network and Treatment• Stormwater Network• Water Supply Network• Landfills• Network of parks and reserves• Dowse and Settlers Collections• Library Network
50 HUTT CITY LONG TERM PLAN <strong>2012</strong>-2022ENVIRONMENTAL POLICIES CONSULTED ON IN <strong>2012</strong>WATER CONSERVATION AND EFFICIENCY PLANWater is a fundamental need for people and businesses. We’ll need to manage this resourcecarefully in the future as a growing population, changing built environment and uncertaintysurrounding climate change become important issues.Our Water Conservation and Efficiency <strong>Plan</strong> aims to prioritise the management of our waterin light of the above, and to encourage awareness amongst the wider community of an issuewhich is likely to become increasingly important.The cornerstones of the plan are conservation and efficiency. Conservation refers to doingfewer activities that use water, such as watering the garden less or showering for shorterperiods. Efficiency is when we use new hardware or techniques to get the same level ofbenefits from less water. Examples of efficiency measures are applying mulch to gardens andusing low-flow shower heads.The <strong>Plan</strong> lies underneath <strong>Council</strong>’s Environmental Sustainability Strategy 2009-2014, whichdetails several environmental sustainability focus areas, including water. The key objective ofthe Strategy that this <strong>Plan</strong> works towards is reduced per capita water consumption, in turncontributing to a more effective use of <strong>Hutt</strong> <strong>City</strong>’s reticulated water supply.The following six activities are planned for implementation over the next two to three years,with the focus primarily on education, informing the community and ensuring provisions are inplace to advance conservation and efficiency.• A community engagement, education and information programme• Analysis and publication of <strong>Hutt</strong> <strong>City</strong> water consumption figures• Engaging retailers and service providers in order to advance water efficiency andconservation goods and services• Investigating the scope and options for supporting the implementation of waterconservation initiatives• Targeting the top 25 commercial users to assist in making their operations more water efficient• Ongoing active leak detection work and cost/benefit analysis for pressure managementwithin the public network.ASSESSMENT OF WATER SERVICESUrban areas of <strong>Hutt</strong> <strong>City</strong> are serviced by a reticulated water supply system comprisingapproximately 683 km of pipes, 24 water storage reservoirs and 13 pump stations. Thissystem distributes water purchased from Greater Wellington Regional <strong>Council</strong> to homes andbusinesses across the city.The table below shows the source of water supply to urban areas of <strong>Hutt</strong> <strong>City</strong>.AREA OF SUPPLY<strong>Hutt</strong> Valley and Eastbourne(excluding Petone, KorokoroStokes Valley, Manor Park andHaywards)SOURCE OF WATERIS CHLORINEUSUALLY ADDED?<strong>Hutt</strong> Valley Artesian System No YesPetone, Korokoro <strong>Hutt</strong> Valley Artesian System No NoStokes Valley, Manor Park,HaywardsWainuiomataTe Marua (Headwaters of <strong>Hutt</strong>River)Wainuiomata (Headwaters ofWainuiomata and OrongorongoRivers)YesYesIS FLUORIDEADDED?The reticulated water supply in <strong>Hutt</strong> <strong>City</strong> is graded Bb (B for the bulk supply and b for thewater distribution) by the Ministry of Health. This grading indicates that the Ministry ofHealth assesses the <strong>Hutt</strong> <strong>City</strong> <strong>Council</strong> water supply as being “satisfactory, low level ofrisk”. It is probable that an Aa grading (“completely satisfactory, very low level of risk”)or an A1a grading (“completely satisfactory, negligible level of risk, demonstrably highquality”) would be achieved if chlorine was added to the artesian water supply.In addition to the reticulated water supply, <strong>Hutt</strong> <strong>City</strong> <strong>Council</strong> provides a supply of untreatedartesian water extracted directly from the aquifer which is available to the communityfrom “Te Puna Wai Ora”, an artesian water facility and sculpture situated in the businessarea of Petone.The majority of properties in rural areas obtain their water supplies from roofwater runoff orfrom streams on their properties, although there are a small number of rural/residential areasthat have a limited (not meeting normal urban standards for pressure and flow) water supplyfrom the reticulated water supply system as an alternative to roofwater or stream supplies.YesYesYear round inflows can be expected into private water supplies on account of the temperateclimate in <strong>Hutt</strong> <strong>City</strong>, although shortages can still occur over summer months depending onweather patterns and the amount of water storage built into each system. Most rural parts of<strong>Hutt</strong> <strong>City</strong> are within 15 minutes driving time of the reticulated <strong>Hutt</strong> <strong>City</strong> water supply system andtanker services are available which can provide water into private systems if shortages occur.
HUTT CITY LONG TERM PLAN <strong>2012</strong>-202251The quality of water in private water supplies depends on the quality of the source water, thedesign of the water supply system including treatment systems, and the way the water supplysystem is maintained and operated. These factors vary between individual systems. Riskscan be managed to acceptable levels in well designed, maintained and operated private watersupplies. There is no known history of significant health problems associated with privatewater supplies in <strong>Hutt</strong> <strong>City</strong>.Future DemandAccording to Statistics New Zealand forecasts, population growth in <strong>Hutt</strong> <strong>City</strong> or Upper <strong>Hutt</strong><strong>City</strong> over the next 20 years is expected to be slow. Therefore the water consumption in <strong>Hutt</strong><strong>City</strong> is only expected to rise slightly over the next 20 years unless measures such as watermetering are introduced.Key Issues and <strong>Hutt</strong> <strong>City</strong> <strong>Council</strong> ProposalsIssues associated with the water supply to the different communities in <strong>Hutt</strong> <strong>City</strong> havebeen identified in terms of their potential to compromise the achievement of health andenvironmental aspects of <strong>Hutt</strong> <strong>City</strong> community outcomes.ISSUESeismic Vulnerability of WaterSupply SystemThe 2010 and 2011 Canterburyearthquakes raised the profile ofwater supply service disruptionfollowing a significant seismic event.Earthquake hazard maps producedby Greater Wellington Regional<strong>Council</strong> indicate potential slopefailure, liquefaction, ground shaking,fault movement and tsunamihazards. The effect of these uponthe water supply network within<strong>Hutt</strong> <strong>City</strong> will depend greatly on theprecise seismic event that occurs.Disaster readiness and responseplans will form the basis of aprioritised recovery effort.Non Fluoridation ofPetone Water SupplyFluoride is added to most publicwater supplies in New Zealandas a dental health measure. It isnot necessary to add fluoride inorder to produce water suitable forconsumption. The water supplysystem is simply used as a meansof distributing fluoride efficientlyand cost effectively to communities.Fluoridation of water supplies istherefore not a water supply issuebut a public health issue.HUTT CITY COUNCIL PROPOSALIt is proposed that <strong>Hutt</strong><strong>City</strong> <strong>Council</strong> furtherinvestigate high criticalitywater main, reservoir andpump station seismicvulnerability and plana renewal / upgradeprogramme accordinglyThe possible fluoridationof the Petone watersupply was the subjectof an extensive publicconsultation processwith the Petonecommunity. This processshowed that there wasa strong preferencefor the retention of theunfluoridated watersupply that Petone hasreceived (with sometemporary short terminterruptions) since areticulated water supplywas first provided. Nofurther action is proposed.ASSOCIATED LTP PROJECT(S) OROPERATING PROJECT• Reservoir seismic upgrade –Delaney Reservoir (2015/16)• Reservoir seismic upgrade –Kingsley Reservoir (2016/17)• Reservoir seismic upgrade –Konini Reservoir (2015/16)• Reservoir seismic upgrade –Taita Reservoir (2015/16)• Reservoir seismic upgrade –Gawler Reservoir (2023/24)• Reservoir seismic upgrade –Sunville Reservoir (2027/28)• Reservoir seismic upgrade –Park Road Reservoir (2028/29)• Reservoir seismic upgrade– Manor Park Reservoir(2029/30)• Reservoir seismic upgrade –Korokoro Reservoir (2030/31)• Reservoir seismic upgrade –Kamahi Reservoir (2031/32)• Reservoir seismic upgrade– Titiro Moana Reservoir(2031/32)• Rata Reservoir roof andseismic upgrade (2022/23)• Critical pipelines seismicupgrade (2022/23 – 2031/32)• Operating project
52 HUTT CITY LONG TERM PLAN <strong>2012</strong>-2022ISSUELevel of Security of Bulk WaterSupply Against Water ShortagesThe current level of security (1in 50 year drought) against bulkwater shortages could be erodedby growth in the demand for water.Although significant growth in <strong>Hutt</strong><strong>City</strong> is not expected over the next 20years, recent growth over the widerWellington region has exceededprojections. Maintaining the currentlevel of security of supply is likely tonecessitate either:• the construction of additional bulkwater supply infrastructure (witha possible increase in bulk watercosts to <strong>Hutt</strong> <strong>City</strong>); or• a reduction in the average percapita water consumption fromthe public water supplyThe councils in the Wellingtonmetropolitan area are workingtowards a combined approach toreducing water consumption in theWellington area as an alternative toexpansion of the bulk water system.Heavy Metals Leaching Out ofPlumbingSome plumbing fittings containheavy metals such as lead whichcan be leached into the watersupply.Eastbourne – Security of SupplyThe water supply to Eastbourneflows in a southwards direction fromPoint Howard through two pipelinesin Marine Drive (one of which willneed to be decommissioned in thefuture). In the event of a failure ofthese pipelines the water supply toEastbourne south of the point of anyfailure will be immediately disrupteddue to an inability for Eastbourneto be supplied from an alternativesource.HUTT CITY COUNCIL PROPOSALThat a cooperativeapproach between thecouncils in the Wellingtonarea to reducing averagewater consumption, as analternative to expansionof the bulk water system,be supported .That <strong>Hutt</strong> <strong>City</strong> <strong>Council</strong>continues to providecity wide education/awareness notices.A duplicate main and newreservoir at Point Howardis programmed within the10-20 year period in the<strong>Long</strong> <strong>Term</strong> <strong>Plan</strong>.Continue investigationsinto the need for areservoir at the southernend of Eastbourne toimprove the securityof the water supply toEastbourne.ASSOCIATED LTP PROJECT(S) OROPERATING PROJECT• Water conservation (2022/23– 2024/25)• Emergency water supply(2022/23 & 2024/25 &2026/27))• Emergency supply point(valving) (<strong>2012</strong>/13)• Emergency water storagetanks (2013/14)Operating project• Eastern Bays Reservoirupgrade design/consents/construction (2017/18 &2019/20 – 2021/22)• Point Howard ReservoirConstruction (2027/28 –2028/29)• Point Howard Reservoir RoofUpgrade (2022/23)ISSUEHUTT CITY COUNCIL PROPOSALSilverstream Bulk WaterGreater WellingtonSupply PipelineRegional <strong>Council</strong> hasThe main bulk water supply pipeline carried out investigationsfrom the Te Marua Treatment <strong>Plan</strong>t into the security ofpasses over the Silverstream Road this pipeline and intoBridge and may be vulnerable alternatives. Securityin a major earthquake or major of this pipeline will beflood in the <strong>Hutt</strong> River. This would improved as part ofshut off the bulk water supply to the proposed futureManor Park and Haywards (and the upgrading of theprimary supply to Porirua <strong>City</strong> and Silverstream Bridge.much of Wellington <strong>City</strong>).Private Water SuppliesMost private water supplies aresourced from roof water runoffor from streams. A degree ofcontamination of water from thesesources is inevitable. Contaminantsmay also be able to enter on-sitewater storage tank(s). Privatewater supply systems may notincorporate treatment capable ofremoving or mitigating the effects ofcontaminants that are likely to enterthe water supply and may not havewater quality testing programmes,planned maintenance programmesor keep system records.Information on Private WaterSupply SystemsInformation on private watersupplies for individual properties islimited.It is proposed that <strong>Hutt</strong><strong>City</strong> <strong>Council</strong> continues toprovide information onthe risks associated withon-site water suppliesand how these can bemanaged and that thisinformation is developedin association with healthauthorities.That <strong>Hutt</strong> <strong>City</strong> <strong>Council</strong>develops guidelines fornew on-site water supplyinstallations.It is proposed that <strong>Hutt</strong><strong>City</strong> <strong>Council</strong> completespopulating its databaseof private water supplysystems in the city byJune <strong>2012</strong>.ASSOCIATED LTP PROJECT(S) OROPERATING PROJECT• GWRC project• Operating project• Operating project
HUTT CITY LONG TERM PLAN <strong>2012</strong>-202253Roles of <strong>Hutt</strong> <strong>City</strong> <strong>Council</strong> – Public Water Supply<strong>Hutt</strong> <strong>City</strong> <strong>Council</strong> is responsible for ensuring the public water supply in <strong>Hutt</strong> <strong>City</strong> is managedin a way which contributes towards the achievement of community outcomes for the city.This involves:• Setting standards to be achieved in the provision of the water supply.• Setting water supply policy.• Managing the interface with consumers.• Monitoring the performance of the water supply activity.• Advocating to and working with Greater Wellington Regional <strong>Council</strong> to ensure that thebulk water supply to <strong>Hutt</strong> <strong>City</strong> meets the requirements of the community.• Managing the interface with Capacity – the <strong>Hutt</strong> <strong>City</strong> <strong>Council</strong> and Wellington <strong>City</strong> <strong>Council</strong>jointly owned water management entity.• Approving budgets for the water supply activity including the setting of water supplycharges through the Annual <strong>Plan</strong> process.• Carrying out an assessment of water supply in <strong>Hutt</strong> <strong>City</strong> as required by the LocalGovernment Act 2002.Capacity is responsible to <strong>Hutt</strong> <strong>City</strong> <strong>Council</strong> for:• Making recommendations on standards and policy.• Managing the water supply system through the asset management plan process toachieve required outcomes.• Ensuring risks are identified and managed within acceptable limits.• Managing the maintenance and operation of the water supply system.• Developing and implementing programmes for the progressive replacement of thewater supply system.• Developing and implementing programmes to upgrade and extend the water supplysystem to meet future demand.• Ensuring new water supply infrastructure is designed and constructed to requiredstandards.• Monitoring the performance of the water supply activity including the quality ofwater supplied.Roles of <strong>Hutt</strong> <strong>City</strong> <strong>Council</strong> – Private Water SuppliesThe roles of <strong>Hutt</strong> <strong>City</strong> <strong>Council</strong> with respect to private water supplies reflect that both privateand public water supplies contribute towards the achievement of community outcomes.• Advisory - Providing advice to property owners on risks associated with on-site watersupplies and on the management of on-site water supply systems. (Note that this role isnot mandatory but is proposed reflecting the customer focus of <strong>Hutt</strong> <strong>City</strong> <strong>Council</strong>).• Regulatory - Setting requirements for servicing of new developments includingrequirements for on-site water supplies and managing compliance with New ZealandBuilding Code Requirements for Water Supply.• Assessments - Carrying out an assessment of groupings of private water supplies as partof a wider assessment of water supply in <strong>Hutt</strong> <strong>City</strong> as required by the Local GovernmentAct 2002.• Partial Service Provider - Providing water supply for tankers to enable on-site watersupplies to be replenished.ASSESSMENT OF WASTEWATER SERVICESUrban areas of <strong>Hutt</strong> <strong>City</strong> are serviced by a reticulated wastewater system which is intendedto provide for the effective and reliable disposal of domestic and industrial wastewater fromresidential properties and the business community.The local wastewater reticulation to which each serviced property is connected comprisesa network of approximately 573km of relatively small diameter pipes (typically 150mmto 225mm in diameter). The local wastewater reticulation discharges into a system ofapproximately 104km of trunk sewers (ranging up to 1350mm in diameter) which conveywastewater to the treatment plant at Seaview.Most wastewater pipelines operate by gravity drainage (they run downhill) although thereare 44 pump stations which pump wastewater to higher levels when gravity drainage isnot practical.The trunk wastewater system services both <strong>Hutt</strong> <strong>City</strong> and Upper <strong>Hutt</strong> <strong>City</strong>. Wastewater fromreticulated areas of <strong>Hutt</strong> <strong>City</strong> and Upper <strong>Hutt</strong> <strong>City</strong> is treated at the Seaview WastewaterTreatment <strong>Plan</strong>t. An 18km long 1350mm diameter pressurised pipeline conveys disinfectedeffluent from the Seaview Treatment <strong>Plan</strong>t to an outfall at Pencarrow Head a short distancebeyond the eastern entrance to Wellington Harbour.A byproduct of the treatment process is biosolids which are the stabilised material extractedfrom the wastewater during the treatment process. The biosolids produced by the SeaviewTreatment <strong>Plan</strong>t are dried before being disposed of to landfill.
54 HUTT CITY LONG TERM PLAN <strong>2012</strong>-2022The flow through the treatment plant is approximately 54,000 cubic metres per day averagedover the entire year or approximately 45,000 cubic metres per day during dry weather.The following table summarises the characteristics of the untreated wastewater and of theeffluent from the Seaview Treatment <strong>Plan</strong>t.Key Issues and <strong>Hutt</strong> <strong>City</strong> <strong>Council</strong> ProposalsIssues associated with wastewater disposal from the different communities in <strong>Hutt</strong> <strong>City</strong>have been identified in terms of their potential to compromise the achievement of health andenvironmental aspects of community outcomes for <strong>Hutt</strong> <strong>City</strong>.CBOD 5(g/m 3 ) (Carbonaceous Biochemical OxygenDemand over 5 days – a measure of the potentialfor carbonaceous material in the wastewater todeplete levels of dissolved oxygen)Suspended solids (g/m 3 ) (A measure of the level offinely suspended material)Faecal coliforms (cfu/100ml) (A measure of levelsof bacteria originating from the gut of animalsincluding humans)* Average values over the 2010-2011 periodUNTREATEDWASTEWATER *TREATED EFFLUENTFROM TREATMENTPLANT *RESOURCECONSENT LIMIT FORTREATED EFFLUENT145 12 50177 17 501,000,000 226 1,000Wastewater from properties in rural areas of <strong>Hutt</strong> <strong>City</strong> is generally disposed of by means ofconventional septic tanks and on-site effluent disposal fields. Solids which accumulate inseptic tanks must be removed periodically and disposed of. A septic tank cleaning serviceis provided by several companies and usually involves pumping the contents of the septictank into a tanker for subsequent controlled disposal into the <strong>Hutt</strong> <strong>City</strong> wastewater system atspecified trade waste pre-treatment facilities.The adequacy of on-site disposal systems depends on their initial design and construction,the ability of effluent disposal fields to accommodate the volumes of effluent dischargedand the ongoing maintenance and operation of the systems. These factors vary betweenindividual systems.Environmental and health risks can be managed to acceptable levels in on-site wastewatersystems which are designed, constructed, operated and maintained to appropriate standards.There is no known history of significant health or environmental problems associated with theremaining private on-site wastewater systems in <strong>Hutt</strong> <strong>City</strong> although ongoing environmentalmonitoring is recommended.Future DemandAccording to Statistics New Zealand forecasts, population growth in <strong>Hutt</strong> <strong>City</strong> or Upper <strong>Hutt</strong><strong>City</strong> over the next 20 years is expected to be slow. Demand projections estimate no change,or a slight reduction in total wastewater volumes over the next 20 years, mainly as a resultof programmes to reduce the entry of stormwater into the wastewater system. There arestrategies in place to accommodate the additional wastewater that would be generated ifsignificant growth does occur.ISSUESeismic Vulnerability of WastewaterSystemThe 2010 and 2011 Canterbury earthquakesraised the profile of wastewater servicedisruption following a significant seismicevent. Earthquake hazard maps produced byGreater Wellington Regional <strong>Council</strong> indicatepotential slope failure, liquefaction, groundshaking, fault movement and tsunami hazards.The effect of these upon the wastewatersystem within <strong>Hutt</strong> <strong>City</strong> will depend greatlyon the precise seismic event that occurs.Disaster readiness and response plans willform the basis of a prioritised recovery effort.Future Effluent Disposal from the SeaviewTreatment <strong>Plan</strong>tThe Main Outfall Pipeline which conveyseffluent from the Seaview Treatment <strong>Plan</strong>t tothe outfall to the ocean at Pencarrow Headhas an estimated remaining life of the order of20 years. Either rehabilitation of the pipelineor an alternative means of effluent disposal(which could be a replacement pipeline) willbe necessary.Treated and disinfected effluent is dischargedat Pencarrow Head from an outfall locatednear the shoreline. The effects of the effluentdischarge are being monitored.HUTT CITY COUNCIL PROPOSALIt is proposed that <strong>Hutt</strong> <strong>City</strong><strong>Council</strong> further investigatesand assesses the vulnerabilityof mains and pump stations.It is proposed that <strong>Hutt</strong> <strong>City</strong><strong>Council</strong> continues detailedinvestigations into futureoptions for the renovationor replacement of the MainOutfall Pipeline.ASSOCIATED LTPPROJECT(S) OROPERATING PROJECT• Operatingproject• Trunk MainOutfall PipelineRenewal(2018/19 –2019/20 &2027/28)Knowledge of the system capacity may notbe as comprehensive as possible<strong>Hutt</strong> <strong>City</strong> <strong>Council</strong> and Capacity knowledge ofthe detailed wastewater system capacity (ona catchment basis) and potential future issues(e.g. derived from changes in population)may not be as comprehensive as possible. Atpresent wastewater hydraulic models do notexist across the entire city.It is proposed that <strong>Hutt</strong> <strong>City</strong><strong>Council</strong> develops a citywidewastewater model.• Operatingproject
HUTT CITY LONG TERM PLAN <strong>2012</strong>-202255ISSUEWet Weather Overloading of theWastewater SystemProblems are also experienced withoverloading of the wastewater system incertain areas of the city due to excessivestormwater entry to the wastewatersystem during heavy or prolonged rainfall.At other times the wastewater system inthese areas generally operates very well.Areas where high wet weather flows area particular problem include Wainuiomata,Stokes Valley, Naenae and to a lesser extentparts of Eastbourne, <strong>Hutt</strong> Central and theWestern Hills.On-Site Wastewater Disposal SystemsThe inadequate design, operation and/or maintenance of on-site wastewaterdisposal systems can lead to health andenvironmental problems.HUTT CITY COUNCIL PROPOSALIt is not possible for all areaswhere high wet weatherflows occur to be addressedsimultaneously. It is proposedthat a prioritised catchmentby catchment investigationand programme of worksbe developed identifyingindicative performancetargets, strategies,timeframes and costs foraddressing wet weatheroverloading in different partsof the city. It is also proposedthat investigations intosources of excessive wetweather wastewater flowscontinue as an input to acitywide wastewater overflowmanagement plan.It is proposed that <strong>Hutt</strong> <strong>City</strong><strong>Council</strong> completes populatingits database of on-sitewastewater disposal systemsin the city by June <strong>2012</strong>.It is proposed that this bealigned with a similar regionaldatabase being prepared byGreater Wellington Regional<strong>Council</strong>.It is further proposed that aprogramme to monitor healthand environmental effects ofon-site wastewater disposalin <strong>Hutt</strong> <strong>City</strong> be developedin conjunction with GreaterWellington Regional <strong>Council</strong>.ASSOCIATED LTPPROJECT(S) OROPERATING PROJECT• Operatingproject• OperatingprojectRoles of <strong>Hutt</strong> <strong>City</strong> <strong>Council</strong> – Public Wastewater System<strong>Hutt</strong> <strong>City</strong> <strong>Council</strong> is responsible for ensuring the public wastewater system is managed ina way which contributes towards the achievement of community outcomes for the city.This involves:• Setting standards to be achieved in the management of wastewater disposal.• Setting wastewater policy.• Public education on wastewater management issues.• Managing the interface with the community.• Monitoring the environmental effects of wastewater (and effluent) discharges.• Managing the interface with Upper <strong>Hutt</strong> <strong>City</strong> <strong>Council</strong> through the <strong>Hutt</strong> Valley ServicesCommittee.• Managing the interface with Capacity – the <strong>Hutt</strong> <strong>City</strong> <strong>Council</strong> and Wellington <strong>City</strong> <strong>Council</strong>jointly owned water management entity.• Approving budgets for the wastewater activity through the Annual <strong>Plan</strong> process.• Monitoring the performance of the wastewater activity.• Carrying out an assessment of wastewater management in <strong>Hutt</strong> <strong>City</strong> as required by theLocal Government Act 2002.Capacity is responsible to <strong>Hutt</strong> <strong>City</strong> <strong>Council</strong> for:• Making proposals on standards and policy.• Managing the wastewater system through the asset management plan process to achieverequired outcomes.• Ensuring risks are identified and managed within acceptable limits.• Managing the maintenance and operation of the wastewater system.• Developing and implementing programmes for the progressive replacement of parts of thewastewater system as they reach the end of their useful life.• Developing and implementing programmes to upgrade and extend the wastewater systemas required to meet future demand.• Ensuring new wastewater infrastructure is designed and constructed to required standards.• Monitoring performance as an input to the monitoring of the wastewater activity by <strong>Hutt</strong><strong>City</strong> <strong>Council</strong>.
56 HUTT CITY LONG TERM PLAN <strong>2012</strong>-2022Roles of <strong>Hutt</strong> <strong>City</strong> <strong>Council</strong> – Private Wastewater SystemsThe roles of <strong>Hutt</strong> <strong>City</strong> <strong>Council</strong> with respect to private wastewater systems reflect thatboth private and public wastewater systems contribute towards the achievement ofcommunity outcomes.• Advisory - Providing advice to property owners on risks associated with septic tanksystems and on the operation and management of septic tank systems.• Regulatory – Setting requirements for servicing of new developments including verifyingcompliance of new installations with required standards (normally AS/NZS 1547:2000).• Monitoring - Maintaining records of septic tank systems and monitoring health andenvironmental issues associated with groupings of these systems.• Assessments - Carrying out an assessment of groupings of private wastewater systemsas part of a wider assessment of wastewater management in <strong>Hutt</strong> <strong>City</strong> as required by theLocal Government Act 2002.• Possible Future Service Provider - Monitoring development in areas serviced by septic tanksand the performance of groupings of on-site wastewater systems to determine if and whenreticulated wastewater systems may be appropriate.ASSESSMENT OF STORMWATER SERVICESResidential properties and the business community in developed areas of <strong>Hutt</strong> <strong>City</strong> are servicedby a reticulated stormwater system comprising approximately 546km of stormwater pipes,11,600 manholes, 5 retention dams and 14 pump stations which convey stormwater to receivingwatercourses. The stormwater pipelines in the <strong>Hutt</strong> <strong>City</strong> system range in size from 100mm to1800mm in diameter with 65% of the pipes being between 225mm and 450mm in diameter.Greater Wellington Regional <strong>Council</strong> is responsible for managing major watercoursesthroughout the Wellington region including the <strong>Hutt</strong> River, the Wainuiomata River, theWaiwhetu Stream (from below Naenae) and the lower section of the Stokes Valley Stream.The majority of stormwater from <strong>Hutt</strong> <strong>City</strong> discharges into these watercourses.Most of the <strong>Hutt</strong> <strong>City</strong> stormwater reticulation operates by gravity drainage. This means that thepipes run downhill and are not intended to operate under pressure. The 14 stormwater pumpstations provide drainage from localised low lying areas when gravity drainage is not effective.Every stormwater pipe and channel has a finite capacity. Most of the stormwater pipelinesin <strong>Hutt</strong> <strong>City</strong> were designed to accommodate rainfall with a 20% chance of occurring annually(a 5 year average return period). It is not practical to provide stormwater drains that canaccommodate all foreseeable rainfall and the risk of blockages in stormwater systems cannotbe eliminated. Stormwater systems in “greenfields” developments are now required tocomprise both a primary system consisting of pipes and open channels intended to cater formore frequent rainfall events, and a secondary system to cater for higher intensity rainfallevents. The secondary system consists of overland flowpaths which convey floodwaterssafely when the primary system is unable to cope. New stormwater pipelines are nowdesigned to accommodate rainfall with an average return period between 10 years (10%chance of occurring annually) and 50 years (2% chance of occurring annually) depending on therisk in specific situations.It is expected that changing rainfall patterns will continue to be reflected in an increase in thefrequency of severe rainstorms which exceed the original design capacity of the stormwatersystem. Stormwater systems in <strong>Hutt</strong> <strong>City</strong> are now designed to accommodate more intenserainfall to reflect climate change.In rural areas of <strong>Hutt</strong> <strong>City</strong> stormwater runoff from roof areas is often diverted to storage tanksas a source of water for on-site water supply systems. Stormwater not used for water supplypurposes is generally disposed of to land or to watercourses.The quality of stormwater is highly variable. Stormwater runoff and in particular the “firstflush” of stormwater runoff following a dry period often contains many contaminants. Thesecan include sediments, oils, greases, metals and organic material washed from roads andother impervious areas together with rubbish and contaminants illegally discharged into thestormwater system. Contamination of stormwater can also arise from overflows from thewastewater system (generally due to wet weather overloading of the wastewater system –see wastewater assessment).Many contaminants entering the stormwater system are subsequently discharged towatercourses. There is expected to be a greater focus on the effects of stormwater dischargeson watercourses and on ways that these effects can practically be reduced.The quality of water at popular swimming beaches in the city is monitored. This monitoringindicates that beach water is usually of a good standard which is suitable for swimming,although water quality usually falls for a period following heavy rainfall.Future DemandDevelopment in the city is not expected to be of a scale which will substantially increasestormwater runoff overall although it may be significant in localised areas. The focus of futurestormwater management is likely to continue moving away from simply providing pipes toconvey stormwater and towards the development of an integrated range of measures tomanage the potentially adverse effects of stormwater runoff including flooding, environmentaldegradation and pollution.Key Issues and <strong>Hutt</strong> <strong>City</strong> <strong>Council</strong> ProposalsIssues associated with stormwater management in the different communities in <strong>Hutt</strong> <strong>City</strong>have been identified in terms of their potential to compromise the achievement of health andenvironmental aspects of <strong>Hutt</strong> <strong>City</strong> community outcomes.
HUTT CITY LONG TERM PLAN <strong>2012</strong>-202257ISSUEHUTT CITY COUNCIL PROPOSALASSOCIATED LTP PROJECT(S)OR OPERATING PROJECTISSUEHUTT CITY COUNCIL PROPOSALASSOCIATED LTP PROJECT(S)OR OPERATING PROJECTManaging Adverse Effectsof Stormwater RunoffFlooding due to overloading ofthe stormwater system.Climate change eroding thelevel of protection againstflooding provided by thestormwater system.Degradation of watercoursesdue to contaminatedstormwater runoff.Adequacy of Black CreekChannel – WainuiomataOvertopping of the BlackCreek Channel during severerainfall.Secondary FloodpathsLack of secondary flowpathsto convey floodwater safelywhen the primary stormwatersystem is blocked oroverloaded.<strong>Hutt</strong> <strong>City</strong> has adopted a range of measuresin response to these issues. Thesemeasures and additional measures whichmay be appropriate have been formalisedin a comprehensive stormwater plan for<strong>Hutt</strong> <strong>City</strong>.It is proposed that <strong>Hutt</strong> <strong>City</strong> <strong>Council</strong> adoptsand implements the stormwater plan for<strong>Hutt</strong> <strong>City</strong> setting out stormwater issuesand an integrated range of measures tomanage adverse effects of stormwaterrunoff to standards acceptable to thecommunity.In addition, <strong>Hutt</strong> <strong>City</strong> will continue toparticipate in development of GWRC“Regional Action <strong>Plan</strong> for StormwaterManagement” which focuses onenvironmental aspects of stormwatermanagement.<strong>Hutt</strong> <strong>City</strong> <strong>Council</strong> has undertaken a majorworks programme for upgrading the BlackCreek which will substantially decrease theflood risk associated with this channel. Thefinal stage to upgrade the capacity of BlackCreek was completed in 2011-<strong>2012</strong>.It is proposed to continue to requirethe provision of secondary stormwaterflowpaths in new (greenfields)developments to safely conveyfloodwater when the stormwater pipesare overloaded. Providing secondarystormwater flowpaths is often not possiblein well developed areas although theyare provided where they are reasonablypractical. The capacity provided innew pipes will reflect the adequacy ofsecondary flowpaths. The provisionof stormwater flowpaths has beenincorporated in the stormwater plan forthe city.• Operating project• Black Creek –Stage 3 (2011/12)• Operating projectObstruction of StormwaterOutlets on BeachesA build-up in beach levelsmay restrict the abilityof stormwater outlets todischarge.Overtopping andMaintenance of PrivateStreamsOverflows from privatestreams and accumulationof debris following severestorms.Stormwater Capacity inAreas of Stokes ValleyThe capacity of some of themain stormwater pipelineswhich convey stormwaterfrom areas of Stokes Valleyto the Stokes Valley Streamis less than desirable leadingto backing up and overflowingof stormwater drains duringsevere rainfall. The issue iscompounded by a lack ofsecondary flowpaths.State Highway 2Obstructing Overland Flowof FloodwaterThere are several lowlying areas between StateHighway 2 and the base ofthe Western Hills wherefloodwater may be trappedbehind the State Highway.It is proposed to conduct furtherinvestigations on affected outlets identifiedwith the highest risk and consult onpotential options. The preferred options willbe developed into a 20 year programme.The approach taken to stormwater outletshas been set out in the stormwater planfor the city.It is proposed to continue to investigatemeasures such as the provision ofsecondary stormwater flowpaths andthe provision of peak flow bypasses toreduce the flood risk associated withprivate streams. The practicality of thesemeasures must be determined on a caseby case basis. The management of privatewatercourses including responsibilities ofthe various parties will be considered ona case by case basis and defined in thestormwater plan for the city.The provision of new main stormwaterpipelines in areas where repeatedproblems have been experienced will beinvestigated as an option and included inthe stormwater plan for <strong>Hutt</strong> <strong>City</strong>.A detailed assessment of the level ofrisk in low lying areas between StateHighway 2 and the Western Hills has beencarried out and options to mitigate anysignificant risks identified. The proposedsolution to address the problem has beenprogrammed within the 10-20 year periodin the <strong>Long</strong> <strong>Term</strong> <strong>Plan</strong>.• Beach StormwaterOutlets (2016/17 &2020/21)• Operating project• Stokes ValleyCatchment FloodMitigation (2022/23– 2031/32)• Manuka St(<strong>2012</strong>/13)• SH2 – KorokoroCatchment FloodMitigation (2022/23– 2031/32)
58 HUTT CITY LONG TERM PLAN <strong>2012</strong>-2022ISSUEHUTT CITY COUNCIL PROPOSALASSOCIATED LTP PROJECT(S)OR OPERATING PROJECTISSUEHUTT CITY COUNCIL PROPOSALASSOCIATED LTP PROJECT(S)OR OPERATING PROJECTHigh Flood Water Levels inthe Awamutu StreamFlooding has beenexperienced due to highwater levels in the AwamutuStream.High Floodwater Levels inthe Waiwhetu StreamFlooding has beenexperienced due to highwater levels in the WaiwhetuStream.Flooding from the<strong>Hutt</strong> RiverThe <strong>Hutt</strong> River representsthe major flood risk to the<strong>Hutt</strong> Valley. Failure of the <strong>Hutt</strong>River flood defences wouldlead to major flooding in the<strong>Hutt</strong> Valley.The investigation is complete and aprogramme of works is proposed toaddress the issue, including a numberof culvert and channel improvements,removal of flow restrictions and theinstallation of flood gates and a pumpingstation.Greater Wellington Regional <strong>Council</strong>,which is responsible for the majority ofthe Waiwhetu Stream, has commencedinvestigations into the flood risk associatedwith the Waiwhetu Stream.It is proposed that <strong>Hutt</strong> <strong>City</strong> <strong>Council</strong>continue investigations into optionsbeyond the Waiwhetu Stream corridor formitigating the effects of high levels in theWaiwhetu Stream and that the outcomesof both investigations be incorporated intothe stormwater plan for <strong>Hutt</strong> <strong>City</strong>.The flood risk associated with the possiblefailure of the <strong>Hutt</strong> River flood defences isbeing addressed through a programmeof works being implemented by GreaterWellington Regional <strong>Council</strong>.• AwamutuStream (<strong>2012</strong>/13– 2019/2020 &2022/23 – 2023/24)• WaiwhetuCatchment(2022/23 – 2026/27)• <strong>Hutt</strong> RiverFloodplain (2013/14– 2018/19 &2022/23 – 2024/25)• Boulcott StopbankProject – HCCContribution(<strong>2012</strong>/13)• <strong>Hutt</strong> River BackflowElectrical (2013/14& 2015/16 &2017/18)Flooding in the <strong>Hutt</strong> RiverCoinciding with HeavyRainfall in the <strong>Hutt</strong> ValleyFloodgates on stormwateroutlets to the <strong>Hutt</strong> River willbe closed when the <strong>Hutt</strong>River is in flood. Stormwateris unable to discharge atthese times (except for somelocalised areas providedwith pumping stations). Thebackup of stormwater maybe significant and lead toflooding if there is heavyrainfall in the <strong>Hutt</strong> Valley whenthe outlets are closed.Overland Flows in RuralAreasProblems have beenexperienced with overlandflows of floodwater resultingfrom the overtopping ofthe Wainuiomata River andassociated tributaries.It is proposed that an assessment of risksassociated with the closure of floodgatespreventing stormwater outflow be carriedout as basis for establishment of definedcriteria/policy on backflow protection andthat the outcome be incorporated into thestormwater plan for <strong>Hutt</strong> <strong>City</strong>.Investigations into measures to alleviatethis problem have identified a combinationof remedial measures which are beingimplemented. During heavy rainfallstormwater runoff in rural areas willfollow natural flowpaths which mayinclude overland flows. It is proposedthat flowpaths in rural areas duringsevere rainfall be required to be identifiedand documented on plans as part ofdevelopment proposals. This will assist thedetermination of measures necessary toensure that acceptable levels of protectionagainst the flooding of buildings areachieved.• <strong>Hutt</strong> RiverStormwaterFlapgates /Pumping Stations(2015/16 &2022/23 – 2031/32)• Melling Road PumpStation (2018/19 –2019/2020)• Operating projectBackflows from the<strong>Hutt</strong> RiverA backflow of the <strong>Hutt</strong> Riverup the stormwater systemcould cause significantflooding.Additional backflow protection has beenprovided on several critical stormwateroutlets to the <strong>Hutt</strong> River. It is proposedthat an assessment of risks associatedwith the possibility of backflows throughstormwater drains be carried out as abasis for establishment of defined criteria/policy on backflow protection and thatthe outcome is incorporated into thestormwater plan for <strong>Hutt</strong> <strong>City</strong>.• <strong>Hutt</strong> RiverStormwaterFlapgates /Pumping Stations(2015/16 & 2022/23– 2031/32)
HUTT CITY LONG TERM PLAN <strong>2012</strong>-202259Roles of <strong>Hutt</strong> <strong>City</strong> <strong>Council</strong> – Stormwater Management<strong>Hutt</strong> <strong>City</strong> <strong>Council</strong> is responsible for ensuring that the effects of stormwater runoff aremanaged in a way which contributes towards the achievement of community outcomes forthe city. This involves:• Setting standards to be achieved in the management of stormwater runoff.• Setting the stormwater policy.• Public education on stormwater management issues.• Managing the interface with the community.• Monitoring the environmental effects (such as stream health) of stormwater runoff.• Regulating surface water drainage from new buildings in terms of the New Zealand Building Code.• Providing advice on stormwater management.• Managing the interface with Capacity – the <strong>Hutt</strong> <strong>City</strong> <strong>Council</strong> and Wellington <strong>City</strong> <strong>Council</strong>jointly owned water management entity.• Approving budgets for the stormwater activity through the Annual <strong>Plan</strong> process.• Monitoring the performance of the stormwater activity.• Carrying out an assessment of stormwater management in <strong>Hutt</strong> <strong>City</strong> as required by theLocal Government Act 2002.Capacity is responsible to <strong>Hutt</strong> <strong>City</strong> <strong>Council</strong> for:• Making proposals on standards and policy.• Managing the stormwater runoff through the asset management plan process to achieverequired outcomes.• Ensuring risks are identified and managed within acceptable limits.• Managing the maintenance and operation of the stormwater system.• Developing and implementing programmes for the progressive replacement of thestormwater system.• Developing and implementing programmes to upgrade and extend the stormwater systemas required to meet required standards.• Ensuring new stormwater infrastructure is designed and constructed to required standards.• Monitoring performance as an input to the monitoring of the stormwater activity by <strong>Hutt</strong><strong>City</strong> <strong>Council</strong>.STORMWATER PLAN<strong>Council</strong> has developed a stormwater plan that sets out the principal stormwater issues facing<strong>Hutt</strong> <strong>City</strong>, and outlines the actions <strong>Council</strong> and Capacity are undertaking or intend to undertaketo manage these issues now and in the future.Most of the actions are wholly or partially in place at present, reflecting the longstandinginvestment and expertise that <strong>Hutt</strong> <strong>City</strong> <strong>Council</strong> and Capacity have put into stormwatermanagement over the years.The plan identifies 12 actions that are currently in progress and a further five actions that areproposed. The actions have been prioritised with the intention that they will be progressed inthis priority order over the next five years by <strong>Hutt</strong> <strong>City</strong> <strong>Council</strong> and Capacity.PRIORITYRANKING ACTION STATUSHIGH PRIORITY1 Require all consent applications for buildings in flood extent areas (as denoted Proposedby the district plan) to specify a proposed level of protection against flooding.2 Set appropriate easements or Consent Notices with regard to over-land Proposedflow paths, building set-backs or minimum building floor levels for newsubdivisions where necessary.3 Identify and undertake flood improvements in the Awamutu, Black Creek, and In ProgressOpahu streams.4 Carry out assessment of options for capital works to ensure the most cost In Progresseffective option is selected.5 Provide information to the community on reducing stormwaterIn Progresscontamination.6 Carry out a risk assessment of all stormwater intakes as a basis forIn Progressdetermining the need for upgrading.MEDIUM PRIORITY7 Produce information material for owners with watercourses passingProposedthrough their property setting out obligations and restrictions relating to thewatercourses.8 Inspection and maintenance programmes for stormwater intakes to reflect In Progressthe likelihood and consequence of blockage.9 Adopt a risk based approach to determining the capacity to be provided in In Progressnew or replacement stormwater drains with the capacity to accommodatestormwater from storms with an average recurrence interval (ARI) of between10 years and 50 years being provided to reflect the flood risk in each situation.9 Low Impact Urban Design and Development (“LIUDD”) options areProposedinvestigated and, where appropriate, incorporated into relevant planningdocuments.10 Inform property owners that in the event of a storm sump tops may beblocked by debris, creating a flood risk. Owners can assist in reducing theflood risk by keeping sump tops in the vicinity of their property clear duringsevere rainfall.Proposed
60 HUTT CITY LONG TERM PLAN <strong>2012</strong>-2022PRIORITYRANKING ACTION STATUS11 Carry out flood risk assessments in areas where insufficient capacity in major In Progressdrains has been identified.LOW PRIORITY12 Provide secondary floodgates on selected stormwater outlets where the In Progressconsequences of flap gate failure have been assessed as severe.13 Risks associated with adequacy of secondary stormwater flowpaths will In Progressbe taken into account in determining the capacity provided in primarystormwater drains when they are replaced or upgraded.14 Carry out a risk assessment of watercourses that may be subject toIn Progressovertopping with remedial measures (if necessary) on a case by case basis.15 Provide secondary stormwater discharge points on selected beach outlets. In ProgressThe stormwater plan is expected to be finalised by the end of August <strong>2012</strong>.As part of the consultation on the 2011 annual plan, requests were made for improved toiletfacilities to be provided in Wainuiomata. As a result we conducted an assessment of publictoilet services later in 2011.This recent assessment of public toilet services indicates that overall, with the possibleexception of Wainuiomata, the current provision of public toilets is adequate. There arecurrently no signs of overuse of <strong>Council</strong> owned toilets, and we have systems in place to attendto any issues that pose a risk to public health as a priority.Looking to the future, the assessment of future demand indicates that the current location andcapacity of facilities is adequate for current and future demand over the short to medium term.<strong>Council</strong> proposes that the future proceeds to be realised from the sale of a residential propertythat forms part of Hugh Sinclair Park in Wainuiomata will be used to construct public toilets atthat park.ASSESSMENT OF PUBLIC TOILET SERVICES<strong>Council</strong>s are not legally required to provide public toilets, however, <strong>Hutt</strong> <strong>City</strong> <strong>Council</strong> alongwith most other councils does provide this service to the community. We own or operatetoilets that are available to the public on a daily basis, with three of these open during summermonths only. Additional toilets are provided for users of public facilities such as sportsgrounds, swimming pools, libraries and museums. Private organisations also provide toilets tothe public and to customers. There is also one private wastewater disposal site for caravans/campervans in <strong>Hutt</strong> <strong>City</strong> and another located at Ngauranga Gorge. All of these facilities areconsidered when assessing the level of provision of public toilet services in the city.We manage and maintain our public toilet assets, undertake upgrades, renewals and additionalfacilities as demand requires. Contracts are in place for regular maintenance, security andcleaning of toilets.Our assessment of public toilet services considers issues relating to public health andprovision of public toilets by analysing population, visitor projections, customer satisfactionsurvey results, requests for service from members of the public, and input from staff.The population of <strong>Hutt</strong> <strong>City</strong> is expected to increase only slightly between 2011 (103,530)and 2016 (104,710), then continue to increase only slightly to 2031 (105,150), with visitorprojections expected to rise over the next five years.Feedback on the quality of our public toilet services has been obtained from the public throughsurveys and service request records, and from <strong>Council</strong> staff and contractors with knowledgeof the facilities. Operational, maintenance and upgrading works are programmed to addressany service deficiencies identified. Our annual NRB Communitrak Survey shows that, for theperiod 2001 to 2011, residents’ satisfaction levels with public toilets has increased by 16%.The level of dissatisfaction has decreased by 13% over the same period.
62 HUTT CITY LONG TERM PLAN <strong>2012</strong>-2022OUR COMMUNITY GOALSIn our 2011-<strong>2012</strong> annual plan we consulted on the high level goals or outcomes we’d like toachieve for the city’s wellbeing, and they’re listed here.A safe communityWe live in a safe city, free from crime and injury. Our city is prepared for emergencies.A strong and diverse economyA city that grows existing businesses and attracts new business activity, with a focus onthe research and development sector. All members of our community benefit from a strongeconomy, and we attract increasing numbers of visitors.An accessible and connected cityA city that is easy to move about with well-designed roads, cycleways and footpaths.Members of our community are connected to the digital world.Healthy peopleWe live healthy lives, and our city’s services help to protect our health and our environment.A healthy natural environmentWe value and protect the natural environment and promote a sustainable city. Resources areused efficiently and there is minimal waste and pollution.Actively engaged in community activitiesMembers of our community participate in arts, cultural, sports and other recreational andleisure activities. The city provides for and encourages participation in these activities.Strong and inclusive communitiesPeople feel a sense of belonging and are included in the community. Our city is built on strongcommunities that value diversity and support newcomers.A healthy and attractive built environmentOur built environment enhances our quality of life. Our city is vibrant, attractive, healthy andwell-designed. We promote development that is sustainable, and that values and protects ourbuilt heritage and the natural environment.A well-governed cityAll members of our community are empowered to participate in decision-making and tocontribute to society. Their values and ideas are reflected in the decisions <strong>Council</strong> makes.To help us achieve these outcomes, we’ve divided our organisation into groups andkey activities:1. Group People is responsible for Libraries, Museums, Aquatics and Recreation, Parksand Reserves and Community Development.2. Group Utility Services is responsible for Roading and Traffic, Water Supply, Wastewater,Stormwater, and Solid Waste.3. Group Environment is responsible for Environmental Management andEmergency Management.4. Group Economy is responsible for Local Urban Environment and Economic Development.5. Group Organisation is responsible for Elected Members, Advice and Support, andManaging Services.
HUTT CITY LONG TERM PLAN <strong>2012</strong>-202263The table below shows which of our activities primarily contribute to our goals or outcomes.A SAFE COMMUNITYA STRONG ANDDIVERSE ECONOMYAN ACCESSIBLE ANDCONNECTED CITYHEALTHY PEOPLEA HEALTHY NATURALENVIRONMENTACTIVELY ENGAGEDIN COMMUNITYACTIVITIESSTRONG ANDINCLUSIVECOMMUNITIESA HEALTHY ANDATTRACTIVE BUILTENVIRONMENTLibraries • • • • • •A WELL-GOVERNED CITYFor each outcome we’ve developed indicators that will show whether we’re making progresstowards achieving the outcomes. The following pages outline the indicators for each outcomearea, the measures and any targets proposed. A number of targets are being developed duringthe first half of <strong>2012</strong> alongside the collection of data covering the last three years. These targetswill be included in the final <strong>Long</strong> <strong>Term</strong> <strong>Plan</strong>. The following pages also outline the rationale forusing each indicator and the activities within <strong>Council</strong> that contribute to the outcome.We’ll be reporting against these indicators in each of our annual reports, starting with theannual report for the year ending 30 June <strong>2012</strong>.Museums • • • •Aquatics & Recreation • • • •Parks & Reserves • • • •Community Development • • • • •Roading & Traffic • • • • •Water Supply • • • • •Wastewater • • • • •Stormwater • • • • • √ • •Solid Waste • •Environmental Management • • • • • •Emergency Management • •Local Urban Environment • • • • • • • • •Economic Development • • •Elected Members • • • • • • • • •Advice & Support • • • • • • • • •Managing Services • • • • • • • • •
64 HUTT CITY LONG TERM PLAN <strong>2012</strong>-20221. OUTCOME: A SAFE COMMUNITYWe live in a safe city, free from crime and injury. Our city is prepared for emergencies.Outcome indicatorsINDICATOR MEASURE TARGET RATIONALE ACTIVITY1.1 Crime Total recorded criminal offences (andresolution rate)1.2 Safe places Residents’ perception of safety in localneighbourhood (day/night)1.3 Safe places Residents’ perception of safety in centralcity (day/night)Reducing trend over five years(increasing trend over five years)Day: 95%Night: 80%Day: 95%Night: 60%Level of criminal activity and resolution rates are key measures in HCC’s SafePublic Places Action <strong>Plan</strong>.Perceptions of safety are inexorably linked to actual crime. Strong link to theoutcome and fits <strong>Council</strong>’s responsibilities for public areas.Perceptions of safety are inexorably linked to actual crime. Strong link to theoutcome and fits <strong>Council</strong>’s responsibilities for public areas.CommunityDevelopmentCommunityDevelopmentCommunityDevelopment1.4 Safe places Residents’ satisfaction with street lighting 87% Strongly associated with perceptions of safety after dark. Roading and Traffic1.5 Safe places Number of buildings on the earthquakepronebuildings register1.6 Emergencymanagement1.7 AlcoholsafetyPercentage of households withemergency survival items (torches, firstaid items, food and water, etc)Number of managers licences broughtbefore the Liquor Licensing Authority1.8 Dog control Number of reported dog attacks (including`rushes’) on people1.9 Dog control Number of animal education initiatives inschools and communities, and estimatednumber of attendees1.10 Road safety Number of road crashes resulting in aninjury1.11 Road safety Number of road crashes resulting in aninjury to cyclists and pedestrians1.12 Road safety Road Condition Index (measuring roadsurface condition)Target to be developedStrong link to outcome. Currently missing from <strong>Council</strong> reporting. Needs to besupported by contextual information on number of buildings added to/removedfrom the register, and the reasons for this (eg, buildings strengthened,demolished or legislative change).60% More clearly defined and relates to what Civil Defence and EmergencyManagement advise.Reducing trend over five yearsIn absence of data on criminal offending or alcohol related harm associatedwith licensed premises, this is the closest measure of the outcome.EnvironmentalManagementEmergencyManagementEnvironmentalManagementReducing trend over five years Reducing the number of dog attacks is a key outcome of this area of activity. EnvironmentalManagementN/AReducing trend over 10 yearsReducing trend over 10 yearsHold or improve ratingIncluded as a measure of improved understanding and responsibility relatingto dog ownership.Good overall summary indicator, consistently reported by other councils. Stronglinks to Safe <strong>Hutt</strong> Valley Strategic <strong>Plan</strong> and Safer Journeys (NZ’s Road SafetyStrategy 2010-2020).Actions to reduce injury to cyclists and pedestrians are closely linked to landuseplanning and the road network (ie, <strong>Council</strong> responsibilities). Also good linkswith <strong>Council</strong>’s Cycling Strategy, Walking Strategy, and priorities identified in theSafe <strong>Hutt</strong> Valley Strategic <strong>Plan</strong> and Safer Journeys.Good measure of the <strong>Council</strong>’s activity in asset maintenance, based on `hard’data and easily understood. The index relates to safety.EnvironmentalManagementRoading and TrafficRoading and TrafficRoading and Traffic
HUTT CITY LONG TERM PLAN <strong>2012</strong>-2022652. OUTCOME: A STRONG AND DIVERSE ECONOMYA city that grows existing businesses and attracts new business activity, with a focus on the research and development sector. All members of our community benefit from a strong economy,and we attract increasing numbers of visitors.Outcome indicatorsINDICATOR MEASURE TARGET RATIONALE ACTIVITY2.1 Economy GDP (per capita) $44,830 by 2014;$47,350 by 20192.2 Economy Value of commercial and residentialbuilding consents2.3 Localbusinesses2.4 LocalbusinessesNumber of businesses 10,355 by 2014;11,101 by 2019Closely correlated with economic activity, growth and standard of living. Also ameasure in the Economic Development Strategy (EDS).EconomicDevelopmentN/A Indicator of economic activity and related to <strong>Council</strong> activity/services. EnvironmentalManagementBaseline measure of local business activity. Also a measure in the EDS.EconomicDevelopmentNumber of businesses in high-tech sector N/A Fits HCC focus on research and development sector. EconomicDevelopment2.5 Employment Number of employees 47,624 by 2014;51,053 by 20192.6 Employment Number of employees (FTEs) inhigh-tech sectorEmployment is a strong measure of income and ability to meet basic needs,and economic activity. Also a measure in the EDS.EconomicDevelopmentTarget under consideration Fits HCC focus on research and development sector. EconomicDevelopment2.7 Employment Unemployment rate N/A Levels of unemployment are strongly related to economic growth anddevelopment. Unemployment also linked to poor social outcomes (eg, health,criminal justice).2.8 Employment Number of people (aged 18-64) receivingunemployment benefit2.9 Income Median weekly household income andmedian weekly personal income2.10 Visitors Accommodation occupancy rates andguest nights2.11 MuseumvisitorsNumber of museum visitors from outsideLower <strong>Hutt</strong>2.12 Major events Number of events funded from the MajorEvents Fund and estimated number ofattendeesN/AN/ATargets to be developedProxy for the number of unemployed that is available more frequently thanunemployment rate.Key indicator of wellbeing as income is a strong determinant of health andeducation outcomes.Valid indicator of the number of visitors and of the performance of localaccommodation businesses. Useful for <strong>Council</strong> to know so can work withoperators to improve.EconomicDevelopmentEconomicDevelopmentEconomicDevelopmentEconomicDevelopmentTarget to be developed Key goal (particularly of the Dowse) is to attract visitors to <strong>Hutt</strong> <strong>City</strong>. Museums8;80,000Key area of Leisure Active’s work, linked to economic benefit of events for<strong>Hutt</strong> <strong>City</strong>.Aquatics andRecreation
66 HUTT CITY LONG TERM PLAN <strong>2012</strong>-20223. OUTCOME: AN ACCESSIBLE AND CONNECTED CITYA city that is easy to move about with well-designed roads, cycleways and footpaths. Members of our community are connected to the digital world.Outcome indicatorsINDICATOR MEASURE TARGET RATIONALE ACTIVITY3.1 Transportnetwork3.2 Transportnetwork3.3 Transportnetwork3.4 PublictransportResidents’ satisfaction with the city’sroads and footpathsResidents’ satisfaction with the city’sprovisions for traffic control and parkingRoads: 74%Footpaths: 81%Traffic control:82%Parking: 78%Length of cycleway (km) 50km by 2013;80km by 2018Number of public transport boardings(per capita)3.6 Digital world Number of hours of free public internetaccess available through public libraries80.3 by 2013;87.6 by 2018Good overall measure linked to accessibility and to <strong>Council</strong>’s activity inthis area.Good overall measure linked to accessibility and to <strong>Council</strong>’s activity inthis area.Good overall measure linked to making the city more accessible, andto <strong>Council</strong>’s activity in this area and the Environmental SustainabilityStrategy (ESS).Good overall measure linked to making the city more accessible. Fits with<strong>Council</strong> role in managing the city’s roading network and improving traffic flows.Links to measure in the ESS.3,000,000 hours per annum Supports National Digital Strategy and bringing new types of usersinto libraries.Roading and TrafficRoading and TrafficRoading and TrafficLocal UrbanEnvironmentLibraries4. OUTCOME: HEALTHY PEOPLEWe live healthy lives, and our city’s services help to protect our health and our environment.Outcome indicatorsINDICATOR MEASURE TARGET RATIONALE ACTIVITY4.1 Food safety Number of notifications of food and waterbornediseases4.2 Water quality Water quality at main recreational beaches 90% of samples meet Ministryfor the Environment guidelines4.3 Water quality Quality of drinking water Maintain at least a `b’ grading(`satisfactory, very low level ofrisk’) across all distribution zones4.4 Water quality Residents’ satisfaction with the city watersupplyN/A Closely linked to people’s health. EnvironmentalManagementStrong fit with outcome.Strong fit with outcome.95% People’s perception of water quality is closely associated with perceptionsabout their health and the health of the natural environment.StormwaterWater SupplyWater Supply
HUTT CITY LONG TERM PLAN <strong>2012</strong>-2022675. OUTCOME: A HEALTHY NATURAL ENVIRONMENTWe value and protect the natural environment and promote a sustainable city. Resources are used efficiently and there is minimal waste and pollution.Outcome indicatorsINDICATOR MEASURE TARGET RATIONALE ACTIVITY5.1 Parks andreservesArea of natural parks and reserves (per1000 residents)5.2 Solid waste Amount (tonnes) of waste to landfill(per $GDP)5.3 Recycling Amount (kilograms) of residentialrecycling (per capita)5.4 FreshwaterqualityBiological health of rivers(macroinvertebrates)5.5 Water use Total (residential and commercial) wateruse (per capita)5.6 BuildingconsentsNumber of consents granted for solarpanelsN/A33 tonnes by 2013;32 tonnes by 201880kg per capita by 2013;105kg per capita by 2018Maintain at least a `good’ ratingacross all sampling sitesSimple, understandable measure of space provision and commonacross a number of councils. Breakdown by `maintained’ and `natural’is more meaningful.Amount/volume of waste is strongest fit with the outcome. ESS is amount per$ GDP. Amount per capita is more readily understood.Amount/volume of recyclables is strongest fit with the outcome.Strong link to outcome. Reliable measure that is readily understood. Report onsix sample sites across three rivers (ESS reports on two rivers).Reducing trend over five years Strong fit with outcome and ESS. Target modified from static target of
68 HUTT CITY LONG TERM PLAN <strong>2012</strong>-20226. OUTCOME: ACTIVELY ENGAGED IN COMMUNITY ACTIVITIESMembers of our community participate in arts, cultural, sports and other recreational and leisure activities. The city provides for and encourages participation in these activities.Outcome indicatorsINDICATOR MEASURE TARGET RATIONALE ACTIVITY6.1 Swimmingpools6.2 Swimmingpools6.3 Recreationalprogrammes6.4 Recreationalprogrammes6.5 Physicallyactive6.6 Museumvisitors6.7 Museumvisitors6.8 Museumexhibitionsandprogrammes6.9 Museumexhibitionsandprogrammes6.10 Museumexhibitionsandprogrammes6.11 Parks andreservesprovision6.12 Parks andreservesprovision6.13 Parks andreserves use6.14 Parks andreservessatisfactionNumber of visits to <strong>Council</strong> swimmingpools (per capita)Residents’ satisfaction with <strong>Council</strong>swimming poolsEstimated number of attendances atrecreational activity programmesUser satisfaction with Leisure Activerecreational programmes or eventsPercentage of residents who arephysically active for 5 days a week8.2 Robust measure of overall use of pools. Aquatics andRecreation93% Good overall measure of social worth of pools and value as seen by thecommunity.200,000 Considerable area of Leisure Active’s work that is not currently captured andlinks well to outcome.92% Data from residents’ survey is limited in this respect (only 25% of households(125 households) had taken part in a recreation programme in the previous12 months). Preference would be to base it on a survey of a sample of users.55% Good state of the environment indicator around broader impact of<strong>Council</strong>’s activities.Number of museum visits 200,000 Considered a useful measure as it enables the tracking of trends in visitornumbers, especially to determine which exhibitions have been popular.Visitor satisfaction with the Dowse Target to be developed More relevant measure than resident satisfaction as captures people that haveactually visited museums.Percentage of the art collection displayed N/A Key area of activity, not currently reported. This information is often requestedby the public and <strong>Council</strong>lors.Number of new exhibitions held at theDowse and Petone Settlers MuseumNumber of participants on school andcommunity education programmes (andsatisfaction)N/AKey area of activity, not currently reported. Also useful as a way ofcommunicating to the public what our museums offer.Aquatics andRecreationAquatics andRecreationAquatics andRecreationAquatics andRecreationMuseumsMuseumsMuseumsMuseums11,000 participants (90%) Educational programmes are a key area of activity for museums. MuseumsArea of sports park (per 1000 residents) N/A Simple, understandable measure of space provision and common across anumber of councils.Households within 600 metres of anoutdoor play spacePercentage of households that have usedor visited parks, reserves or gardens in theprevious 12 months90% Simple, understandable measure of how accessible play spaces are for youngchildren. For children’s play spaces, location is a key aspect of accessibility asmany users walk to these spaces.Parks and ReservesParks and Reserves89% Simple, understandable baseline measure of use. Parks and ReservesResidents’ satisfaction with sportsgrounds 95% Considered one of the more useful indicators in the current set. Useful as abenchmark against other councils.Parks and Reserves
HUTT CITY LONG TERM PLAN <strong>2012</strong>-2022697. OUTCOME: STRONG AND INCLUSIVE COMMUNITIESPeople feel a sense of belonging and are included in the community. Our city is built on strong communities that value diversity and support newcomers.Outcome indicatorsINDICATOR MEASURE TARGET RATIONALE ACTIVITY7.1 Libraryvisitors7.2 Libraryvisitors7.3 Libraryvisitors7.4 LibraryservicesNumber of new library members N/A Easy measure for collecting something on active membership - other potentialindicators do not account for inactive members and are of limited value.Number of physical visits (per capita) 13 per annum Considered very useful as the measure of physical visits. Measuring visits ‘percapita’ means it is readily understood, sensitive to population change and canbe benchmarked against other councils.Number of visits via Libraries Online 275,000 Useful to report these virtual visits in addition to the physical visits. LibrariesNumber of items issued, renewed andreservedLibrariesLibrariesN/A Precise measures of the volume of library transactions. Libraries7.5 Library stock Turnover of library stock national mean Good indicator of whether library stock is meeting the needs of the community. Libraries7.6 Libraryprogrammes7.7 Supportprogrammes7.8 Sense ofcommunityNumber of participants at libraryprogrammes and eventsCommunity organisations’ satisfactionwith the availability and quality of oursupport, advice and fundingResidents’ perceptions that they feel asense of community with others in theirlocal neighbourhood7.9 Visitors Number of visits to the i-SITE(international, national, regional, local) andrevenue generated from sales7.10 Visitors Number of visits to the i-SITE website(www.huttvalleynz.com)7.11 Housing Number of <strong>Council</strong> rental housing unitsby type7.12 Housing <strong>Council</strong> housing tenants’ satisfaction withcondition of accommodation7.13 Public hallsand venues7.14 Public hallsand venuesUsers’ experience in using public halls(rating)N/AConsiderable area of library activity that is not currently captured and links wellto outcome.90% Direct feedback from organisations that have had engagement with the<strong>Council</strong>.60% Useful headline indicator for a range of community support activities, and welllinked to outcome.Target to be developedTarget to be developed210 housing units by 2013<strong>Council</strong>’s main visitor services are delivered through the i-SITE and these aregood indicators of performance of i-SITE marketing - so connected to what<strong>Council</strong> does in this area. Linked to this outcome because of role of the i-SITEin providing a service to the local community.<strong>Council</strong>’s main visitor services are delivered through the i-SITE and these aregood indicators of performance of i-SITE marketing - so connected to what<strong>Council</strong> does in this area. Linked to this outcome because of role of the i-SITEin providing a service to the local community.A key aim of UrbanPlus is to increase the number of rental properties availableto tenants, but this is not currently reported on. A key aim is to also improvethe appropriateness of the type of units (eg, bedsits, one bedroom, twobedroom, three+ bedroom). Not yet sure of what the most appropriate mixof unit types is, so this measure will need to be supported by a qualitativeassessment of the appropriateness.90% `Satisfaction’ is always high because not a lot of choice for tenants; butspecifying it is about the condition of their accommodation adds a qualityaspect that is likely to get a more useful response.93% `Users’ satisfaction with halls is more relevant than current measure ofresidents’ satisfaction where 32% respond `Don’t Know/Unable to say’.LibrariesCommunityDevelopmentCommunityDevelopmentEconomicDevelopmentEconomicDevelopmentUrbanPlus CCOUrbanPlus CCOAquatics andRecreationNumber of hours public halls booked 30,000 hours Good measure of overall `use’. Aquatics andRecreation
70 HUTT CITY LONG TERM PLAN <strong>2012</strong>-20228. OUTCOME: A HEALTHY AND ATTRACTIVE BUILT ENVIRONMENTOur built environment enhances our quality of life. Our city is vibrant, attractive, healthy and well-designed. We promote development that is sustainable, and that values and protects our builtheritage and the natural environment.Outcome indicatorsINDICATOR MEASURE TARGET RATIONALE ACTIVITY8.1 Land usedensity8.2 Land usedensity8.3 Amenityvalue8.4 Amenityvalue8.5 Sense ofpride8.6 Parks andreserves8.7 Parks andreserves8.8 HeritageprotectionPopulation density (per hectare): total landarea; residential activity areaDwelling density (per hectare) inresidential activity areaN/AN/ALinked to a key Anticipated Environmental Result (AER) in the District <strong>Plan</strong> (DP)to contain the urban area and provide for higher densities.Linked to a key AER in the DP to contain the urban area and provide for higherdensities.Number of noise complaints received Target to be developed Linked to a key AER in the DP relating to amenity value. Noise can have asignificant adverse effect on the environment, and on the city’s amenity value.Number of times formal enforcementaction was taken under the RMAResidents feel a sense of pride in the waythe city looks and feelsArea of maintained parks and reserves(per 1000 residents)Residents’ satisfaction with parks,reserves and gardensNumber of listed protected heritageitems: buildings; trees; cultural sites;archaeological sitesTarget to be developedNon-compliance with resource consent conditions may have an adverseeffect on the city’s environment. Fewer instances of non-compliance likely tocontribute to better environmental outcomes.EnvironmentalManagementEnvironmentalManagementEnvironmentalManagementEnvironmentalManagementIncreasing trend over five years Closely connected to the city’s amenity value which is a key AER in the DP. Local UrbanEnvironmentN/ASimple, understandable measure of space provision and common acrossa number of councils. Breakdown by `maintained’ and `natural’ is moremeaningful, each contributing to a different outcome.95% Useful as a benchmark against other councils. Critical factor in liveability,closely linked to quality of life, and to the `live’ and `play’ aspects of HCC’svision.N/ALinked to a number of AERs in the DP concerning protection of trees andheritage, cultural and archaeological resources. Provides for an overall measureof the extent of protected resources that is easily understood. Needs to besupported by contextual information that explains any change (eg, number ofheritage buildings demolished or added to the list).Parks and ReservesParks and ReservesEnvironmentalManagement
HUTT CITY LONG TERM PLAN <strong>2012</strong>-2022719. OUTCOME: A WELL-GOVERNED CITYAll members of our community are empowered to participate in decision-making and to contribute to society. Their values and ideas are reflected in the decisions <strong>Council</strong> makes.Outcome indicatorsINDICATOR MEASURE TARGET RATIONALE ACTIVITY9.1 Democraticprocesses9.2 Democraticprocesses9.3 Democraticprocesses9.4 Governanceand decisionmaking9.5 Governanceand decisionmakingResidents’ satisfaction with the <strong>Council</strong>’sconsultation and engagementPercentage of voter turnout at <strong>Council</strong>electionsResidents’ perceptions of their extent ofinfluence on the decisions the <strong>Council</strong>makesPercentage of residents who understandhow the <strong>Council</strong> makes decisionsPercentage of residents who are confidentthat the <strong>Council</strong> makes decisions in thebest interest of the cityImprovementConsultation is one of the key ways for the community to input their views ondecision-making. Consultation and engagement is also key to public relations.N/A Elections are one of the key democratic processes of <strong>Council</strong>. Turnout in 2007was 41% and 40% in 2010.Target to be developedTarget to be developedTarget to be developedConsultation is one of the key ways for the community to input their views,and it is important that decisions are influenced by these views. In 2008, 63%thought they had ‘some’ or ‘large’ influence.Understanding of how decisions are made increases the transparency of thedecision-making process. In 2008, 33% said they understood how the <strong>Council</strong>makes decisions.Confidence in decision-making is a reflection of the quality of the informationand advice, and the logistical support, provided to <strong>Council</strong> and communityboards/committees. In 2008, 46% said they were confident.Advice and SupportElected MembersAdvice and SupportAdvice and SupportElected Members
HUTT CITY LONG TERM PLAN <strong>2012</strong>-202273ACHIEVING OUR GOALS<strong>Council</strong> management, through its Strategic Leadership Team, has identified four priority areasfor the organisation:PRIORITY AREAServicesGrowth/EnvironmentStaffORGANISATIONAL OBJECTIVESDelivering great customer experiencesLeading a future-focused cityAchieving results through our great staffCUSTOMER SATISFACTIONWe monitor customer satisfaction levels through an independent annual survey and have atarget of achieving 90% satisfaction. We’ve achieved steady results that are above the averageof our peer councils, and we’re committed to continuing to improve.Customer SatisfactionWe’ve developed five key performance indicators for these areas, which are additional to theperformance measures and targets for each of our 17 key activities.BUDGET MANAGEMENTThis key performance indicator compares our results with the budget. All activities areexpected to operate within their net capital and operating budgets. We’ve delivered operatingand capital surpluses compared with budget every year since 1998, but in 2010-2011 had anegative operating result compared to budget for the first time.100%90%80%70%Best practisePeer average60%1995 1996 1997 1998 1999 2000 2001 2002 2003 2004 2005 2006 2007 2008 2009 2010 2011Budget Managementvariance $m +fav/-unfav1086320-2-4-61998 1999 2000 2001 2002 2003 2004 2005 2006 2007 2008 2009 2010 2011OperatingCapitalSTAFF PERCEPTIONSWe measure staff perceptions using the John Robertson & Associates’ `Best Places to Work’survey. The graph below depicts the overall HCC performance index score (68.3%) compared to theoverall local government performance index score (69%). Current initiatives to support our peopleinclude enhancing our leadership and management capability, a strong internal communicationsstrategy, learning and development opportunities, and health and wellbeing initiatives.Staff PerceptionsWeighted Mean Score10090807060504030201002005 20062007 20082009 2010<strong>Hutt</strong> <strong>City</strong><strong>Council</strong>Local GovernmentBenchmark
74 HUTT CITY LONG TERM PLAN <strong>2012</strong>-2022PROJECT COMPLETIONEvery year we commit to up to 300 projects through our <strong>Long</strong> <strong>Term</strong> <strong>Plan</strong> or Annual <strong>Plan</strong>.Inevitably, some of these projects can’t be completed during the year for various reasons suchas unseasonal weather, so we usually carry them into the next financial year and completethem then. For this reason we have a target of completing at least 90% of projects scheduledfor the financial year. However, in 2010-2011 we were faced with potential higher debt dueto delays in some of the planned asset sales, and <strong>Council</strong> agreed to delay a number of capitalprojects in order to keep debt levels down.350300250200150100500Completion of <strong>Plan</strong>ned ProjectsTarget: above 90%1999 2000 2001 2002 2003 2004 2005 2006 2007 2008 2009 2010 2011100%90%80%70%60%50%40%30%20%10%0%Number ofplanned projectsPercentagecomplete (RHS)COMPLIANCEAs we’re a significant and complex business operating in a wide variety of areas, it’s vital thatour staff, contractors and other business associates comply with the law, contracts, consents,employment agreements, health and safety requirements and <strong>Council</strong> policy.We monitor this compliance on a monthly basis, with a target of having no significant noncomplianceinstances. We’ve achieved this every year since 2004. While there have beensome minor breaches, these have been remedied with no significant impact on our operations.YEARNON-COMPLIANCE INSTANCESINSIGNIFICANTSIGNIFICANT2004 9 -2005 6 -2006 1 -2007 3 -2008 1 -2009 1 -2010 1 -2011 2 -OUR GROUPS AND ACTIVITIESOur organisation is divided into groups and key activities:1. Group People is responsible for Libraries, Museums, Aquatics and Recreation, Parks andReserves and Community Development.2. Group Utility Services is responsible for Roading and Traffic, Water Supply, Wastewater,Stormwater, and Solid Waste.3. Group Environment is responsible for Environmental Management and EmergencyManagement.4. Group Economy is responsible for Local Urban Environment and Economic Development.5. Group Organisation is responsible for Elected Members, Advice and Support, andManaging Services.The following pages describe each group and activity under the headings:• What we do• Why we do it• Effects on community wellbeing• The service we provide• How we measure the success of our services• Major projects planned• Prospective income and funding requirements• Funding impact statement
76 HUTT CITY LONG TERM PLAN <strong>2012</strong>-2022GROUP PEOPLEGroup People is responsible for managing the community’s cultural, social andrecreational assets in the form of the library network, the Dowse Art Museum and PetoneSettlers Museum including their collections, swimming pools and the network of parksand reserves to the agreed service levels described in our asset management plans.LibrariesWhat we doWe provide a collective resource that is greater than any individual or family could affordor accommodate.Why we do itProviding library services enables all citizens to access information, knowledge and learningopportunities that support and strengthen individuals and the community.Effects on community wellbeingThe Libraries activity promotes cultural wellbeing. It contributes to the majority of communityoutcomes, with libraries providing a focus for community activities and lifelong learningwhich promotes strong and inclusive communities. Looking at the potential for negativeeffects associated with this activity, the libraries are places where people congregate and arevulnerable to the risks associated with any public space.The services we provideWe provide eight libraries across the city, run as a single city-wide service. Libraries arelocated in the Lower <strong>Hutt</strong> CBD, Moera, Naenae, Taita, Stokes Valley, Eastbourne, Petoneand Wainuiomata. Petone Community Library provides a focus for heritage collections andservices. A range of lifelong learning programmes and events is offered across the librariesyear round.How we measure the success of our servicesMEASUREPercentage of residentswho have used libraryservices during the year(measured by independentsurvey)Residents’ satisfaction withlibrary services (measuredby independent survey)Number of physical visitsper year (measured bymanagement reports)Number of visits via theinternet per year (measuredby management reports)Library stock turnover(measured by New ZealandPublic Library Statistics).Note: a number greaterthan or equal to the nationalmean shows that ourlibrary stock turnover is atleast equal to or better thanis achieved nationallyACHIEVED2008-09ACHIEVED2009-10ACHIEVED2010-11TARGET2011-1282% 82% 85% 80%of thoseexpressingan opinion98% 100% 99% 97%of thoseexpressingan opinionTARGET<strong>2012</strong>-13 TO2021-2280%of thoseexpressingan opinion97%of thoseexpressingan opinion1,102,124 1,263,663 1,248,512 1,200,000 1,200,000314,419 202,619LibrariesOnline visits5.69(nationalmean 4.3averageannualcirculationper item)6.94(nationalmean 3.47averageannualcirculationper item)Note: Survey percentages exclude those who responded ‘Don’t know’.267,376LibrariesOnline visits99,839 paysessions onConnect6.47(nationalmean 3.78averageannualcirculationper item)200,000LibrariesOnline visits85,000 paysessions onConnectnationalmean200,000LibrariesOnline visits85,000 paysessions onConnectnationalmean<strong>Hutt</strong> <strong>City</strong> Libraries are also part of the SMART public and tertiary library collaboration, alongwith Wellington Institute of Technology (WelTec), Whitireia New Zealand, Porirua <strong>City</strong>, KapitiCoast District and Masterton District libraries. The SMART global catalogue includes more than500,000 library items in 24 libraries across the Wellington region that participating librariescustomers can access.
HUTT CITY LONG TERM PLAN <strong>2012</strong>-202277Major projects planned<strong>2012</strong>-13COST$0002013-14COST$0002014-15COST$0002015-16COST$0002016-17COST$0002017-18COST$0002018-19COST$0002019-20COST$0002020-21COST$0002021-22COST$0002022-23COST$0002023-24COST$0002024-25COST$0002025-26COST$0002026-27COST$0002027-28COST$0002028-29COST$0002029-30COST$0002030-31COST$0002031-32COST$000Capital ReplacementsLibraries Building Maintenance 65 82 21 150 79 174 63 79 125 292 154 323Libraries Replace Furniture & Equipment 15(Carryover from 2011/<strong>2012</strong>)Library Stock Replacement 750 768 786 897 919 942 966 992 1,018 1,045 1,072 1,100 1,128 1,158 1,188 1,219 1,250 1,283 1,316 1,351Replace Furniture & Equipment Programme 40 87 44 45 46 47 48 49 51 52 53 55 56 58 59 61 62 64 65 67All LibrariesReplace Library Shelving 20 61 21 21 22 23 23 24 24 25 26 26 27 28 28 29 30 31 32 32Capital ImprovementsDigitisation 11 11 11 11 12 12 12 12 13 13 13 14 14 15 15 15 16 16 17 17Library Buildings Improvements 60 82 42 43 55 56 81 48 122 125 263 166 449 647Radio Frequency Identification 118 118 121 123WiFi War Memorial, Naenae, Petone,Wainuiomata50
78 HUTT CITY LONG TERM PLAN <strong>2012</strong>-2022Prospective income statement for the year ending 30 June: LibrariesESTIMATE<strong>2012</strong>$000BUDGET2013$000FORECAST2014$000FORECAST2015$000FORECAST2016$000FORECAST2017$000FORECAST2018$000FORECAST2019$000FORECAST2020$000FORECAST2021$000FORECAST2022$000REVENUEUser charges 558 674 690 707 724 742 760 780 800 822 843Other revenue 34 143 146 150 154 157 161 166 170 174 179Total revenue 592 817 836 857 878 899 921 946 970 996 1,022EXPENDITUREEmployee costs 4,398 3,953 4,048 4,145 4,285 4,393 4,502 4,619 4,739 4,867 4,994Support costs/internal charges 2,163 1,582 1,535 1,568 1,585 1,638 1,640 1,607 1,583 1,576 1,549Operating costs 980 1,624 1,663 1,703 1,744 1,788 1,833 1,880 1,929 1,981 2,033Interest expenditure 12 38 36 38 41 48 44 40 38 36 36Depreciation 810 1,550 1,459 1,444 1,434 1,409 1,396 1,396 1,378 1,375 1,380Total expenditure 8,363 8,747 8,741 8,898 9,089 9,276 9,415 9,542 9,667 9,835 9,992DEFICIT BEFORE TAX (7,771) (7,930) (7,905) (8,041) (8,211) (8,377) (8,494) (8,596) (8,697) (8,839) (8,970)LIBRARIES - PROSPECTIVE FUNDING REQUIREMENTRATES FUNDING REQUIREMENTSurplus/(deficit) (7,771) (7,930) (7,905) (8,041) (8,211) (8,377) (8,494) (8,596) (8,697) (8,839) (8,970)Total rates funding requirement (7,771) (7,930) (7,905) (8,041) (8,211) (8,377) (8,494) (8,596) (8,697) (8,839) (8,970)LOAN FUNDING REQUIREMENTCapital expenditure - maintaining services (793) (875) (998) (872) (1,113) (987) (1,090) (1,211) (1,065) (1,093) (1,184)Capital expenditure - improving services (156) (239) (210) (174) (178) (67) (68) (93) (60) (135) (138)Less depreciation 810 1,550 1,459 1,444 1,434 1,409 1,396 1,396 1,378 1,375 1,380Total loan (funding)/repayment (139) 436 251 398 143 355 238 92 253 147 58TOTAL FUNDING REQUIREMENT (7,910) (7,494) (7,654) (7,643) (8,068) (8,022) (8,256) (8,504) (8,444) (8,692) (8,912)
HUTT CITY LONG TERM PLAN <strong>2012</strong>-202279MuseumsWhat we doWe operate two museums, which are open to the public at no charge other than for specialexhibitions:• The Dowse Art Museum collects and displays fine art as well as decorative and applied arts,and is a conduit for community engagement and participation in the creative arts, underpinnedby innovative exhibitions, education and associated community programmes.• The Petone Settlers Museum specialises in showcasing the social history of the early Mäoriand European settlement of the lower <strong>Hutt</strong> Valley and Petone area.Why we do itBy providing museums we enable people to access freely arts and cultural facilities thatenrich, inspire and offer a range of lifelong learning opportunities. The museums act as afocal point for the community, enhance cultural life and diversity, and promote civic pride andcommunity values.Effects on community wellbeingThe Museums activity promotes cultural wellbeing. It contributes primarily to our communityoutcomes of a strong and diverse economy, an accessible and connected city, actively engagedin community activities, and strong and inclusive communities. It does this by increasingopportunities for people to access arts and culture, strengthening partnerships with tangatawhenua, and celebrating diversity. Looking at the potential for negative effects associated withthis activity, the museums are places where people congregate and are vulnerable to the risksassociated with any public space.How we measure the success of our servicesMEASURENumber of museum visitsper year (measured bymanagement reports)Residents’ satisfaction withthe Dowse Art Museum(measured by independentsurvey)Residents’ satisfaction withPetone Settlers Museum(measured by independentsurvey)Public educationprogrammes deliveredthat meet the needs andexpectations of communityand school groups(measured by managementreports and participantevaluation forms)ACHIEVED2008-09ACHIEVED2009-10ACHIEVED2010-11TARGET2011-12TARGET<strong>2012</strong>-13 TO2021-22198,391 245,119 201,678 200,000 200,00094% 95% 96% 93%of thoseexpressingan opinion98% 97% 98% 93%of thoseexpressingan opinionPubliceducationprogrammesdeliveredto 13,254participants91%satisfactionPubliceducationprogrammesdeliveredto 11,847participants94%satisfactionNote: Survey percentages quoted exclude those who responded ‘Don’t know’.Publiceducationprogrammesdeliveredto 16,026participants97%satisfactionPubliceducationprogrammesdeliveredto 11,000participants90%satisfaction93%of thoseexpressingan opinion93%of thoseexpressingan opinionPubliceducationprogrammesdeliveredto 11,000participants90%satisfactionThe services we provideThe Dowse Art Museum offers an exciting exhibition programme showcasing the best incontemporary art and design, and a busy events calendar including musical performances, artists’talks and creative workshops. A range of curriculum-linked education programmes are offeredalong with school holiday events. The Dowse has a collection of more than 3000 artworks, with astrong focus on the decorative arts.The Petone Settlers Museum offers an interesting insight into the migration and settlementof people in our region. This includes exhibitions and an online passenger database recordingvessels and voyages to Wellington from the United Kingdom, Australia and parts of Europebetween 1839 and 1897.
80 HUTT CITY LONG TERM PLAN <strong>2012</strong>-2022Major projects planned<strong>2012</strong>-13COST$0002013-14COST$0002014-15COST$0002015-16COST$0002016-17COST$0002017-18COST$0002018-19COST$0002019-20COST$0002020-21COST$0002021-22COST$0002022-23COST$0002023-24COST$0002024-25COST$0002025-26COST$0002026-27COST$0002027-28COST$0002028-29COST$0002029-30COST$0002030-31COST$0002031-32COST$000Capital ReplacementsDowse Acoustic Upgrade James Coe 2 12 23 54 79Dowse Building & <strong>Plan</strong>t Maintenance 90 31 55 62 51 61 74 71 110 75 83 79 108 85 150Dowse Carpets & Soft Furnishings Gallery 15 41 33 32 18 23 27 53 79 13 19 83 44 184 97& OfficeDowse Gallery Lighting 11 10 16 16 72 113 52 30 37 13 19 26 54 85 105 142Dowse Museum Chiller Replacement68(Carryover from 2011/<strong>2012</strong>)Dowse Office Furniture & Equipment 10 7 56 17 12 18 53 180 102 92 162Little Theatre Maintenance 80 21 150 56 77 292 126Little Theatre Maintenance (Carryover from 72011/<strong>2012</strong>)Petone Settlers Museum Building & <strong>Plan</strong>t 15 6 52 6 7 30 149 146 52 47MaintenancePetone Settlers Museum ExhibitionFurniture & Fittings65 14 6 13 55 90 113Capital ImprovementsDowse Collection Storage Upgrade/1,054RedevelopmentDowse New Artworks 21 23 25 27 29 45 50 52 55 56 58 66 81 97 199 102 165 123 236 259Little Theatre Development Needs Analysis 25Little Theatre Improvements 30 31 42 69 98 103 270 388 270 243Little Theatre Improvements (Carryover 100from 2011/<strong>2012</strong>)Little Theatre Sound & Lighting80 193ImprovementsLittle Theatre Sound & Lighting30Improvements (Carryover from 2011/<strong>2012</strong>)Petone Settlers Museum New Gallery38 11 105LightingPiano Replacement (Little Theatre) (Fundedfrom Piano Reserve)70Operating ProjectsEvents Funding 20
HUTT CITY LONG TERM PLAN <strong>2012</strong>-202281Prospective income statement for the year ending 30 June: MuseumsESTIMATE<strong>2012</strong>$000BUDGET2013$000FORECAST2014$000FORECAST2015$000FORECAST2016$000FORECAST2017$000FORECAST2018$000FORECAST2019$000FORECAST2020$000FORECAST2021$000FORECAST2022$000REVENUEUser charges 256 303 310 317 325 333 341 350 359 369 379Other revenue 245 480 492 503 515 528 541 556 570 585 601Total revenue 501 783 802 820 840 861 882 906 929 954 980EXPENDITUREEmployee costs 1,147 1,214 1,243 1,273 1,314 1,347 1,381 1,416 1,453 1,492 1,531Support costs/internal charges 643 629 610 625 630 651 650 638 629 627 616Operating costs 1,026 1,309 1,341 1,373 1,406 1,441 1,477 1,515 1,555 1,597 1,638Interest expenditure 77 75 72 69 80 85 86 82 75 69 71Depreciation 277 556 546 545 547 542 543 545 540 542 543Total expenditure 3,170 3,783 3,812 3,885 3,977 4,066 4,137 4,196 4,252 4,327 4,399DEFICIT BEFORE TAX (2,669) (3,000) (3,010) (3,065) (3,137) (3,205) (3,255) (3,290) (3,323) (3,373) (3,419)MUSEUMS - PROSPECTIVE FUNDING REQUIREMENTRATES FUNDING REQUIREMENTSurplus/(deficit) (2,669) (3,000) (3,010) (3,065) (3,137) (3,205) (3,255) (3,290) (3,323) (3,373) (3,419)Total rates funding requirement (2,669) (3,000) (3,010) (3,065) (3,137) (3,205) (3,255) (3,290) (3,323) (3,373) (3,419)LOAN FUNDING REQUIREMENTCapital expenditure - maintaining services (211) (223) (98) (176) (333) (146) (332) (191) (166) (274) (106)Capital expenditure - improving services (40) (226) (53) (67) (64) (40) (45) (119) (52) (152) (56)Less depreciation 277 556 546 545 547 542 543 545 540 542 543Total loan (funding)/repayment 26 107 395 302 150 356 166 235 322 116 381TOTAL FUNDING REQUIREMENT (2,643) (2,893) (2,615) (2,763) (2,987) (2,849) (3,089) (3,055) (3,001) (3,257) (3,038)
84 HUTT CITY LONG TERM PLAN <strong>2012</strong>-2022Prospective income statement for the year ending 30 June: Aquatics and RecreationESTIMATE<strong>2012</strong>$000BUDGET2013$000FORECAST2014$000FORECAST2015$000FORECAST2016$000FORECAST2017$000FORECAST2018$000FORECAST2019$000FORECAST2020$000FORECAST2021$000FORECAST2022$000REVENUEUser charges 2,860 3,072 3,193 3,270 3,402 3,487 3,574 3,899 4,000 4,108 4,215Other revenue 1,265 1,210 1,239 1,269 1,300 1,332 1,365 1,401 1,437 1,476 1,514Total revenue 4,125 4,282 4,432 4,539 4,702 4,819 4,939 5,300 5,437 5,584 5,729EXPENDITUREEmployee costs 3,319 3,310 3,440 3,522 3,633 3,724 3,817 3,916 4,018 4,127 4,234Support costs/internal charges 724 930 902 922 931 962 963 944 930 926 911Operating costs 3,647 4,188 4,373 4,478 4,692 4,810 4,930 5,290 5,427 5,574 5,719Interest expenditure 55 114 110 105 121 132 131 124 115 106 108Depreciation 910 1,498 1,545 1,655 1,704 1,736 1,900 2,039 2,006 2,201 2,391Total expenditure 8,655 10,040 10,370 10,682 11,081 11,364 11,741 12,313 12,496 12,934 13,363DEFICIT BEFORE TAX (4,530) (5,758) (5,938) (6,143) (6,379) (6,545) (6,802) (7,013) (7,059) (7,350) (7,634)AQUATICS AND RECREATION - PROSPECTIVE FUNDINGREQUIREMENTRATES FUNDING REQUIREMENTSurplus/(deficit) (4,530) (5,758) (5,938) (6,143) (6,379) (6,545) (6,802) (7,013) (7,059) (7,350) (7,634)Total rates funding requirement (4,530) (5,758) (5,938) (6,143) (6,379) (6,545) (6,802) (7,013) (7,059) (7,350) (7,634)LOAN FUNDING REQUIREMENTCapital expenditure - maintaining services (525) (947) (644) (614) (950) (795) (936) (1,241) (1,077) (817) (1,102)Capital expenditure - improving services (375) (3,657) (4,295) (1,255) (1,680) (1,295) (6,362) (116) (315) (8,854) (513)Less depreciation 910 1,498 1,545 1,655 1,704 1,736 1,900 2,039 2,006 2,201 2,391Total loan (funding)/repayment 10 (3,106) (3,394) (214) (926) (354) (5,398) 682 614 (7,470) 776TOTAL FUNDING REQUIREMENT (4,520) (8,864) (9,332) (6,357) (7,305) (6,899) (12,200) (6,331) (6,445) (14,820) (6,858)
HUTT CITY LONG TERM PLAN <strong>2012</strong>-202285Parks and ReservesWhat we doWe provide and maintain active and passive recreational facilities in <strong>Hutt</strong> <strong>City</strong> for publicenjoyment and wellbeing. With access largely free of charge, our recreation areas are bothnatural and developed. Most of our work is targeted at maintaining developed areas andretaining bush land in its natural state. ‘Parks and Reserves’ also includes <strong>Council</strong> cemeteries.Why we do itIn providing and maintaining parks, reserves, sportsgrounds, street gardens and street trees,we help to create a pleasant environment in which people can live, work and play. Providingand maintaining these areas at high quality and low user cost makes them available to thewhole community.Effects on community wellbeingThe Parks and Reserves activity promotes cultural wellbeing in particular through ourIntegrated Facilities <strong>Plan</strong>, Active Recreation and Sport Strategy, Reserves Strategic Direction,Urban Forest <strong>Plan</strong>, and CBD Making Places project. It contributes primarily to our communityoutcomes of healthy people, a healthy natural environment, actively engaged in communityactivities, and a healthy and attractive built environment. Looking at the potential for negativeeffects associated with this activity, parks, reserves and sportsgrounds are places wherepeople congregate to play and this could result in noise, vandalism and injury. There couldalso be impacts on security, privacy and traffic volumes for neighbouring properties. Thecemeteries activity can cause environmental effects. Mitigation measures are in place toaddress these possibilities.The services we provideWe own more than 5300 hectares and manage around 3000 hectares of parks, reserves,bush-clad hills, beaches, walkways, tracks, sportsgrounds and playgrounds, and around 12,500street trees. Our customer service standards cover service quality, availability, cost, courtesyand responsiveness. Our asset management plan outlines our customer service standards forreserves, horticultural parks, sportsgrounds, playgrounds, cemeteries, street trees and wharves.How we measure the success of our servicesMEASUREACHIEVED2008-09ACHIEVED2009-10ACHIEVED2010-11TARGET2011-12Residents’ satisfaction with:• sportsgrounds 97% 95% 96% 95%of thoseexpressing anopinion• parks, reserves and gardens 96% 97% 98% 95%of thoseexpressing anopinion• cemeteries(measured by independentsurvey)Sports fields meet thestandard agreed with sportscodes (measured by auditsand complaints received)Area of parks and reserves per1000 of populationPercentage of householdsthat have used or visitedparks, reserves or gardensin the previous 12 months(measured by independentsurvey)Maintain a high standard ofmaintenance and developmentof playgrounds, parks,reserves, gardens andcemeteries (measured byaudits)96% 97% 96% 90%of thoseexpressing anopinion97% 97% 97% 95% 95%54 hectares 54 hectares 54 hectares 24.9hectaresTARGET<strong>2012</strong>-13 TO 2021-2295%of thoseexpressing anopinion95%of thoseexpressing anopinion90%of thoseexpressing anopinion24.9hectares88% 90% 93% 89% 89%95% 95% 95% 95% ofcontractand assetmanagementplanrequirementsmetNote: Survey percentages quoted exclude those who responded ‘Don’t know’.95% ofcontractand assetmanagementplanrequirementsmet
86 HUTT CITY LONG TERM PLAN <strong>2012</strong>-2022Major projects planned<strong>2012</strong>-13COST$0002013-14COST$0002014-15COST$0002015-16COST$0002016-17COST$0002017-18COST$0002018-19COST$000Capital ReplacementsAvalon Park Pavilion Maintenance 84 68 50 119 142 120 79Building Maintenance (Sportsgrounds) 150 154 157 161 165 169 174 178 183 188 193 198 203 208 213 219 225 230 236 243Honiana Te Puni Landscape Renovation 102Korohiwa Bus Barn Car Park Sealing 135Korohiwa Bus Barn Maintenance 132 95 73 125 58 162Minoh Friendship House Maintenance 88 35 122 68 142Miscellaneous Rentals Maintenance 25 63 88 116 122 142 189Parks Hard Surfaces Maintenance 250 154 157 161 165 169 174 178 183 188 193 198 203 208 213 219 225 230 236 243Playgrounds 265 200 204 209 226 231 237 243 250 257 263 270 277 284 292 299 307 315 323 332Seats & Bins 27 29 29 31 32 33 34 36 37 38 39 40 41 42 43 44 45 46 47 49Signage & Interpretation 23 24 26 27 30 30 35 36 37 38 39 40 41 42 43 44 45 46 47 49Single Houses (Reserves) Maintenance 60 31 107 33 68 104 125 122 225Track Maintenance 30 31 31 32 33 34 35 36 37 38 39 40 41 42 43 44 45 46 47 49Wharves Maintenance 500 52 537 56 810 63 899 69 996 77 1,104Capital ImprovementsAvalon Park Development30 102 107 113 119 125 132 139 146 154 162[Funded from Reserve Fund]Avalon Park Improvements120[Rotary Project Funded from Reserve Fund](Carryover from 2011/<strong>2012</strong>)Bollards to Prevent Vehicle Access to Reserves 5 5 5 5 6 6 6 6 6 6 6 7 7 7 7 7 7 8 8 8Car Park Development 50 132 142 154Days Bay Wharf Entrance Development 105[Funded from Reserve Fund]Escarpment Fencing Pencarrow Coast Road 52Hardcourt Development Western Hills 63Holborn Drive Reserve Drainage161[Funded from Reserve Fund]Honiana Te Puni Redevelopment 297Jubilee Park Drainage 38Kelson Reserve Development161[Funded from Reserve Fund]Meadowbank Reserve Development, Belmont 313Memorial Park Synthetic Turf & Changing307 385Rooms [Funded from Reserve Fund]Minoh Friendship House Improvements 118 73Mountain Bike Park [Funded from Reserve Fund] 30 31 31 32 33 34 35 36 37 38 39 40 41 42 43 44 45 46 47 49New Cemetery Development, Akatarawa Road 100 1,284 1,3172019-20COST$0002020-21COST$0002021-22COST$0002022-23COST$0002023-24COST$0002024-25COST$0002025-26COST$0002026-27COST$0002027-28COST$0002028-29COST$0002029-30COST$0002030-31COST$0002031-32COST$000
HUTT CITY LONG TERM PLAN <strong>2012</strong>-202287<strong>2012</strong>-13COST$0002013-14COST$0002014-15COST$0002015-16COST$0002016-17COST$0002017-18COST$0002018-19COST$000New Tracks/Track Upgrades107 110 113 119 135 142 150 158[Funded from Reserve Fund]Otonga School Site Development102[Funded from Reserve Fund]Percy Scenic Reserve Development231 139 146 154 162[Funded from Reserve Fund]Petone Foreshore Improvements330[Funded from Reserve Fund]Poto Road Reserve Development100[Funded from Reserve Fund]Reserve Upgrades 322 676 711 730 749 788 809Sportsville & Artificial Surfaces500 512 5,369 2,773 3,073[Funded from Reserve Fund]Te Whiti Park New Changing Rooms55 1,128[Funded from Reserve Fund]Toilets Upgrade 300 358 107 35 85 449 105 608 485 292 307Track Upgrading & Development50(Carryover from 2011/<strong>2012</strong>)Trafalgar Park New Toilets/Fence73 161[Funded from Reserve Fund]Waimarie Croquet Relocation & Development 51Wainuiomata Garden of Remembrance237DevelopmentWalter Nash Reserve Upgrade21 330[Funded from Reserve Fund]Whiorau Reserve Development231[Funded from Reserve Fund]Williams Park Improvements 626Operating ProjectsMemorial Park Contribution to New Surface 800(Subsidy 44%) (Carryover from 2011/<strong>2012</strong>)Motorhome Waste Dump Station 4Point Howard Wharf Laterals Demolition 3102019-20COST$0002020-21COST$0002021-22COST$0002022-23COST$0002023-24COST$0002024-25COST$0002025-26COST$0002026-27COST$0002027-28COST$0002028-29COST$0002029-30COST$0002030-31COST$0002031-32COST$000
88 HUTT CITY LONG TERM PLAN <strong>2012</strong>-2022Prospective income statement for the year ending 30 June: Parks and ReservesESTIMATE<strong>2012</strong>$000BUDGET2013$000FORECAST2014$000FORECAST2015$000FORECAST2016$000FORECAST2017$000FORECAST2018$000FORECAST2019$000FORECAST2020$000FORECAST2021$000FORECAST2022$000REVENUEUser charges 993 1,891 1,937 1,983 2,031 2,082 2,134 2,189 2,246 2,307 2,367Vested Assets 100 100 102 105 107 110 113 116 119 122 125Other revenue 4 6 6 6 6 6 7 7 7 7 7Total revenue 1,097 1,997 2,045 2,094 2,144 2,198 2,254 2,312 2,372 2,436 2,499EXPENDITUREEmployee costs 725 779 747 765 791 810 831 852 874 898 921Support costs/internal charges 560 652 633 647 653 675 676 662 652 650 639Operating costs 8,862 9,092 8,855 9,067 9,285 9,517 9,755 10,009 10,269 10,546 10,820Interest expenditure 452 461 448 428 492 538 530 505 466 430 439Depreciation 966 1,555 1,550 1,570 1,621 1,658 1,684 1,711 1,713 1,729 1,752Total expenditure 11,565 12,539 12,233 12,477 12,842 13,198 13,476 13,739 13,974 14,253 14,571DEFICIT BEFORE TAX (10,468) (10,542) (10,188) (10,383) (10,698) (11,000) (11,222) (11,427) (11,602) (11,817) (12,072)PARKS AND RESERVES - PROSPECTIVE FUNDING REQUIREMENTRATES FUNDING REQUIREMENTSurplus/(deficit) (10,468) (10,542) (10,188) (10,383) (10,698) (11,000) (11,222) (11,427) (11,602) (11,817) (12,072)Total rates funding requirement (10,468) (10,542) (10,188) (10,383) (10,698) (11,000) (11,222) (11,427) (11,602) (11,817) (12,072)LOAN FUNDING REQUIREMENTCapital expenditure - maintaining services (489) (1,465) (723) (805) (1,266) (992) (858) (1,752) (802) (1,043) (1,107)Capital expenditure - improving services (788) (1,070) (1,469) (163) (6,673) (1,101) (1,393) (538) (576) (201) (1,358)Less depreciation 966 1,555 1,550 1,570 1,621 1,658 1,684 1,711 1,713 1,729 1,752Less asset sales - 1,500 2,560 1,992 - - - - - - -Total loan (funding)/repayment (311) 520 1,918 2,594 (6,318) (435) (567) (579) 335 485 (713)TOTAL FUNDING REQUIREMENT (10,779) (10,022) (8,270) (7,789) (17,016) (11,435) (11,789) (12,006) (11,267) (11,332) (12,785)
HUTT CITY LONG TERM PLAN <strong>2012</strong>-202289Community DevelopmentWhat we doWe support our community through services such as facilitation, advocacy and consultationand through providing grants to community organisations and groups. We work with allsectors of the community, providing services through our Community Development team.We have funding relationships with government agencies to provide essential services to ourcommunity, including settlement support and safety initiatives.Why we do itWe’ve always been committed to identifying and understanding our communities so that wecan respond appropriately to issues affecting them. Our support helps community groups toachieve their goals where they can’t do it themselves because of a lack of resources.Effects on community wellbeingThe Community Development activity promotes social and cultural wellbeing in particularthrough our Integrated Facilities <strong>Plan</strong> and community development initiatives including ourChildren and Young People, Ageing Together, Settlement Support, Safe <strong>City</strong>, Disability,Gambling and Social Housing/Housing Policies. It contributes primarily to our communityoutcomes of a safe community, healthy people, actively engaged in community activities,strong and inclusive communities, and a well-governed city. Looking at the potential fornegative effects associated with this activity, there are conflicting public perspectives aboutthe extent of the role that councils should take in this area.The services we provideWe provide support to the <strong>Hutt</strong> <strong>City</strong> community around funding, settlement support,community safety and youth matters. We also help people and organisations to connect andaccess community services and networks.How we measure the success of our servicesMEASURECommunity organisations’satisfaction with theavailability and quality of oursupport, advice and funding(measured by survey ofcommunity organisations)Residents’ perceptionsof <strong>Hutt</strong> <strong>City</strong> in terms oftheir sense of safety intheir local neighbourhoodand in the Lower <strong>Hutt</strong> citycentre during the day andafter dark (measured byindependent survey)Residents’ satisfaction withthe city overall being freeof graffiti (measured byindependent survey)New settlers’ satisfactionwith the availability andquality of our support,advice and training(measured by survey ofnew settlers)ACHIEVED2008-09Newmeasure for2009/10ACHIEVED2009-1080.3% NotmeasuredACHIEVED2010-11TARGET2011-1284% 90% 90%of thoseexpressingan opinion85% overall 81%of thoseexpressingan opinion87% 79% 68% 80%of thoseexpressingan opinionNewmeasure for2011/12Newmeasure for2011/12Newmeasure for2011/12Note: Survey percentages quoted exclude those who responded ‘Don’t know’.90%of thoseexpressingan opinionTARGET<strong>2012</strong>-13 TO2021-2290%of thoseexpressingan opinion81%of thoseexpressingan opinion80%of thoseexpressingan opinion90%of thoseexpressingan opinion
90 HUTT CITY LONG TERM PLAN <strong>2012</strong>-2022Major projects planned<strong>2012</strong>-13COST$0002013-14COST$0002014-15COST$0002015-16COST$0002016-17COST$0002017-18COST$0002018-19COST$0002019-20COST$0002020-21COST$0002021-22COST$0002022-23COST$0002023-24COST$0002024-25COST$0002025-26COST$0002026-27COST$0002027-28COST$0002028-29COST$0002029-30COST$0002030-31COST$0002031-32COST$000Capital ReplacementsCBD Community Resource Centre 99 58 71 122 81Community Houses Maintenance 75 51 63 54 68 35 119 61 188 64 66 68 69 71 73 75 77 79 81Capital ImprovementsCommunity Resource Centre 75 64 88Operating ProjectsArts & Culture Funding 89Citizens Advice Bureaux Funding 75Community Development Fund 148Community Houses Funding 255Emergency Generators 4Heritage Fund 15<strong>Hutt</strong> <strong>City</strong> Brass Band 6Marae Funding 160Rapid Response Anti-Graffiti Service 416Regional Grants 33Safety Initiatives 298Scholarships 10Social Development Projects 80Tamaiti Whangai 5Youth Centre 158
HUTT CITY LONG TERM PLAN <strong>2012</strong>-202291Prospective income statement for the year ending 30 June: Community DevelopmentESTIMATE<strong>2012</strong>$000BUDGET2013$000FORECAST2014$000FORECAST2015$000FORECAST2016$000FORECAST2017$000FORECAST2018$000FORECAST2019$000FORECAST2020$000FORECAST2021$000FORECAST2022$000REVENUEUser charges 25 49 50 52 53 54 56 57 58 60 62Other revenue 157 95 97 100 102 105 107 110 113 116 119Total revenue 182 144 147 152 155 159 163 167 171 176 181EXPENDITUREEmployee costs 641 661 677 694 717 735 753 773 793 814 836Support costs/internal charges 544 508 493 504 509 526 527 516 509 507 498Operating costs 1,583 2,021 2,070 2,119 2,170 2,225 2,280 2,339 2,400 2,465 2,529Interest expenditure - 6 5 5 6 6 6 6 6 5 5Depreciation 42 121 118 117 118 118 118 119 121 123 126Total expenditure 2,810 3,317 3,363 3,439 3,520 3,610 3,684 3,753 3,829 3,914 3,994DEFICIT BEFORE TAX (2,628) (3,173) (3,216) (3,287) (3,365) (3,451) (3,521) (3,586) (3,658) (3,738) (3,813)COMMUNITY SUPPORT - PROSPECTIVE FUNDINGREQUIREMENTRATES FUNDING REQUIREMENTSurplus/(deficit) (2,628) (3,173) (3,216) (3,287) (3,365) (3,451) (3,521) (3,586) (3,658) (3,738) (3,813)Total rates funding requirement (2,628) (3,173) (3,216) (3,287) (3,365) (3,451) (3,521) (3,586) (3,658) (3,738) (3,813)LOAN FUNDING REQUIREMENTCapital expenditure - maintaining services - (75) (51) (63) (54) (99) (68) (93) (190) (61) (188)Capital expenditure - improving services (149) - - - (75) - - (64) - - (88)Less depreciation 42 121 118 117 118 118 118 119 121 123 126Total loan (funding)/repayment (107) 46 67 54 (11) 19 50 (38) (69) 62 (150)TOTAL FUNDING REQUIREMENT (2,735) (3,127) (3,149) (3,233) (3,376) (3,432) (3,471) (3,624) (3,727) (3,676) (3,963)
92 HUTT CITY LONG TERM PLAN <strong>2012</strong>-2022Funding impact statement for the year ending 30 June: Group PeopleACTUAL2011$000ESTIMATE<strong>2012</strong>$000BUDGET2013$000FORECAST2014$000FORECAST2015$000FORECAST2016$000FORECAST2017$000FORECAST2018$000FORECAST2019$000FORECAST2020$000FORECAST2021$000FORECAST2022$000Sources of operating fundingGeneral rates, uniform annual general charges, rates penalties 26,167 28,166 30,503 30,359 31,024 31,897 32,688 33,407 34,028 34,458 35,239 36,033Targeted rates (other than a targeted rate for water supply) - - - - - - - - - - - -Subsidies and grants for operating purposes - - - - - - - - - - - -Fees, charges and targeted rates for water supply 4,956 4,692 5,989 6,180 6,329 6,535 6,698 6,865 7,275 7,463 7,666 7,866Internal charges and overheads recovered - - - - - - - - - - - -Local authorities fuel tax, fines, infringement fees, and other receipts 1,580 1,705 1,934 1,980 2,028 2,077 2,128 2,181 2,240 2,297 2,358 2,420Total operating funding (A) 32,703 34,563 38,426 38,519 39,381 40,509 41,514 42,453 43,543 44,218 45,263 46,319Applications of operating fundingPayments to staff and suppliers 24,919 26,328 28,151 28,457 29,139 30,037 30,790 31,559 32,609 33,457 34,361 35,255Finance costs 633 596 693 671 645 740 809 797 757 700 646 659Internal charges and overheads applied 4,426 4,634 4,302 4,173 4,266 4,308 4,452 4,456 4,367 4,303 4,286 4,213Other operating funding applications - - - - - - - - - - - -Total applications of operating funding (B) 29,978 31,558 33,146 33,301 34,050 35,085 36,051 36,812 37,733 38,460 39,293 40,127Surplus (deficit) of operating funding (A-B) 2,725 3,005 5,280 5,218 5,331 5,424 5,463 5,641 5,810 5,758 5,970 6,192Sources of capital fundingSubsidies and grants for capital expenditure - - - - - - - - - - - -Development and financial contributions - - - - - - - - - - - -Increase (decrease) in debt 795 521 1,997 764 (3,134) 6,962 58 5,512 (393) (1,456) 6,660 (352)Gross proceeds from sale of assets - - 1,500 2,560 1,992 - - - - - - -Lump sum contributions - - - - - - - - - - - -Total sources of capital funding (C) 795 521 3,497 3,324 (1,142) 6,962 58 5,512 (393) (1,456) 6,660 (352)Application of capital fundingCapital expenditure- to meet additional demand- to improve level of service 1,227 1,508 5,192 6,027 1,659 8,670 2,503 7,869 930 1,002 9,342 2,153- to replace existing assets 2,293 2,018 3,585 2,515 2,530 3,716 3,018 3,284 4,487 3,300 3,288 3,687Increase (decrease) in reserves - - - - - - - - - - - -Increase (decrease) of investments - - - - - - - - - - - -Total applications of capital funding (D) 3,520 3,526 8,777 8,542 4,189 12,386 5,521 11,153 5,417 4,302 12,630 5,840Surplus (deficit) of capital funding (C-D) (2,725) (3,005) (5,280) (5,218) (5,331) (5,424) (5,463) (5,641) (5,810) (5,758) (5,970) (6,192)Funding balance ((A-B)+(C-D)) - - - - - - - - - - - -
94 HUTT CITY LONG TERM PLAN <strong>2012</strong>-2022GROUP UTILITY SERVICESGroup Utility Services is responsible for managing the community’s infrastructuralassets in the form of the roading, water supply, wastewater and stormwater networks,agreed levels of service set out in our asset management plans.Roading and TrafficWhat we doOur Roading and Traffic activity includes:• the professional and technical work involved in managing the city’s roading network• the improvement and day-to-day operation and maintenance of footpaths, road pavement/reconstruction/upgrades, traffic signals, signs, street lighting, parking services, bridgemaintenance and various road safety activities.We support this work through policy development, forward planning, road safetycoordination and various quality and safety management systems.Why we do itHaving the road corridor in public ownership ensures that all our residents have appropriateaccess to property and freedom of travel throughout <strong>Hutt</strong> <strong>City</strong>. We provide sealed roads,footpaths and streetlights so that motor vehicles, bicycles and pedestrians can travelefficiently and safely.Effects on community wellbeingThe Roading and Traffic activity promotes economic and cultural wellbeing in particular throughour strategies for growth and development, our asset management plan and our CBD MakingPlaces project. It contributes primarily to our community outcomes of a safe community, astrong and diverse economy, an accessible and connected city, healthy people, and a healthyand attractive built environment. Looking at the potential for negative effects associatedwith this activity, the potential environmental effects of growing transport demand includeintensification of water runoff due to road construction, water runoff pollution from road traffic,particulates from heavy road vehicles, air emissions from road transport and associated healthimpacts, traffic noise and vibration, community severance relating to heavy traffic on strategicand arterial routes, loss of productive and recreational land taken for transport infrastructure,visual intrusion of roads and degradation of amenity values, and public health risks associatedwith traffic accidents. Transport planning considers, and includes actions to mitigate, theseadverse effects.In addition, we carry out crash reduction studies and remedial work on those areas with a highnumber of crashes. Works are undertaken every year to minimise traffic delays and hence airpollution. We are also active in promoting alternative means of transport.The services we provideWe define our customer groups and the level of service provided as:CUSTOMER GROUPPedestrians and mobilityassisted usersCyclistsMotoristsHeavy vehicle driversUtility usersResidents & businessesDevelopersAll usersSERVICE PROVIDEDFootpaths that are smooth and free of hazardsCrossings that are safe and easy to negotiate for all usersCycling lanes that give separation from heavy traffic and safer accessfor cyclists around the cityA roading network that enables easy and comfortable movement forvehicles throughout the city with a high level of safety and a low levelof delaysRoads suitable for heavy transport over all main routes including routesfor over-dimensional vehiclesOrganised and separate spaces, in the berm if possible, for theinstallation and maintenance of underground servicesA roading network that provides convenient access to property anddiscourages inappropriate traffic activity in residential areas<strong>Plan</strong>ned maintenance work that minimises the impact of road workson residents and businessesAdvice on servicing of developmentsA streetscape that is attractive, safe, clean and well lit at nightParking that is conveniently available throughout the city to meet theneeds including those of retailers, shoppers, commuters and visitorsOur customer service standards cover service quality, road safety, service accessibility andresponsiveness, and are contained in our asset management plan.
HUTT CITY LONG TERM PLAN <strong>2012</strong>-202295How we measure the success of our servicesMEASUREResidents’ satisfaction with:• street lighting• roads and gutters beingfree of litter• traffic control• footpaths• roads• parking in and around<strong>Hutt</strong> <strong>City</strong>(measured byindependent survey)‘Road Condition Index’,which measures thecondition of the roadsurface (measured byNZTA). Note: A lowernumber indicates animproved rating‘Quality of Ride’ measuredby the percentage ofthe road network withroughness less than150 NAASRA (NationalAssociation of AustralianState Roading Authorities)counts.Note:1. A higher percentage indicatesan improved rating.2. Effectively half of the cityis surveyed each year,consequently the results fromalternate years should bereferred to for comparisonAccident trend (measuredby NZTA)ACHIEVED2008-0988%91%87%81%75%80%ACHIEVED2009-1088%87%88%80%80%79%ACHIEVED2010-11 TARGET 2011-1291%87%88%84%86%81%88% of thoseexpressing an opinion87% of thoseexpressing an opinion83% of thoseexpressing an opinion79% of thoseexpressing an opinion78% of thoseexpressing an opinion73% of thoseexpressing an opinion1.4 2.0 1.7 Hold or improverating77.7% 80.7% 79.4% Hold or improveratingSeegraphSeegraphSeegraphContribute to areducing trend over10 yearsTARGET<strong>2012</strong>-13 TO 2021-22Better than ourhistorical averageor the average ofour peer councils,whichever is thehigher, for each ofthese measuresHold or improveratingHold or improveratingNote: Previouslythe ‘Smooth TravelExposure’ roughnessindex was used,taking into account thenumber of vehicleson different parts ofthe network. However,NAASRA counts areconsidered the morereliable measure andNZTA now producebenchmarking datarelating to NAASRAcountsContribute to areducing trend over10 yearsNo. Reported Injury CrashesInjury Crashes within Lower <strong>Hutt</strong> excluding State Highways300250200150100500144 149 1531631192001 2002 2003 2004 2005 2006 2007 2008 2009 2010151119242151214166182Trend ofReportedCrashesNumberReportedInjuryCrashesNote: Survey percentages quoted exclude those who responded ‘Don’t know’.
96 HUTT CITY LONG TERM PLAN <strong>2012</strong>-2022Major projects planned<strong>2012</strong>-13COST$0002013-14COST$0002014-15COST$0002015-16COST$0002016-17COST$0002017-18COST$0002018-19COST$0002019-20COST$0002020-21COST$0002021-22COST$0002022-23COST$0002023-24COST$0002024-25COST$0002025-26COST$0002026-27COST$0002027-28COST$0002028-29COST$0002029-30COST$0002030-31COST$0002031-32COST$000Capital ReplacementsCarpark Resurfacing 52 52 53 55 56 58 59 61 62 64 65 67 69 71 73 74 76 78 80 82Estuary Bridge Corrosion Protection888 1,231 932(Subsidy 49%)Footpath Resurfacing & Replacement 210 210 215 220 226 231 237 243 250 257 270 277 284 291 299 307 314 323 331 340Minor Road & Footpath Construction 74 76 78 79 81 83 86 88 90 93 95 97 100 103 105 108 111 114 117 120Minor Safety Works (Subsidy 59%) 52 52 53 55 56 58 59 61 62 64 67 68 70 72 74 76 78 80 82 84Pavement Surfacing (Subsidy 49%) 3,115 3,220 3,277 3,941 4,039 4,140 3,901 4,002 4,110 4,217 4,327 4,439 4,554 4,673 4,794 4,919 5,047 5,178 5,313 5,451Pavements - Area Wide Pavement Treatment 1,733 1,836 1,854 2,703 2,770 2,839 2,604 2,672 2,744 2,815 2,889 2,964 3,041 3,120 3,201 3,284 3,370 3,457 3,547 3,639(Subsidy 49%)Pavements - Road Smoothing (Subsidy 59%) 185 189 194 854 875 897 920 944 970 995 1,021 1,047 1,074 1,102 1,131 1,160 1,191 1,222 1,253 1,286Pavements - Wainuiomata Hill Rd Safety Seal 800 727 792 591 605 620 637 653 671 688 706 724 743 763 782 803 824 845 867 890(Subsidy 49%)Pay & Display Extension 322 330 338 395 405 416 485Pedestrian Crossing Renewal (Subsidy 59%) 31 32 33 33 34 35 36 37 38 39 40 41 42 43 44 45 46 48 49 50Road Reconstruction (Heretaunga Street /1,042High Street) (Subsidy 18%)Road Reconstruction (Out years)838 448 459 483 496 509 523 536 550 564 579 594 610 625 642 658(Queen St 2014/15) (Subsidy 18%)Street Name Sign Replacement20 20 21 21 22 23 23 24 24 25 26 26 27 28 28 29 30 31 32 32(Subsidy 49%)Streetlight Lantern Replacement Programme 51 52 53 55 56 58 59 61 62 64 65 67 69 71 73 74 76 78 80 82(Subsidy 49%)Streetlight Standard Replacement100 102 105 107 110 113 116 119 122 125 128 132 135 139 142 146 150 154 158 162(Subsidy 49%)Traffic Signal Replacement (Subsidy 49%) 150 169 178 183 187 192 197 202 207 213 193 198 203 208 213 219 225 230 236 243
HUTT CITY LONG TERM PLAN <strong>2012</strong>-202297<strong>2012</strong>-13COST$0002013-14COST$0002014-15COST$0002015-16COST$0002016-17COST$0002017-18COST$0002018-19COST$0002019-20COST$0002020-21COST$0002021-22COST$0002022-23COST$0002023-24COST$0002024-25COST$0002025-26COST$0002026-27COST$0002027-28COST$0002028-29COST$0002029-30COST$0002030-31COST$0002031-32COST$000Capital ImprovementsBridge Renewals - Norton Park Ave/Nelson1,387Cres (Subsidy 59%)Bridge Seismic Strengthening (<strong>Hutt</strong> Road806Overbridge) (Subsidy 59%)Bridge Seismic Strengthening (Wingate/697Wainui Rd/Seaview Rd) (Subsidy 59%)Broadband Ducting 21 22 22 23 23 24 24 25 26 26 27 28 28 29 30 31 31 32 33 34CBD (Making Places) (Subsidy 22%) 9,905CBD Riverbank Replacement Parking 880 926Cycleway Network Development351 359 368 377 386 396 406 417 428 439 451 462 474 487 499 512 526 539 553 568(Subsidy 59%)Eastern Bays Shared Path (Subsidy 59%) 604 110 113 116 119 122 125 128 132 135 139 142 146 150 154 158 162Esplanade (Subsidy 58%) 14,308Land Purchase for Roads 10 10 10 11 11 11 12 12 12 13 13 13 14 14 14 15 15 15 16 16Local Area Traffic Management (Subsidy 59%) 51 52 53 55 56 58 59 61 62 64 65 67 69 71 73 74 76 78 80 82New Pedestrian Crossings (Subsidy 59%) 53 54 56 57 58 60 61 63 65 66 68 70 72 73 75 77 79 81 84 86Reconstruction Improvements 314 88 90 95 98 100 103 105 108 111 114 117 120 123 126 129Road Network Improvements (Subsidy 59%) 41,251 7,825 7,225 3,295 3,380 3,468 3,558School Speed Zone Programme60 61 63 64 66 68 69 71 73 75 77 79 81 83 85 88 90 92 95 97(Subsidy 59%)Substandard Road Upgrading (Subsidy 13%) 280 369 336 268 275 282 289 297 305 313 359 369 378 388 398 409 419 430 441 453Traffic Safety Improvements (Subsidy 59%) 400 410 419 429 440 451 463 475 488 501 514 527 541 555 569 584 599 615 631 647Wainuiomata Hill Shared Path (Subsidy 59%) 3,009 831Wainuiomata Hill Summit Bridge(Subsidy 59%)820Operating ProjectsRoading & Traffic Transport Studies 100
98 HUTT CITY LONG TERM PLAN <strong>2012</strong>-2022Prospective income statement for the year ending 30 June: Roading and TrafficESTIMATE<strong>2012</strong>$000BUDGET2013$000FORECAST2014$000FORECAST2015$000FORECAST2016$000FORECAST2017$000FORECAST2018$000FORECAST2019$000FORECAST2020$000FORECAST2021$000FORECAST2022$000REVENUEUser charges 3,536 3,676 3,764 3,855 3,947 4,046 4,147 4,255 4,365 4,483 4,600Operating contributions 3,498 3,504 3,539 3,624 3,876 3,973 4,072 4,178 4,287 4,403 4,517Capital contributions 4,784 4,112 4,214 4,359 5,771 16,198 5,396 6,913 5,843 5,494 5,637Development and financial contributions 30 80 82 84 86 88 90 93 95 98 100Vested Assets 30 200 205 210 215 220 226 231 238 244 250Other revenue 493 515 527 540 553 567 581 596 612 628 644Total revenue 12,371 12,087 12,331 12,672 14,448 25,092 14,512 16,266 15,440 15,350 15,748EXPENDITUREEmployee costs 1,200 1,141 1,168 1,196 1,237 1,268 1,300 1,334 1,368 1,405 1,442Support costs/internal charges 2,094 2,136 2,072 2,118 2,140 2,209 2,213 2,168 2,136 2,128 2,092Operating costs 10,449 10,933 11,093 11,359 11,632 11,922 12,220 12,538 12,864 13,211 13,555Interest expenditure 1,603 1,575 1,528 1,463 1,681 1,836 1,811 1,723 1,591 1,468 1,499Depreciation 10,195 9,771 9,646 10,103 10,605 10,946 11,809 12,387 12,407 12,996 13,569Total expenditure 25,541 25,556 25,507 26,239 27,295 28,181 29,353 30,150 30,366 31,208 32,157DEFICIT BEFORE TAX (13,170) (13,469) (13,176) (13,567) (12,847) (3,089) (14,841) (13,884) (14,926) (15,858) (16,409)ROADING AND TRAFFIC - PROSPECTIVE FUNDING REQUIREMENTRATES FUNDING REQUIREMENTSurplus/(deficit) (13,170) (13,469) (13,176) (13,567) (12,847) (3,089) (14,841) (13,884) (14,926) (15,858) (16,409)Add capital contributions (4,814) (4,192) (4,296) (4,443) (5,857) (16,286) (5,486) (7,006) (5,938) (5,592) (5,737)Total rates funding requirement (17,984) (17,661) (17,472) (18,010) (18,704) (19,375) (20,327) (20,890) (20,864) (21,450) (22,146)LOAN FUNDING REQUIREMENTCapital expenditure - maintaining services (7,106) (6,573) (6,739) (6,906) (11,985) (9,896) (10,144) (8,933) (9,649) (9,909) (10,167)Capital expenditure - improving services (2,328) (2,046) (1,942) (2,025) (1,598) (27,413) (1,552) (5,435) (2,465) (1,678) (1,722)Less capital contributions 4,814 4,192 4,296 4,443 5,857 16,286 5,486 7,006 5,938 5,592 5,737Less depreciation 10,195 9,771 9,646 10,103 10,605 10,946 11,809 12,387 12,407 12,996 13,569Total loan (funding)/repayment 5,575 5,344 5,261 5,615 2,879 (10,077) 5,599 5,025 6,231 7,001 7,417TOTAL FUNDING REQUIREMENT (12,409) (12,317) (12,211) (12,395) (15,825) (29,452) (14,728) (15,865) (14,633) (14,449) (14,729)
HUTT CITY LONG TERM PLAN <strong>2012</strong>-202299Funding impact statement for the year ending 30 June: Roading and TrafficACTUAL2011$000ESTIMATE<strong>2012</strong>$000BUDGET2013$000FORECAST2014$000FORECAST2015$000FORECAST2016$000FORECAST2017$000FORECAST2018$000FORECAST2019$000FORECAST2020$000FORECAST2021$000FORECAST2022$000Sources of operating fundingGeneral rates, uniform annual general charges, rates penalties 17,771 18,014 17,861 17,677 18,220 18,919 19,595 20,553 21,121 21,102 21,694 22,396Targeted rates (other than a targeted rate for water supply) - - - - - - - - - - - -Subsidies and grants for operating purposes 3,409 3,498 3,504 3,539 3,624 3,876 3,973 4,072 4,178 4,287 4,403 4,517Fees, charges and targeted rates for water supply 3,208 3,536 3,676 3,764 3,855 3,947 4,046 4,147 4,255 4,365 4,483 4,600Internal charges and overheads recovered - - - - - - - - - - - -Local authorities fuel tax, fines, infringement fees, and other receipts 516 493 515 527 540 553 567 581 596 612 628 644Total operating funding (A) 24,904 25,541 25,556 25,507 26,239 27,295 28,181 29,353 30,150 30,366 31,208 32,157Applications of operating fundingPayments to staff and suppliers 11,526 11,649 12,074 12,261 12,555 12,869 13,190 13,520 13,872 14,232 14,616 14,997Finance costs 1,509 1,603 1,575 1,528 1,463 1,681 1,836 1,811 1,723 1,591 1,468 1,499Internal charges and overheads applied 2,142 2,094 2,136 2,072 2,118 2,140 2,209 2,213 2,168 2,136 2,128 2,092Other operating funding applications - - - - - - - - - - - -Total applications of operating funding (B) 15,177 15,346 15,785 15,861 16,136 16,690 17,235 17,544 17,763 17,959 18,212 18,588Surplus (deficit) of operating funding (A-B) 9,727 10,195 9,771 9,646 10,103 10,605 10,946 11,809 12,387 12,407 12,996 13,569Sources of capital fundingSubsidies and grants for capital expenditure 3,846 4,784 4,112 4,214 4,359 5,771 16,198 5,396 6,913 5,843 5,494 5,637Development and financial contributions 7 30 80 82 84 86 88 90 93 95 98 100Increase (decrease) in debt (5,345) (5,575) (5,344) (5,261) (5,615) (2,879) 10,077 (5,599) (5,025) (6,231) (7,001) (7,417)Gross proceeds from sale of assets - - - - - - - - - - - -Lump sum contributions - - - - - - - - - - - -Total sources of capital funding ( C ) (1,492) (761) (1,152) (965) (1,172) 2,978 26,363 (113) 1,981 (293) (1,409) (1,680)Application of capital fundingCapital expenditure- to meet additional demand- to improve level of service 1,324 2,328 2,046 1,942 2,025 1,598 27,413 1,552 5,435 2,465 1,678 1,722- to replace existing assets 6,911 7,106 6,573 6,739 6,906 11,985 9,896 10,144 8,933 9,649 9,909 10,167Increase (decrease) in reserves - - - - - - - - - - - -Increase (decrease) of investments - - - - - - - - - - - -Total applications of capital funding (D) 8,235 9,434 8,619 8,681 8,931 13,583 37,309 11,696 14,368 12,114 11,587 11,889Surplus (deficit) of capital funding (C-D) (9,727) (10,195) (9,771) (9,646) (10,103) (10,605) (10,946) (11,809) (12,387) (12,407) (12,996) (13,569)Funding balance ((A-B)+(C-D)) - - - - - - - - - - - -
100 HUTT CITY LONG TERM PLAN <strong>2012</strong>-2022Water SupplyWhat we doWe provide a sustainable and high-quality water supply to our community for domestic andcommercial use. We buy bulk water from Greater Wellington Regional <strong>Council</strong> (GWRC),then distribute it to the community through our water supply system. We regularly monitorthe water quality and plan for the city’s future water supply, including any maintenance andupgrades needed to maintain the required service.Why we do itIn supplying high-quality, affordable water, we contribute to:• our community’s health• community safety (through the water supply system’s fire-fighting capability)• industrial and residential development.Effects on community wellbeingThe Water Supply activity promotes economic and environmental wellbeing in particularthrough our Environmental Sustainability Strategy and our asset management plan. Itcontributes primarily to our community outcomes of a strong and diverse economy, anaccessible and connected city, healthy people, a healthy natural environment, and strongand inclusive communities. Looking at the potential for negative effects associated with thisactivity, degradation of watercourses due to the rate of extraction of water, and degradationof habitats affected by construction or management requirements for water sources, arepotentially significant negative effects.The services we provideWe define our customer groups and the service provided as:CUSTOMER GROUPResidents and ratepayersCommercial water usersIndustrial water usersDevelopersNew Zealand Fire ServiceSERVICE PROVIDEDReticulated water supplyFirefighting supplyTe Puna Wai Ora natural water supplyDrinking water supplyFirefighting supplyDrinking water supplyIndustrial water supplyFirefighting supplyAdvice on servicing of developmentsFirefighting supplyOur customer service standards cover water quality, service availability, courtesy and targetresponse times, and are contained in our asset management plan.GWRC is responsible for the extraction, treatment and supply of water into the city’s watersupply system. Extraction is managed to ensure that potential adverse effects are minimisedto acceptable levels. We will contribute towards managing the demand for water and thereforethe requirement to develop new water sources through water conservation programmes,playing a leading role (through Capacity) in regional initiatives to manage the demand forwater in the Wellington region, and supporting a bulk water charging system that incorporatesincentives for water conservation.
HUTT CITY LONG TERM PLAN <strong>2012</strong>-2022101How we measure the success of our servicesMEASUREResidents’ satisfactionwith the city water supply(measured by independentsurvey)Compliance withNew Zealand DrinkingWater StandardsQuality of water(measured by Ministry ofHealth)Note: ‘b’ grading meansa satisfactory, low levelof risk. Most of <strong>Hutt</strong><strong>City</strong> water supply is unchlorinated.Chlorination ofthe water supply would berequired to achieve an `a’gradingACHIEVED2008-09ACHIEVED2009-10ACHIEVED2010-11TARGET2011-1295% 97% 98% 95%of thoseexpressingan opinionAchievedfullcompliancewith 1587of the1590 testscarried outAchieved a‘b’ gradingfrom theMinistry ofHealth forthe <strong>Hutt</strong><strong>City</strong> watersupplydistributionAchievedfullcomplianceAchieved a‘b’ gradingfrom theMinistry ofHealth forthe <strong>Hutt</strong><strong>City</strong> watersupplydistributionAchievedfullcomplianceAchieved a‘b’ gradingfrom theMinistry ofHealth forthe <strong>Hutt</strong><strong>City</strong> watersupplydistributionFullcomplianceAchieve a‘b’ gradingfrom theMinistry ofHealth forthe <strong>Hutt</strong><strong>City</strong> watersupplyTARGET<strong>2012</strong>-13 TO2021-2295%of thoseexpressingan opinionFullcomplianceAchieve a‘b’ gradingfrom theMinistry ofHealth forthe <strong>Hutt</strong><strong>City</strong> watersupplyProvide a reliable watersupply service (measuredby contract reports)Respond promptly towater supply disruptions(measured by contractreports)Maintain the averageun-metered waterconsumption in <strong>Hutt</strong> <strong>City</strong>Achieved1.99unplannedsupply cutsper 1000connectionsAchieved2.415unplannedsupply cutsper 1000connectionsAchieved2.61unplannedsupply cutsper 1000connectionsFewerthan fourunplannedsupply cutsper 1000connections98% 99% 99.53% 97% ofrequestsrespondedto withinone hour ofnotificationNotmeasuredAchieved304 litresper headper dayAchieved308 litresper headper dayLess than350 litresper headper dayFewerthan fourunplannedsupply cutsper 1000connections97% ofrequestsrespondedto withinone hour ofnotificationLess than350 litresper headper dayNote: Survey percentages quoted exclude those who responded ‘Don’t know’. We work to meet these measures through Capacity.
102 HUTT CITY LONG TERM PLAN <strong>2012</strong>-2022Major projects planned<strong>2012</strong>-13COST$0002013-14COST$0002014-15COST$0002015-16COST$0002016-17COST$0002017-18COST$0002018-19COST$0002019-20COST$0002020-21COST$0002021-22COST$0002022-23COST$0002023-24COST$0002024-25COST$0002025-26COST$0002026-27COST$0002027-28COST$0002028-29COST$0002029-30COST$0002030-31COST$0002031-32COST$000Capital ReplacementsHoroeka Street - Main/Rider/Services Renewal 330Kelson Pumping Station Renewal 153 154Knights Road Emergency Main - Rider/600Services RenewalsKonini Road Reservoir Outlet Main - Main/ 147Services RenewalsNetwork Minor Works 150Network Renewals 1,828 1,982 2,034 2,284 2,454 2,733 2,826 2,903 2,978 3,056 3,135 3,216 3,300 3,386 3,474 3,564 3,657 3,752 3,882Pumping Station Minor Works 51 51 52 54 55 56 58 59 73 75 77 79 81 97 100 102 105 108 126 129Rahui Pumping Station Switchboard Renewal 95Reservoir Minor Works 51 201 118 54 55 56 58 59 73 75 77 79 81 97 100 102 105 108 126 129Scada Renewals 26 26 26 27 165 28 35 36 37 38 39 46 47 49 50 51 60 61 63 65Stokes Valley Road - Main/Rider/Services 320RenewalsStokes Valley Road Pumping Station54Switchboard RenewalTawhai Street - Main/Rider/Services Renewals 170Capital ImprovementsCritical Pipelines Seismic Upgrade 770 790 811 832 854 876 899 922 946 970Eastern Bays Reservoir Upgrade Design/169 1,544 1,585 1,627Consents/ConstructionEmergency Supply Point (Valving) 82Emergency Water Storage Tanks 154Emergency Water Supply 321 338 356Gracefield/Point Howard Link Main 659Kelson/Fairway Drive Link Main 358Naenae Reservoir Construction 270 2,773 5,691Normandale Reservoir Upgrade 143 338 1,505Petone/<strong>Hutt</strong> Link Main (Tama North) 537Point Howard Reservoir Construction 438 1,498Point Howard Reservoir Roof Upgrade 642
HUTT CITY LONG TERM PLAN <strong>2012</strong>-2022103<strong>2012</strong>-13COST$0002013-14COST$0002014-15COST$0002015-16COST$0002016-17COST$0002017-18COST$0002018-19COST$000Pumping Stations Energy Conservation 257 263 270 277Rata Reservoir Roof & Seismic Upgrade 385Reservoir Seismic Upgrade - Delaney698ReservoirReservoir Seismic Upgrade - Gawler Reservoir 922Reservoir Seismic Upgrade - Kamahi Reservoir 647Reservoir Seismic Upgrade - Kingsley550ReservoirReservoir Seismic Upgrade - Konini Reservoir 834Reservoir Seismic Upgrade - Korokoro473ReservoirReservoir Seismic Upgrade - Manor Park307ReservoirReservoir Seismic Upgrade - Park Road899ReservoirReservoir Seismic Upgrade - Sunville365ReservoirReservoir Seismic Upgrade - Taita Reservoir 698Reservoir Seismic Upgrade - Titiro Moana485ReservoirSeaview/Petone Link Main 1,844Sweetacres Reservoir Upgrade 1,112Sweetacres Watermain Upgrade 575Tirohanga Reservoir Construction 615Water Conservation 321 329 3382019-20COST$0002020-21COST$0002021-22COST$0002022-23COST$0002023-24COST$0002024-25COST$0002025-26COST$0002026-27COST$0002027-28COST$0002028-29COST$0002029-30COST$0002030-31COST$0002031-32COST$000
104 HUTT CITY LONG TERM PLAN <strong>2012</strong>-2022Prospective income statement for the year ending 30 June: Water SupplyESTIMATE<strong>2012</strong>$000BUDGET2013$000FORECAST2014$000FORECAST2015$000FORECAST2016$000FORECAST2017$000FORECAST2018$000FORECAST2019$000FORECAST2020$000FORECAST2021$000FORECAST2022$000REVENUEUser charges 2,310 2,310 2,365 2,422 2,480 2,542 2,606 2,674 2,743 2,817 2,890Development and financial contributions 15 40 41 42 43 44 45 46 48 49 50Vested Assets 100 100 102 105 107 110 113 116 119 122 125Total revenue 2,425 2,450 2,508 2,569 2,630 2,696 2,764 2,836 2,910 2,988 3,065EXPENDITURESupport costs/internal charges 311 372 361 369 372 385 385 377 372 370 364Operating costs 9,978 10,360 10,874 11,418 11,993 12,614 13,272 13,982 14,736 15,550 16,398Interest expenditure 337 331 321 307 353 385 380 362 334 308 315Depreciation 3,065 3,258 3,196 3,169 3,182 3,227 3,251 3,274 3,311 3,351 3,392Total expenditure 13,691 14,321 14,752 15,263 15,900 16,611 17,288 17,995 18,753 19,579 20,469DEFICIT BEFORE TAX (11,266) (11,871) (12,244) (12,694) (13,270) (13,915) (14,524) (15,159) (15,843) (16,591) (17,404)WATER SUPPLY - PROSPECTIVE FUNDING REQUIREMENTRATES FUNDING REQUIREMENTSurplus/(deficit) (11,266) (11,871) (12,244) (12,694) (13,270) (13,915) (14,524) (15,159) (15,843) (16,591) (17,404)Add capital contributions (15) (40) (41) (42) (43) (44) (45) (46) (48) (49) (50)Total rates funding requirement (11,281) (11,911) (12,285) (12,736) (13,313) (13,959) (14,569) (15,205) (15,891) (16,640) (17,454)LOAN FUNDING REQUIREMENTCapital expenditure - maintaining services (2,014) (1,998) (2,259) (2,179) (2,222) (2,559) (2,595) (2,883) (3,076) (3,086) (3,166)Capital expenditure - improving services (200) (440) (154) - (2,767) (1,805) (1,083) (1,505) (1,544) (1,585) (1,627)Less capital contributions 15 40 41 42 43 44 45 46 48 49 50Less depreciation 3,065 3,258 3,196 3,169 3,182 3,227 3,251 3,274 3,311 3,351 3,392Total loan (funding)/repayment 866 860 824 1,032 (1,764) (1,093) (382) (1,068) (1,261) (1,271) (1,351)TOTAL FUNDING REQUIREMENT (10,415) (11,051) (11,461) (11,704) (15,077) (15,052) (14,951) (16,273) (17,152) (17,911) (18,805)
HUTT CITY LONG TERM PLAN <strong>2012</strong>-2022105Funding impact statement for the year ending 30 June: Water SupplyACTUAL2011$000ESTIMATE<strong>2012</strong>$000BUDGET2013$000FORECAST2014$000FORECAST2015$000FORECAST2016$000FORECAST2017$000FORECAST2018$000FORECAST2019$000FORECAST2020$000FORECAST2021$000FORECAST2022$000Sources of operating fundingGeneral rates, uniform annual general charges, rates penalties - - - - - - - - - - - -Targeted rates (other than a targeted rate for water supply) 11,065 11,381 12,010 12,387 12,841 13,420 14,069 14,682 15,321 16,010 16,762 17,579Subsidies and grants for operating purposes - - - - - - - - - - - -Fees, charges and targeted rates for water supply 2,049 2,310 2,310 2,365 2,422 2,480 2,542 2,606 2,674 2,743 2,817 2,890Internal charges and overheads recovered - - - - - - - - - - - -Local authorities fuel tax, fines, infringement fees, and other receipts - - - - - - - - - - - -Total operating funding (A) 13,114 13,691 14,320 14,752 15,263 15,900 16,611 17,288 17,995 18,753 19,579 20,469Applications of operating fundingPayments to staff and suppliers 9,259 9,978 10,360 10,874 11,418 11,993 12,614 13,272 13,982 14,736 15,550 16,398Finance costs 521 337 330 321 307 353 385 380 362 334 308 315Internal charges and overheads applied 306 311 372 361 369 372 385 385 377 372 370 364Other operating funding applications - - - - - - - - - - - -Total applications of operating funding (B) 10,086 10,626 11,062 11,556 12,094 12,718 13,384 14,037 14,721 15,442 16,228 17,077Surplus (deficit) of operating funding (A-B) 3,028 3,065 3,258 3,196 3,169 3,182 3,227 3,251 3,274 3,311 3,351 3,392Sources of capital fundingSubsidies and grants for capital expenditure - - - - - - - - - - - -Development and financial contributions 3 15 40 41 42 43 44 45 46 48 49 50Increase (decrease) in debt (1,330) (866) (860) (824) (1,032) 1,764 1,093 382 1,068 1,261 1,271 1,351Gross proceeds from sale of assets - - - - - - - - - - - -Lump sum contributions - - - - - - - - - - - -Total sources of capital funding ( C ) (1,327) (851) (820) (783) (990) 1,807 1,137 427 1,114 1,309 1,320 1,401Application of capital fundingCapital expenditure- to meet additional demand- to improve level of service 207 200 440 154 - 2,767 1,805 1,083 1,505 1,544 1,585 1,627- to replace existing assets 1,494 2,014 1,998 2,259 2,179 2,222 2,559 2,595 2,883 3,076 3,086 3,166Increase (decrease) in reserves - - - - - - - - - - - -Increase (decrease) of investments - - - - - - - - - - - -Total applications of capital funding (D) 1,701 2,214 2,438 2,413 2,179 4,989 4,364 3,678 4,388 4,620 4,671 4,793Surplus (deficit) of capital funding (C-D) (3,028) (3,065) (3,258) (3,196) (3,169) (3,182) (3,227) (3,251) (3,274) (3,311) (3,351) (3,392)Funding balance ((A-B)+(C-D)) - - - - - - - - - - - -
106 HUTT CITY LONG TERM PLAN <strong>2012</strong>-2022WastewaterWhat we doWe provide a piping network that takes household and commercial effluent to the SeaviewWastewater Treatment <strong>Plan</strong>t, which treats it to public health and environmental standards.Opened in November 2001, the resource consents under which the treatment plant nowoperates ensure that all relevant standards are adhered to, and that full compliance with theResource Management Act 1991 is achieved. The plant’s operation has led to a significantimprovement in the environment. We regularly undertake maintenance and upgrades tomaintain the required service levels.Why we do itBy collecting, treating and disposing of wastewater, we provide a service to residents andbusinesses that supports development in the city and protects the physical environment andour community’s health.Effects on community wellbeingThe Wastewater activity promotes economic and environmental wellbeing in particular throughour Environmental Sustainability Strategy and our asset management plan. It contributesprimarily to our community outcomes of a strong and diverse economy, an accessible andconnected city, healthy people, a healthy natural environment, and strong and inclusivecommunities. Looking at the potential for negative effects associated with this activity, thedischarge of odours from the wastewater infrastructure, overflows from the wastewatersystem at variance with cultural values of iwi, and degradation of watercourses due tooverflows from the wastewater system, are potentially significant negative effects.Discharges to air are controlled through the resource consent process and rules in theRegional Air Quality Management <strong>Plan</strong>. The discharge of odours from the wastewaterinfrastructure is unlikely to be of an extent that would cause environmental degradation butmay be offensive to the community. Odour control systems have been fitted to parts of thewastewater infrastructure where odour problems have been experienced. Reports of odourare monitored through the HCC Request for Service system and through reports from thewastewater system maintenance and operations contractor.Areas where overflows due to wet weather overloading of the wastewater system have beenexperienced are being progressively upgraded using a combination of measures. These includereducing wet weather discharges from private drains, upgrading pipelines and the provisionof wet weather storage. Upgrading is carried out through the asset renewal programme,which provides for the replacement of every wastewater pipeline as it reaches the end of itsuseful life, and through the asset development programme, which reflects long term demandprojections for the wastewater system.The services we provideWe define our customer groups and the service provided as:CUSTOMER GROUPResidentsCommercial propertiesIndustriesDevelopersSERVICE PROVIDEDReticulated domestic wastewater disposalReticulated wastewater disposalCommercial (trade waste) wastewater disposalReticulated wastewater disposalIndustrial (trade waste) wastewater disposalAdvice on servicing of developmentsOur customer service standards cover service availability, courtesy, responsiveness andenvironmental protection, and are contained in our asset management plan.How we measure the success of our servicesMEASUREResidents’ satisfactionwith the city wastewaterservice (measured byindependent survey)No resource consentrelatedinfringementnotices received fromGWRCProvide a reliablewastewater service(measured by contractreports)Respond promptly towastewater disruptions(measured by contractreports)ACHIEVED2008-09ACHIEVED2009-10ACHIEVED2010-11TARGET2011-1297% 95% 97% 95%of thoseexpressingan opinion100%complianceAchieved0.7975incidents100%complianceAchieved0.875incidents100%complianceAchieved1.01incidents100%complianceFewerthan 1.2wastewaterincidentsreported perkilometre ofwastewaterreticulationpipeline98% 96% 99.93% 97% ofrequestsrespondedto withinone hour ofnotificationNote: Survey percentages quoted exclude those who responded ‘Don’t know’.We work to meet these measures through Capacity.TARGET<strong>2012</strong>-13 TO2021-2295%of thoseexpressingan opinion100%complianceFewerthan 1.2wastewaterincidentsreported perkilometre ofwastewaterreticulationpipeline97% ofrequestsrespondedto withinone hour ofnotification
HUTT CITY LONG TERM PLAN <strong>2012</strong>-2022107Major projects planned<strong>2012</strong>-13COST$0002013-14COST$0002014-15COST$0002015-16COST$0002016-17COST$0002017-18COST$0002018-19COST$0002019-20COST$0002020-21COST$0002021-22COST$0002022-23COST$0002023-24COST$0002024-25COST$0002025-26COST$0002026-27COST$0002027-28COST$0002028-29COST$0002029-30COST$0002030-31COST$0002031-32COST$000Capital ReplacementsHoward Road Sewer Renewal 110Local Pumping Stations 82 82 84 86 88 90 93 95 98 100 116 119 122 125 128 146 150 154 158 162Minor Asset Renewals 170Naenae Sewer Renewals 300Pressure Testing of Sewers 300Scada 27 27 27 28 220 29 30 31 32 33 39 40 41 42 43 58 60 61 63 65Total Renewal Network 2,443 2,723 3,144 3,417 3,514 3,623 3,735 3,860 3,986 4,108 4,248 4,531 4,829 5,135 5,443 5,747 6,040 6,318 6,576Trunk DBO Asset Replacement Fund1,190 1,219 1,216 886 908 931 955 980 1,006 1,032 967 992 1,018 1,044 1,071 1,099 1,128 1,157 1,187 1,218(Subsidy 25%)Trunk DBO Network Cyclic Replacement 300 307 315 322 660 347 356 366 375 385 395 405 416 427 438 449 461 473 485(Subsidy 32%)Trunk Main Outfall Pipeline Renewal231 14,391 46,708(Subsidy 29%)Trunk Non DBO Minor Works (Subsidy 30%) 10Trunk Resource Consent Renewals56 116 128 75 158(Subsidy 31%)Vista Grove Sewer Replacement290(Carryover from 2011/<strong>2012</strong>)Wainuiomata Catchment Sewer Renewals 2,040Wainuiomata Catchment Sewer Renewals 500(Carryover from 2011/<strong>2012</strong>)Capital ImprovementsAdditional Storage Tanks 642 659 676 693 711 730 749 768 788 809Pumping Stations Energy Conservation 257 263 270 277Sewer Mains Upgrade 770 790 811 832 854 876 899 922 946 970Trunk DBO Type A Network Development 600(Carryover from 2011/<strong>2012</strong>)Trunk Main Outfall Pipeline Boost Pumping1,021 15,611Station (Subsidy 29%)Trunk Type A Asset Development600 205 210 215 220 282 752 238 244 250 257 1,449 11,960 277 285 292 1,528 1,567 19,233 323(Subsidy 32%)Trunk Type B Network Development250 666 472 3,060 220 226 231 297 2,195 13,764 899 14,753 13,785 277 285 292 300 307 315 323(Subsidy 32%)Operating ProjectsDBO Main Outfall Leak Investigation & Repairs 284(Subsidy 30%) (Carryover from 2011/<strong>2012</strong>)Rising Main Vulnerability Assessment 100Wastewater Flow Management Wainuiomata 170
108 HUTT CITY LONG TERM PLAN <strong>2012</strong>-2022Prospective income statement for the year ending 30 June: WastewaterESTIMATE<strong>2012</strong>$000BUDGET2013$000FORECAST2014$000FORECAST2015$000FORECAST2016$000FORECAST2017$000FORECAST2018$000FORECAST2019$000FORECAST2020$000FORECAST2021$000FORECAST2022$000REVENUEUser charges 829 1,084 1,110 1,137 1,164 1,193 1,223 1,255 1,287 1,322 1,356Upper <strong>Hutt</strong> CC operating contribution 2,363 2,420 2,391 2,448 2,507 2,569 2,634 2,702 2,772 2,847 2,921Development and financial contributions 160 410 420 430 440 451 463 475 487 500 513Vested Assets 100 100 102 105 107 110 113 116 119 122 125Other revenue - - - - - - - - - - -Total revenue 3,452 4,014 4,023 4,120 4,218 4,323 4,433 4,548 4,665 4,791 4,915EXPENDITURESupport costs/internal charges 541 833 808 826 834 861 863 845 833 830 816Operating costs 11,211 11,374 11,182 11,450 11,725 12,018 12,319 12,639 12,968 13,318 13,664Interest expenditure 816 808 784 750 862 942 929 884 816 753 769Depreciation 6,531 6,662 6,554 6,513 6,510 6,516 6,488 6,469 6,472 6,881 7,444Total expenditure 19,099 19,677 19,328 19,539 19,931 20,337 20,599 20,837 21,089 21,782 22,693DEFICIT BEFORE TAX (15,647) (15,663) (15,305) (15,419) (15,713) (16,014) (16,166) (16,289) (16,424) (16,991) (17,778)WASTEWATER - PROSPECTIVE FUNDING REQUIREMENTRATES FUNDING REQUIREMENTSurplus/(deficit) (15,647) (15,663) (15,305) (15,419) (15,713) (16,014) (16,166) (16,289) (16,424) (16,991) (17,778)Add capital contributions (160) (410) (420) (430) (440) (451) (463) (475) (487) (500) (513)Total rates funding requirement (15,807) (16,073) (15,725) (15,849) (16,153) (16,465) (16,629) (16,764) (16,911) (17,491) (18,291)LOAN FUNDING REQUIREMENTCapital expenditure - maintaining services (4,904) (4,529) (4,077) (4,365) (4,466) (5,294) (4,621) (5,395) (5,197) (19,752) (5,526)Capital expenditure - improving services (797) (850) (870) (682) (3,275) (440) (508) (984) (1,556) (18,050) (14,015)Less capital contributions 160 410 420 430 440 451 463 475 487 500 513Less UHCC capital contribution 363 666 696 638 1,363 553 405 762 813 9,751 4,854Less depreciation 6,531 6,662 6,554 6,513 6,510 6,516 6,488 6,469 6,472 6,881 7,444Total loan (funding)/repayment 1,353 2,359 2,723 2,534 572 1,786 2,227 1,327 1,019 (20,670) (6,730)TOTAL FUNDING REQUIREMENT (14,454) (13,714) (13,002) (13,315) (15,581) (14,679) (14,402) (15,437) (15,892) (38,161) (25,021)
HUTT CITY LONG TERM PLAN <strong>2012</strong>-2022109Funding impact statement for the year ending 30 June: WastewaterACTUAL2011$000ESTIMATE<strong>2012</strong>$000BUDGET2013$000Sources of operating fundingGeneral rates, uniform annual general charges, rates penalties - - - - - - - - - - - -Targeted rates (other than a targeted rate for water supply) 15,021 15,907 16,173 15,827 15,954 16,260 16,575 16,742 16,880 17,030 17,613 18,416Subsidies and grants for operating purposes 2,102 2,363 2,420 2,391 2,448 2,507 2,569 2,634 2,702 2,772 2,847 2,921Fees, charges and targeted rates for water supply 805 829 1,084 1,110 1,137 1,164 1,193 1,223 1,255 1,287 1,322 1,356Internal charges and overheads recovered - - - - - - - - - - - -Local authorities fuel tax, fines, infringement fees, and other receipts - - - - - - - - - - - -Total operating funding (A) 17,928 19,099 19,677 19,328 19,539 19,931 20,337 20,599 20,837 21,089 21,782 22,693Applications of operating fundingPayments to staff and suppliers 9,923 11,211 11,374 11,182 11,450 11,725 12,018 12,319 12,639 12,968 13,318 13,664Finance costs 975 816 808 784 750 862 942 929 884 816 753 769Internal charges and overheads applied 544 541 833 808 826 834 861 863 845 833 830 816Other operating funding applications - - - - - - - - - - - -Total applications of operating funding (B) 11,442 12,568 13,015 12,774 13,026 13,421 13,821 14,111 14,368 14,617 14,901 15,249Surplus (deficit) of operating funding (A-B) 6,486 6,531 6,662 6,554 6,513 6,510 6,516 6,488 6,469 6,472 6,881 7,444Sources of capital fundingSubsidies and grants for capital expenditure 662 363 666 696 638 1,363 553 405 762 813 9,751 4,854Development and financial contributions 46 160 410 420 430 440 451 463 475 487 500 513Increase (decrease) in debt (5,066) (1,353) (2,359) (2,723) (2,534) (572) (1,786) (2,227) (1,327) (1,019) 20,670 6,730Gross proceeds from sale of assets - - - - - - - - - - - -Lump sum contributions - - - - - - - - - - - -Total sources of capital funding ( C ) (4,358) (830) (1,283) (1,607) (1,466) 1,231 (782) (1,359) (90) 281 30,921 12,097Application of capital fundingCapital expenditure- to meet additional demand- to improve level of service 378 797 850 870 682 3,275 440 508 984 1,556 18,050 14,015- to replace existing assets 1,750 4,904 4,529 4,077 4,365 4,466 5,294 4,621 5,395 5,197 19,752 5,526Increase (decrease) in reserves - - - - - - - - - - - -Increase (decrease) of investments - - - - - - - - - - - -Total applications of capital funding (D) 2,128 5,701 5,379 4,947 5,047 7,741 5,734 5,129 6,379 6,753 37,802 19,541Surplus (deficit) of capital funding (C-D) (6,486) (6,531) (6,662) (6,554) (6,513) (6,510) (6,516) (6,488) (6,469) (6,472) (6,881) (7,444)Funding balance ((A-B)+(C-D)) - - - - - - - - - - - -FORECAST2014$000FORECAST2015$000FORECAST2016$000FORECAST2017$000FORECAST2018$000FORECAST2019$000FORECAST2020$000FORECAST2021$000FORECAST2022$000
110 HUTT CITY LONG TERM PLAN <strong>2012</strong>-2022StormwaterWhat we doWe provide a stormwater drainage system to manage the surface water run-off from urbancatchments, providing flood protection and control. Our objective is to achieve the bestpossible balance between the level of protection and the cost to our community. This includesmaintaining and upgrading assets to maintain the required service levels.Why we do itMost of the development in <strong>Hutt</strong> <strong>City</strong> is concentrated on flat valley plains with the potentialfor flooding. We need to control stormwater to protect our community’s health and safety andminimise property damage. A comprehensive stormwater system is the most efficient way todo this.Effects on community wellbeingThe Stormwater activity promotes economic and environmental wellbeing in particular throughour Environmental Sustainability Strategy and our asset management plan. It contributesprimarily to our community outcomes of a safe community, a strong and diverse economy,an accessible and connected city, healthy people, a healthy natural environment, strong andinclusive communities, and a healthy and attractive built environment. Looking at the potentialfor negative effects associated with this activity, the discharge of contaminants in stormwaterto watercourses, and flooding when the capacity of the stormwater system is exceeded, arepotentially significant negative effects.Pollution prevention programmes, road cleaning programmes and debris pits incorporatedin the majority of inlets to the stormwater system all assist in minimising the entry ofcontaminants, and are supplemented by our monitoring regime. The stormwater system isdesigned to standards which reflect the level of risk at different locations and are comparableto design standards in other New Zealand cities. The asset development programmeprogressively addresses gaps between the current levels of protection and target designstandards. We also work with Greater Wellington Regional <strong>Council</strong> with respect to floodingissues associated with watercourses under Regional <strong>Council</strong> management.The services we provideWe define our customer groups and the service provided as:CUSTOMER GROUPResidentsCommercialpropertiesIndustriesDevelopersSERVICE PROVIDEDReticulated primary stormwater systemMinimising the adverse effect of stormwater runoff that exceeds thecapacity of the primary stormwater systemManaging environmental effects of stormwater dischargesReticulated primary stormwater systemMinimising the adverse effect of stormwater runoff that exceeds thecapacity of the primary stormwater systemManaging environmental effects of stormwater dischargesReticulated primary stormwater systemMinimising the adverse effect of stormwater runoff that exceeds thecapacity of the primary stormwater systemManaging environmental effects of stormwater dischargesAdvice on servicing of developmentsOur customer service standards cover service availability, courtesy, target response times andenvironmental protection, and are contained in our asset management plan.How we measure the success of our servicesMEASUREResidents’satisfaction withthe city stormwaterservice (measured byindependent survey)Provide a reliablestormwater service(measured by contractreports)Achieve water qualityat main recreationalbeaches (measured bycontract reports)Respond promptlyto stormwaterdisruptions (measuredby contract reports)ACHIEVED2008-09ACHIEVED2009-10ACHIEVED2010-11TARGET2011-1281% 83% 87% 80% of thoseexpressing anopinionAchieved0.1287incidentsAchievedRecreationalWaterQualityStandardsAchieved0.169incidentsAchieved0.13incidentsAchieved AchievedRecreationalWater QualityStandardson 95% ofsampling daysRecreationalWater QualityStandardson 94% ofsampling daysFewer than 0.5stormwaterincidentsreported perkilometre ofstormwaterpipeline90% ofsampling dayswhen waterquality meetsMinistry for theEnvironmentguidelines99% 98% 99.75% 97% of requestsresponded towithin one hourof notificationNote: Survey percentages quoted exclude those who responded ‘Don’t know’.We work to meet these measures through Capacity.TARGET<strong>2012</strong>-13 TO 2021-2280% of thoseexpressing anopinionFewer than 0.5stormwaterincidentsreported perkilometre ofstormwaterpipeline90% ofsampling dayswhen waterquality meetsMinistry for theEnvironmentguidelines97% of requestsresponded towithin one hourof notification
HUTT CITY LONG TERM PLAN <strong>2012</strong>-2022111Major projects planned<strong>2012</strong>-13COST$0002013-14COST$0002014-15COST$0002015-16COST$0002016-17COST$0002017-18COST$0002018-19COST$0002019-20COST$0002020-21COST$0002021-22COST$0002022-23COST$0002023-24COST$0002024-25COST$0002025-26COST$0002026-27COST$0002027-28COST$0002028-29COST$0002029-30COST$0002030-31COST$0002031-32COST$000Capital ReplacementsGodley Street - Bauchop Street Stormwater Renewals 153Jessie Street (Jackson Street to the Esplanade) 371Minor Works 123Scada 26 26 26 27 165 28 29 30 30 31 39 40 41 42 43 58 60 61 63 65Total Renewals Network 648 661 673 686 699 714 730 751 770 802 823 845 901 929 994 1,070 1,161 1,265 1,386Total Renewals Utilities 77 77 79 81 83 85 87 89 91 94 103 105 108 111 114 131 135 138 142 146Capital ImprovementsAwamutu Stream 613 512 524 537 1,981 1,354 1,042 594 642 659Beach Stormwater Outlets 440 1,634Boulcott Stopbank Project - HCC Contribution 348Cheviot Road Stormwater Improvement Project 102Climate Change Project 711 730 749 768 788 809Dowse Drive Stormwater Improvement 550 564Dowse Drive Stormwater Improvement330(Carryover from 2011/<strong>2012</strong>)East Street, Petone 97Heketara Street/Pukatea Street 672<strong>Hutt</strong> River Backflow Electrical 205 215 226<strong>Hutt</strong> River Floodplain 256 262 268 308 316 324 642 659 676<strong>Hutt</strong> River Stormwater Flapgates/Pumping Stations 268 603 619 635 652 669 686 704 722 741 760Manuka Street 629Melling Road Pumping Station 579 594Percy Cameron Street 405Pumping Stations Energy Conservation 257 263 270 277Queen Street 816Randwick Road Stormwater Improvement 376Rutherford Street 579 594SH2 - Korokoro Catchment Flood Mitigation 642 659 676 693 711 730 749 768 1,576 1,617Stokes Valley Catchment Flood Mitigation 1,553 1,594 1,635 1,678 1,721 1,766 1,812 1,859 1,908 1,957Stormwater Quality 749 768 788 809The Esplanade Upgrade 1,138Upper Kelson Catchment 770Victoria Street/Hume Street 695Waiwhetu Catchment 642 659 676 693 711Operating ProjectsWaiwhetu Stream Flood Management <strong>Plan</strong> 50
112 HUTT CITY LONG TERM PLAN <strong>2012</strong>-2022Prospective income statement for the year ending 30 June: StormwaterESTIMATE<strong>2012</strong>$000BUDGET2013$000FORECAST2014$000FORECAST2015$000FORECAST2016$000FORECAST2017$000FORECAST2018$000FORECAST2019$000FORECAST2020$000FORECAST2021$000FORECAST2022$000REVENUEUser charges 2 3 3 3 3 3 3 3 3 3 3Operating contributions 7 7 7 7 8 8 8 8 8 9 9Development and financial contributions 66 170 174 178 183 187 192 197 202 207 213Vested Assets 100 100 102 105 107 110 113 116 119 122 125Other revenue - - - - - - - - - - -Total revenue 175 280 286 293 301 308 316 324 332 341 350EXPENDITURESupport costs/internal charges 315 359 348 356 360 371 372 364 359 358 352Operating costs 3,189 3,313 3,341 3,421 3,503 3,591 3,681 3,776 3,875 3,979 4,083Interest expenditure 503 498 483 462 531 580 572 545 503 464 474Depreciation 2,700 2,943 2,911 2,999 3,098 3,108 3,239 3,365 3,362 3,478 3,579Total expenditure 6,707 7,113 7,083 7,238 7,492 7,650 7,864 8,050 8,099 8,279 8,488DEFICIT BEFORE TAX (6,532) (6,833) (6,797) (6,945) (7,191) (7,342) (7,548) (7,726) (7,767) (7,938) (8,138)STORMWATER - PROSPECTIVE FUNDING REQUIREMENTRATES FUNDING REQUIREMENTSurplus/(deficit) (6,532) (6,833) (6,797) (6,945) (7,191) (7,342) (7,548) (7,726) (7,767) (7,938) (8,138)Add capital contributions (66) (170) (174) (178) (183) (187) (192) (197) (202) (207) (213)Total rates funding requirement (6,598) (7,003) (6,971) (7,123) (7,374) (7,529) (7,740) (7,923) (7,969) (8,145) (8,351)LOAN FUNDING REQUIREMENTCapital expenditure - maintaining services (1,079) (750) (751) (765) (781) (933) (812) (830) (849) (872) (895)Capital expenditure - improving services (3,437) (1,590) (1,172) (786) (2,480) (3,280) (3,132) (2,928) (1,781) (2,329) -Less capital contributions 66 170 174 178 183 187 192 197 202 207 213Less depreciation 2,700 2,943 2,911 2,999 3,098 3,108 3,239 3,365 3,362 3,478 3,579Total loan (funding)/repayment (1,750) 773 1,162 1,626 20 (918) (513) (196) 934 484 2,897TOTAL FUNDING REQUIREMENT (8,348) (6,230) (5,809) (5,497) (7,354) (8,447) (8,253) (8,119) (7,035) (7,661) (5,454)
HUTT CITY LONG TERM PLAN <strong>2012</strong>-2022113Funding impact statement for the year ending 30 June: StormwaterACTUAL2011$000ESTIMATE<strong>2012</strong>$000BUDGET2013$000FORECAST2014$000FORECAST2015$000FORECAST2016$000FORECAST2017$000FORECAST2018$000FORECAST2019$000FORECAST2020$000FORECAST2021$000FORECAST2022$000Sources of operating fundingGeneral rates, uniform annual general charges, rates penalties 5,494 6,698 7,103 7,073 7,228 7,481 7,639 7,853 8,039 8,088 8,267 8,476Targeted rates (other than a targeted rate for water supply) - - - - - - - - - - - -Subsidies and grants for operating purposes 8 7 7 7 7 8 8 8 8 8 9 9Fees, charges and targeted rates for water supply 4 2 3 3 3 3 3 3 3 3 3 3Internal charges and overheads recovered - - - - - - - - - - - -Local authorities fuel tax, fines, infringement fees, and other receipts 9 - - - - - - - - - - -Total operating funding (A) 5,515 6,707 7,113 7,083 7,238 7,492 7,650 7,864 8,050 8,099 8,279 8,488Applications of operating fundingPayments to staff and suppliers 2,003 3,189 3,313 3,341 3,421 3,503 3,591 3,681 3,776 3,875 3,979 4,083Finance costs 584 503 498 483 462 531 580 572 545 503 464 474Internal charges and overheads applied 306 315 359 348 356 360 371 372 364 359 358 352Other operating funding applications - - - - - - - - - - - -Total applications of operating funding (B) 2,893 4,007 4,170 4,172 4,239 4,394 4,542 4,625 4,685 4,737 4,801 4,909Surplus (deficit) of operating funding (A-B) 2,622 2,700 2,943 2,911 2,999 3,098 3,108 3,239 3,365 3,362 3,478 3,579Sources of capital fundingSubsidies and grants for capital expenditure - - - - - - - - - - - -Development and financial contributions 14 66 170 174 178 183 187 192 197 202 207 213Increase (decrease) in debt (1,494) 1,750 (773) (1,162) (1,626) (20) 918 513 196 (934) (484) (2,897)Gross proceeds from sale of assets - - - - - - - - - - - -Lump sum contributions - - - - - - - - - - - -Total sources of capital funding ( C ) (1,480) 1,816 (603) (988) (1,448) 163 1,105 705 393 (732) (277) (2,684)Application of capital fundingCapital expenditure- to meet additional demand - - - - - - - - - - - -- to improve level of service 929 3,437 1,590 1,172 786 2,480 3,280 3,132 2,928 1,781 2,329 -- to replace existing assets 213 1,079 750 751 765 781 933 812 830 849 872 895Increase (decrease) in reserves - - - - - - - - - - - -Increase (decrease) of investments - - - - - - - - - - - -Total applications of capital funding (D) 1,142 4,516 2,340 1,923 1,551 3,261 4,213 3,944 3,758 2,630 3,201 895Surplus (deficit) of capital funding (C-D) (2,622) (2,700) (2,943) (2,911) (2,999) (3,098) (3,108) (3,239) (3,365) (3,362) (3,478) (3,579)Funding balance ((A-B)+(C-D)) - - - - - - - - - - - -
114 HUTT CITY LONG TERM PLAN <strong>2012</strong>-2022Solid WasteWhat we doWe manage contracts for the collection of the city’s refuse and recycling, and own andoperate two landfills where people and businesses can dispose of residual waste.Why we do itSolid waste management is necessary for the health and quality of life of thecommunity, the local economy and the environment.Effects on community wellbeingThe Solid Waste activity promotes environmental wellbeing in particular through ourEnvironmental Sustainability Strategy, the regional Waste Management and Minimisation<strong>Plan</strong>, and our asset management plan. It contributes primarily to our community outcomes ofhealthy people and a healthy natural environment. Looking at the potential for negative effectsassociated with this activity, environmental effects caused through failure to comply withresource consent conditions has been identified as a possible risk that is addressed throughour management techniques and best practice standards. Poor recycling services couldpotentially lead to increased volumes of solid waste for disposal and the associated costs.How we measure the success of our servicesMEASUREResidents’ satisfaction with:• rubbish collection• refuse disposal(measured byindependent survey)No resource consentrelatedinfringementnotices received fromGWRCACHIEVED2008-0991%90%100%complianceACHIEVED2009-1089%82%100%complianceACHIEVED2010-1193%85%100%complianceNote: Survey percentages quoted exclude those who responded ‘Don’t know’.TARGET2011-1293%of thoseexpressingan opinion87%of thoseexpressingan opinion100%complianceTARGET<strong>2012</strong>-13 TO2021-2293%of thoseexpressingan opinion87%of thoseexpressingan opinion100%complianceThe services we provideWe provide a weekly kerbside collection service for general waste and recycling. We alsoprovide landfills on Reynolds Bach Drive, Silverstream, and Coast Road, Wainuiomata.Community recycling stations are located in Alicetown, Kelson, Naenae, Waterloo,Wainuiomata and at Silverstream landfill. Recycled glass, tins, aluminium cans, plastic, paperand cardboard are processed in New Zealand or South East Asia and turned into new products.Major projects planned<strong>2012</strong>-13COST$0002013-14COST$0002014-15COST$0002015-16COST$0002016-17COST$0002017-18COST$0002018-19COST$0002019-20COST$0002020-21COST$0002021-22COST$0002022-23COST$0002023-24COST$0002024-25COST$0002025-26COST$0002026-27COST$0002027-28COST$0002028-29COST$0002029-30COST$0002030-31COST$0002031-32COST$000Capital ImprovementsCleanfill Site Development 10 10 10 11Silverstream Landfill Stage 2445(Carryover from 2011/<strong>2012</strong>)Silverstream Landfill Stage 2 1,685 712 1,305 864 1,436 1,867 1,447 1,484 1,524 1,564 85 1,739 1,907 4,164 6,014 3,087 1,709 5,241 3,385 2,022Wainuiomata - Closure Costs 350Wainuiomata - Transfer Station 150
HUTT CITY LONG TERM PLAN <strong>2012</strong>-2022115Prospective income statement for the year ending 30 June: Solid WasteESTIMATE<strong>2012</strong>$000BUDGET2013$000FORECAST2014$000FORECAST2015$000FORECAST2016$000FORECAST2017$000FORECAST2018$000FORECAST2019$000FORECAST2020$000FORECAST2021$000FORECAST2022$000REVENUEUser charges 10,485 11,877 12,162 13,334 13,654 13,996 13,894 14,255 14,626 15,021 15,412Other revenue - 10 10 10 11 11 11 12 12 12 13Total revenue 10,485 11,887 12,172 13,344 13,665 14,007 13,905 14,267 14,638 15,033 15,425EXPENDITURESupport costs/internal charges 156 179 174 178 179 185 186 182 179 178 175Operating costs 5,171 5,612 5,747 6,765 6,928 7,101 7,053 7,236 7,424 7,625 7,823Interest expenditure 165 - - - - - - - - - -Depreciation 455 465 464 476 490 498 518 538 549 568 586Total expenditure 5,947 6,256 6,385 7,419 7,597 7,784 7,757 7,956 8,152 8,371 8,584SURPLUS BEFORE TAX 4,538 5,631 5,787 5,925 6,068 6,223 6,148 6,311 6,486 6,662 6,841SOLID WASTE - PROSPECTIVE FUNDING REQUIREMENTRATES FUNDING REQUIREMENTSurplus/(deficit) 4,538 5,631 5,787 5,925 6,068 6,223 6,148 6,311 6,486 6,662 6,841Total rates funding requirement 4,538 5,631 5,787 5,925 6,068 6,223 6,148 6,311 6,486 6,662 6,841LOAN FUNDING REQUIREMENTCapital expenditure - improving services (2,300) (2,195) (722) (1,316) (875) (1,436) (1,867) (1,447) (1,484) (1,524) (1,564)Less depreciation 455 465 464 476 490 498 518 538 549 568 586Total loan (funding)/repayment (1,845) (1,730) (258) (840) (385) (938) (1,349) (909) (935) (956) (978)TOTAL FUNDING REQUIREMENT 2,693 3,901 5,529 5,085 5,683 5,285 4,799 5,402 5,551 5,706 5,863
116 HUTT CITY LONG TERM PLAN <strong>2012</strong>-2022Funding impact statement for the year ending 30 June: Solid WasteACTUAL2011$000ESTIMATE<strong>2012</strong>$000BUDGET2013$000FORECAST2014$000FORECAST2015$000FORECAST2016$000FORECAST2017$000FORECAST2018$000FORECAST2019$000FORECAST2020$000FORECAST2021$000FORECAST2022$000Sources of operating fundingGeneral rates, uniform annual general charges, rates penalties (5,617) (5,738) (6,831) (7,016) (7,183) (7,356) (7,544) (7,502) (7,700) (7,911) (8,126) (8,343)Targeted rates (other than a targeted rate for water supply) 1,200 1,200 1,200 1,229 1,258 1,288 1,321 1,354 1,389 1,425 1,464 1,502Subsidies and grants for operating purposes - - - - - - - - - - - -Fees, charges and targeted rates for water supply 10,564 10,485 11,877 12,162 13,334 13,654 13,996 13,894 14,255 14,626 15,021 15,412Internal charges and overheads recovered - - - - - - - - - - - -Local authorities fuel tax, fines, infringement fees, and other receipts 10 - 10 10 10 11 11 11 12 12 12 13Total operating funding (A) 6,157 5,947 6,256 6,385 7,419 7,597 7,784 7,757 7,956 8,152 8,371 8,584Applications of operating fundingPayments to staff and suppliers 5,672 5,171 5,612 5,747 6,765 6,928 7,101 7,053 7,236 7,424 7,625 7,823Finance costs (51) 165 - - - - - - - - - -Internal charges and overheads applied 152 156 179 174 178 179 185 186 182 179 178 175Other operating funding applications - - - - - - - - - - - -Total applications of operating funding (B) 5,773 5,492 5,791 5,921 6,943 7,107 7,286 7,239 7,418 7,603 7,803 7,998Surplus (deficit) of operating funding (A-B) 384 455 465 464 476 490 498 518 538 549 568 586Sources of capital fundingSubsidies and grants for capital expenditure - - - - - - - - - - - -Development and financial contributions - - - - - - - - - - - -Increase (decrease) in debt 450 1,845 1,730 258 840 385 938 1,349 909 935 956 978Gross proceeds from sale of assets - - - - - - - - - - - -Lump sum contributions - - - - - - - - - - - -Total sources of capital funding (C) 450 1,845 1,730 258 840 385 938 1,349 909 935 956 978Application of capital fundingCapital expenditure- to meet additional demand- to improve level of service 834 2,300 2,195 722 1,316 875 1,436 1,867 1,447 1,484 1,524 1,564- to replace existing assets - - - - - - - - - - - -Increase (decrease) in reserves - - - - - - - - - - - -Increase (decrease) of investments - - - - - - - - - - - -Total applications of capital funding (D) 834 2,300 2,195 722 1,316 875 1,436 1,867 1,447 1,484 1,524 1,564Surplus (deficit) of capital funding (C-D) (384) (455) (465) (464) (476) (490) (498) (518) (538) (549) (568) (586)Funding balance ((A-B)+(C-D)) - - - - - - - - - - - -
118 HUTT CITY LONG TERM PLAN <strong>2012</strong>-2022GROUP ENVIRONMENTEnvironmental ManagementWhat we doThis activity includes:• developing, implementing and monitoring the District <strong>Plan</strong>, relevant bylaws and otherenvironmental policies and plans for <strong>Hutt</strong> <strong>City</strong>’s sustainable development• providing resource management and building consents and inspections, and environmentalhealth and animal services• regular monitoring to ensure compliance with legislative requirements, the District <strong>Plan</strong>,resource and building consent conditions and bylaw requirements• inspections of business and food premises, certifications, liquor licensing law complianceand pollution and trade waste control, and monitoring beaches to promote and protectpublic health and safety• monitoring and controlling noise and hazardous substances.Why we do itThis activity is fundamental to achieving a clean, healthy, attractive and sustainableenvironment. It’s also a legal requirement for <strong>Hutt</strong> <strong>City</strong> <strong>Council</strong>.Effects on community wellbeingThe Environmental Management activity promotes environmental wellbeing in particularthrough our District <strong>Plan</strong>. It contributes primarily to our community outcomes of a safecommunity, a strong and diverse economy, an accessible and connected city, healthy people,a healthy natural environment, and a healthy and attractive built environment. Looking at thepotential for negative effects associated with this activity, people’s perceptions of personalfreedom can be reduced through the need for regulatory activities for the benefit of the widercommunity. Regulatory activities can also be interpreted by the users of those services ascausing costs and delays.The services we provideEnvironmental management activities are largely regulatory in nature and many have anoperational focus involving timeframes set out in legislation. The main pieces of legislationcovering environmental management activities are the Building Act 2004, Bylaws Act 1910,Dog Control Act 1996, Food Act 1981, Forest and Rural Fires Act 1977, Gambling Act 2003,Health Act 1956, <strong>Hutt</strong> Valley Drainage Act 1967, Litter Act 1979, Local Government Act 2002,Resource Management Act 1991, Sale of Liquor Act 1989 and Wild Animal Control Act 1977.This is not a complete list as we’re also bound by general legislation.How we measure the success of our servicesMEASUREResidents’ satisfaction with:• animal services• parking services• environmental healthservices(measured by independentor customer surveys)Land Information Memoranda(LIMs) processed to complywith statutory requirements(measured by managementreports)Building consent/projectinformation and resourceconsents processed to complywith the Building Code,Resource Management Act1991 (RMA) and District <strong>Plan</strong>requirements (measured bycomputer database records)Resource consents aremonitored within five workingdays of being notified thatdevelopment is commencingor within six months of theconsent being granted,whichever is the soonerACHIEVED2008-0988%Newmeasure for2011-12Newmeasure for2011-1297%processedwithin nineworkingdays72% ofbuildingconsentsand 88% ofnon-notifiedland useconsentsprocessedwithin 18workingdaysNewmeasure for2010-11ACHIEVED2009-1080%Newmeasure for2011-12Newmeasure for2011-1296%processedwithin nineworkingdays99% ofbuildingconsentsand 91% ofnon-notifiedland useconsentsprocessedwithin 18workingdaysNewmeasure for2010-11ACHIEVED2010-1187%Newmeasure for2011-12Newmeasure for2011-1297%processedwithin nineworkingdays100% ofbuildingconsentsand 91% ofnon-notifiedland useconsentsprocessedwithin 18workingdays99% ofresourceconsentsmonitoredwithin thesetimeframesTARGET2011-1282%of thoseexpressingan opinion65%of thoseexpressingan opinion75%of thoseexpressingan opinion90%processedwithin nineworkingdays80% ofbuilding andnon-notifiedland useconsentsprocessedwithin 18workingdays90% ofresourceconsentsmonitoredwithin thesetimeframesTARGET<strong>2012</strong>-13 TO2021-2282%of thoseexpressingan opinion65%of thoseexpressingan opinion75%of thoseexpressingan opinion90%processedwithin nineworkingdays80% ofbuilding andnon-notifiedland useconsentsprocessedwithin 18workingdays90% ofresourceconsentsmonitoredwithin thesetimeframes
HUTT CITY LONG TERM PLAN <strong>2012</strong>-2022119MEASURERequests for service referredto RMA monitoring andenforcement team respondedto within required timeframes(measured by management andcomputer database reports)Building consents for fireplacesprocessed in a timely manner(measured by computerdatabase records)Building consents for solarpanels processed in a timelymanner (measured bycomputer database records)Food premises registered orlicensed:within 30 days of application(for premises operating underthe Food Hygiene Regulations1974)within three months (forpremises with a Food Control<strong>Plan</strong> operating under the FoodAct 1981)(measured by computerdatabase records)Code compliance certificatesissued within 20 workingdays to comply with statutoryrequirements in the BuildingAct 2004 (measured bycomputer database records)Dog pound open 300 daysper year (measured bymanagement reports)ACHIEVED2008-0999%acknowledgedwithin 48hoursNewmeasurefor 2009-10Newmeasurefor 2009-1097%Newmeasurefor <strong>2012</strong>-13ACHIEVED2009-10100%acknowledgedwithin 48hours100%processedwithin fiveworkingdays100%processedwithin fiveworking days98%Newmeasurefor <strong>2012</strong>-1384% 100%issuedwithin 20workingdays97% issuedwithin 18workingdaysACHIEVED2010-11100%acknowledgedwithin 24hours100%processedwithin fiveworkingdays100%processedwithin fiveworking days98%Newmeasurefor <strong>2012</strong>-13100%issuedwithin 20workingdays100% issuedwithin 18workingdaysTARGET2011-12TARGET<strong>2012</strong>-13 TO2021-22100% 100%acknowledgedwithin ledgedacknow-24 hours within 24hours100%processedwithin fiveworkingdays100%processedwithin fiveworking days90%Newmeasurefor <strong>2012</strong>-13100%issuedwithin 20workingdays80% issuedwithin 18workingdays100%processedwithin fiveworkingdays100%processedwithin fiveworking days90%90%100%issuedwithin 20workingdays80% issuedwithin 18workingdays100% 100% 100% 100% 100%MEASUREDog complaints areresponded to:within 30 minutes for dogattackswithin 24 hours for othercomplaints (measured bymanagement reports)Noise complaints responded towithin 45 minutes (measuredby management reports)Note: The response time from 2007to 2011 was set at 30 minutes butwas amended from 2011 to reflectthe new contractACHIEVED2008-0999%98%ACHIEVED2009-1098%97%87% 72%respondedto within30 minutes93%respondedto within45 minutesACHIEVED2010-11Note: Survey percentages quoted exclude those who responded ‘Don’t know’.98%97%96%respondedto within45 minutesTARGET2011-1295%95%TARGET<strong>2012</strong>-13 TO2021-2295%95%85% 85%
120 HUTT CITY LONG TERM PLAN <strong>2012</strong>-2022Prospective income statement for the year ending 30 June: Environmental ManagementESTIMATE<strong>2012</strong>$000BUDGET2013$000FORECAST2014$000FORECAST2015$000FORECAST2016$000FORECAST2017$000FORECAST2018$000FORECAST2019$000FORECAST2020$000FORECAST2021$000FORECAST2022$000REVENUEUser charges 3,256 3,342 3,423 3,505 3,589 3,678 3,770 3,868 3,969 4,076 4,182Other revenue 176 190 194 199 203 209 214 219 225 231 237Total revenue 3,432 3,532 3,617 3,704 3,792 3,887 3,984 4,087 4,194 4,307 4,419EXPENDITUREEmployee costs 5,095 4,941 4,968 5,087 5,264 5,396 5,531 5,675 5,822 5,979 6,135Support costs/internal charges 2,076 2,409 2,337 2,389 2,413 2,491 2,496 2,445 2,409 2,400 2,359Operating costs 3,048 1,962 2,009 2,057 2,106 2,159 2,213 2,270 2,330 2,392 2,455Depreciation 1 - - - - - - - - - -Total expenditure 10,220 9,312 9,314 9,533 9,783 10,046 10,240 10,390 10,561 10,771 10,949DEFICIT BEFORE TAX (6,788) (5,780) (5,697) (5,829) (5,991) (6,159) (6,256) (6,303) (6,367) (6,464) (6,530)ENVIRONMENTAL MANAGEMENT - PROSPECTIVE FUNDINGREQUIREMENTRATES FUNDING REQUIREMENTSurplus/(deficit) (6,788) (5,780) (5,697) (5,829) (5,991) (6,159) (6,256) (6,303) (6,367) (6,464) (6,530)Total rates funding requirement (6,788) (5,780) (5,697) (5,829) (5,991) (6,159) (6,256) (6,303) (6,367) (6,464) (6,530)LOAN FUNDING REQUIREMENTLess depreciation 1 - - - - - - - - - -Total loan (funding)/repayment 1 - - - - - - - - - -TOTAL FUNDING REQUIREMENT (6,787) (5,780) (5,697) (5,829) (5,991) (6,159) (6,256) (6,303) (6,367) (6,464) (6,530)
HUTT CITY LONG TERM PLAN <strong>2012</strong>-2022121Emergency ManagementWhat we do<strong>Hutt</strong> <strong>City</strong> <strong>Council</strong> is joined with all the city and district councils in the region to form a CivilDefence and Emergency Management (CDEM) Group under the CDEM Act of 2002. From1 July <strong>2012</strong> all emergency management staff and resources have been pooled togetherwith the expectation of improved effectiveness from increased scale and coordination, aswell as efficiencies from the centralised provision of services such as training and publiceducation. The new team will:• lead the preparation and review of the Wellington Region CDEM Group <strong>Plan</strong> andassociated plans• educate people about the risks they face and how to prepare for emergency events• maintain the Wellington Region CDEM Group’s Emergency Operation Centres so they canbe quickly activated to manage an emergency event, and• work with central government, emergency services, welfare groups, lifeline utilities and awide range of interested and affected organisations on emergency management issues.Local capability has been retained to enable an effective local response to emergencies, andto continue to develop, implement and monitor city-wide emergency management plans, andpromote community preparedness for emergencies.We also manage rural fire under the Forest and Rural Fires Act 1975 and the Forest and RuralFires Regulations 2005. The <strong>Council</strong> maintains:• a fire plan for the district• a fully operational Volunteer Rural Fire Force• a Rural Fire Permit database and permitting process, and• relationships with other councils and the National Rural Fire Authority to develop regionalmitigation strategies, response protocols, and to promote community awareness.Why we do itThe Wellington region is exposed to a wide range of natural and man-made hazards, includingearthquake, flooding, landslide, tsunami, storm, biological, chemical and terrorism threats.However, there is a great deal that we can do to reduce the impact of these hazards on ourcommunity. Our approach to emergency management and rural fire is based on the principlesof reduction of risk, readiness, response and recovery.Effects on community wellbeingThe Emergency Management activity promotes economic and social wellbeing in particularthrough encouraging preparedness to cope in the event of a Civil Defence emergency. Itcontributes primarily to our community outcomes of a safe community, and strong andinclusive communities. Looking at the potential for negative effects associated with thisactivity, emergency equipment such as sirens can create temporary noise effects. Emergencymanagement response and recovery activities may also have a temporary adverse effect oncommunity and environmental wellbeing while social systems and infrastructure are beingrebuilt following an emergency event.The services we provideEmergency management activities are carried out to meet the requirements of the CivilDefence Emergency Management Act 2002. The Act promotes the sustainable managementof hazards, the safety of the public and protection of property. It also provides for planningand preparation for emergencies and for response and recovery in emergencies. The Act alsorequires local authorities to coordinate regional planning, programmes and activities, providesfor the integration of national and local emergency management planning and activity, andencourages a coordinated approach.How we measure the success of our servicesMEASUREPercentage of householdsthat are prepared for acivil defence emergency(measured by independentsurvey)We respond toemergencies inaccordance with theWellington Region CivilDefence EmergencyManagement Group <strong>Plan</strong>and the Civil DefenceEmergency ManagementAct 2002 (measured bymanagement reports anddebrief notes)We respond to ruralfires in accordance withthe <strong>Hutt</strong> <strong>City</strong> Rural Fire<strong>Plan</strong> and the Forest andRural Fires Act 1977 andthe Forest and RuralFires Regulations 2005(measured by WellingtonRegional Rural FireCommittee)ACHIEVED2008-09ACHIEVED2009-10ACHIEVED2010-11TARGET2011-1258% 63% 79% 60% ofthoseexpressingan opinionTARGET<strong>2012</strong>-13 TO2021-2260% ofthoseexpressingan opinion100% 100% 100% 100% 100%100% 100% 100% 100% 100%Note: Survey percentages quoted exclude those who responded ‘Don’t know’.
122 HUTT CITY LONG TERM PLAN <strong>2012</strong>-2022Major projects planned<strong>2012</strong>-13COST$0002013-14COST$0002014-15COST$0002015-16COST$0002016-17COST$0002017-18COST$0002018-19COST$0002019-20COST$0002020-21COST$0002021-22COST$0002022-23COST$0002023-24COST$0002024-25COST$0002025-26COST$0002026-27COST$0002027-28COST$0002028-29COST$0002029-30COST$0002030-31COST$0002031-32COST$000Capital ReplacementsWainuiomata Bush Fire Force Vehicle 129 139 150 162 175 189Wainuiomata Bush Fire Force Vehicle(Carryover from 2011/<strong>2012</strong>)90Prospective income statement for the year ending 30 June: Emergency ManagementESTIMATE<strong>2012</strong>$000BUDGET2013$000FORECAST2014$000FORECAST2015$000FORECAST2016$000FORECAST2017$000FORECAST2018$000FORECAST2019$000FORECAST2020$000FORECAST2021$000FORECAST2022$000REVENUEUser charges 24 17 17 17 18 18 19 19 20 20 21Upper <strong>Hutt</strong> CC operating contribution 327 341 350 358 367 376 385 395 405 416 427Total revenue 351 358 367 375 385 394 404 414 425 436 448EXPENDITUREEmployee costs 411 - - - - - - - - - -Support costs/internal charges 261 281 273 279 282 291 292 286 281 280 276Operating costs 401 878 858 879 900 922 945 970 995 1,022 1,049Depreciation 40 31 31 31 31 32 32 33 33 33 34Total expenditure 1,113 1,190 1,162 1,189 1,213 1,245 1,269 1,289 1,309 1,335 1,359DEFICIT BEFORE TAX (762) (832) (795) (814) (828) (851) (865) (875) (884) (899) (911)EMERGENCY MANAGEMENT - PROSPECTIVE FUNDINGREQUIREMENTRATES FUNDING REQUIREMENTSurplus/(deficit) (762) (832) (795) (814) (828) (851) (865) (875) (884) (899) (911)Total rates funding requirement (762) (832) (795) (814) (828) (851) (865) (875) (884) (899) (911)LOAN FUNDING REQUIREMENTCapital expenditure - maintaining services - - - - (129) - - (139) - - (150)Capital expenditure - improving services (268) - - - - - - - - - -Less depreciation 40 31 31 31 31 32 32 33 33 33 34Total loan (funding)/repayment (228) 31 31 31 (98) 32 32 (106) 33 33 (116)TOTAL FUNDING REQUIREMENT (990) (801) (764) (783) (926) (819) (833) (981) (851) (866) (1,027)
HUTT CITY LONG TERM PLAN <strong>2012</strong>-2022123Funding impact statement for the year ending 30 June: Group EnvironmentACTUAL2011$000ESTIMATE<strong>2012</strong>$000BUDGET2013$000Sources of operating fundingGeneral rates, uniform annual general charges, rates penalties 6,393 7,550 6,612 6,492 6,643 6,819 7,010 7,121 7,178 7,251 7,363 7,441Targeted rates (other than a targeted rate for water supply) - - - - - - - - - - - -Subsidies and grants for operating purposes 316 327 341 350 358 367 376 385 395 405 416 427Fees, charges and targeted rates for water supply 2,866 3,280 3,359 3,440 3,522 3,607 3,696 3,789 3,887 3,989 4,096 4,203Internal charges and overheads recovered - - - - - - - - - - - -Local authorities fuel tax, fines, infringement fees, and other receipts 281 176 190 194 199 203 209 214 219 225 231 237Total operating funding (A) 9,856 11,333 10,502 10,476 10,722 10,996 11,291 11,509 11,679 11,870 12,106 12,308Applications of operating fundingPayments to staff and suppliers 7,749 8,955 7,781 7,835 8,023 8,270 8,477 8,689 8,915 9,147 9,393 9,639Finance costs - - - - - - - - - - - -Internal charges and overheads applied 2,083 2,337 2,690 2,610 2,668 2,695 2,782 2,788 2,731 2,690 2,680 2,635Other operating funding applications - - - - - - - - - - - -Total applications of operating funding (B) 9,832 11,292 10,471 10,445 10,691 10,965 11,259 11,477 11,646 11,837 12,073 12,274Surplus (deficit) of operating funding (A-B) 24 41 31 31 31 31 32 32 33 33 33 34Sources of capital fundingSubsidies and grants for capital expenditure - - - - - - - - - - - -Development and financial contributions - - - - - - - - - - - -Increase (decrease) in debt 5 227 (31) (31) (31) 98 (32) (32) 106 (33) (33) 116Gross proceeds from sale of assets - - - - - - - - - - - -Lump sum contributions - - - - - - - - - - - -Total sources of capital funding ( C ) 5 227 (31) (31) (31) 98 (32) (32) 106 (33) (33) 116Application of capital fundingCapital expenditure- to meet additional demand- to improve level of service 29 268 - - - - - - - - - -- to replace existing assets - - - - - 129 - - 139 - - 150Increase (decrease) in reserves - - - - - - - - - - - -Increase (decrease) of investments - - - - - - - - - - - -Total applications of capital funding (D) 29 268 - - - 129 - - 139 - - 150Surplus (deficit) of capital funding (C-D) (24) (41) (31) (31) (31) (31) (32) (32) (33) (33) (33) (34)Funding balance ((A-B)+(C-D)) - - - - - - - - - - - -FORECAST2014$000FORECAST2015$000FORECAST2016$000FORECAST2017$000FORECAST2018$000FORECAST2019$000FORECAST2020$000FORECAST2021$000FORECAST2022$000
HUTT CITY LONG TERM PLAN <strong>2012</strong>-2022125GROUP ECONOMYLocal Urban EnvironmentWhat we doWe work to develop an urban environment that will enhance the city’s image, attractingpeople, businesses and investment, and meet our community’s needs and aspirations, whilerecognising the important role of our heritage and features.We:• implement environmental policies and plans for <strong>Hutt</strong> <strong>City</strong>’s sustainable development,including environmental education and promotion• run an annual waste minimisation programme to promote the concept of ‘reduce, reuse,recycle’ to businesses and residents.Why we do itWe recognise that our urban design and infrastructure must support our changing businessand community environment. We manage and develop <strong>Hutt</strong> <strong>City</strong>’s public spaces and preserveour heritage buildings because this benefits both businesses and our community. It contributesto our point of difference from other cities, supporting local cultures and enhancing how weidentify ourselves. We manage our waste (through promoting recycling and waste reduction)to maintain our community’s health and quality of life.Effects on community wellbeingThe Local Urban Environment activity promotes social, economic, environmental andcultural wellbeing in particular through our strategies for growth and development, ourHeritage Policy, our CBD Making Places project and our vision documents. It contributes toall community outcomes. Looking at the potential for negative effects associated with thisactivity, urban design activities could result in temporary disruptions during any constructionphase. Ineffective sustainability initiatives could lead to increased resource usage, waste anddetrimental impact on the environment.The services we provideWe provide design advice and promote best design outcomes for the city including projectsassociated with the Heritage Policy, CBD Making Places, Stepping Stones and suburbanshopping centres improvement fund.We encourage people to live more sustainably by thinking about how they can reduce, reuseand recycle. This includes providing information about composting and establishing wormfarms. We run two programmes for schools, giving young people the opportunity to explore reallife challenges in sustainability and apply their ideas, and full day fieldtrips to Allbrite IndustriesLtd, Silverstream landfill and Earthlink Inc to see first hand how we can recycle, reuse orcompost up to 75% of our rubbish. We support annual collections of hazardous waste andelectronic waste to ensure any items unable to be recycled or reused are disposed of safely.How we measure the success of our servicesMEASUREResidents feel a sense ofpride in the way the citylooks and feels (measuredby independent survey)Businesses feel a senseof pride in the way the citylooks and feels (measuredby independent survey)Residents’ satisfactionwith:• litter control• recycling(measured byindependent survey)Percentage of householdsthat have used therecycling service in theprevious 12 months(measured by independentsurvey)All residents have accessto community recyclingfacilities (measured bymanagement reports)Tonnes of recycling perannum (measured bymanagement reports)ACHIEVED2008-09ACHIEVED2009-10ACHIEVED2010-11TARGET2011-1291% 90% 89% previousresults67% 61% 44% previousresults91%87%87%90%87%93%86%of thoseexpressingan opinion86%of thoseexpressingan opinion85% 86% 87% 86%of thoseexpressingan opinionTARGET<strong>2012</strong>-13 TO2021-22previousresultspreviousresults86%of thoseexpressingan opinion86%of thoseexpressingan opinion86%of thoseexpressingan opinion100% 100% 100% 100% 100%7349 6910 7253 Increasing IncreasingNote: Survey percentages quoted exclude those who responded ‘Don’t know’.
126 HUTT CITY LONG TERM PLAN <strong>2012</strong>-2022Major projects planned<strong>2012</strong>-13COST$0002013-14COST$0002014-15COST$0002015-16COST$0002016-17COST$0002017-18COST$0002018-19COST$0002019-20COST$0002020-21COST$0002021-22COST$0002022-23COST$0002023-24COST$0002024-25COST$0002025-26COST$0002026-27COST$0002027-28COST$0002028-29COST$0002029-30COST$0002030-31COST$0002031-32COST$000Capital ReplacementsSeaview Gracefield Banners 32 33 34 34 35 36 37 38 39 40 41 42 43 44 46 47 48 49 50 52Capital ImprovementsMaking Places Projects 200 200 68Seaview Gracefield Development 115 32Seaview Gracefield Development150(Carryover from 2011/<strong>2012</strong>)Stepping Stones Investigations for Future 20Projects (Carryover from 2011/<strong>2012</strong>)Suburban Shopping Centre Improvements 213 322 330 338 356Wingate Development <strong>Plan</strong>(Carryover from 2011/<strong>2012</strong>)20Operating ProjectsBusiness Programmes 21E Tu Awakairangi Sculpture Trust 50Earthlink Community Recycling 70Environmental Sustainability Projects 122Heritage Incentives 77School Programmes 45Silverlining Business Sustainability 40Waste Minimisation Projects 40
HUTT CITY LONG TERM PLAN <strong>2012</strong>-2022127Prospective income statement for the year ending 30 June: Local Urban EnvironmentESTIMATE<strong>2012</strong>$000BUDGET2013$000FORECAST2014$000FORECAST2015$000FORECAST2016$000FORECAST2017$000FORECAST2018$000FORECAST2019$000FORECAST2020$000FORECAST2021$000FORECAST2022$000REVENUEDevelopment and financial contributions 8 8 8 9 9 9 9 9 10 10 10Other revenue 300 300 307 315 322 330 338 347 356 366 375Total revenue 308 308 315 324 331 339 347 356 366 376 385EXPENDITUREEmployee costs 405 487 499 511 526 539 553 567 582 597 613Support costs/internal charges 315 275 267 273 276 285 285 279 275 274 270Operating costs 804 492 452 463 474 486 498 511 524 539 553Interest expenditure 18 4 4 4 5 5 5 5 4 4 4Depreciation 290 302 295 293 294 297 304 303 299 299 292Total expenditure 1,832 1,560 1,517 1,544 1,575 1,612 1,645 1,665 1,684 1,713 1,732DEFICIT BEFORE TAX (1,524) (1,252) (1,202) (1,220) (1,244) (1,273) (1,298) (1,309) (1,318) (1,337) (1,347)LOCAL URBAN ENVIRONMENT - PROSPECTIVE FUNDINGREQUIREMENTRATES FUNDING REQUIREMENTSurplus/(deficit) (1,524) (1,252) (1,202) (1,220) (1,244) (1,273) (1,298) (1,309) (1,318) (1,337) (1,347)Add capital contributions (8) (8) (8) (9) (9) (9) (9) (9) (10) (10) (10)Total rates funding requirement (1,532) (1,260) (1,210) (1,229) (1,253) (1,282) (1,307) (1,318) (1,328) (1,347) (1,357)LOAN FUNDING REQUIREMENTCapital expenditure - maintaining services (32) (32) (33) (34) (34) (35) (36) (37) (38) (39) (40)Capital expenditure - improving services (2,525) (528) (231) (68) (322) (330) (338) - (356) - -Less capital contributions 8 8 8 9 9 9 9 9 10 10 10Less depreciation 290 302 295 293 294 297 304 303 299 299 292Total loan (funding)/repayment (2,259) (250) 39 200 (53) (59) (61) 275 (85) 270 262TOTAL FUNDING REQUIREMENT (3,791) (1,510) (1,171) (1,029) (1,306) (1,341) (1,368) (1,043) (1,413) (1,077) (1,095)
128 HUTT CITY LONG TERM PLAN <strong>2012</strong>-2022Economic DevelopmentWhat we doWe take a lead role in encouraging <strong>Hutt</strong> <strong>City</strong>’s growth through:• creating a business-friendly environment• facilitating the expansion and creation of local businesses and employment• increasing tourism and events in <strong>Hutt</strong> <strong>City</strong>• contributing to regional growth through regional economic development.Why we do itWe know that individual businesses generally lack incentives to explore opportunities thatbenefit <strong>Hutt</strong> <strong>City</strong> as a whole, as well as themselves. By supporting the business sector andpromoting <strong>Hutt</strong> <strong>City</strong> as a business location and vibrant city, we generate benefits for localenterprises and our residents.Effects on community wellbeingThe Economic Development activity promotes economic wellbeing in particular through ourEconomic Development Strategy and our Tourism, Visitor and Events Policies. It contributesprimarily to our community outcomes of a strong and diverse economy, an accessible andconnected city, and strong and inclusive communities. Looking at the potential for negativeeffects associated with this activity, any focus on low value economic sectors could divertattention and resources from those that have the potential to provide greater long term valuefor the city.The services we provideWe help people starting out in business or starting new businesses with free advice,connections to local business people, and guidance through any consent, permitting orlicensing requirements. We work with businesses of all sizes to help them grow, and wesupport innovation in business. We’re implementing the action plan in the city’s EconomicDevelopment Strategy to stimulate jobs and opportunities for residents.How we measure the success of our servicesMEASUREBusinesses’satisfaction witheconomic developmentprogrammes (measuredby business survey)Residents’ satisfactionwith the i-SITEVisitor InformationCentre (measured byindependent survey)<strong>Hutt</strong> <strong>City</strong>’s economicperformance accordingto the annual EconomicDevelopment Strategyreport to <strong>Council</strong>, whichincludes measures suchas:ACHIEVED2008-09ACHIEVED2009-10ACHIEVED2010-11TARGET2011-1290% 89% 50.6% 85%ofthoseexpressing anopinion99% 97% 99% 91%of thoseexpressing anopinionEconomicrankingrelative topeer groupof NZ cities:• number of businesses + 0.8% + 0.9% - 1.6% Improvement• number of full-time + 2.0% + 2.3% - 3.5%in relativeequivalents (FTEs) inranking withthe workforceother citiesmeasured• Gross DomesticProduct (GDP)• GDP per capita• Export sector asproportion of GDP• High value sectorsas percentage of allsectors (by GDP)+ 0.5% + 0.5% - 3.9%Newmeasure for2010/11Newmeasure for2010/11Newmeasure for2010/11Newmeasure for2010/11Newmeasure for2010/11Newmeasure for2010/11- 4.5%- 5.4%- 5.6%(GDP measured by Business and Economic Research Limited)Note: Survey percentages quoted exclude those who responded ‘Don’t know’.Workingtowards a 10-15% increasein number ofbusinesses,number ofFTEs andGDP by 2014,and a 30%increase by2019TARGET<strong>2012</strong>-13 TO2021-2285%ofthoseexpressing anopinion91%of thoseexpressing anopinionImprovementin relativeranking withother citiesmeasuredWorkingtowards a 10-15% increasein number ofbusinesses,number ofFTEs andGDP by 2014,and a 30%increase by2019
HUTT CITY LONG TERM PLAN <strong>2012</strong>-2022129Major projects planned<strong>2012</strong>-13COST$0002013-14COST$0002014-15COST$0002015-16COST$0002016-17COST$0002017-18COST$0002018-19COST$0002019-20COST$0002020-21COST$0002021-22COST$0002022-23COST$0002023-24COST$0002024-25COST$0002025-26COST$0002026-27COST$0002027-28COST$0002028-29COST$0002029-30COST$0002030-31COST$0002031-32COST$000Operating ProjectsCBD Place Maker 100DevelopmentStimulus Package950EconomicDevelopmentContestable Fund44EconomicDevelopmentStrategy140<strong>Hutt</strong> ValleyChamber ofCommerce200InternationalCo-operating Cities30Jackson StreetProgramme110RegionalAmenities Fund195Science &Technology(Carryover from2011/<strong>2012</strong>)100
130 HUTT CITY LONG TERM PLAN <strong>2012</strong>-2022Prospective income statement for the year ending 30 June: Economic DevelopmentESTIMATE<strong>2012</strong>$000BUDGET2013$000FORECAST2014$000FORECAST2015$000FORECAST2016$000FORECAST2017$000FORECAST2018$000FORECAST2019$000FORECAST2020$000FORECAST2021$000FORECAST2022$000REVENUEUser charges 1 1 1 1 1 1 1 1 1 1 1Other revenue 483 557 570 584 598 613 628 644 661 679 697Total revenue 484 558 571 585 599 614 629 645 662 680 698EXPENDITUREEmployee costs 455 556 569 504 519 532 546 560 574 590 605Support costs/internal charges 466 452 439 449 453 468 469 459 452 451 443Operating costs 1,266 2,428 2,287 1,346 1,378 1,412 1,448 1,485 1,524 1,565 1,606Interest expenditure - 12 12 11 13 14 14 13 12 11 11Depreciation 10 25 23 22 20 19 17 16 15 14 13Total expenditure 2,197 3,473 3,330 2,332 2,383 2,445 2,494 2,533 2,577 2,631 2,678DEFICIT BEFORE TAX (1,713) (2,915) (2,759) (1,747) (1,784) (1,831) (1,865) (1,888) (1,915) (1,951) (1,980)ECONOMIC DEVELOPMENT - PROSPECTIVE FUNDINGREQUIREMENTRATES FUNDING REQUIREMENTSurplus/(deficit) (1,713) (2,915) (2,759) (1,747) (1,784) (1,831) (1,865) (1,888) (1,915) (1,951) (1,980)Total rates funding requirement (1,713) (2,915) (2,759) (1,747) (1,784) (1,831) (1,865) (1,888) (1,915) (1,951) (1,980)LOAN FUNDING REQUIREMENTLess depreciation 10 25 23 22 20 19 17 16 15 14 13Total loan (funding)/repayment 10 25 23 22 20 19 17 16 15 14 13TOTAL FUNDING REQUIREMENT (1,703) (2,890) (2,736) (1,725) (1,764) (1,812) (1,848) (1,872) (1,900) (1,937) (1,967)
HUTT CITY LONG TERM PLAN <strong>2012</strong>-2022131Funding impact statement for the year ending 30 June: Group EconomyACTUAL2011$000ESTIMATE<strong>2012</strong>$000BUDGET2013$000Sources of operating fundingGeneral rates, uniform annual general charges, rates penalties 2,813 3,135 4,066 3,859 2,866 2,927 3,003 3,062 3,096 3,133 3,188 3,227Targeted rates (other than a targeted rate for water supply) 110 110 110 110 110 110 110 110 110 110 110 110Subsidies and grants for operating purposes 79 - - - - - - - - - - -Fees, charges and targeted rates for water supply - 1 1 1 1 1 1 1 1 1 1 1Internal charges and overheads recovered - - - - - - - - - - - -Local authorities fuel tax, fines, infringement fees, and other receipts 797 783 857 877 899 920 943 966 991 1,017 1,045 1,072Total operating funding (A) 3,799 4,029 5,034 4,847 3,876 3,958 4,057 4,139 4,198 4,261 4,344 4,410Applications of operating fundingPayments to staff and suppliers 2,876 2,930 3,963 3,807 2,824 2,897 2,969 3,045 3,123 3,204 3,291 3,377Finance costs 18 18 16 16 15 18 19 19 18 16 15 15Internal charges and overheads applied 699 781 728 706 722 729 753 754 738 727 725 713Other operating funding applications - - - - - - - - - - - -Total applications of operating funding (B) 3,593 3,729 4,707 4,529 3,561 3,644 3,741 3,818 3,879 3,947 4,031 4,105Surplus (deficit) of operating funding (A-B) 206 300 327 318 315 314 316 321 319 314 313 305Sources of capital fundingSubsidies and grants for capital expenditure - - - - - - - - - - - -Development and financial contributions 3 8 8 8 9 9 9 9 9 10 10 10Increase (decrease) in debt 807 2,249 225 (62) (222) 33 40 44 (291) 70 (284) (275)Gross proceeds from sale of assets - - - - - - - - - - - -Lump sum contributions - - - - - - - - - - - -Total sources of capital funding ( C ) 810 2,257 233 (54) (213) 42 49 53 (282) 80 (274) (265)Application of capital fundingCapital expenditure- to meet additional demand- to improve level of service 988 2,525 528 231 68 322 330 338 - 356 - -- to replace existing assets 31 32 32 33 34 34 35 36 37 38 39 40Increase (decrease) in reserves - - - - - - - - - - - -Increase (decrease) of investments - - - - - - - - - - - -Total applications of capital funding (D) 1,019 2,557 560 264 102 356 365 374 37 394 39 40Surplus (deficit) of capital funding (C-D) (209) (300) (327) (318) (315) (314) (316) (321) (319) (314) (313) (305)Funding balance ((A-B)+(C-D)) (3) - - - - - - - - - - -FORECAST2014$000FORECAST2015$000FORECAST2016$000FORECAST2017$000FORECAST2018$000FORECAST2019$000FORECAST2020$000FORECAST2021$000FORECAST2022$000
HUTT CITY LONG TERM PLAN <strong>2012</strong>-2022133GROUP ORGANISATIONElected MembersWhat we doElected members of <strong>Hutt</strong> <strong>City</strong> <strong>Council</strong> have an important role in the community. They:• provide a governance role for the city• set <strong>Council</strong>’s strategic direction, including determining the activities we undertake(within legal parameters)• monitor our performance on behalf of the city’s residents and ratepayers.Our governance structure includes community boards and community committees,which provide local input into our decision-making.Why we do itThe Elected Members activity ensures sound governance and robust decision-makingwithin <strong>Hutt</strong> <strong>City</strong>.Effects on community wellbeingThe Elected Members activity promotes social, economic, environmental and culturalwellbeing through contributing to projects across all of <strong>Council</strong>, and contributes to allcommunity outcomes. Looking at the potential for negative effects associated with thisactivity, there is a risk that some portions of the population may not be representedadequately. This is mitigated through our consultation and engagement practices.How we measure the success of our servicesMEASUREResidents’ satisfactionwith the Mayor’s andcouncillors’ performance(measured by independentsurvey)Residents’ satisfactionwith the way we spendtheir rates (measured byindependent survey)Residents’ satisfactionwith our public consultation(measured by independentsurvey)ACHIEVED2008-09ACHIEVED2009-10ACHIEVED2010-11TARGET2011-1291% 95% 96% 90%of thoseexpressing anopinion82% 86% 88% 83%of thoseexpressing anopinionNewmeasurefor 2009/10Note: Survey percentages quoted exclude those who responded ‘Don’t know’.TARGET<strong>2012</strong>-13 TO2021-2290%of thoseexpressing anopinion83%of thoseexpressing anopinion90% 90% Improvement ImprovementThe services we provideAll meetings of <strong>Council</strong>, its committees and subcommittees and community boards/committees are open to the public, apart from discussion on any items to be considered withthe public excluded, as provided for in legislation. At the start of each meeting there is time setaside for public comment where anyone can speak for three minutes on any item included onthe order paper for the meeting. This excludes hearings, where only submitters may speak.
134 HUTT CITY LONG TERM PLAN <strong>2012</strong>-2022Prospective income statement for the year ending 30 June: Elected MembersESTIMATE<strong>2012</strong>$000BUDGET2013$000FORECAST2014$000FORECAST2015$000FORECAST2016$000FORECAST2017$000FORECAST2018$000FORECAST2019$000FORECAST2020$000FORECAST2021$000FORECAST2022$000REVENUETotal revenue - - - - - - - - - - -EXPENDITUREEmployee costs - - - - - - - - - - -Support costs/internal charges 817 719 698 713 721 744 745 730 719 717 705Operating costs 1,167 1,237 1,246 1,276 1,306 1,339 1,373 1,431 1,445 1,484 1,522Depreciation - 4 3 2 1 1 - - - - -Total expenditure 1,984 1,960 1,947 1,991 2,028 2,084 2,118 2,161 2,164 2,201 2,227DEFICIT BEFORE TAX (1,984) (1,960) (1,947) (1,991) (2,028) (2,084) (2,118) (2,161) (2,164) (2,201) (2,227)ELECTED MEMBERS - PROSPECTIVE FUNDING REQUIREMENTRATES FUNDING REQUIREMENTSurplus/(deficit) (1,984) (1,960) (1,947) (1,991) (2,028) (2,084) (2,118) (2,161) (2,164) (2,201) (2,227)Total rates funding requirement (1,984) (1,960) (1,947) (1,991) (2,028) (2,084) (2,118) (2,161) (2,164) (2,201) (2,227)LOAN FUNDING REQUIREMENTLess depreciation - 4 3 2 1 1 - - - - -Total loan (funding)/repayment - 4 3 2 1 1 - - - - -TOTAL FUNDING REQUIREMENT (1,984) (1,956) (1,944) (1,989) (2,027) (2,083) (2,118) (2,161) (2,164) (2,201) (2,227)
HUTT CITY LONG TERM PLAN <strong>2012</strong>-2022135Advice and SupportWhat we doThis activity comprises the processes that support our decision-making, such as strategicplanning, policy development and monitoring and reporting.Why we do itProfessional advice and support are necessary to help us and community boards andcommittees to make informed decisions on behalf of our community.Effects on community wellbeingThe Advice and Support activity promotes social, economic, environmental and culturalwellbeing through contributing to projects across all of <strong>Council</strong>, and contributes to allcommunity outcomes. Looking at the potential for negative effects associated with thisactivity, there is a possibility that providing advice that balances the needs and wants of thelocal community in the interests of the public good may cause a negative effect on individualsor groups.The services we provide<strong>Council</strong> officers provide free and frank, professional advice to the <strong>Council</strong>, its committees andsubcommittees, and community boards/committees. This enables transparent decision-makingand provides assurance that rigorous analysis underpins council processes and decisions.How we measure the success of our servicesMEASURE<strong>Council</strong>lors are satisfiedor more than satisfiedwith the formal advicethey receive from officers(measured by internalsurvey)<strong>Council</strong>lors are satisfiedor more than satisfiedwith responses torequests for help fromofficers (measured byinternal survey)Community board andcommunity committeemembers are satisfiedor more than satisfiedwith the formal advicethey receive from officers(measured by internalsurvey)Community board andcommunity committeemembers are satisfied ormore than satisfied withresponses to requestsfor help from officers(measured by internalsurvey)ACHIEVED2008-09ACHIEVED2009-10ACHIEVED2010-11TARGET2011-1290% 88% 88% 80% ofthoseexpressingan opinion100% 88% 95% 80% ofthoseexpressingan opinionInsufficientnumbersof surveyforms werereturned toensure astatisticallyrobustanalysisInsufficientnumbersof surveyforms werereturned toensure astatisticallyrobustanalysis88% 88% 80% ofthoseexpressingan opinion88% 95% 80% ofthoseexpressingan opinionNote: Survey percentages quoted exclude those who responded ‘Don’t know’.TARGET<strong>2012</strong>-13 TO2021-2280% ofthoseexpressingan opinion80% ofthoseexpressingan opinion80% ofthoseexpressingan opinion80% ofthoseexpressingan opinion
136 HUTT CITY LONG TERM PLAN <strong>2012</strong>-2022Prospective income statement for the year ending 30 June: Advice and SupportESTIMATE<strong>2012</strong>$000BUDGET2013$000FORECAST2014$000FORECAST2015$000FORECAST2016$000FORECAST2017$000FORECAST2018$000FORECAST2019$000FORECAST2020$000FORECAST2021$000FORECAST2022$000REVENUEOther revenue - - 143 - - 154 - - 166 - -Total revenue - - 143 - - 154 - - 166 - -EXPENDITUREEmployee costs - - 31 - - 33 - - 36 - -Support costs/internal charges 4,064 4,064 3,943 4,030 4,070 4,203 4,211 4,124 4,064 4,049 3,981Operating costs 38 43 321 45 46 344 49 50 372 52 54Total expenditure 4,102 4,107 4,295 4,075 4,116 4,580 4,260 4,174 4,472 4,101 4,035DEFICIT BEFORE TAX (4,102) (4,107) (4,152) (4,075) (4,116) (4,426) (4,260) (4,174) (4,306) (4,101) (4,035)ADVICE AND SUPPORT - PROSPECTIVE FUNDING REQUIREMENTRATES FUNDING REQUIREMENTSurplus/(deficit) (4,102) (4,107) (4,152) (4,075) (4,116) (4,426) (4,260) (4,174) (4,306) (4,101) (4,035)Total rates funding requirement (4,102) (4,107) (4,152) (4,075) (4,116) (4,426) (4,260) (4,174) (4,306) (4,101) (4,035)TOTAL FUNDING REQUIREMENT (4,102) (4,107) (4,152) (4,075) (4,116) (4,426) (4,260) (4,174) (4,306) (4,101) (4,035)
HUTT CITY LONG TERM PLAN <strong>2012</strong>-2022137Managing ServicesWhat we doManaging Services incorporates the organisational support functions that help us to provideour other activities efficiently and effectively.Why we do itThe Managing Services activity supports all our activities by providing business, legal andsupport services and tools.Effects on community wellbeingThe Managing Services activity promotes social, economic, environmental and culturalwellbeing through providing services which support all other activities, and contributes toall community outcomes. Any potential negative effects associated with supporting all the<strong>Council</strong>’s other activities have been identified under each activity.The services we provide<strong>Council</strong> officers provide human resources, financial management, corporate, legal,communications, customer and information services to support all other <strong>Council</strong> activities.How we measure the success of our servicesMEASUREStaff turnover (measuredby management reports)Legal and policyrequirements (measuredby management reports)Work-related accidents(measured bymanagement reports)ACHIEVED2008-09ACHIEVED2009-10ACHIEVED2010-11TARGET2011-1210% 3.5% 11.37% Less than12%Nosignificantinstancesof noncomplianceSix workrelatedaccidentsresultedin time offworkNosignificantinstancesof noncomplianceSevenworkrelatedaccidentsresultedin time offworkNosignificantinstancesof noncomplianceFour workrelatedaccidentsresultedin time offworkNosignificantinstancesof noncomplianceFewer thansix resultingin time offworkTARGET<strong>2012</strong>-13 TO2021-22Less than12%Nosignificantinstancesof noncomplianceNo morethan fourresultingin time offwork
138 HUTT CITY LONG TERM PLAN <strong>2012</strong>-2022Major projects planned<strong>2012</strong>-13COST$0002013-14COST$0002014-15COST$0002015-16COST$0002016-17COST$0002017-18COST$0002018-19COST$0002019-20COST$0002020-21COST$0002021-22COST$0002022-23COST$0002023-24COST$0002024-25COST$0002025-26COST$0002026-27COST$0002027-28COST$0002028-29COST$0002029-30COST$0002030-31COST$0002031-32COST$000Capital ReplacementsAdministration Building Maintenance 39 114 77 323IT System Maintenance250(Carryover from 2011/<strong>2012</strong>)Network Storage/Server Hardware & PC 275 302 278 295 287 288 278 309 317 357 353 344 372 409 441 416 404 538 552 461Replacement ProgrammeSystem Maintenance 586 355 184 123 682 261 263 327 335 307 752 948 155 485 349 337 415 423 434 396System Upgrades 405 225 115 338 743 643 87 362 372 400 648 494 966 638 676 650 562 469 481 518Telecommunications 45 26 26 27 138 73 29 30 30 156 58 165 34 208 213 146 150 77 39 202The Pavilion Maintenance 15 32 68 119 98 63 257 40 54 171 146 215 97Capital ImprovementsCivic Buildings (Admin Bldg/Town Hall/140 174 10,129 11,344Horticultural Hall) StrengtheningDigitisation of <strong>Council</strong> Core Information 220 225 231 236 242 248 255 261 268 275 282 290 297 305 313 321 329 338 347 356Internet Online Services 95 97 121 113 127 118 133 89 91 100 122 151 142 159 178 197 187 115 118 121Mobile Devices 39 126 105 85 83 96 109 71 73 50 99 107 208 213 219 187 92 95 97Other (IT) Projects 230 333 357 354 435 288 434 421 433 350 295 520 405 555 605 657 674 561 575 590The Pavilion Fire Protection70(Carryover from 2011/<strong>2012</strong>)The Pavilion Improvements 80 161 178 128 180 135Operating ProjectsInternet Design 35Marketing Economic Stimulus Package 25Quality of Life Study 40Representation Review 20Research - Monitoring & Evaluation ofOutcomes50
HUTT CITY LONG TERM PLAN <strong>2012</strong>-2022139Prospective income statement for the year ending 30 June: Managing ServicesESTIMATE<strong>2012</strong>$000BUDGET2013$000FORECAST2014$000FORECAST2015$000FORECAST2016$000FORECAST2017$000FORECAST2018$000FORECAST2019$000FORECAST2020$000FORECAST2021$000FORECAST2022$000REVENUERates Funding 85,384 87,596 90,390 93,274 96,250 99,417 102,688 106,170 109,770 113,601 117,453User charges 1,634 1,171 1,199 1,228 1,257 1,288 1,321 1,355 1,390 1,428 1,465Interest earned 278 285 300 292 271 248 213 186 157 136 126Other revenue 124 140 143 147 150 154 158 162 166 171 175Total revenue 87,420 89,192 92,032 94,941 97,928 101,107 104,380 107,873 111,483 115,336 119,219EXPENDITUREEmployee costs 8,805 8,936 9,120 9,339 9,648 9,889 10,136 10,400 10,670 10,958 11,243Support costs/internal charges (14,821) (16,382) (15,893) (16,246) (16,408) (16,945) (16,973) (16,626) (16,382) (16,321) (16,046)Operating costs 1,556 2,743 2,830 2,955 2,940 2,992 3,202 3,146 3,252 3,437 3,426Interest expenditure 104 79 77 73 84 92 91 86 80 73 75Depreciation 2,413 2,947 2,618 3,319 4,826 5,334 4,918 4,475 4,049 3,784 3,549Total expenditure (1,943) (1,677) (1,248) (560) 1,090 1,362 1,374 1,481 1,669 1,931 2,247SURPLUS BEFORE TAX (INCL RATES) 89,363 90,869 93,280 95,501 96,838 99,745 103,006 106,392 109,814 113,405 116,972MANAGING SERVICES - PROSPECTIVE FUNDING REQUIREMENTRATES FUNDING REQUIREMENTSurplus/(deficit) 89,363 90,869 93,280 95,501 96,838 99,745 103,006 106,392 109,814 113,405 116,972Rate funded debt repayment 5,577 3,406 203 (1,104) 428 571 76 (1,290) (3,362) (4,261) (4,623)Total rates funding requirement 94,940 94,275 93,483 94,397 97,266 100,316 103,082 105,102 106,452 109,144 112,349LOAN FUNDING REQUIREMENTCapital expenditure - maintaining services (1,395) (1,311) (924) (603) (816) (1,850) (1,332) (656) (1,146) (1,153) (1,283)Capital expenditure - improving services (905) (804) (955) (10,942) (12,293) (886) (750) (931) (1,021) (866) (726)Less depreciation 2,413 2,947 2,618 3,319 4,826 5,334 4,918 4,475 4,049 3,784 3,549Less rate funded debt repayment (5,577) (3,406) (203) 1,104 (428) (571) (76) 1,290 3,362 4,261 4,623Total loan (funding)/repayment (5,464) (2,574) 536 (7,122) (8,711) 2,027 2,760 4,178 5,244 6,026 6,163TOTAL FUNDING REQUIREMENT 89,476 91,701 94,019 87,275 88,555 102,343 105,842 109,280 111,696 115,170 118,512
140 HUTT CITY LONG TERM PLAN <strong>2012</strong>-2022Funding impact statement for the year ending 30 June: Group OrganisationACTUAL2011$000ESTIMATE<strong>2012</strong>$000BUDGET2013$000FORECAST2014$000FORECAST2015$000FORECAST2016$000FORECAST2017$000FORECAST2018$000FORECAST2019$000FORECAST2020$000FORECAST2021$000FORECAST2022$000Sources of operating fundingGeneral rates, uniform annual general charges, rates penalties 4,701 (372) 2,598 6,318 8,361 8,655 9,254 9,747 11,294 13,811 14,922 15,670Targeted rates (other than a targeted rate for water supply) - - - - - - - - - - - -Subsidies and grants for operating purposes - - - - - - - - - - - -Fees, charges and targeted rates for water supply 1,075 1,634 1,171 1,199 1,228 1,257 1,288 1,321 1,355 1,390 1,428 1,465Internal charges and overheads recovered 13,969 14,821 16,382 15,893 16,246 16,408 16,945 16,973 16,626 16,382 16,321 16,046Local authorities fuel tax, fines, infringement fees, and other receipts 703 402 425 586 439 421 556 371 348 489 307 301Total operating funding (A) 20,448 16,485 20,576 23,996 26,274 26,741 28,043 28,412 29,623 32,072 32,978 33,482Applications of operating fundingPayments to staff and suppliers 12,666 11,566 12,959 13,548 13,615 13,940 14,597 14,760 15,027 15,775 15,931 16,245Finance costs 166 104 79 77 73 84 92 91 86 80 73 75Internal charges and overheads applied 4,590 4,881 4,783 4,641 4,743 4,791 4,947 4,956 4,854 4,783 4,766 4,686Other operating funding applications 2,305 3,098 3,210 3,312 3,418 3,527 3,643 3,763 3,891 4,023 4,163 4,304Total applications of operating funding (B) 19,727 19,649 21,031 21,578 21,849 22,342 23,279 23,570 23,858 24,661 24,933 25,310Surplus (deficit) of operating funding (A-B) 721 (3,164) (455) 2,418 4,425 4,399 4,764 4,842 5,765 7,411 8,045 8,172Sources of capital fundingSubsidies and grants for capital expenditure - - - - - - - - - - - -Development and financial contributions - - - - - - - - - - - -Increase (decrease) in debt 1,574 2,037 (672) (156) 6,642 6,637 (2,411) (430) (3,834) (4,841) (9,834) (3,296)Gross proceeds from sale of assets - - - - - - - - - - - -Lump sum contributions - - - - - - - - - - - -Total sources of capital funding ( C ) 1,574 2,037 (672) (156) 6,642 6,637 (2,411) (430) (3,834) (4,841) (9,834) (3,296)Application of capital fundingCapital expenditure- to meet additional demand- to improve level of service 1,200 (620) (560) 1,145 10,431 10,855 386 2,945 1,269 1,353 (1,520) 2,175- to replace existing assets 1,097 (507) (567) 1,117 636 181 1,967 1,467 662 1,217 (269) 2,701Increase (decrease) in reserves - - - - - - - - - - - -Increase (decrease) of investments - - - - - - - - - - - -Total applications of capital funding (D) 2,297 (1,127) (1,127) 2,262 11,067 11,036 2,353 4,412 1,931 2,570 (1,789) 4,876Surplus (deficit) of capital funding (C-D) (723) 3,164 455 (2,418) (4,425) (4,399) (4,764) (4,842) (5,765) (7,411) (8,045) (8,172)Funding balance ((A-B)+(C-D)) (2) - - - - - - - - - - -
HUTT CITY LONG TERM PLAN <strong>2012</strong>-2022141Whole of <strong>Council</strong>Prospective income statement for the year ending 30 JuneESTIMATE<strong>2012</strong>$000BUDGET2013$000FORECAST2014$000FORECAST2015$000FORECAST2016$000FORECAST2017$000FORECAST2018$000FORECAST2019$000FORECAST2020$000FORECAST2021$000FORECAST2022$000REVENUERates Funding 85,384 87,596 90,390 93,274 96,250 99,417 102,688 106,170 109,770 113,601 117,453User charges 27,894 29,470 30,224 31,831 32,648 33,463 33,849 34,960 35,867 36,837 37,796Operating contributions 3,505 3,511 3,546 3,631 3,884 3,981 4,080 4,186 4,295 4,412 4,526Capital contributions 4,784 4,112 4,214 4,359 5,771 16,198 5,396 6,913 5,843 5,494 5,637Upper <strong>Hutt</strong> CC operating contribution 2,690 2,761 2,741 2,806 2,874 2,945 3,019 3,097 3,177 3,263 3,348Development and financial contributions 279 708 725 743 761 779 799 820 842 864 886Interest earned 278 285 300 292 271 248 213 186 157 136 126Vested Assets 430 600 613 630 643 660 678 695 714 732 750Other revenue 3,281 3,646 3,874 3,823 3,914 4,166 4,111 4,220 4,495 4,445 4,561Total revenue 128,525 132,689 136,627 141,389 147,016 161,857 154,833 161,247 165,160 169,784 175,083EXPENDITUREEmployee costs 26,601 25,978 26,510 27,036 27,934 28,666 29,350 30,112 30,929 31,727 32,554Support costs/internal charges (3) - - - - - - - - - -Operating costs 67,428 69,609 70,542 72,174 74,228 76,681 78,548 81,067 83,889 86,337 88,927Interest expenditure 4,298 4,000 3,880 3,715 4,269 4,663 4,599 4,375 4,040 3,727 3,806Depreciation 30,716 31,688 30,959 32,258 34,481 35,441 36,217 36,670 36,255 37,374 38,650Total expenditure 129,040 131,275 131,891 135,183 140,912 145,451 148,714 152,224 155,113 159,165 163,937SURPLUS BEFORE REVALUATION GAINS (515) 1,414 4,736 6,206 6,104 16,406 6,119 9,023 10,047 10,619 11,146Revaluation Gains (81) - - - - - - - - - -Gain on Asset revaluation 99,234 - - 61,525 - - 69,679 - - 75,315 -SURPLUS BEFORE TAX 98,638 1,414 4,736 67,731 6,104 16,406 75,798 9,023 10,047 85,934 11,146Taxation - - - - - - - - - - -SURPLUS AFTER TAX 98,638 1,414 4,736 67,731 6,104 16,406 75,798 9,023 10,047 85,934 11,146
HUTT CITY LONG TERM PLAN <strong>2012</strong>-2022143COUNCIL-CONTROLLED ORGANISATIONSWe operate four <strong>Council</strong>-Controlled Organisations (CCOs): Seaview Marina Limited,Urban Plus Limited (trading as urbanplus), Capacity Infrastructure Services Limited(trading as Capacity), and the <strong>Hutt</strong> <strong>City</strong> Community Facilities Trust.These organisations help in achieving our goals or outcomes by independentlymanaging facilities, delivering services and undertaking developments on behalf of theLower <strong>Hutt</strong> community.The performance measures and targets outlined here are included in the Draft Statementsof Intent for <strong>2012</strong>-2013. These will be finalised by 30 June <strong>2012</strong>.SEAVIEW MARINA LIMITEDOur objective for this company is for it to own and operate the Seaview Marina as a facility forthe enjoyment of the Lower <strong>Hutt</strong> community, without compromising its commercial objectivesand environmental responsibilities.The company’s key performance targets are:• Completion of an approved asset management plan within the agreed timeframe.• Deliver budgeted operating and maintenance activities for Seaview Marina Limited asdetailed in the operational plan.• Manage and operate Seaview Marina Limited within its budget as approved by the Board.• Provide an agreed return on equity of 5% to <strong>Hutt</strong> <strong>City</strong> <strong>Council</strong>.• Achieve targeted marina berth, trailer park, and hard stand occupancy rates.• Achieve improvement in monthly boat haul out performance.• Achieve greater than an 85% satisfaction rating from customers including all licensees,casual users of the marina and the general public.• Achieve full compliance with financial, technical and regulatory standards.• Construct and lease a Café on the marina site.• Develop a capital expenditure plan to provide improved facilities for other users of themarina, to encourage particularly walkers and cyclists onto the marina and become the linkbetween the <strong>Hutt</strong> River Trail and the Eastern Bays Walkway.URBAN PLUS LIMITED (TRADING AS URBANPLUS)Our objective for this company is for it to own and operate a portfolio of rental housing,develop property in preparation for sale or lease, and manage council property and buildingassets. The company was re-established in 2007 as a <strong>Council</strong>-Controlled Trading Organisation,and <strong>Council</strong> transferred its social housing and property management functions to the companyin May 2007.The company’s key performance targets are:Property management:• Net capital and operational expenditure within budget.• Achieve a 20% net profit margin.• Resident satisfaction with public halls greater than or equal to peer average, subject to<strong>Council</strong> funding.• Resident satisfaction with public toilets greater than or equal to peer average within fiveyears, subject to <strong>Council</strong> funding.• Tenant satisfaction with <strong>Council</strong>-owned community buildings greater than or equal to 90%.• <strong>Council</strong> satisfaction with building management 90%.Rental housing:• Net capital and operational expenditure within budget.• A return on equity before depreciation after interest and tax of 3.5%.• Tenant satisfaction with the provision of the company’s rental housing greater than or equalto 90%.• Percentage of total housing units occupied by elderly/socially disadvantaged greater thanor equal to 85%.Property development:• Net capital and operational expenditure within budget.• A return of 10% after interest and tax.
144 HUTT CITY LONG TERM PLAN <strong>2012</strong>-2022CAPACITY INFRASTRUCTURE SERVICES LIMITED (TRADING AS CAPACITY)Our objective for this company is for it to manage, for the long term, the provision of water,wastewater and stormwater services to <strong>Hutt</strong> <strong>City</strong> <strong>Council</strong> and Wellington <strong>City</strong> <strong>Council</strong>, and tooperate as a successful business, managed on a non-profit basis.The company’s key performance targets are:• Measures included in the Water Supply, Wastewater and Stormwater activities.• Number of dwelling flood notifications received as a result of a 1:50 year flooding event(or less).• Completion of an approved asset management plan within the agreed timeframe.• Trend of the operating cost of delivering water supply, wastewater and stormwaterservices relative to a national average.• Deliver operating projects within budget and timeframes.• Deliver capital projects within budget and timeframes.• Manage Capacity within budget.• Full compliance with relevant standards, resource consents and legislation.HUTT CITY COMMUNITY FACILITIES TRUSTOn 13 March <strong>2012</strong> <strong>Council</strong> agreed to a proposal to establish a charitable trust to manageand develop its leisure and community facilities.Our objective for this Trust is for it to enhance the health and wellbeing of the city’scommunities through the effective and efficient provision, development and operationof leisure and community facilities throughout <strong>Hutt</strong> <strong>City</strong>. This will include establishinga development fund to enable investment and improvement of community facilities,developing new or enhancing existing facilities, administering any facilities vested in theTrust, and providing strategic direction, expert advice and championing ongoing investmentand development.The Trust’s key performance targets are:• Developments are delivered within timeframes and budget allocations.• Property maintenance and administration is carried out in accordance with assetmanagement plans, health, safety and building code requirements.• The Trust is recognised as a role model for community facility ownership, managementand development.• Fundraising and capital development targets are set and obtained.• Investments, bequeaths, allocations, grants etc are used in accordance with donorconditions and within timeframes set.While this long term plan does not provide for the Trust to take ownership of the Taita Communityand Recreation Centre, this is still <strong>Council</strong>’s ultimate intention. Financial and accountingadjustments will be required to the long term plan in the coming years to address this.Further minor changes to the <strong>2012</strong>-2022 long term plan may be required once developmentand funding plans for Taita and Fraser Park Sportville have been finalised. It is expected thatthe overall financial contribution from <strong>Council</strong> towards these developments will be similar tofunding provisions made in this long term plan.
146 HUTT CITY LONG TERM PLAN <strong>2012</strong>-2022OUR COMMUNITY PARTNERSHIPSWe can’t fulfil our role in the Lower <strong>Hutt</strong> community on our own, and our success dependslargely on working closely with other people. We’ve forged a number of close and highlyproductive working relationships with people and groups in our community, including:• Contractors, service suppliers, consultants and advisors.• Businesses and their representative organisations.• Local mana whenua and marae.• Local and central government agencies.• Volunteer organisations.• Community groups and individuals.Our community boards and community committees also work closely with people in theirlocal area.PARTNERSHIPS WITH MAORIWaiho i te toipoto, kaua i te toiroaLet us keep close, not far apart<strong>Council</strong> has an obligation to take into account the principles of Te Tiriti o Waitangi and torecognise and provide for the special relationships between Mäori and their culture, traditions,land and taonga.The Local Government Act 2002 acknowledges the Crown’s responsibilities under the Treatyof Waitangi and the responsibility to maintain and improve opportunities for Mäori to contributeto local government decision-making processes.The obligation to consult includes recognising those who have mana whenua status.Within <strong>Hutt</strong> <strong>City</strong>, this rests with Taranaki Whanui, represented by the Port Nicholson BlockSettlement Trust.<strong>Council</strong> will also consult the Wellington Tenths Trust as a Mana Whenua Trust and with TeRunanganui o Taranaki Whanui ki te Upoko o te Ika a Maui as a mana whenua organisation.In fulfilling its obligations, <strong>Council</strong> will also consult other Mäori within <strong>Hutt</strong> <strong>City</strong>, including thecity’s seven marae – Koraunui Marae, Te Mangungu Marae, Wainuiomata Marae, Te Kakanoo te Aroha Marae, Waiwhetu Marae (also known as Arohanui ki te tangata), Te Tatau o te PoMarae and Keriana Olsen-Kokiri Marae.<strong>Council</strong> has a memorandum of understanding with the Port Nicholson Block Settlement Trust.This memorandum confirms the strategic relationship between the parties and the opportunityfor the Trust to contribute to <strong>Council</strong> decision-making and be a provider of leadership with<strong>Council</strong> for the city.• The memorandum provides the following guiding principles for the Trust and <strong>Hutt</strong><strong>City</strong> <strong>Council</strong>:• The parties work together in partnership to ensure the mutual benefit and successof the relationship.• The sustainable prosperity of <strong>Hutt</strong> <strong>City</strong> is important to both parties.• Each party recognises the autonomy, authority and responsibilities of the other to representtheir communities’ interests.• The Trust acknowledges the autonomy, authority and responsibilities of <strong>Council</strong> when actingin its regulatory capacity and when discharging its legislative obligations.• The principles embodied in the Treaty of Waitangi will guide this relationship. In practicalterms this means:Partnership - Acting reasonably, honourably and in good faith to ensure the strategicrelationship has integrity and respect, in the present and for the future of <strong>Hutt</strong> <strong>City</strong>.Participation - Recognising that both parties can contribute, for mutual benefit,indecidingthe future of the city – working towards and achieving the parties’ visions.Protection - Actively protecting the taonga of Taranaki Whanui and safeguarding culturalconcepts, values and practices to be celebrated and enjoyed for all <strong>Hutt</strong> <strong>City</strong> residents.The memorandum also provides specifically for engagement between the Trust and <strong>Hutt</strong> <strong>City</strong><strong>Council</strong> on:<strong>Council</strong> planning and policy processes – The Trust will have input into the various planningprocesses of <strong>Council</strong>, in particular the Annual <strong>Plan</strong> and <strong>Long</strong> <strong>Term</strong> <strong>Plan</strong>.The Trust will make significant contributions to reviewing the District <strong>Plan</strong> of <strong>Council</strong>. Thiswill include commentary on all matters relating to mana whenua representation, sites ofsignificance and rules, protocols, objectives and measures that are required.
HUTT CITY LONG TERM PLAN <strong>2012</strong>-2022147Resource Management Act 1991 and other legislation – The parties will work together toachieve the purpose of legislation in relation to local government decision-making.The <strong>Council</strong> will ensure matters are presented to the Trust in a timely and informative manner,which in turn will assist the Trust in the exercise of its Kaitiakitanga for <strong>Hutt</strong> <strong>City</strong>.Culture and heritage – <strong>Council</strong> will ensure ceremonial, interpretation and namingopportunities are presented to the Trust so as to retain and protect Mäori culture and heritagethroughout <strong>Hutt</strong> <strong>City</strong>, as deemed by the Trust to be of significance.The Trust, as the mana whenua representative, will provide cultural support to the Mayor,councillors, Chief Executive and other staff as mutually agreed.While <strong>Hutt</strong> <strong>City</strong> <strong>Council</strong> will take special care in its relationship with mana whenua, it must alsoreach out to the wider Mäori community and provide opportunities for Maori to contribute to<strong>Council</strong>’s decision-making.The key to this will be to foster and maintain strong relationships with Mäori organisationswithin the city – in particular, Te Runanganui o Taranaki Whanui ki te Upoko o te Ika a Maui andthe city’s seven marae.The foundation of these relationships will be built on:• Open and honest communication between <strong>Council</strong> and Mäori.• Promoting tikanga Mäori (Te Atiawa protocol) throughout <strong>Council</strong>.• Providing opportunities for Mäori to contribute to our decision-making.• Providing quality advice and support for capacity and capability strengthening.• Maintaining the right of tangata whenua to be represented and vote at meetings of <strong>Hutt</strong><strong>City</strong> <strong>Council</strong> committees and subcommittees.There are three priority areas for improving our engagement with Mäori in the next five years:• Fully engaging with and fostering our new strategic relationship with the Port NicholsonBlock Settlement Trust.• Involving mana whenua and our local Mäori organisations earlier in the decision-makingprocess. For example, engaging mana whenua on <strong>Council</strong>’s Annual <strong>Plan</strong> prior to finalisationfor public consultation and engaging our local marae early on issues into which they haveinsight and on which they can help us determine solutions.• Getting Mäori in general involved in the decision-making process, including looking at waysof engaging that make it easier and more appealing for Mäori to have their say.SHARED SERVICESThe bulk of our current shared services are in joint operations with Upper <strong>Hutt</strong>, overseen bythe <strong>Hutt</strong> Valley Services Committee, a joint committee of the two councils. These includeSilverstream landfill, Akatarawa cemetery, the <strong>Hutt</strong> Valley Trunk Wastewater network includingthe Seaview treatment plant, emergency management, environmental inspections, noisecontrol and dog control.In addition, and reflecting our growing focus on this area, the following regional initiativeshave progressed:• A joint Waste Management and Minimisation <strong>Plan</strong> has been completed for the region.• A single regional entity will provide improved emergency management outcomes from1 July <strong>2012</strong>.• The libraries of <strong>Hutt</strong> <strong>City</strong>, Porirua <strong>City</strong>, Kapiti District, Masterton District, WelTec andWhitireia Community Polytechnic have been operating New Zealand’s only tertiaryand public library collaboration. Called SMART, the libraries have migrated to the sameserver platform, implemented standardised cataloguing, loan, renewal and borrowerpolicies, shared training and technical expertise, implemented a region-wide technicaltroubleshooting protocol and negotiated a number of consortia agreements for productsand services. The 2011-<strong>2012</strong> year saw the introduction of a regional public catalogue andlibrary card, including the removal of reserve charges across the region.• A number of joint procurement contracts have been entered into which have generatedconsiderable savings for the Wellington councils. These include contracts for stationery,printing, photocopiers, insurance, property valuations and geospatial information tools.• <strong>Council</strong> staff throughout the region have been working together to look at options for acommon online building consent process. Any development of this will take into accountthe fact that the Department of Building and Housing is also looking at introducing anational online building consent process some time in the future.<strong>Hutt</strong> <strong>City</strong> <strong>Council</strong> is also one of nine councils in the Wellington region committed to workingtogether to promote regional economic development through the Wellington Regional Strategy(WRS). The WRS focuses on achieving sustainable economic growth and development in theregion. We will continue work with Greater Wellington Regional <strong>Council</strong> in its role as “host”of the WRS, including supporting the WRS Committee in its role of overseeing the decisionmakingand governance of the WRS.
HUTT CITY LONG TERM PLAN <strong>2012</strong>-2022149DOLLARS AND CENTSFinancial SummaryThe following table outlines the budget for the current year and for the next ten years. Itshows that we can achieve an annual operating surplus and reduce debt from $66.9 millionin <strong>2012</strong> to $44.6 million by 2015. <strong>Council</strong>’s total revenue from rates in the <strong>2012</strong>/13 financialperiod represents a 2.59% increase on current revenue. About 0.8% of that increase willcome from rates on new developments in the city, meaning the average increase to existingratepayers is around 1.8%. The <strong>Long</strong> <strong>Term</strong> <strong>Plan</strong> outlines which capital and other projects willbe implemented during each year.Ten Year Financial SummaryFor the year ending 30th JuneYEAROPERATINGREVENUEOPERATINGEXPENDITUREOPERATINGSURPLUSBEFOREREVALUATIONGAINS ANDLOSSESCAPITALEXPENDITURENET DEBT ATEND OF THEYEARNET ASSETSAT END OF THEYEARANNUALINCREASEIN RATESREVENUEINCLUDINGINFLATION<strong>2012</strong> 128,525 129,040 (515) 30,839 66,972 1,247,743 0.00%2013 132,689 131,275 1,414 29,181 59,934 1,249,157 2.59%2014 136,627 131,891 4,736 29,754 50,648 1,253,893 3.19%2015 141,389 135,183 6,206 34,382 44,604 1,321,624 3.19%2016 147,016 140,912 6,104 54,356 55,846 1,327,728 3.19%2017 161,857 145,451 16,406 61,295 64,765 1,344,134 3.29%2018 154,833 148,714 6,119 42,253 64,355 1,419,932 3.29%2019 161,247 152,224 9,023 37,864 56,121 1,428,955 3.39%2020 165,160 155,113 10,047 34,867 44,336 1,439,002 3.39%2021 169,784 159,165 10,619 69,665 56,349 1,524,936 3.49%2022 175,083 163,937 11,146 49,588 51,552 1,536,082 3.39%Figures are in thousands of dollars and include inflation estimates.What it costs to run the cityYear end 30 June 2013GROUP OF ACTIVITIESNET COST PER RESIDENTLibraries, Museums, Aquatics & Recreation, Parks & Reserves, & Community$371DevelopmentRoading & Traffic $247Water Supply $138Wastewater $190Stormwater $69Solid Waste $60Environmental & Emergency Management $101Economy & Urban Environment $49Governance, Advice & Support $42Where does council income come from?Where does council spend money?45% ($59.4m) Rates - based on capital value22% ($29.5m) User charges21% ($28.2m) Rates - fixed charges5% ($6.3m) Operating contributions3% ($4.1m) Capital contributions4% ($5.2m) Other revenue29% ($38.4m) Libraries, Museums,Aquatics & Recreation,Parks & Reserves, andCommunity Development20% ($25.6m) Roading & Traffic11% ($14.3m) Water Supply15% ($19.7m) Wastewater5% ($7.1m) Stormwater5% ($6.3m) Solid Waste8% ($10.5m) Environmental &Emergency Management4% ($5.0m) Economy & Urban Environment3% ($4.4m) Governance, Advice & Support
150 HUTT CITY LONG TERM PLAN <strong>2012</strong>-2022Forecast Financial StatementsSUMMARY<strong>Council</strong> enters a new period of financial management of council activities. While continuingon a path set by the previous financial strategy <strong>Council</strong> continues to keep the rates increasebelow forecast annual CPI plus growth. This plan increased the 2015 debt target to $45m from$40m. Additional targets have been added for debt in 2020, 2025 and 2030 as have the limitsplaced on capital expenditure. The debt reduction is largely achieved through small operatingsurpluses per annum as well as anticipated proceeds from assets sales. Existing and forecastdebt levels are well within <strong>Council</strong>’s financial strategy and are considered to be commerciallyvery reasonable.FORECAST FINANCIAL STATEMENTS <strong>2012</strong>/13 TO 2021/22These are the Forecast Financial Statements which <strong>Council</strong> has adopted to meet therequirements of Clause 12 of Schedule 10 of the Local Government Act 2002. The informationmay not be appropriate for other purposes.Every three years it is a requirement of the Local Government Act 2002 to present ForecastFinancial Statements that span 10 years. This provides an opportunity for ratepayers andresidents to assess the appropriateness of the financial actions planned by <strong>Council</strong>. TheForecast Financial Statements outline how <strong>Council</strong> will be funded for the next 10 years andhow that money will be spent. It is intended to ensure proper and prudent financial and assetmanagement in the long term. The information contained in the Forecast Financial Statementsmay not be appropriate for other purposes.<strong>Council</strong> has Asset Management <strong>Plan</strong>s for its assets. These plans and the financial strategyhave provided the basis for the development of the Forecast Financial Statements.The Forecast Financial Statements have been prepared in accordance with New Zealandgenerally accepted accounting practice (GAAP), as required by section 111 of that Act. <strong>Council</strong>is designated as a public benefit entity for the purposes of complying with GAAP. The ForecastFinancial Statements comply with Financial Reporting Standard No. 42 – Prospective FinancialStatements and New Zealand GAAP.The Forecast Financial Statements are based on estimates of costs and revenues into the future.The degree of uncertainty surrounding these estimates increases as the Forecast FinancialStatements look out further into the future. Key assumptions and risks are outlined below.The Forecast Financial Statements include:• An “Estimate” of the results of the current financial year (2011/12) based on the budgetadjusted for expected variances.• The “Budget” <strong>Council</strong> proposes adopting for the coming financial year (<strong>2012</strong>/13).• “Forecast” results for the following nine years (2013/14 to 2021/22).Actual results achieved for each reporting period are likely to vary from the forecastspresented, and the variations may be material.A <strong>Long</strong> <strong>Term</strong> <strong>Plan</strong> may include forecast financial statements for any <strong>Council</strong>-ControlledOrganisation or other entity under the <strong>Council</strong>’s control. We have not included these due totiming issues associated with the availability of the information, and in the interests of notmaking the document any longer than necessary.<strong>Council</strong> intends to update these Forecast Financial Statements annually.
HUTT CITY LONG TERM PLAN <strong>2012</strong>-2022151FORECASTING ASSUMPTIONSASSUMPTION RISK LEVEL OF UNCERTAINTY REASON FOR THE UNCERTAINTY FINANCIAL IMPACT OF THE UNCERTAINTYRates and Rate Increases<strong>Council</strong> aims to keep increases for theaverage ratepayer within the level ofinflation.Consumer Price Index forecasted (CPI)ACTUAL2010-11ESTIMATE2011-12The CPI for the year as at Junesignificantly differs from that as atconsultation.BUDGET<strong>2012</strong>-13FORECAST2013-14FORECAST2014-15LowFORECAST2015-16The CPI results used in the Draft <strong>Long</strong><strong>Term</strong> <strong>Plan</strong> (LTP) are for the year toDecember 2011. The CPI increase in theapproved plan may differ if the later CPIassessment for the year to March <strong>2012</strong>differs.FORECAST2016-17FORECAST2017-18A significant increase in the CPI between December andMarch may lead to an increase in the base used for therates revenue increase. The impact is that a higher averagerates increase may result.The <strong>Council</strong>’s level of cash and or debt levels may vary asa consequence.5.30% 2.80% 1.80% 2.40% 2.40% 2.40% 2.50% 2.50% 2.60% 2.60% 2.70% 2.60%Note from 2021/22 <strong>Council</strong> assumes CPI at 2.6% for the years 2022 to 2032.Note this inflation has also been used to forecast expenditure as it relates to council costs.FORECAST2018-19FORECAST2019-20FORECAST2020-21FORECAST2021-22Growth<strong>Council</strong> projections for income fromrates revenue include an allowancefor growth and inflation. Growthincorporates population movementsplus half a percent to reflect increasesin the number of properties in <strong>Hutt</strong><strong>City</strong> above that driven by populationmovements.Households increase 12 percent withlittle overall change in socioeconomicindicators between 2011 and 2031.This equates to an annual increase ofapproximately 300 people.That the actual rates for growthwill be significantly different fromthe projected rates of growth.ModUncertainty exists as the actual increase inproperty numbers is not finalised until 30June each year.Population increase is based on the midpointfrom Statistics NZ and is likely tovary each year.The impact is that if growth increases at a lower level thanbudgeted, the average increase will be above that of CPI.If growth increases above that budgeted, the increase forthe average ratepayer is likely to be less than the CPI.Growth ForecastedBUDGET<strong>2012</strong>-13FORECAST2013-14FORECAST2014-15FORECAST2015-16CPI + 0.5% + Pop 2.59% 2.69% 2.69% 2.69% 2.79% 2.79% 2.89% 2.89% 2.99% 2.89%FORECAST2016-17FORECAST2017-18FORECAST2018-19FORECAST2019-20FORECAST2020-21FORECAST2021-22
152 HUTT CITY LONG TERM PLAN <strong>2012</strong>-2022ASSUMPTION RISK LEVEL OF UNCERTAINTY REASON FOR THE UNCERTAINTY FINANCIAL IMPACT OF THE UNCERTAINTYInterest RatesInterest rates are based on the cashand 90 day bill rate as forecasted by themajor trading banks. The swap ratesare based on the five year and ten yearswap rates also forecasted by the majortrading banks.<strong>2012</strong> MarchJune 3.80%September 4.20%December 4.30%2013 March 4.60%June 4.80%September 5.10%December 5.30%2014 March 5.50%June 5.60%September 5.60%December 5.60%A rate of 5.6% has been used foreach year thereafterThe interest rates and swap ratesare significantly different from thatbudgeted.A worsening global financialsituation or slow recovery of theNew Zealand economy may holdrates at lower levels for longer.Mod<strong>Council</strong> has interest rate swaps in placeto minimise the fluctuation of interest ratemovements.Global financial situation and the speed ofgrowth of the New Zealand economy mayinfluence the speed at which the ReserveBank lifts the OCR (Official Cash Rate).Higher interest rates provide ability to earn higher incomefrom cash holdings. Higher interest rates reduce thebook losses currently being made and may lead to higherinterest cost on debt.A movement in interest rates of plus 1% has a positiveeffect of $1.8million on the unrealised value of thederivatives.Floating rate debt - A movement in interest rates ofplus or minus 1% has an effect on interest expense of+/- $300,000 per year.Employee Cost GrowthEmployee numbers remain stableduring the period.Staffing levels are higher or lowerthan budgeted.ModChange in service demand, change in localgovernment structure provide uncertainty.A 1% increase in staff numbers may result in an averagecost increase of $270,000.Natural Disasters andInsurance Costs<strong>Council</strong> will be able to manage andcope with adverse effects of climatechange and or natural disaster eventsand emergency work will be fundedout of normal budgetary provisions.Adequate insurance cover is obtained.The damage exceeds the coverobtained by <strong>Council</strong> (currently$150m) for assets not coveredby LAPP and its ability to fundthe repair reconstruction out ofnormal budgetary provisions. Costof insurance increases more thanbudgeted.High<strong>Council</strong> has in the past covered adverseweather events, e.g. storm damage.<strong>Council</strong> operates an emergencymanagement function to respond to suchevents.Uncertainty arises with scale, duration andlocation of events.Capacity in the insurance market forNew Zealand has decreased, especially inhigh risk areas like Wellington region.<strong>Council</strong> has $1.2billion in assets.<strong>Council</strong> is a member of LAPP (the Local AuthorityProtection Programme). It is hoped LAPP will be able tocover 40%. <strong>Council</strong> would be dependent on governmentfunding (60% share) and additional borrowing to coverthe cost of replacing infrastructure not covered by LAPP.Loss of revenue as a result is not covered. A 5% increasein insurance premium equates to a 0.1% increase inthe general rate. A 30% increase in insurance premiumequates to a 0.6% increase in the general rate.
HUTT CITY LONG TERM PLAN <strong>2012</strong>-2022153ASSUMPTION RISK LEVEL OF UNCERTAINTY REASON FOR THE UNCERTAINTY FINANCIAL IMPACT OF THE UNCERTAINTYPopulation GrowthGrowth does not occur or occursat levels significantly different fromthat forecasted.Growth occurs in sectors of thecommunity and/or the populationaverage age increases.LowA range of factors from housingaffordability, personal circumstances, theeconomy, job availability, lifestyle choice,and ability to change location influencepopulation movement.Zero growth or decline will have a nil impact on serviceprovision. The level of growth forecasted is small bycomparison to the district population providing a smallimpact for the short term (1-5 years). Sustained levelsof zero or lower growth will have a larger impact onaffordability and revenue requirements to maintain currentservice levels, but will not impact capacity requirements ofinfrastructure in the longer term.POPULATION FORECAST 2010-11 2011-12 <strong>2012</strong>-13 2013-14 2014-15 2015-16 2016-17 2017-18 2018-19 2019-20 2020-21 2021-22Population Forecast (rounded) 103,000 103,300 103,000 103,900 104,200 104,500 104,800 105,100 105,400 105,700 106,00 106,300Predicted population increase 0.29% 0.29% 0.29% 0.29% 0.29% 0.29% 0.29% 0.29% 0.29% 0.29%Infrastructure Capacity andDemand ManagementCurrent excess capacity isinsufficient to meet additionaldemand from growth.Water, stormwater andwastewater infrastructure servicesthree councils. Excess growth inany one of those may reduce theability to meet capacity/additionaldemand needs of other councils.LowGrowth factors are low, current capacity issufficient to meet short term demand.Additional demand may require significant investmentsin infrastructure different from that currently planned. Itmay also lead to a change in the development contributionlevies.Asset Revaluation<strong>Council</strong> revalued asset classes as at31 December 2011 in accordance withits accounting policies. The <strong>Council</strong>assesses the carrying value of itsrevalued assets annually to ensure theydo not differ materially from the assets’fair value. For further information pleaserefer to the accounting policies.Revaluation of Water SupplyAssetsThe forecast expenditure for this assetgroup has a confidence rating of plusor minus 9.4% based on the data thatthe council has available. In addition,renewal expenditure has been forecastusing rates inflated from the 2008valuation rather than the December2011 valuation.Asset revaluations differ from thatbudgeted, depreciation chargesresulting may differ.ModMarket buoyancy and property pricinginfluences the value of the propertyassets. Contract and construction pricesinfluence the value of infrastructureassets.Higher level of asset valuation means more depreciationto use to fund asset renewals and some improvements.Lower levels of valuation and depreciation reduce councilability to fund capital from depreciation and place morereliance on funding improvements from other fundingmechanisms such as debt or rates. Depreciation rates arecontained in accounting policies.Minor differences to the forecastlevel of expenditureLowDecember 2011 data not yet incorporatedinto asset renewals.<strong>Council</strong> has assumed that this will not make a materialdifference to the forecast level of expenditure. Figures willbe updated for the final <strong>Long</strong> <strong>Term</strong> <strong>Plan</strong>.
154 HUTT CITY LONG TERM PLAN <strong>2012</strong>-2022ASSUMPTION RISK LEVEL OF UNCERTAINTY REASON FOR THE UNCERTAINTY FINANCIAL IMPACT OF THE UNCERTAINTYRevaluation of Stormwater AssetsThe forecast expenditure for this assetgroup has a confidence rating of plusor minus 8.4% based on the data thatthe council has available. In addition,renewal expenditure has been forecastusing rates inflated from the 2008valuation rather than the December2011 valuation.Revaluation of Wastewater AssetsThe forecast expenditure for this assetgroup has a confidence rating of plusor minus 16.8% based on the data thatthe council has available. In addition,renewal expenditure has been forecastusing rates inflated from the 2008valuation rather than the December2011 valuation.Asset SalesAsset sales are budgeted to occur inthe next three years.NZ Transport Agency<strong>Council</strong> receives a subsidy of 47% foroperating and 57% for capital works.Level of DebtDebt levels differ from budgetand target.Sources of Debt FundingSignificant assets are generally fundedthrough depreciation, sponsorship,subsidies or debt.<strong>Council</strong> has the ability to continue toraise funding by issuing commercialpaper via tender to a dealer panel.<strong>Council</strong> raises floating rate notes frombanks via tender or private placement.Leaky Homes<strong>Council</strong> has an agreement withDepartment of Building and Housing tocontribute up to 25% towards agreedrepairs.Minor differences to the forecastlevel of expenditureMinor differences to the forecastlevel of expenditureAsset sales do not eventuate and/or timing of asset sales differs tobudget.Change in subsidy rate andvariation criteria for inclusion in thequalifying programme of works.Higher debt levels leads to higherservicing costs.<strong>Council</strong> is unable to issue paperdue to lack of interest from themarket.Floating rate notes may be anexpensive source of funding.Sponsorship unable to be received,greater reliance on alternativefunding sources eg. debt.The value of the claims exceedsthat able to be accommodatedwithin existing budgets.LowLowDecember 2011 data not yet incorporatedinto asset renewals.December 2011 data not yet incorporatedinto asset renewals.<strong>Council</strong> has assumed that this will not make a materialdifference to the forecast level of expenditure. Figures willbe updated for the final <strong>Long</strong> <strong>Term</strong> <strong>Plan</strong>.<strong>Council</strong> has assumed that this will not make a materialdifference to the forecast level of expenditure. Figures willbe updated for the final <strong>Long</strong> <strong>Term</strong> <strong>Plan</strong>.High Level of purchaser interest is unknown. Funding mechanisms such as debt or rates are usedto substitute for the loss of sales income. Higher debtlevels may result. Capital programme may be reduced tocompensate for delaying infrastructure upgrades.LowLowThe impact of projects of nationalsignificance and reconstruction ofChristchurch may change criteria.Ability to service debt from existingfunding sources reduces.<strong>Council</strong> receives approximately $13m in subsidies. A 2%change in subsidy rate equates to approximately $500,000impact, either through reduced work programme orfunding from other sources.Change in capital programme, service levels offered by<strong>Council</strong> or rates revenue requirements may lead to achange in debt levels.Mod Reliance on the market. <strong>Council</strong> has a committed facility of $25m to cover fundingshould no commercial paper be picked up by the market.Floating rate note cost may be more than budgeted.Mod The level of claims is unknown. The cost of claims not met from existing budgets overallwill increase the level of council debt.
HUTT CITY LONG TERM PLAN <strong>2012</strong>-2022155ASSUMPTION RISK LEVEL OF UNCERTAINTY REASON FOR THE UNCERTAINTY FINANCIAL IMPACT OF THE UNCERTAINTYEconomic OutlookConsents, levies revenue continues atcurrent levelsChange in government policyChange in local government structurefor the Wellington regionEarthquake Code minimum standardsChange in sector values relativityClimate changeEmissions Trading Scheme (ETS)Upturn in economy is notprojected. Low reliance ondevelopment contributions,consents and levies as a proportionof funding mechanisms.Government policy amendmentsresult in significant resourcechange for local government.Central government impose achange in structure.A change in the minimum seismicratings influencing council’sinvestment/divestment of assets.A significant change in the value ofone sector compared to the othersectors results in a significantchange in incidence of revenuefrom rating.The risk of global sea level rise islikely to pose the most significantrisk to the wider Wellington region.The change in the carbon pricecap (currently $25 per tonne) mayresult in significant changes tocosts to council.LowHighShort term - Mod<strong>Long</strong> term - HighModModConsents, levies and rates chargesare not significant factors influencingdevelopment.The government looks to the recovery ofthe nation.Recent change to the local governmentstructure for Auckland, its influence inthe sector and its interaction with centralgovernment may necessitate a change instructure for the Wellington region.<strong>Council</strong> currently has some buildingsbudgeted to bring up to the minimumcode. An increase in the code may requiremore funding or divestment of suchassets.The District Valuation Roll is revaluedevery three years. Recently the value ofthe business sector decreased more thanthe residential sector.An upturn will lead to more activity and higher levels ofuser fees and charges and may lead to higher resourcecosts to meet those needs.Changing policy may impose costs without associatedfunding.The impact of local representation may result in a reduction inelected members for the region and change in managementand service structures. Initial structure change will costeach council, while savings may be generated in future yearsfrom a reduced governance structure.A change may affect the capital expenditure programme,its priorities or project timing, or both.Overall no effect on the revenue stream for <strong>Council</strong> butdoes impact on the incidence of rates received from/charged to each sector (business, residential, rural, utilities)of the community.High Extreme weather results. The effects of projected climate changes will impact oncouncil activities and asset planning.ModImpact from removal of the cap isunknown. Market forces will be a futuredriver.<strong>Council</strong> operates a landfill and has budgeted for an impactbased around the current price of $25 per tonne.
156 HUTT CITY LONG TERM PLAN <strong>2012</strong>-2022ASSET REVALUATIONS<strong>Council</strong> has completed full asset revaluations for its major asset categories. This waslast completed in 2009. Overall asset values have increased by approximately 8%. Thedepreciation forecasts have also been adjusted accordingly resulting in an increase.Under the Local Government Act depreciation should be fully funded by rates. Whilst theincrease in the depreciation forecast is significant, given the forecast surpluses per annumacross the 10 years this has had no immediate impact on rates, i.e. the forecast surpluseshave exceeded the increase in depreciation expense.Renewal expenditure has been forecast using rates inflated from the 2008 valuation. This isnot expected to make a material difference to the forecast level of expenditure. This will beaddressed for the final <strong>Long</strong> <strong>Term</strong> <strong>Plan</strong>.COMMITMENTS AND CONTINGENCIESThe Forecast Financial Statements provide for all the material capital and operatingcommitments known to <strong>Council</strong>. Prudent provisions have also been made in these ForecastFinancial Statements for probable future obligations of <strong>Council</strong>.COUNCIL NET DEBTThe graph on page 18 shows the forecast level of net debt in the Forecast FinancialStatements. <strong>Council</strong> plans to achieve a significant reduction in net debt.COUNCIL RATES INCOMEThe graph on page 18 shows the forecast level of rates income in the Forecast FinancialStatements. <strong>Council</strong> plans to increase rates income by no more than 0.5% above the rate ofinflation each year. Rates per capita increase in a similar manner. However, after allowing forthe additional rates contributed as a result of growth in the rating base when new or existingproperties are developed, this is expected to equate to a real reduction (excluding inflation) inrates paid by the average ratepayer of at least 0.4% per year.AUTHORISATIONThese Forecast Financial Statements were authorised for issue by <strong>Hutt</strong> <strong>City</strong> <strong>Council</strong> on28 June <strong>2012</strong>.<strong>Hutt</strong> <strong>City</strong> <strong>Council</strong> is responsible for these Forecast Financial Statements, including theappropriateness of the assumptions underlying the Forecast Financial Statements and allother disclosures.
HUTT CITY LONG TERM PLAN <strong>2012</strong>-2022157PROSPECTIVE STATEMENT OF COMPREHENSIVE INCOMEFor the year ending 30 JuneACTUAL2011$000ESTIMATE<strong>2012</strong>$000BUDGET2013$000FORECAST2014$000FORECAST2015$000FORECAST2016$000FORECAST2017$000FORECAST2018$000FORECAST2019$000FORECAST2020$000FORECAST2021$000FORECAST2022$000INCOMERates other than a targeted rate for water supply 82,649 85,384 87,596 90,390 93,274 96,250 99,417 102,688 106,170 109,770 113,601 117,453User charges 26,616 27,894 29,470 30,224 31,831 32,648 33,463 33,849 34,960 35,867 36,837 37,796Subsidies received 9,833 10,979 10,384 10,501 10,796 12,529 23,124 12,495 14,196 13,315 13,169 13,511Interest earned 338 278 285 300 292 271 248 213 186 157 136 126Vested Assets 827 430 600 613 630 643 660 678 695 714 732 750Development and financial contributions 73 279 708 725 743 761 779 799 820 842 864 886Other revenue 5,447 3,281 3,646 3,874 3,823 3,914 4,166 4,111 4,220 4,495 4,445 4,561Total revenue 125,783 128,525 132,689 136,627 141,389 147,016 161,857 154,833 161,247 165,160 169,784 175,083EXPENDITUREEmployee costs 26,360 26,601 25,978 26,510 27,036 27,934 28,666 29,350 30,112 30,929 31,727 32,554Support costs - (3) - - - - - - - - - -Operating costs 63,035 67,428 69,609 70,542 72,174 74,228 76,681 78,548 81,067 83,889 86,337 88,927Finance costs 4,640 4,298 4,000 3,880 3,715 4,269 4,663 4,599 4,375 4,040 3,727 3,806Depreciation and amortisation 29,234 30,716 31,688 30,959 32,258 34,481 35,441 36,217 36,670 36,255 37,374 38,650Total expenditure 123,269 129,040 131,275 131,891 135,183 140,912 145,451 148,714 152,224 155,113 159,165 163,937SURPLUS BEFORE TAX 2,514 (515) 1,414 4,736 6,206 6,104 16,406 6,119 9,023 10,047 10,619 11,146Tax expense - - - - - - - - - - - -SURPLUS AFTER TAX 2,514 (515) 1,414 4,736 6,206 6,104 16,406 6,119 9,023 10,047 10,619 11,146OTHER COMPREHENSIVE INCOMEGain/(loss) on revaluation of financial instruments (607) (81) - - - - - - - - - -Gains on Asset Revaluation - 99,234 - - 61,525 - - 69,679 - - 75,315 -Total Other Comprehensive Income (607) 99,153 - - 61,525 - - 69,679 - - 75,315 -TOTAL COMPREHENSIVE INCOME 1,907 98,638 1,414 4,736 67,731 6,104 16,406 75,798 9,023 10,047 85,934 11,146
158 HUTT CITY LONG TERM PLAN <strong>2012</strong>-2022PROSPECTIVE STATEMENT OF CHANGES IN EQUITYFor the year ending 30 JuneACTUAL2011$000ESTIMATE<strong>2012</strong>$000BUDGET2013$000FORECAST2014$000FORECAST2015$000FORECAST2016$000FORECAST2017$000FORECAST2018$000FORECAST2019$000FORECAST2020$000FORECAST2021$000FORECAST2022$000Equity at beginning of the year 1,147,198 1,149,105 1,247,743 1,249,157 1,253,893 1,321,624 1,327,728 1,344,134 1,419,932 1,428,955 1,439,002 1,524,936Total Comprehensive Income 1,907 98,638 1,414 4,736 67,731 6,104 16,406 75,798 9,023 10,047 85,934 11,146EQUITY AT END OF THE YEAR 1,149,105 1,247,743 1,249,157 1,253,893 1,321,624 1,327,728 1,344,134 1,419,932 1,428,955 1,439,002 1,524,936 1,536,082Represented by:Accumulated FundsOpening balance 748,152 743,039 741,603 738,779 737,636 737,597 742,885 753,503 754,528 756,474 759,165 761,582Interest allocated to reserves (401) (464) (697) (1,134) (1,381) (1,413) (1,641) (1,842) (2,121) (2,412) (2,735) (3,364)Other transfers to Reserves (8,397) (5,540) (7,614) (7,806) (7,980) (8,114) (8,339) (8,305) (8,512) (8,731) (8,955) (9,181)Transfers from Reserves 1,778 5,164 4,073 3,061 3,116 8,711 4,192 5,053 3,556 3,787 3,488 3,703Net surplus / (deficit) after tax 1,907 (596) 1,414 4,736 6,206 6,104 16,406 6,119 9,023 10,047 10,619 11,146Closing balance 743,039 741,603 738,779 737,636 737,597 742,885 753,503 754,528 756,474 759,165 761,582 763,886<strong>Council</strong> Created ReservesOpening balance 10,314 17,684 18,522 22,760 28,637 34,880 35,693 41,494 46,602 53,694 61,050 69,252Transfers to accumulated funds (1,778) (5,164) (4,071) (3,060) (3,114) (8,710) (4,176) (5,037) (3,540) (3,785) (3,486) (3,701)Transfers from accumulated funds 8,749 5,540 7,614 7,806 7,980 8,114 8,339 8,305 8,512 8,731 8,955 9,181Interest earned 399 462 695 1,131 1,377 1,409 1,638 1,840 2,120 2,410 2,734 3,363Closing balance 17,684 18,522 22,760 28,637 34,880 35,693 41,494 46,602 53,694 61,050 69,253 78,096Restricted ReservesOpening balance 76 77 79 79 81 83 86 73 59 44 44 43Transfers to accumulated funds - - (2) (1) (2) (1) (16) (16) (16) (2) (2) (2)Transfers from accumulated funds (1) - - - - - - - - - - -Interest earned 2 2 2 3 4 4 3 2 1 2 1 1Closing balance 77 79 79 81 83 86 73 59 44 44 43 42Asset Revaluation ReservesOpening balance 388,656 388,305 487,539 487,539 487,539 549,064 549,064 549,064 618,743 618,743 618,743 694,058Changes in Asset Value - - - - - - - - - - - -Valuation Gains (Losses) taken to equity (351) 99,234 - - 61,525 - - 69,679 - - 75,315 -Closing balance 388,305 487,539 487,539 487,539 549,064 549,064 549,064 618,743 618,743 618,743 694,058 694,058TOTAL EQUITY 1,149,105 1,247,743 1,249,157 1,253,893 1,321,624 1,327,728 1,344,134 1,419,932 1,428,955 1,439,002 1,524,936 1,536,082
HUTT CITY LONG TERM PLAN <strong>2012</strong>-2022159PROSPECTIVE STATEMENT OF FINANCIAL POSITIONAs at 30 JuneACTUAL2011$000ESTIMATE<strong>2012</strong>$000BUDGET2013$000FORECAST2014$000CURRENT ASSETSCash and cash equivalents 6,095 3,735 5,536 6,228 5,482 5,617 5,289 4,797 5,437 4,725 4,520 4,353Debtors and other receivables 11,713 11,713 11,413 11,380 11,338 11,610 11,901 12,198 12,515 12,841 13,187 13,530Derivative financial instruments 1,104 1,000 800 600 400 200 200 200 200 200 200 200Non-current assets held for sale - 1,500 2,560 1,992 - - - - - - - -Other assets - - - - - - - - - - - -Total current assets 18,912 17,948 20,309 20,200 17,220 17,427 17,390 17,195 18,152 17,766 17,907 18,083NON-CURRENT ASSETSProperty, plant and equipment 1,212,720 1,309,644 1,304,513 1,301,288 1,365,021 1,384,176 1,410,138 1,486,126 1,487,253 1,485,766 1,584,354 1,591,188Assets under construction 1,990 1,990 1,990 1,990 1,990 1,990 1,990 1,990 1,990 1,990 1,990 1,990Intangible assets 6,302 6,302 6,302 6,302 6,302 6,302 6,302 6,302 6,302 6,302 6,302 6,302Investment in subsidiaries 14,545 14,545 14,545 14,545 14,545 14,545 14,545 14,545 14,545 14,545 14,545 14,545Investment in associates 224 445 545 545 545 545 545 545 545 545 545 545Other financial assets 3,691 3,591 3,441 3,291 2,991 2,541 2,091 1,591 1,391 1,241 1,041 1,041Total non-current assets 1,239,472 1,336,517 1,331,336 1,327,961 1,391,394 1,410,099 1,435,611 1,511,099 1,512,026 1,510,389 1,608,777 1,615,611Total assets 1,258,384 1,354,465 1,351,645 1,348,161 1,408,614 1,427,526 1,453,001 1,528,294 1,530,178 1,528,155 1,626,684 1,633,694CURRENT LIABILITIESCash and cash equivalents - - - - - - - - - - - -Borrowings - current 37,958 27,609 28,725 19,976 12,886 13,913 22,154 20,802 12,759 19,761 21,369 16,255Derivative financial instruments 3,623 3,600 3,400 3,200 3,000 2,800 2,800 2,800 2,800 2,800 2,800 2,800Creditors and other payables 16,333 17,683 19,033 19,490 19,224 20,920 21,443 21,979 22,550 23,137 23,761 24,379Employee entitlements 2,426 2,426 2,426 2,484 2,544 2,605 2,670 2,737 2,808 2,881 2,959 3,036Other liabilities 3,242 3,242 3,242 3,320 3,399 3,481 3,568 3,657 3,752 3,850 3,954 4,057Total current liabilities 63,582 54,560 56,826 48,470 41,053 43,719 52,635 51,975 44,669 52,429 54,843 50,527NON-CURRENT LIABILITIESBorrowings - non current 40,035 46,500 40,000 40,000 40,000 50,000 50,000 50,000 50,000 30,000 40,000 40,000Provisions 4,820 4,820 4,820 4,936 5,054 5,175 5,305 5,437 5,579 5,724 5,878 6,031Employee entitlements 842 842 842 862 883 904 927 950 975 1,000 1,027 1,054Total non-current liabilities 45,697 52,162 45,662 45,798 45,937 56,079 56,232 56,387 56,554 36,724 46,905 47,085Total liabilities 109,279 106,722 102,488 94,268 86,990 99,798 108,867 108,362 101,223 89,153 101,748 97,612NET ASSETS 1,149,105 1,247,743 1,249,157 1,253,893 1,321,624 1,327,728 1,344,134 1,419,932 1,428,955 1,439,002 1,524,936 1,536,082Represented by:EQUITYAccumulated funds 743,039 741,603 738,779 737,636 737,597 742,885 753,503 754,528 756,474 759,165 761,582 763,886Restricted reserves 77 79 79 81 83 86 73 59 44 44 43 42<strong>Council</strong> created reserves 17,684 18,522 22,760 28,637 34,880 35,693 41,494 46,602 53,694 61,050 69,253 78,096Revaluation reserves 388,305 487,539 487,539 487,539 549,064 549,064 549,064 618,743 618,743 618,743 694,058 694,058TOTAL EQUITY 1,149,105 1,247,743 1,249,157 1,253,893 1,321,624 1,327,728 1,344,134 1,419,932 1,428,955 1,439,002 1,524,936 1,536,082FORECAST2015$000FORECAST2016$000FORECAST2017$000FORECAST2018$000FORECAST2019$000FORECAST2020$000FORECAST2021$000FORECAST2022$000
160 HUTT CITY LONG TERM PLAN <strong>2012</strong>-2022PROSPECTIVE STATEMENT OF CASH FLOWFor the year ending 30 JuneACTUAL2011$000ESTIMATE<strong>2012</strong>$000BUDGET2013$000FORECAST2014$000FORECAST2015$000FORECAST2016$000FORECAST2017$000FORECAST2018$000FORECAST2019$000FORECAST2020$000FORECAST2021$000FORECAST2022$000CASH FLOWS FROM OPERATING ACTIVITIESCash was provided from:Receipts from rates and levies - <strong>Council</strong> 82,466 85,384 87,596 90,390 93,274 96,250 99,417 102,688 106,170 109,770 113,601 117,453User charges and other income 41,484 42,433 44,508 45,357 47,235 49,580 61,241 50,957 53,879 54,193 54,969 56,411Interest received 338 278 285 300 292 271 248 213 186 157 136 126Dividends received - - - - - - - - - - - -1,790Receipts from rates and levies - GWRC 17,585 18,770 19,108 19,220 19,682 20,154 20,658 21,174 21,725 22,290 22,892 23,487143,663 146,865 151,497 155,267 160,483 166,255 181,564 175,032 181,960 186,410 191,598 197,477Cash was applied to:Payments to employees (26,150) (26,601) (25,978) (26,548) (27,075) (27,974) (28,708) (29,394) (30,158) (30,977) (31,778) (32,604)Payments to suppliers (68,440) (66,075) (68,259) (69,775) (72,123) (72,207) (75,811) (77,657) (80,117) (82,913) (85,299) (87,899)Interest paid (4,752) (4,298) (4,000) (3,880) (3,715) (4,269) (4,663) (4,599) (4,375) (4,040) (3,727) (3,806)Rates and levies passed to GWRC (17,540) (18,770) (19,108) (19,220) (19,682) (20,154) (20,658) (21,174) (21,725) (22,290) (22,892) (23,487)Net GST paid to Inland Revenue - - - - - - - - - - - -(116,882) (115,744) (117,345) (119,423) (122,595) (124,604) (129,840) (132,824) (136,375) (140,220) (143,696) (147,796)Net cash inflows from operating activities 26,781 31,121 34,152 35,844 37,888 41,651 51,724 42,208 45,585 46,190 47,902 49,681CASH FLOWS FROM INVESTING ACTIVITIESCash was provided from:Sale of property, plant and equipment 5,142 1,000 1,500 2,500 1,900 - - - - - - -Other investment receipts 5 100 150 150 300 450 450 500 200 150 200 -5,147 1,100 1,650 2,650 2,200 450 450 500 200 150 200 -Cash was applied to:Purchase of property, plant and equipment (18,903) (26,725) (25,345) (16,744) (20,173) (49,870) (57,450) (38,882) (34,039) (31,212) (66,061) (45,263)Less UHCC capital contribution - 363 666 696 638 1,363 553 405 762 813 9,751 4,854Purchase of assets under construction (1,233) (2,000) (2,000) (2,000) (2,000) (2,000) (2,000) (2,000) (2,000) (2,000) (2,000) (2,000)Purchase of intangible assets (1,910) (2,115) (1,835) (11,010) (12,209) (2,486) (1,846) (1,371) (1,825) (1,655) (1,605) (2,325)Other investments and payments (649) (221) (100) - - - - - - - - -(22,695) (30,698) (28,614) (29,058) (33,744) (52,993) (60,743) (41,848) (37,102) (34,054) (59,915) (44,734)Net cash outflows from investing activities (17,548) (29,598) (26,964) (26,408) (31,544) (52,543) (60,293) (41,348) (36,902) (33,904) (59,715) (44,734)
HUTT CITY LONG TERM PLAN <strong>2012</strong>-2022161ACTUAL2011$000ESTIMATE<strong>2012</strong>$000BUDGET2013$000FORECAST2014$000FORECAST2015$000FORECAST2016$000FORECAST2017$000FORECAST2018$000FORECAST2019$000FORECAST2020$000FORECAST2021$000FORECAST2022$000CASH FLOWS FROM FINANCING ACTIVITIESCash was provided from:Proceeds from borrowing 96,289 99,340 105,044 106,136 72,813 62,570 63,893 87,265 75,166 38,036 90,652 80,36396,289 99,340 105,044 106,136 72,813 62,570 63,893 87,265 75,166 38,036 90,652 80,363Cash was applied to:Repayment of borrowing (102,321) (103,223) (110,431) (114,880) (79,903) (51,543) (55,652) (88,617) (83,209) (51,034) (79,044) (85,477)(102,321) (103,223) (110,431) (114,880) (79,903) (51,543) (55,652) (88,617) (83,209) (51,034) (79,044) (85,477)Net cash inflows/(outflows) from financing activities (6,032) (3,883) (5,387) (8,744) (7,090) 11,027 8,241 (1,352) (8,043) (12,998) 11,608 (5,114)Net increase/(decrease) in cash, cash equivalents and bank overdraft 3,201 (2,360) 1,801 692 (746) 135 (328) (492) 640 (712) (205) (167)Cash, cash equivalents and bank overdraft at beginning of the year 2,894 6,095 3,735 5,536 6,228 5,482 5,617 5,289 4,797 5,437 4,725 4,520Cash, cash equivalents and bank overdraft at end of the year 6,095 3,735 5,536 6,228 5,482 5,617 5,289 4,797 5,437 4,725 4,520 4,353Cash balance at end of the year comprises:Cash and on call deposits 6,095 3,735 5,536 6,228 5,482 5,617 5,289 4,797 5,437 4,725 4,520 4,353Short term deposits - - - - - - - - - - - -Bank overdraft - - - - - - - - - - - -Cash, cash equivalents and bank overdraft at end of the year 6,095 3,735 5,536 6,228 5,482 5,617 5,289 4,797 5,437 4,725 4,520 4,353
162 HUTT CITY LONG TERM PLAN <strong>2012</strong>-2022Summary of Significant Accounting Policies Statements and other budgetary information included in the <strong>Long</strong> <strong>Term</strong> <strong>Plan</strong>.REPORTING ENTITYThe <strong>Hutt</strong> <strong>City</strong> <strong>Council</strong> (referred to as ‘<strong>Council</strong>’) is a territorial local authority governed by theLocal Government Act 2002 and is domiciled in New Zealand. <strong>Council</strong> was first formed asLower <strong>Hutt</strong> <strong>City</strong> <strong>Council</strong> on 1 November 1989 by the amalgamation of five local authorities. Thename was changed to The <strong>Hutt</strong> <strong>City</strong> <strong>Council</strong> by a special Act of Parliament on 8 October 1991.Group prospective financial statements have not been presented as they would not differsignificantly from the Financial Statements presented to <strong>Council</strong>.The primary objective of <strong>Council</strong> is to provide goods and/or services for the community orsocial benefit rather than making a financial return. Accordingly, <strong>Council</strong> has designated itselfand the group as public benefit entities for the purposes of New Zealand equivalents toInternational Financial Reporting Standards (NZ IFRS).BASIS OF PREPARATIONMeasurement baseThe financial statements have been prepared on a historical cost basis, modified by therevaluation of land and buildings, certain infrastructural assets and financial instruments(including derivative instruments).Functional and presentation currencyThe financial statements are presented in New Zealand dollars and all values are rounded tothe nearest thousand dollars ($’000). The functional currency of <strong>Council</strong> is New Zealand dollars.Foreign currency transactions are translated into the functional currency using theexchange rates prevailing at the dates of the transactions. Foreign exchange gains andlosses resulting from the settlement of such transactions are recognised in the Statementof Comprehensive Income.Changes in accounting policesIn September 2011, the External Reporting Board issued a position paper and consultationpapers proposing a new external reporting framework for public benefit entities (PBEs). Thepapers proposed that accounting standards for PBEs would be based on International PublicSector Accounting Standards, modified as necessary. The proposals in these papers do notprovide certainty about any specific requirements of future accounting standards. Therefore,the accounting policies on which the forecast information for <strong>2012</strong>-2022 has been prepared arebased on the current New Zealand equivalents to International Financial Reporting Standards.SIGNIFICANT ACCOUNTING POLICIESRevenueRevenue is measured at the fair value of consideration received or receivable.Rates revenueRates are set annually by a resolution from <strong>Council</strong> and relate to a financial year. All ratepayersare invoiced within the financial year to which the rates have been set. Rates revenue isrecognised when payable.Rates collected on behalf of the Wellington Regional <strong>Council</strong> (WRC) are not recognised in thefinancial statements as the <strong>Council</strong> is acting as an agent for the WRC.Revenue from water rates by meter is recognised on an accrual basis. Unbilled usage, as aresult of unread meters at yearend, is accrued on an average usage basis.Government grants<strong>Council</strong> receives government grants from the New Zealand Transport Agency, whichsubsidises part of the costs of maintaining the local roading infrastructure. The subsidies arerecognised as revenue upon entitlement, as conditions pertaining to eligible expenditure havebeen fulfilled.Provision of servicesRevenue from the rendering of services is recognised by reference to the stage of completionof the transaction at balance date, based on the actual service provided as a percentage of thetotal services to be provided.Vested assetsWhere a physical asset is acquired for nil or nominal consideration the fair value of the assetreceived is recognised as revenue. Assets vested in <strong>Council</strong> are recognised as revenue whencontrol over the asset is obtained.Sale of goodsSales of goods are recognised when a product is sold to the customer. The recorded revenueis the gross amount of the sale, including credit card fees payable for the transaction. Suchfees are included in other expenses.Traffic and parking infringementsTraffic and parking infringements are recognised when tickets are issued.Interest and dividendsInterest income is recognised using the effective interest method.Dividends are recognised when the right to receive payment has been established.
HUTT CITY LONG TERM PLAN <strong>2012</strong>-2022163Development contributionsThe revenue recognition point for development and financial contributions is at the later of thepoint when <strong>Council</strong> is ready to provide the service for which the contribution was levied, orthe event that will give rise to a requirement for a development or financial contribution underthe legislation.Construction contractsContract costs are recognised as expenses by reference to the stage of completion of thecontract at balance date. The stage of completion is measured by reference to the contractcosts incurred up to balance date as a percentage of total estimated costs for each contract.Contract costs include all costs directly related to specific contracts, costs that are specificallychargeable to the customer under the terms of the contract.Where the outcome of a contract cannot be reliably estimated, contract costs are recognisedas an expense as incurred.Construction work in progress is stated at the aggregate of contract costs incurred to date.Borrowing costsBorrowing costs are recognised as an expense in the period in which they are incurred.Grant expenditureNon-discretionary grants are those grants that are awarded if the grant application meetsthe specified criteria and are recognised as expenditure when an application that meets thespecified criteria for the grant has been received.Discretionary grants are those grants where <strong>Council</strong> has no obligation to award on receipt ofthe grant application and are recognised as expenditure when a successful applicant has beennotified of <strong>Council</strong>’s decision.Foreign currency transactionsForeign currency transactions are translated into the functional currency using theexchange rates prevailing at the dates of the transactions. Foreign exchange gains andlosses resulting from the settlement of such transactions are recognised in the Statementof Comprehensive Income.Income taxIncome tax expense comprises both current tax and deferred tax, and is calculated using taxrates that have been enacted or substantively enacted by balance date.Current tax is the amount of income tax payable based on the taxable surplus for the currentyear, plus any adjustments to income tax payable in respect of prior years.Deferred tax is the amount of income tax payable or recoverable in future periods in respect oftemporary differences and unused tax losses. Temporary differences are differences betweenthe carrying amount of assets and liabilities in the financial statements and the correspondingtax bases used in the computation of taxable surplus.The measurement of deferred tax reflects the tax consequences that would follow from themanner in which the entity expects to recover or settle the carrying amount of its assetsand liabilities.Deferred tax liabilities are generally recognised for all taxable temporary differences. Deferredtax assets are recognised to the extent that it is probable that taxable surplus will be availableagainst which the deductible temporary differences or tax losses can be utilised.Deferred tax is not recognised if the temporary difference arises from the initial recognitionof goodwill or from the initial recognition of an asset and liability in a transaction that is not abusiness combination, and at the time of the transaction, affects neither accounting surplusnor taxable surplus.Deferred tax is recognised on taxable temporary differences arising on investments insubsidiaries and associates, and interests in joint ventures, except where the companycan control the reversal of the temporary difference and it is probable that the temporarydifference will not reverse in the foreseeable future.Current tax and deferred tax is charged or credited to the Statement of ComprehensiveIncome, except when it relates to items charged or credited directly to equity, in which casethe tax is dealt with in equity.LeasesFinance leasesA finance lease is a lease that transfers to the lessee substantially all the risks and rewardsincidental to ownership of an asset, whether or not title is eventually transferred.At the commencement of the lease term, the <strong>Council</strong> recognises finance leases as assets andliabilities in the Statement of Financial Position at the lower of the fair value of the leased itemor the present value of the minimum lease payments.The finance charge is charged to the Statement of Comprehensive Income over the lease periodso as to produce a constant periodic rate of interest on the remaining balance of the liability.The amount recognised as an asset is depreciated over its useful life. If there is no certaintyas to whether <strong>Council</strong> will obtain ownership at the end of the lease term, the asset is fullydepreciated over the shorter of the lease term and its useful life.
164 HUTT CITY LONG TERM PLAN <strong>2012</strong>-2022Operating leasesAn operating lease is a lease that does not transfer substantially all the risks and rewardsincidental to ownership of an asset. Lease payments under an operating lease are recognisedas an expense on a straight-line basis over the lease term.Cash and cash equivalentsCash and cash equivalents includes cash in hand, deposits held at call with banks, othershort-term highly liquid investments with original maturities of three months or less, andbank overdrafts.Bank overdrafts are shown in current liabilities in the Statement of Financial Position.Debtors and other receivablesDebtors and other receivables are initially measured at fair value and subsequently measuredat amortised cost using the effective interest method, less any provision for impairment.Derivative financial instruments<strong>Council</strong> uses derivative financial instruments to manage exposure to foreign exchange andinterest rate risks arising from financing activities. In accordance with its treasury policy,<strong>Council</strong> does not hold or issue derivative financial instruments for trading purposes.Derivatives are initially recognised at fair value on the date a derivative contract is enteredinto and are subsequently measured at their fair value at each balance date. The method ofrecognising the resulting gain or loss depends on whether the derivative is designated as ahedging instrument, and, if so, the nature of the item being hedged.The associated gains or losses of derivatives that are not hedge accounted are recognised inthe surplus or deficit.The <strong>Council</strong> designates certain derivatives as either:• hedges of the fair value of recognised asset or liabilities or a firm commitment (fair valuehedge); or• hedges of highly probable forecast transactions (cash flow hedge).The <strong>Council</strong> does not designate its derivative financial instruments as hedging instruments foraccounting purposes. Accordingly, derivative financial instruments are reported as fair valuethrough surplus or deficit.Financial assetsFinancial assets and liabilities are initially measured at fair value plus transaction costs unlessthey are carried at fair value through surplus or deficit in which case the transaction costs arerecognised in the Statement of Comprehensive Income.Purchases and sales of investments are recognised on trade-date, the date on which <strong>Council</strong>commits to purchase or sell the asset. Financial assets are derecognised when the rights toreceive cash flows from the financial assets have expired or have been transferred and the<strong>Council</strong> has transferred substantially all the risks and rewards of ownership.<strong>Council</strong> classifies its financial assets into the following categories:• fair value through surplus or deficit;• loans and receivables;• held-to-maturity investments and• fair value through other comprehensive income.The classification depends on the purpose for which the investments were acquired.Financial assets at fair value through surplus or deficitFinancial assets at fair value through surplus or deficit include financial assets held for trading.A financial asset is classified in this category if acquired principally for the purpose of selling inthe short term. Derivatives (e.g. interest rate swaps and options) are also categorised as heldfor trading unless they are designated as hedges (see above).Financial assets acquired principally for the purpose of selling in the short-term or part of aportfolio classified as held for trading are classified as a current asset. The current/non-currentclassification of derivatives is explained in the derivatives accounting policy above.After initial recognition assets in this class are measured at their fair values with gains orlosses recognised in the surplus or deficit.Loans and receivablesLoans and receivables are non-derivative financial assets with fixed or determinable paymentsthat are not quoted in an active market. They are included in current assets, except formaturities greater than 12 months after balance date, which are included in non-currentassets. The <strong>Council</strong> loans and receivables comprise cash and cash equivalents, trade and otherreceivables, term deposits, community and related party loans.After initial recognition they are measured at amortised cost using the effective interestmethod less impairment. Gains and losses when the asset is impaired or derecognised arerecognised in the surplus or deficit.Loans, including loans to community organisations made by <strong>Council</strong> at nil, or below-marketinterest rates are initially recognised at the present value of their expected future cash flows,discounted at the current market rate of return for a similar financial instrument. The loans aresubsequently measured at amortised cost using the effective interest method. The differencebetween the face value and present value of expected future cash flows of the loan isrecognised in the surplus or deficit as a grant.
HUTT CITY LONG TERM PLAN <strong>2012</strong>-2022165Held to maturity investmentsHeld to maturity investments are non-derivative financial assets with fixed or determinablepayments and fixed maturities that <strong>Council</strong> has the positive intention and ability to hold tomaturity. They are included in current assets, except for maturities greater than 12 monthsafter balance date, which are included in non-current assets.After initial recognition they are measured at amortised cost using the effective interestmethod less impairment. Gains and losses when the asset is impaired or derecognised arerecognised in the surplus or deficit.Financial assets at fair value through other comprehensive incomeFinancial assets at fair value through other comprehensive income are those that aredesignated into the category at initial recognition or are not classified in any of the othercategories above. They are included in non-current assets unless management intends todispose of the investment within 12 months of the balance date or if the debt instrument isnot expected to be realised within 12 months of balance date.The <strong>Council</strong> and group includes in this category:• investments that it intends to hold long-term but which may be realised before maturity;and• shareholdings that <strong>Council</strong> holds for strategic purposes.<strong>Council</strong>’s investments in its subsidiary and associate companies are not included in thiscategory as they are held at cost (as allowed by NZ IAS 27 Consolidated and Separate FinancialStatements and NZ IAS 28 Investments in Associates), whereas this category is to bemeasured at fair value.After initial recognition these investments are measured at their fair value, with gains andlosses recognised in other comprehensive income, except for impairment losses, which arerecognised in the surplus or deficit.On derecognition the cumulative gain or loss previously recognised in equity is reclassified andrecognised in the surplus or deficit.Impairment of financial assetsAt each balance date <strong>Council</strong> assesses whether there is any objective evidence that a financialasset or group of financial assets is impaired. Any impairment losses are recognised in theStatement of Comprehensive Income.Loans, receivables and term depositsImpairment of a loan, receivable or term deposit is established when there is objectiveevidence that <strong>Council</strong> will not be able to collect all amounts due according to the originalterms. Significant financial difficulties of the debtor/issuer, probability that the debtor/issuerwill enter into bankruptcy, and default payments are considered indicators that the assetis impaired. The amount of the impairment is the difference between the asset’s carryingamount and the present value of estimated future cash flows, discounted using the originaleffective interest rate. For trade and other receivables, the carrying amount of the asset isreduced through the use of a provision account, and the amount of the loss is recognised inthe Statement of Comprehensive Income. When the receivable is uncollectable, it is writtenoff against the provision account. Overdue receivables that have been renegotiated arereclassified as current (i.e. not past due). For term deposits impairment losses are recogniseddirectly against the instruments carrying amount.Quoted and unquoted equity investmentsFor each equity investment classified as fair value through equity, a significant or prolongeddecline in the fair value of the investment below its cost is considered an indicator ofimpairment. If such evidence exists for investments at fair value through equity, thecumulative loss (measured as the difference between the acquisition costs and the currentfair value, less any impairment loss on that financial asset previously recognised in theStatement of Comprehensive Income) is removed from equity and recognised in theStatement of Comprehensive Income. Impairment losses recognised in the Statement ofComprehensive Income on equity investments are not reversed through the Statement ofComprehensive Income.InventoryInventory (such as spare parts and other items) held for distribution or consumption in theprovision of services that are not supplied on a commercial basis is measured at the lower ofcost, adjusted when applicable, for any loss of service potential. Where inventory is acquiredat no cost or for nominal consideration, the cost is the current replacement cost at the dateof acquisition.Inventory held for use in the production of goods and services on a commercial basis isvalued at the lower of cost and net realisable value. The cost of purchased inventory isdetermined using the FIFO method. The amount of any write-down for the loss of servicepotential or from cost to net realisable value is recognised in the surplus or deficit in theperiod of the write-down.Non-current assets held for saleNon-current assets held for sale are classified as held for sale if their carrying amount willbe recovered principally through a sale transaction, not through continuing use. Non-currentassets held for sale are measured at the lower of their carrying amount and fair value lesscosts to sell.Any impairment losses for write-downs of non-current assets held for sale are recognised inthe Statement of Comprehensive Income. Any increases in fair value (less costs to sell) arerecognised up to the level of any impairment losses that have been previously recognised.Non-current assets (including those that are part of a disposal group) are not depreciated oramortised while they are classified as held for sale.
166 HUTT CITY LONG TERM PLAN <strong>2012</strong>-2022Property, plant and equipmentProperty, plant and equipment are shown at cost or valuation, less accumulated depreciationand impairment losses.Property, plant and equipment consist of:Infrastructure assetsThe fixed utility systems owned by <strong>Council</strong> and include resource consents. Each asset typeincludes all items that are required for the network to function. For example, seweragereticulation includes reticulation piping and sewer pump stations.Operational assetsThese include land, buildings, landfill post closure, improvements, library books, plant andequipment and collection items.Restricted assetsParks and reserves owned by <strong>Council</strong> which provide a benefit or service to the community andcannot be disposed of because of legal or other restrictions.AdditionsThe cost of an item of property, plant and equipment is recognised as an asset if, and only if,it is probable that future economic benefits or service potential associated with the item willflow to <strong>Council</strong> and the cost of the item can be measured reliably. In most instances, an itemof property, plant and equipment is recognised at its cost. Where an asset is acquired at nocost, or for a nominal cost, it is recognised at fair value as at the date of acquisition.Assets under construction are included at cost. The total cost of a project is transferredto the relevant capital class on its completion and then depreciated. Borrowing costs arenot capitalised.Costs incurred in obtaining any resource consents are capitalised as part of the asset to whichthey relate. If a resource consent application is declined then all capitalised costs are writtenoff.Costs incurred subsequent to initial acquisition are capitalised only when it is probable thatfuture economic benefits or service potential associated with the item will flow to <strong>Council</strong> andthe cost of the item can be measured reliably.<strong>Council</strong> costs that do not meet the criteria for capitalisation, or are below the thresholdsof $1,000 for information technology hardware and $2,500 for other items, are charged tooperating expenditure.DisposalGains and losses on disposals are determined by comparing the proceeds with the carryingamount of the asset. Gains and losses on disposals are reported net in the Statement ofComprehensive Income. When revalued assets are sold, the amounts included in assetrevaluation reserves in respect of those assets are transferred to accumulated funds.DepreciationDepreciation is provided on a straight-line basis on all property, plant and equipment at ratesthat will write off the cost (or valuation) of the assets to their estimated residual values overtheir useful lives, except that art, museum collections and land are not depreciated.Estimated economic livesThe expected useful economic lives have been estimated as follows:YEARS PERCENTAGESOperational assetsBuildings:- Structure 30 - 100 1 – 3.33- Roof 40 - 55 1.82 - 2.5- Services 35 - 55 1.82 - 2.86- Internal fit-out 15 - 45 2.22 – 6.67- <strong>Plan</strong>t 30 - 35 2.86 – 3.33Landfill building assets 50 - 100 1 - 2Library stock 2 - 14 7.14 - 50<strong>Plan</strong>t and equipment:- Office furniture 5 - 20 5 - 20- <strong>Plan</strong>t 3 - 25 4 – 33.33- Computer equipment 3 – 5 20 – 33.33- Playground equipment 5 – 30 3.33 - 20- Recycling depots 10 10Wharves 15 - 40 2.5 – 6.67Landfill plant 20 - 35 2.86 - 5Breakwaters 100 1Parking meters 10 - 25 4 - 10Other collection items 10 10Infrastructure assetsStorm, supply and waste water utility assets:- Pumping stations 12 - 80 1.25 – 8.33
HUTT CITY LONG TERM PLAN <strong>2012</strong>-2022167YEARSPERCENTAGES- Pencarrow outfall tunnels 500 0.2- Pencarrow outfall other assets 25 - 62 1.61 - 4- Resource consents Life of the consent- Silverstream river crossing structure 60 1.67- Storage tanks 15 - 50 2 – 6.67- Treatment plant 5 – 100 1 - 20Landfill storm water 100 1Landfill roading 20 - 100 1 - 5Roading network:- Berms 20 5- Bridges 80 - 100 1 – 1.25- Bus shelters 30 – 50 2 – 3.33- Car parking 8 - 80 1.25 – 12.5- Culvert and subways 100 1- Debris fences 25 4- Footpath walkway 15 – 50 2 – 6.67- Kerbs and channel 15 - 80 1.25 – 6.67- Pedestrian crossings 40 - 50 2 – 2.5- Retaining walls 15 – 100 1 – 6.67- Roading carriageway 7 - 120 0.83 – 14.29- Seawalls 60 – 90 1.11 – 1.67- Speed humps 12 - 50 2 – 8.33- Street light support 50 2- Street lights 25 4- Sumps and leads 80 1.25- Traffic barriers 10 – 30 3.33 - 10- Traffic islands 60 1.67- Traffic signals and signs 5 - 30 3.33 - 20- Vehicle crossings 80 1.25The residual value and useful life of an asset is reviewed, and adjusted if applicable, at eachfinancial year end.RevaluationThe <strong>Council</strong> assesses the carrying values of its revalued assets annually to ensure that theydo not differ materially from the assets’ fair values. If there is a material difference, then theoff-cycle asset class is revalued.Land, buildings (operational and restricted), library books, and infrastructural assets (exceptland under roads) are revalued with sufficient regularity to ensure that their carrying amountdoes not differ materially from fair value and at least every five years, on the basis describedbelow. All other asset classes are carried at depreciated historical cost.• Land and buildings have been valued at either optimised depreciated replacement cost orfair value.• Infrastructure assets have been valued at optimised depreciated replacement cost. Theexceptions are:− wharves, which are valued at indemnity value, reflecting their minimum residual value− traffic signs, which are stated at cost− land under roads, which is valued at 45% of the average market value of adjacent landwithin the sales group of similar zoning.• Landfill assets are valued at depreciated replacement cost.• Library literary assets are valued at depreciated replacement cost in accordance with draftguidelines released by the New Zealand Library Association and the National Library ofNew Zealand.• Collections items are classified into relevant asset classes and are revalued on a cyclical basis.All revaluations are carried out by independent valuers who specialise in the asset classeslisted above. The exception is library literary assets, which are valued by staff with specialistknowledge in this area.The results of revaluing are credited or debited to an asset revaluation reserve for thatclass of asset. Where this results in a debit balance in the asset revaluation reserve, thisbalance is expensed in the Statement of Comprehensive Income. Any subsequent increaseon revaluation that off-sets a previous decrease in value recognised in the Statement ofComprehensive Income will be recognised first in the Statement of Comprehensive Income upto the amount previously expensed, and then credited to the revaluation reserve for that classof asset.Upper <strong>Hutt</strong> <strong>City</strong> <strong>Council</strong>’s interest in the bulk wastewater systemThe <strong>Hutt</strong> Valley and Wainuiomata bulk wastewater system is managed by <strong>Council</strong>. Upper <strong>Hutt</strong><strong>City</strong> <strong>Council</strong> pays an annual levy to the <strong>Hutt</strong> <strong>City</strong> <strong>Council</strong> based on an apportionment formulaequating to between 25% and 32% of the funding requirements. While Upper <strong>Hutt</strong> <strong>City</strong><strong>Council</strong> does not have legal ownership of the bulk wastewater system, it is entitled to a shareof the proceeds from any sale of the assets.Upper <strong>Hutt</strong> <strong>City</strong> <strong>Council</strong>’s interest in the bulk wastewater system assets is deducted fromthe value of property plant and equipment recognised in the Statement of Financial Position.Funding contributions from Upper <strong>Hutt</strong> <strong>City</strong> <strong>Council</strong> are recognised as revenue in theStatement of Comprehensive Income if the contributions are for the operation of the bulkwastewater system. Funding contributions for capital work are recognised as an increase inUpper <strong>Hutt</strong> <strong>City</strong> <strong>Council</strong>’s interest in the bulk wastewater system assets.
168 HUTT CITY LONG TERM PLAN <strong>2012</strong>-2022Intangible assetsSoftware acquisition and developmentAcquired computer software licenses are capitalised on the basis of the costs incurred to acquireand bring to use the specific software. Costs that are directly associated with the developmentof software for internal use by <strong>Council</strong>, are recognised as an intangible asset.Staff training costs are recognised as an expense when incurred.Costs associated with maintaining computer software are recognised as an expensewhen incurred.EasementsEasements are recognised at cost, being the costs directly attributable to bringing the assetto its intended use. Easements have an indefinite useful life and are not amortised, but areinstead tested for impairment annually.AmortisationThe carrying value of an intangible asset with a finite life is amortised on a straight-line basisover its useful life. Amortisation begins when the asset is available for use and ceases at thedate that the asset is derecognised. The amortisation charge for each period is recognised inthe Statement of Comprehensive Income.The useful lives and associated amortisation rates of major classes of intangible assets havebeen estimated as follows:Computer software 3 - 5 years 33.33% – 20%Impairment of property, plant and equipment and intangible assetsAssets that have an indefinite useful life, or not yet available for use, are not subject toamortisation and are tested annually for impairment. Assets that have a finite useful life arereviewed for indicators of impairment at each balance date. When there is an indicator ofimpairment the asset’s recoverable amount is estimated. An impairment loss is recognisedfor the amount by which the asset’s carrying amount exceeds its recoverable amount. Therecoverable amount is the higher of an asset’s fair value less costs to sell and value in use.Value in use is depreciated replacement cost for an asset where the future economic benefitsor service potential of the asset are not primarily dependent on the assets ability to generatenet cash inflows and where the entity would, if deprived of the asset, replace its remainingfuture economic benefits or service potential.The value in use for cash-generating assets and cash generating units is the present value ofexpected future cash flows.If an asset’s carrying amount exceeds its recoverable amount the asset is impaired andthe carrying amount is written down to the recoverable amount. For revalued assets theimpairment loss is recognised against the revaluation reserve for that class of asset. Wherethat results in a debit balance in the revaluation reserve, the balance is recognised in thesurplus or deficit. For assets not carried at a revalued amount, the total impairment loss isrecognised in the surplus or deficit.The reversal of an impairment loss on a revalued asset is credited to the revaluation reserve.However, to the extent that an impairment loss for that class of asset was previouslyrecognised in Statement of Comprehensive Income, a reversal of the impairment loss is alsorecognised in the Statement of Comprehensive Income.For assets not carried at a revalued amount (other than goodwill) the reversal of an impairmentloss is recognised in the Statement of Comprehensive Income.Creditors and other payablesCreditors and other payables are initially measured at fair value and subsequently measured atamortised cost using the effective interest method.BorrowingsBorrowings are initially recognised at their fair value net of transaction costs incurred. After initialrecognition, all borrowings are measured at amortised cost using the effective interest method.Borrowings are classified as current liabilities unless <strong>Council</strong> have an unconditional right todefer settlement of the liability for at least 12 months after the balance date.Employee entitlementsShort-term benefitsEmployee benefits that <strong>Council</strong> expect to be settled within 12 months of balance date aremeasured at nominal values based on accrued entitlements at current rates of pay. Theseinclude salaries and wages accrued up to balance date, annual leave earned to, but not yettaken at balance date, retiring and long service leave entitlements expected to be settledwithin 12 months, and sick leave.<strong>Council</strong> recognise a liability for sick leave to the extent that absences in the coming year areexpected to be greater than the sick leave entitlements earned in the coming year. The amount iscalculated based on the unused sick leave entitlement that can be carried forward at balance date,to the extent that <strong>Council</strong> anticipates it will be used by staff to cover those future absences.<strong>Council</strong> recognise a liability and an expense for bonuses where contractually obliged or wherethere is a past practice that has created a constructive obligation.
HUTT CITY LONG TERM PLAN <strong>2012</strong>-2022169<strong>Long</strong>-term benefitsEntitlements that are payable beyond 12 months, such as long service leave and retiring leave,have been calculated on an actuarial basis. The calculations are based on:• likely future entitlements accruing to staff, based on years of service, years to entitlement,the likelihood that staff will reach the point of entitlement and contractual entitlementsinformation; and• the present value of the estimated future cash flows.The discount rate used is the current New Zealand Government long-term bond rate asat 30 June each year, and the inflation rate used is the annual Consumer Price Index. Thediscount rate is based on <strong>Council</strong>’s long-term cost of funds. The inflation factor is based on theexpected long-term increase in remuneration for employees.Superannuation schemesDefined contribution schemesObligations for contributions to defined contribution superannuation schemes are recognisedas an expense in the Statement of Comprehensive Income as incurred.Defined benefit schemes<strong>Council</strong> belongs to the Defined Benefit <strong>Plan</strong> Contributors Scheme (the scheme), which ismanaged by the Board of Trustees of the National Provident Fund. The scheme is a multiemployerdefined benefit scheme.Insufficient information is available to use defined benefit accounting, as it is not possible todetermine from the terms of the scheme, the extent to which the surplus/deficit will affectfuture contributions by individual employers, as there is no prescribed basis for allocation. Thescheme is therefore accounted for as a defined contribution scheme.Provisions<strong>Council</strong> recognises a provision for future expenditure of uncertain amount or timing whenthere is a present obligation (either legal or constructive) as a result of a past event, it isprobable that expenditures will be required to settle the obligation and a reliable estimate canbe made of the amount of the obligation.Provisions are measured at the present value of the expenditures expected to be required tosettle the obligation using a pre-tax discount rate that reflects current market assessmentsof the time value of money and the risks specific to the obligation. The increase in theprovision due to the passage of time is recognised as an interest expense and is included in“finance costs”.Financial guarantee contractsA financial guarantee contract is a contract that requires <strong>Council</strong> to make specified paymentsto reimburse the holder for a loss it incurs because a specified debtor fails to make paymentwhen due.Financial guarantee contracts are initially recognised at fair value. If a financial guaranteecontract was issued in a stand-alone arms length transaction to an unrelated party, its fairvalue at inception is equal to the consideration received. When no consideration is received aprovision is recognised based on the probability <strong>Council</strong> will be required to reimburse a holderfor a loss incurred, discounted to present value. The portion of the guarantee that remainsunrecognised, prior to discounting to fair value, is disclosed as a contingent liability.Financial guarantees are subsequently measured at the initial recognition amount less anyamortisation, however if <strong>Council</strong> assesses that it is probable that expenditure will be requiredto settle a guarantee, then the provision for the guarantee is measured at the present value ofthe future expenditure.Landfill post closure costsAs operator of the Silverstream and Wainuiomata landfill sites, <strong>Council</strong> has an obligation toensure the ongoing maintenance and monitoring services at these landfill sites after closure.<strong>Council</strong> also has an obligation to monitor closed landfill sites previously operated by localauthorities subsequently amalgamated to form the <strong>Hutt</strong> <strong>City</strong> <strong>Council</strong>.A site restoration and aftercare provision has been recognised as a liability in the Statementof Financial Position. Provision is made for the present value of closure and post closure costswhen the obligation for post closure arises. The calculated cost is based on estimates ofclosure costs and future site trade waste charges and monitoring costs. The estimated lengthof time needed for post closure care for Silverstream is 30 years and Wainuiomata is 28 years.The calculations assume no change in the legislative requirements or technological changesfor closure and post closure treatment. The discount rate used is a pre tax rate that reflectscurrent market assessments of the time value of money and the risks specific to <strong>Council</strong>.Amounts provided for closure and post closure costs are capitalised to the landfill asset wherethey give rise to future economic benefits, or if they are incurred to enable future economicbenefits to be obtained. The capitalised landfill asset is depreciated over the life of the landfillbased on the capacity used.
170 HUTT CITY LONG TERM PLAN <strong>2012</strong>-2022EquityEquity is the community’s interest in <strong>Council</strong>, measured by total assets less total liabilities.Equity is classified into a number of reserves to enable clearer identification of the specifieduses that <strong>Council</strong> makes of their accumulated surpluses. The components of equity are:• Accumulated funds;• <strong>Council</strong> created reserves;• Restricted reserves;• Asset revaluation reserves.Reserves represent a particular use to which various parts of equity have been assigned.Reserves may be legally restricted or created by <strong>Council</strong>.<strong>Council</strong> created reserves are established by <strong>Council</strong>. They may be altered without reference toany third party or the courts. Transfers to and from these reserves are at the discretion of <strong>Council</strong>.Restricted reserves are subject to specific conditions accepted as binding by <strong>Council</strong>, whichmay not be revised by <strong>Council</strong> without reference to the courts or third party. Transfers fromthese reserves may be made only for specified purposes or when certain conditions are met.Goods and services tax (GST)All items in the financial statements are stated exclusive of GST, except for receivables andpayables, which are stated on a GST inclusive basis. Where GST is not recoverable as input taxthen it is recognised as part of the related asset or expense.The net amount of GST recoverable from, or payable to, the Inland Revenue Department (IRD)is included as part of receivables or payables in the Statement of Financial Position.The net GST paid to, or received from the IRD, including the GST relating to investing andfinancing activities, is classified as an operating cash flow in the Statement of Cash Flows.Commitments and contingencies are disclosed exclusive of GST.Operating statements included in the Statement of Service PerformanceThe operating statements report the net cost of services for significant activities of <strong>Council</strong>.<strong>Council</strong> has derived the net cost of services for each significant activity using the costallocation system outlined below.• Direct costs are charged directly to significant activities. Indirect costs are charged to thesignificant activities based on cost drivers and related activity or usage information.• Each significant activity has been charged an internal interest cost. The net interest costincurred by <strong>Council</strong> is allocated to each significant activity based on the net book value ofproperty, plant and equipment used by the activity.
HUTT CITY LONG TERM PLAN <strong>2012</strong>-2022171Notes to the Financial StatementsDepreciation and amortisation expense by Group of ActivitiesACTUAL2011$000ESTIMATE<strong>2012</strong>$000BUDGET2013$000FORECAST2014$000Libraries 726 810 1,550 1,459 1,444 1,434 1,409 1,396 1,396 1,378 1,375 1,380Museums 251 277 556 546 545 547 542 543 545 540 542 543Aquatics and Recreation 810 910 1,498 1,545 1,655 1,704 1,736 1,900 2,039 2,006 2,201 2,391Parks and Reserves 896 966 1,555 1,550 1,570 1,621 1,658 1,684 1,711 1,713 1,729 1,752Community Development 42 42 121 118 117 118 118 118 119 121 123 126Group People 2,725 3,005 5,280 5,218 5,331 5,424 5,463 5,641 5,810 5,758 5,970 6,192Roading & Traffic 9,727 10,195 9,771 9,646 10,103 10,605 10,946 11,809 12,387 12,407 12,996 13,569Water Supply 3,028 3,065 3,258 3,196 3,169 3,182 3,227 3,251 3,274 3,311 3,351 3,392Wastewater 6,486 6,531 6,662 6,554 6,513 6,510 6,516 6,488 6,469 6,472 6,881 7,444Stormwater 2,622 2,700 2,943 2,911 2,999 3,098 3,108 3,239 3,365 3,362 3,478 3,579Solid Waste 384 455 465 464 476 490 498 518 538 549 568 586Environmental Management - 1 - - - - - - - - - -Emergency Management 24 40 31 31 31 31 32 32 33 33 33 34Group Environment 24 41 31 31 31 31 32 32 33 33 33 34Local Urban Environment 199 290 302 295 293 294 297 304 303 299 299 292Economic Development 10 10 25 23 22 20 19 17 16 15 14 13Group Economy 209 300 327 318 315 314 316 321 319 314 313 305Elected Members 4 - 4 3 2 1 1 - - - - -Advice and Support - - - - - - - - - - - -Managing Services 2,151 2,413 2,947 2,618 3,319 4,826 5,334 4,918 4,475 4,049 3,784 3,549Group Organisation 2,155 2,413 2,951 2,621 3,321 4,827 5,335 4,918 4,475 4,049 3,784 3,549Total * 29,234 30,716 31,688 30,959 32,258 34,481 35,441 36,217 36,670 36,255 37,374 38,650FORECAST2015$000FORECAST2016$000FORECAST2017$000FORECAST2018$000FORECAST2019$000FORECAST2020$000FORECAST2021$000FORECAST2022$000* 2011 total includes Property activity depreciation $1,874<strong>2012</strong> total includes Property activity depreciation $2,011
172 HUTT CITY LONG TERM PLAN <strong>2012</strong>-2022Reconciliation of Financial Statements to Funding Impact StatementBUDGET2013$000FORECAST2014$000FORECAST2015$000FORECAST2016$000FORECAST2017$000FORECAST2018$000FORECAST2019$000FORECAST2020$000FORECAST2021$000FORECAST2022$000Total revenue from Prospective Statement of Comprehensive Income 132,689 136,627 141,389 147,016 161,857 154,833 161,247 165,160 169,784 175,083Less vested assets (600) (613) (630) (643) (660) (678) (695) (714) (732) (750)Less capital contributions (4,110) (4,216) (4,362) (5,779) (16,207) (5,407) (6,928) (5,861) (5,516) (5,663)Add internal rates revenue 3,210 3,312 3,418 3,527 3,643 3,763 3,891 4,023 4,163 4,304Less JSP special rate (110) (110) (110) (110) (110) (110) (110) (110) (110) (110)Funding Impact Statement Total Operating Funding (A) 131,079 135,000 139,705 144,011 148,523 152,401 157,405 162,498 167,589 172,864Total expenditure from Prospective Statement of Comprehensive Income 131,275 131,891 135,183 140,912 145,451 148,714 152,224 155,113 159,165 163,937Less depreciation (31,688) (30,959) (32,258) (34,481) (35,441) (36,217) (36,670) (36,255) (37,374) (38,650)Add internal rates 3,210 3,312 3,418 3,527 3,643 3,763 3,891 4,023 4,163 4,304Funding Impact Statement Total Applications of Operating Funding (B) 102,797 104,244 106,343 109,958 113,653 116,260 119,445 122,881 125,954 129,591Net Surplus Per Prospective Statement of Comprehensive Income 1,414 4,736 6,206 6,104 16,406 6,119 9,023 10,047 10,619 11,146Add depreciation expense 31,688 30,959 32,258 34,481 35,441 36,217 36,670 36,255 37,374 38,650Less capital contributions (4,110) (4,216) (4,362) (5,779) (16,207) (5,407) (6,928) (5,861) (5,516) (5,663)Less vested assets (600) (613) (630) (643) (660) (678) (695) (714) (732) (750)Less JSP special rate (110) (110) (110) (110) (110) (110) (110) (110) (110) (110)Funding Impact Statement Surplus (Deficit) of Operating Funding (A-B) 28,282 30,756 33,362 34,053 34,870 36,141 37,960 39,617 41,635 43,273Reserve FundsReserves are held to ensure that funds received for a particular purpose are used for thatpurpose and any surplus created is managed in accordance with the reason for which thereserve was established. Surplus held in reserves are credited with interest. The <strong>Council</strong>holds 13 reserves, with 5 being restricted reserves. Restricted reserves are reserves thathave rules set by legal obligation that restrict the use that the <strong>Council</strong> may put the fundstowards. The remaining <strong>Council</strong> created reserves are discretionary reserves which the <strong>Council</strong>has established for the fair and transparent use of monies. Reserves are not separately held incash and the funds are managed as part of the <strong>Council</strong>’s treasury management.The next page contains a list of current reserves outlining the purpose for holding eachreserve and the <strong>Council</strong> activity to which each reserve relates, together with summaryfinancial information across the ten years of the 10 year plan:
HUTT CITY LONG TERM PLAN <strong>2012</strong>-2022173COUNCIL CREATED RESERVES – PURPOSE OF THE FUNDReserve Purchase & Development (Parks and Reserves Activity)To provide for the purchase of land for reserves purposes or the development of existing reserves. The Fund is made up of financial contributions fromsubdivision and revenue from the sale of surplus reserve land. The main purpose of the Fund is to provide open space and recreational opportunity to offsetthe effects of land use intensification.OPENINGBALANCEJULY <strong>2012</strong>$000DEPOSITS$000EXPENDITURE$000CLOSINGBALANCEJUNE 2022$0007,550 6,577 (9,986) 4,141Election Fund (Managing Services Activity)To annual provide for the cost of <strong>Council</strong> elections and by-elections. 78 498 (433) 143Landfills Reserve (Solid Waste Activity)To set funds aside for the longer term replacement of the landfill. 8,461 77,630 (14,388) 71,703Waste Minimisation ReserveTo encourage a reduction in the amount of waste generated and disposed of in New Zealand, and to lessen the environmental harm of waste. This reservewas created in 2009 as a result of the Waste Minimisation Act 2008. Funding is distributed to local authorities by the Ministry for the Environment andexpenditure includes grants to others, waste minimisation initiative operating expenses and recycling contract.1,934 17,391 (17,614) 1,711Wingate Landfill Reserve (Parks and Reserves Activity)To provide for the development and major maintenance of the former landfill areas (top areas) at the end of Page Grove, Wingate, now managed as reserveland and used for various recreational activities.148 70 (28) 190Piano Replacement Reserve (Museums Activity)To provide funds for the replacement of the Steinway piano at the Little Theatre. 72 1 (73) -Wingate Park (Parks and Reserves Activity)To provide for the development and major maintenance of the former landfill areas (bottom areas) at the end of Page Grove, Wingate, now managed asreserve land and used for various recreational activities.152 73 (25) 200Ex Hillary Commission Funds (Aquatics and Recreation)To provide funding for sporting activities, approval needs to be given by Sport New Zealand. 127 14 (133) 8Total 18,522 102,254 (42,680) 78,096RESTRICTED RESERVES – PURPOSE OF THE FUNDTaita Cemetery - JV Bently (Parks and Reserves Activity)A contract between <strong>Council</strong> and Mrs JV Bently on the maintenance in perpetuity of these plots: Plot 32/33 block 7, St James section. Containing Issac Young,Eliza Young and AG Talbut.2 1 (1) 2Lavelle Tree Bequest (Parks and Reserves Activity)To provide for the planting of trees in and around <strong>Hutt</strong> <strong>City</strong> on major thoroughfares. 34 9 (29) 14JWT Adams Bequest (Museums Activity)To be utilised to establish and service a photographic collection for the Dowse.There is no specific expenditure plan for the coming ten years on the purchase of photographic items for the collection.18 5 (12) 11ML Talbut Bequest (Parks and Reserves Activity)To provide for the planting and maintenance of reserves. 12 4 (7) 9Eastbourne Arts Trust (Museums Activity)To purchase for the Dowse Collection works of art created by Eastbourne artists, being artists who have or have had a significant association with Eastbourne. 13 4 (11) 6Total 79 23 (60) 42
174 HUTT CITY LONG TERM PLAN <strong>2012</strong>-2022Funding Impact StatementINTRODUCTIONIn terms of the Local Government (Rating) Act 2002, and the Local Government Act 2002,each council is required to prepare a Funding Impact Statement disclosing the revenue andfinancing mechanisms it intends to use.The information in the following sections is intended to achieve compliance with thislegislation by, among other things, giving ratepayers full details of how rates are calculated.This statement should be read in conjunction with <strong>Council</strong>’s Revenue and Financing Policy, whichsets out <strong>Council</strong>’s policies in respect of each source of funding of operating expenses.SUMMARY OF FUNDING MECHANISMS AND INDICATION OF LEVEL OF FUNDS TO BEPRODUCED BY EACH MECHANISMThe table on page 177 sets out the revenue and financing mechanisms to be used for<strong>2012</strong>-2022, and indicates the revenue forecast to be produced by each mechanism.Details of user charges and other funding sources, and the proportion applicable to eachactivity, are shown in more detail in the Revenue and Financing Policy.RATES FOR YEARFor the <strong>2012</strong>/13 year, and for subsequent years, it is intended that <strong>Council</strong> will set thefollowing rates:a) Water Supply RateA separate targeted rate will be set to meet 100% of the costs of water supply andreticulation in the city. Lump sums will not be invited in respect of this rate.<strong>Council</strong> has set the targeted rate for water supply on the basis of the following factors:• A charge per separately used or inhabited part of a rating unit which is connected to thewater reticulation system.• A charge of 50% of the above charge per separately used or inhabited part of a ratingunit that is not connected to, but is able to be connected to, the water reticulation system.Provided that:• Rating units situated within 100 metres from any part of the water reticulation networkare considered to be able to be connected (i.e. serviceable).• Rating units that are not connected to the system, and that are not able to be connected,will not be liable for this rate.• The owner of a rating unit with more than one separately used or inhabited part mayopt to install a water meter to measure the total water consumed. In such a case onlyone charge will be made for the entire rating unit, but the owner will be liable to pay forwater consumed as measured by the meter.b) Wastewater RateA separate targeted rate will be set to meet 100% of the costs of wastewater collection,treatment and disposal within the city. Lump sums will not be invited in respect of this rate.<strong>Council</strong> proposes to set the targeted rate for the wastewater function on the basis of thefollowing factors:• A charge for the first water closet or urinal connected to the wastewater system fromeach rating unit.• A charge of 50% of the above charge for the second and each subsequent water closetor urinal connected to the wastewater system from each rating unit.Provided that:• Each household is charged for no more than one water closet, regardless of theactual number.• No charge is made to any rating unit not connected to the wastewater system.• In the case of urinals each 900 mm or part thereof will be treated as being equivalentto one water closet.c) Recycling ChargeA separate targeted rate will be set to meet 100% of the costs of the recycling collectionservice from residential properties. Lump sums will not be invited in respect of this rate.The targeted rate will be set as a fixed amount per separately used or inhabited part (SUIP)of each rating unit in the Residential differential category.
HUTT CITY LONG TERM PLAN <strong>2012</strong>-2022175d) Jackson Street Programme RateA separate targeted rate, based on the capital value of each rating unit, will be set to raiserevenue from rating units being operated as businesses and with a frontage to JacksonStreet, Petone, between <strong>Hutt</strong> Road and Cuba Street. The revenue raised from this rate willbe applied to meet the costs of the Jackson Street Programme, which is a communitybasedinitiative to help reorganise and revitalise commercial activities in Jackson Street.Lump sums will not be invited in respect of this rate.e) Private Drains RateA separate targeted rate will be set to recover the cost of the work undertaken by the<strong>Council</strong> to upgrade substandard private drains situated within the boundaries of rating units.The cost of the work is to be recovered over a five-year period from the ratepayers forthese rating units as a uniform rate per dollar based on the costs incurred by the <strong>Council</strong>and not otherwise paid by the ratepayer. In future years further upgrading work of thisnature will be undertaken and the costs may be recovered in the same way. Lump sumsare invited in respect of this rate.f) General RateA general rate will be set:• To meet the costs of <strong>Council</strong> activities, other than those detailed above.• Based on the capital value of each rating unit in the city.• On a differential basis, based on the use to which the land is put.UNIFORM ANNUAL GENERAL CHARGE<strong>Council</strong> does not propose to set a Uniform Annual General Charge (UAGC) for <strong>2012</strong>/2013, butin future years if a UAGC is set this will be calculated as one fixed amount per separately usedor inhabited part (SUIP) of a rating unit.DEFINITION OF SUIPFor the purposes of the UAGC or any targeted rate set as a fixed amount per separately usedor inhabited part (SUIP) of a rating unit, a SUIP is defined as:• Any part of the rating unit separately used or inhabited by the owner or any otherperson who has the right to use or inhabit that part by virtue of a tenancy, lease, licenceor other agreement.• At a minimum, the land or premises intended to form the separately used or inhabitedpart of the rating unit must be capable of actual habitation, or actual use by persons forpurposes of conducting a business.• For the avoidance of doubt, a rating unit that has only one use (i.e. it does not have separateparts or is vacant land) is treated as being one separately used or inhabited part.DIFFERENTIAL RATING DETAILSEach rating unit is allocated to a differential rating category (based on land use) for the purposeof calculating the general rate, or any specified targeted rate based on capital value.Set out below are the definitions used to allocate rating units to categories, together withdetails of the differential rating relationships between each category of rating unit for thepurposes of setting and assessing the general rate. The relationships are calculated toproduce, as near as is practicable, the correct proportion of general rate revenue from eachgroup, as is indicated by <strong>Council</strong>’s Revenue and Financing Policy.For the <strong>2012</strong>/2013 rating year, only the general rate has been set using these differentialcategories and relationships. Refer also to the new differentials.Definition of Rating CategoriesCATEGORYResidential (RE)Rural (RU)BusinessAccommodation(BA)Business Central(BC)Business Suburban(BS)Utility Networks(UN)CommunityFacilities 1 (CF1)DESCRIPTIONAll rating units in the city which are:• used primarily for residential purposes,• used or set aside for reserve or recreational purposes (other than EastHarbour Regional Park), excluding properties categorised as rural.All rating units in the city which are:• used primarily for any purpose other than residential, commercial, industrial,recreational or reserve,• used primarily for residential purposes, having an area in excess of 3,000 m 2 ,but not connected to either water and sewerage reticulation,• East Harbour Regional Park.All rating units in any part of the city which are used primarily for commercialaccommodation.All rating units which are located within the Central Area Parking District andwhich are used primarily or predominantly for commercial and/or industrialpurposes, excluding properties categorised as:• Utility Networks,• Business Accommodation.All rating units in any part of the city which are used primarily or predominantlyfor commercial and/or industrial purposes, excluding properties categorised as:• Community Facilities,• Business Central,• Utility Networks,• Business Accommodation.All rating units which comprise all or part of a utility network.All land in the city which is:• Non-rateable in terms of the Local Government (Rating) Act 2002,• 50% non-rateable in terms of the Local Government (Rating) Act 2002.
176 HUTT CITY LONG TERM PLAN <strong>2012</strong>-2022CATEGORYCommunityFacilities 2 (CF2)CommunityFacilities 3 (CF3)DESCRIPTIONAll rating units in the city occupied by charitable trusts and not-for-profitorganisations which either:• Use the land for non-trading purposes for the benefit of the community,• Would qualify as land which is 50% non-rateable in accordance with Part 2of Schedule 1 of the Local Government (Rating) Act 2002 if the organisationdid not have a liquor licence, but excluding any rating unit used for residentialpurposes.All rating units in the city occupied by not-for-profit community groups ororganisations whose primary purpose is to address the needs of adultmembers for entertainment or social interaction, and which engage inrecreational, sporting, welfare or community services as a secondary purpose.For the purposes of these definitions:• Rating units which have no apparent land use (or where there is doubt as to the relevantuse) will be placed in a category which best suits the activity area of the property under theDistrict <strong>Plan</strong>.• Rating units which have more than one use (or where there is doubt as to the relevantprimary use) will be placed in the category with the highest differential factor.• Central Area Parking District is as defined in the District <strong>Plan</strong> – <strong>City</strong> of Lower <strong>Hutt</strong>.• For the avoidance of doubt, “commercial purposes” includes rating units used:− As a hotel, motel, inn, hostel or boarding house.− Primarily as licensed premises.− As a camping ground.− As a convalescent home, nursing home, rest home or hospice operating for profit.− As a fire station.− By a government, quasi-government or local authority agency for administration oroperational purposes.− As an establishment similar to any of the kinds referred to above, except to the extentthat any such rating unit is non-rateable land in terms of the Local Government (Rating)Act 2002.• A “utility network” includes:− A gas, petroleum or geothermal energy distribution system.− An electricity distribution system.− A telecommunications or radio communications system.− A wastewater, stormwater or water supply reticulation system.• “Commercial accommodation” means the provision of accommodation for more than fivepersons (with or without any care, medical or other treatment or services) in the course ofbusiness, and to that extent includes:− A hotel, motel, inn, hostel or boarding house.− Any licensed premises where the provision of accommodation is the primary use.− A camping ground.− A convalescent home, nursing home, rest home or hospice operating for profit.Subject to the right of objection set out in section 29 of the Local Government (Rating) Act2002, it shall be at the sole discretion of <strong>Council</strong> to determine the use or primary use of anyrating unit in the city.Relationships of Differential CategoriesThe rate in the dollar set and assessed in respect of each specified category of rating unitsshall vary from the rate in the dollar in respect of any other specified category of property asset out below. <strong>Council</strong> has amended the differential factors used in 2011/12 and these will beintroduced over a 10 year period. The figures below are based on the current year’s rates.CATEGORYDIFFERENTIALFACTORTRANSITION OVER 10 YRSDIFFERENTIALFACTOR AFTER10 YRS2011/12 <strong>2012</strong>/13 2013/14 2014/15 2015/16 2016/17 2017/18 2018/19 2019/20 2020/21 2021/22Residential (RE) 1.00 1.00 1.00 1.00 1.00 1.00 1.00 1.00 1.00 1.00 1.00Rural (RU) 0.65 0.67 0.68 0.70 0.71 0.73 0.74 0.76 0.77 0.79 0.80BusinessAccommodation(BA)3.00 2.93 2.86 2.79 2.72 2.65 2.58 2.51 2.44 2.37 2.30Business Central(BC)BusinessSuburban (BS)Utility Networks(UN)CommunityFacilities 1 (CF1)CommunityFacilities 2 (CF2)CommunityFacilities 3 (CF3)3.70 3.56 3.42 3.28 3.14 3.00 2.86 2.72 2.58 2.44 2.303.40 3.29 3.18 3.07 2.96 2.85 2.74 2.63 2.52 2.41 2.302.50 2.48 2.46 2.44 2.42 2.40 2.38 2.36 2.34 2.32 2.301.00 1.00 1.00 1.00 1.00 1.00 1.00 1.00 1.00 1.00 1.000.50 0.50 0.50 0.50 0.50 0.50 0.50 0.50 0.50 0.50 0.502.50 2.48 2.46 2.44 2.42 2.40 2.38 2.36 2.34 2.32 2.30
HUTT CITY LONG TERM PLAN <strong>2012</strong>-2022177Funding Impact Statement for the year ending 30 June: Whole of <strong>Council</strong>ACTUAL2011$000ESTIMATE<strong>2012</strong>$000BUDGET2013$000Sources of operating fundingGeneral rates, uniform annual general charges, rates penalties 57,721 57,452 61,913 64,762 67,159 69,342 71,645 74,241 77,056 79,932 82,547 84,900Targeted rates (other than a targeted rate for water supply) 27,396 28,598 29,493 29,553 30,163 31,078 32,075 32,888 33,700 34,575 35,949 37,607Subsidies and grants for operating purposes 5,914 6,195 6,272 6,287 6,437 6,758 6,926 7,099 7,283 7,472 7,675 7,874Fees, charges and targeted rates for water supply 25,527 26,769 29,470 30,224 31,831 32,648 33,463 33,849 34,960 35,867 36,837 37,796Interest and dividends from investments 338 278 285 300 292 271 248 213 186 157 136 126Local authorities fuel tax, fines, infringement fees, and other receipts 3,558 3,281 3,646 3,874 3,823 3,914 4,166 4,111 4,220 4,495 4,445 4,561Total operating funding (A) 120,454 122,573 131,079 135,000 139,705 144,011 148,523 152,401 157,405 162,498 167,589 172,864Applications of operating fundingPayments to staff and suppliers 86,593 90,977 95,587 97,052 99,210 102,162 105,347 107,898 111,179 114,818 118,064 121,481Finance costs 4,355 4,142 4,000 3,880 3,715 4,269 4,663 4,599 4,375 4,040 3,727 3,806Other operating funding applications 2,305 3,098 3,210 3,312 3,418 3,527 3,643 3,763 3,891 4,023 4,163 4,304Total applications of operating funding (B) 93,253 98,217 102,797 104,244 106,343 109,958 113,653 116,260 119,445 122,881 125,954 129,591Surplus (deficit) of operating funding (A-B) 27,201 24,356 28,282 30,756 33,362 34,053 34,870 36,141 37,960 39,617 41,635 43,273Sources of capital fundingSubsidies and grants for capital expenditure 4,508 5,147 4,778 4,910 4,997 7,134 16,751 5,801 7,675 6,656 15,245 10,491Development and financial contributions 73 279 708 725 743 761 779 799 820 842 864 886Increase (decrease) in debt (9,603) 836 (6,087) (9,197) (6,712) 12,408 8,895 (488) (8,590) (12,248) 11,921 (5,062)Gross proceeds from sale of assets - - 1,500 2,560 1,992 - - - - - - -Lump sum contributions - - - - - - - - - - - -Total sources of capital funding (C) (5,022) 6,262 899 (1,002) 1,020 20,303 26,425 6,112 (95) (4,750) 28,030 6,315Application of capital fundingCapital expenditure - - - - - - - - - - - -- to meet additional demand - - - - - - - - - - - -- to improve level of service 7,116 12,743 12,281 12,263 16,967 30,842 37,593 19,294 14,498 11,542 32,988 23,256- to replace existing assets 13,789 16,646 16,900 17,491 17,415 23,514 23,702 22,959 23,367 23,325 36,677 26,332Increase (decrease) in reserves - - - - - - - - - - - -Increase (decrease) of investments - - - - - - - - - - - -Total applications of capital funding (D) 20,905 29,389 29,181 29,754 34,382 54,356 61,295 42,253 37,865 34,867 69,665 49,588Surplus (deficit) of capital funding (C-D) (25,927) (23,127) (28,282) (30,756) (33,362) (34,053) (34,870) (36,141) (37,960) (39,617) (41,635) (43,273)Funding balance ((A-B)+(C-D)) 1,274 1,229 - - - - - - - - - -FORECAST2014$000FORECAST2015$000FORECAST2016$000FORECAST2017$000FORECAST2018$000FORECAST2019$000FORECAST2020$000FORECAST2021$000FORECAST2022$000
178 HUTT CITY LONG TERM PLAN <strong>2012</strong>-2022Rates for <strong>2012</strong>/20131. INTRODUCTIONThe Funding Impact Statement (FIS) details the rates to be set, defines the differentialcategories, and shows the rating factors to be used for <strong>2012</strong>/2013.The preceding table shows a summary of all <strong>Council</strong> funding sources, including rates. Theinformation set out below shows details of each individual rate forming part of the totalrates. It shows an amount for each rate and charge, and which properties are liable foreach rate. It also shows the expected change in the amount payable on a range of typicalproperties.It should be noted that all figures in this section are GST inclusive, unless otherwise stated.2. CHANGESChanges have been made to the city-wide rating structure and differential factors beingused for the <strong>2012</strong>/2013 year.3. SCHEDULE OF RATES FOR <strong>2012</strong>/2013a) Water Supply RateType: Targeted RateRating Factor: Separately used or inhabited part of a rating unitThe charges for the <strong>2012</strong>/13 rating year are as follows:CATEGORYConnectedServiceable but not Connectedb) Wastewater RateType: Targeted RateRating Factor: Number of Water Closets or urinalsThe charges for the <strong>2012</strong>/13 rating year are as follows:CATEGORYFirst WC or urinal per Rating UnitSecond and each subsequent WC or urinal per rating unitCHARGE$347 per part$173.50 per partCHARGE$437 each$218.50 eachc) Recycling ChargeType: Targeted RateRating Factor: Separately used or inhabited part of a rating unitThe charge for the <strong>2012</strong>/13 rating year is as follows:CATEGORYRating units in the Residential category receiving or able to usethe recycling collection service.d) Jackson Street Programme RateType: Targeted RateRating Factor: Capital ValueThe charge for the <strong>2012</strong>/13 rating year is as follows:CATEGORYRating units in any business category having frontage to JacksonStreet, Petone, between <strong>Hutt</strong> Road and Cuba Street.e) Private Drains RateType: Targeted RateRating Factor: Cost of work to upgrade private drainThe charges for the <strong>2012</strong>/13 rating year are as follows:CATEGORYPer dollar of the cost of the work to upgrade private drainCHARGE$36RATE0.08078 cents per $ ofCapital ValueCHARGE24.30 cents per year forfive yearsf) General RateType: General RateRating Factor: Capital ValueThe differential categories and charges for the <strong>2012</strong>/13 rating year are as follows:CATEGORY RATIO CHARGE PER $ OF CAPITAL VALUEResidential (RE) 1.00 0.28912 centsRural (RU) 0.67 0.19227 centsBusiness Accommodation (BA) 2.93 0.84712 centsBusiness Central (BC) 3.56 1.02927 centsBusiness Suburban (BS) 3.29 0.95121 centsUtility Networks (UN) 2.48 0.71702 centsCommunity Facilities 1 (CF1) 1.00 0.28912 centsCommunity Facilities 2 (CF2) 0.50 0.14456 centsCommunity Facilities 3 (CF3) 2.48 0.71702 cents
HUTT CITY LONG TERM PLAN <strong>2012</strong>-20221794. SUMMARY OF REVENUE REQUIRED FROM RATESRATEAMOUNT(INCLUSIVE OF GST) $000AMOUNT(EXCLUSIVE OF GST) $0006. EXAMPLES OF RATES ON A RANGE OF TYPICAL PROPERTIESThe examples below show how a range of properties are affected by the rates for the newyear.General Rate 70,983 61,724Targeted Rates:Water Supply 13,812 12,010Wastewater 18,598 16,173Jackson St 127 110Recycling 1,380 1,200Private Drains 90 78Total Rate Revenue 104,990 91,295Note: Total rate revenue includes rates charged on <strong>Council</strong>-owned properties.5. SUMMARY OF REVENUE REQUIRED BY DIFFERENTIAL GROUPDIFFERENTIAL GROUPRATES <strong>2012</strong>/13$000TOTAL RATES BYCATEGORY$000PROPORTION OFTOTAL RATES%Residential 67,730 64.50%Rural 582 0.55%Utility Networks 4,298 4.10%Business:Accommodation 680Central 8,771Suburban 21,785 31,236 29.75%Community Facilities:1 8362 1513 157 1,144 1.10%Total Rates Levied 104,990 100.00%PROPERTY CATEGORYRATEABLE VALUES2010 AS ATJUNE <strong>2012</strong> $2011/<strong>2012</strong>RATESCURRENTRATES $ RATES $<strong>2012</strong>/2013 RATESCHANGEAMOUNT $CHANGEAMOUNT%Average Residential 366,024 1,815 1,880 65 3.58Average Bus. Central 1,472,419 16,148 16,155 7 0.04Average Bus. Suburban 1,081,462 11,054 11,192 138 1.25Average Bus. Accomm. 2,312,200 22,576 23,624 1,048 4.64Average Rural (No Water/ 575,956 1,021 1,108 87 8.52Wastewater Services)Residential 390,000 1,884 1,948 64 3.40Residential 750,000 2,872 2,988 116 4.04Residential (22 Flats) 2,800,000 20,952 21,547 595 2.84Residential 220,000 1,417 1,456 39 2.75Residential 470,000 2,103 2,179 76 3.61Residential 220,000 1,417 1,456 39 2.75Rural (No Water/Wastewater 440,000 785 846 61 7.77Services)Rural (Full Services) 950,000 2,472 2,611 139 5.62Rural (Full Services) 530,000 1,723 1,803 80 4.64Rural (No Water/Wastewater 220,000 393 423 30 7.63Services)Business Accommodation 1,250,000 15,031 15,306 275 1.83Business Central 9,150,000 94,808 96,055 1,247 1.32Business Central 285,000 3,672 3,717 45 1.23Business Suburban 650,000 6,843 6,967 124 1.81Business Suburban 860,000 9,683 9,838 155 1.60Business Suburban (JSP) 730,000 8,178 8,318 140 1.71Business Suburban (JSP) 12,000,000 12,843 13,049 206 1.60Business Suburban 1,700,000 26,543 26,787 244 0.92Business Suburban 315,000 3,717 3,780 63 1.69
180 HUTT CITY LONG TERM PLAN <strong>2012</strong>-20227. RATES INSTALMENT DETAILSThe amount of the annual rates payable on each rating unit is payable by six equalinstalments by the following dates:Instalment No. Due DateOne20 AugustTwo20 OctoberThree 20 DecemberFour20 FebruaryFive20 AprilSix20 JuneWhere the annual rates are not able to be set in time for the first instalment, the firstinstalment will be calculated and charged as one sixth of the previous year’s rates.The remaining five instalments will then be calculated as each being one fifth of the amountof the annual rates, after deducting the amount of instalment one.8. PENALTIES ON UNPAID RATESIf the rates instalment amount is not paid by the due date then the following penaltycharges will be incurred:a) After the due date shown for each instalment, a penalty charge of 10% of the amountremaining unpaid for that instalment will be added to the rate accountb) All rates levied in any previous financial year (including any penalty amounts alreadyadded for late payment) which remain unpaid after the due date for payment of thesecond instalment in the current year (20 October), will incur a further penalty charge of10%c) All rates levied in any previous financial year (including any penalty amounts alreadyadded for late payment) which remain unpaid after the due date for payment of the fifthinstalment in the current year (20 April), will incur a further penalty charge of 10%.Provided that no penalty shall be added to any rate account:a) Where a direct debit authority is in place for payment of the rates by regular weekly,fortnightly or monthly instalments, and payment in full is made by the end of the ratingyear; orb) Where any other satisfactory arrangement has been reached for payment of the currentrates by regular instalments by the end of the rating year.Fees and Charges for <strong>2012</strong>/2013The following is a consolidated list of <strong>Hutt</strong> <strong>City</strong> <strong>Council</strong>’s fees and charges. All fees andcharges include Goods and Services Tax (GST). <strong>Council</strong> will be consulting separatelyon increases proposed to environmental consent fees. The current and proposed fees areincluded below for information and any changes to environmental consent fees will beimplemented from 1 September <strong>2012</strong>. See www.huttcity.govt.nz for more information.ANIMAL SERVICES<strong>2012</strong>/2013DogEntire Dog $98.00Neutered $87.00All dogs not registered by 4 August $150.00Classified “Dangerous” $126.00Classified “Dangerous” and not registered by 4 August $200.00Responsible owner status $58.00Replacement registration tags $5.00Euthanasia at owner’s request $31.00Licence fee for keeping more than two dogs $31.00Infringement fees set in the Dog Control Act 1996 applyMicro-chipping fee $31.00Impounding and Sustenance Fees (Registered Dogs)First impounding during year of registration $77.00Second impounding during year of registration $154.00Sustenance fee per dog per day $17.00Boarding fee per day $17.00Seizure fee $77.00Impounding and Sustenance Fees (Unregistered Dogs)First impounding during year of registration $100.00Second impounding during year of registration $170.00Sustenance fee per dog per day $17.00Boarding fee per day $17.00Seizure fee $100.00
HUTT CITY LONG TERM PLAN <strong>2012</strong>-2022181ARCHIVES<strong>2012</strong>/2013There is no charge for inspecting items at the public reading roomSearch Fees1 Hour FreeFee per additional half-hour $38.00Research Questions - Fees apply*Fee per half-hour $38.00Note: * For Public Records Act accessThe full half-hour fee will be charged for each part-period usedFees are chargeable in advancePhotocopy FeesCopying is subject to the physical condition and type of the item - in the interest ofpreserving the archive, and copyright legislationAll copying of archives will be carried out by Archive staffA4 Up to 20 pagesPages in excess of 20A3Free$0.20 centsper page*$2.00 perpage** Fees to recover the cost of staff time may apply. After the first 10 minutes of copying, staff time will be added to thesearch/ research time.BOAT SHEDSBoat shedIndependent valuation on a square metre basisCEMETERIES<strong>2012</strong>/2013Plot Purchase and Maintenance In-perpetuityAdult $1,345.00Child (1 to 12 years) $565.00Infant (under 1 year) $123.00Ashes $507.00Ashes garden, Taita and Wainuiomata $820.00Memorial tree plots, Block 18 $824.00Ponga trail, Block 19 $660.00Interment FeesAdult $690.00Child (1 to 12 years) $445.00Infant (under 1 year) $123.00Ashes $92.50RSA SectionBurial plot purchaseFreeBurial interment fee $690.00Ashes plot purchaseFreeAshes interment fee $92.50Ashes interment (memorial wall) $92.50DisintermentsBurial (body) $1,900.00*Ashes $175.00** Note: These figures are indicative only and the actual charge may differ depending on the nature of the disintermentRe-intermentsTo be charged as for interment feesSpecial Fees and ChargesOutside district fees* $920.00Outside district fee* - children under 12 $810.00Outside district fee* - RSA $920.00Outside district fee* - ashes $665.00Casket larger than standard $205.00Extra depth (90 centimetres) $166.50Weekend interment - casket $355.50Weekend interment - ashes $175.50Plaque/Memorial fees $67.00Plot cancellation fee $44.00Transfer of exclusive right $44.00Breaking of concreteActual costSearch fee: per entry (up to 30 minutes) $16.00* Applies to all plot purchases where deceased has lived outside the city for the last five or more years.Reimbursement for unused plots is calculated at the rates originally paid for the plots.
182 HUTT CITY LONG TERM PLAN <strong>2012</strong>-2022ENCROACHMENT ON HUTT CITY COUNCIL LAND<strong>2012</strong>/2013Application fee (new applications) $173.00Application fee (alterations to existing use) $58.00GardensSingle garageDouble garageCommercial$115.00pa$128.00pa$256.00paAssessed by<strong>Council</strong> at amarket rateNote: These are indicative figures only and actual charges may differ depending on the nature of the encroachment. Otherencroachment types will be assessed by <strong>Council</strong> on an individual basis.ENGINEERING RECORDS AND LAND INFORMATION SERVICESPRINT SIZEPLAN PRINTER<strong>2012</strong>/2013TRANSPARENCYPLAN PRINTERINK JET PLOTSOversize - $52.00A0 - $31.00A1 $8.50 $5.50 $21.00A2 $4.50 $3.50 $11.00A3 $2.50 $7.50A4 - $5.50GIS Specialists time (per hour) $62.00District <strong>Plan</strong> spatial data$1,025.00 or part thereofOTHO-RECTIFIED AERIAL IMAGES(CHARGES APPLY FOR FULL YEAR) YEAR 1 YEAR 2 YEAR 3 YEAR 4 YEAR 5Georeferenced tiff files – per file* $52.00 $46.00 $40.00 $35.00 $30.00Monthly subscription for Web Map $500.00 $438.00 $383.00 $335.00 $293.00Service*Bulk Discounts $1,000+ $10,000+ $20,000+Less 10% Less 20% Less 25%ENVIRONMENTAL CONSENTS<strong>Council</strong> will be consulting separately on increases proposed to environmental consent fees.The current and proposed fees are included below for information and any changes toenvironmental consent fees will be implemented from 1 September <strong>2012</strong>.See www.huttcity.govt.nz for more information.Resource ConsentsAll fees include GST and are payable under section 36 of the Resource Management Act(RMA) 1991. Fees are not refundable if your application is declined or withdrawn. Additionalcharges may apply (see below). Application fees cover the cost of processing your applicationonly. After you start building there are charges to cover the cost of <strong>Council</strong>’s monitoring costs,such as site visits, research, photos, communications and administration.NON-COMPLYING, DISCRETIONARY, RESTRICTED DISCRETIONARY,CONTROLLED 2011/<strong>2012</strong> <strong>2012</strong>/2013Notified application - hearing required (includes up to40 hours of processing and one monitoring inspection)If application is required to be notified in a dailynewspaper, an additional fee of $1,000.00 is required$5,330.00 $6,150.00Notified application - no hearing required (includesup to 30 hours of processing and one monitoringinspection)Limited notification (includes up to 30 hours ofprocessing and one monitoring inspection)Non-notified resource consent (includes up to sevenhours of processing and one monitoring inspection)Non-notified resource consent- residential additionsand alterations (includes up to five hours of processingand one monitoring inspection)$4,030.00 $4,650.00$4,030.00 $4,650.00$1,040.00 $1,200.00$780.00 $900.00All additional processing (per hour) $130.00 $150.00Administration charges (per hour) $90.00 $90.00Hearing Commissioner time to be recovered fromapplicants for time spent in hearings and deliberating(per hour)Fast Track - non-notified consents only - issued within10 days (conditions apply, applications will be acceptedon a case-by-case basis)Fast Track - non-notified consents only - issuedwithin five days (conditions apply, applications will beaccepted on a case-by-case basis)Chair$85.00Members$68.00<strong>Council</strong> Commissioners:Chair $87.00Members $70.00Independent Commissioners:Chair - Actual costMember of hearing panel -$70.00- Two times normalfee(payment of twicenormal base fee at receiptof application: $300 per hourof additional processing timewill be charged)- Three times normal fee(payment of three timesnormal base fee at receiptof application: $450 per hourof additional processing timewill be charged)
HUTT CITY LONG TERM PLAN <strong>2012</strong>-2022183Consultant’s fees and costs of disbursements will also be additionally charged and invoicedwhen consent is completed.SUBDIVISIONS (INCLUDING UNIT TITLE, CROSS LEASE) 2011/<strong>2012</strong> <strong>2012</strong>/2013Notified application – hearing required (includes up to40 hours of processing and one monitoring inspection)If application is required to be notified in a dailynewspaper, an additional fee of $1,000.00 is required$5,330.00 $6,150.00Notified application – no hearing required (includesup to 30 hours of processing and one monitoringinspection)Limited notification (includes up to 30 hours ofprocessing and one monitoring inspection)Subdivision consent including land use consent(includes up to 10 hours of processing and onemonitoring inspection)Subdivision consent including certificate under section223 of the RMA (includes up to 8 hours of processingand one monitoring inspection)$1,170.00plus $51 per lot over4 lots$4,030.00 $4,650.00$4,030.00 $4,650.00$1,430.00 $1,650.00$1,350.00plus $60 per lot over4 lotsCertificate under section 224 of the RMA $258.00 $300.00Certificate under section 226 of the RMA (includes up$390.00 $450.00to three hours of processing)Section 241 and 243 RMA application (includes up to$780.00 $900.00six hours of processing)Rights of way (includes three hours of processing) $390.00 $450.00Rights of way sealing fee $155.00 $180.00Hearing Commissioner time to be recovered fromapplicants for time spent in hearings and deliberating(per hour)Chair $85.00Members $68.00<strong>Council</strong>Commissioners:Chair $87.00Members $70.00IndependentCommissioners:Chair - Actual costMember of hearingpanel - $70.00OTHER FEES 2011/<strong>2012</strong> <strong>2012</strong>/2013Sec 139A Existing Use Certificate application (includes up to six $780.00 $900.00hours of processing)Certificate of Compliance (includes up to six hours of$780.00 $900.00processing)Outline <strong>Plan</strong> (includes up to six hours of processing and one$910.00 $1,050.00monitoring inspection)Outline <strong>Plan</strong> waiver (includes up to six hours of processing) $910.00 $1,050.00Section 10 waiver, section 37 waiver, section 125 extension,section 126 cancellation, sections 127 & 128 review (nonnotified)RMA (includes up to six hours of processing)$780.00 $900.00Section 357, 357A and 357B objection (non-notified) $780.00 $900.00Certificate of Use under Sale of Liquor Act 1989 $155.00 $180.00Any special inspections (per hour) $130.00 $150.00Sealing fee (for urgent applications for registrable instruments) $82.00 $94.00Certificate under Overseas Investment Act 1973 $390.00 $450.00Cost of disbursements, i.e. venue hire, photocopying, catering, Actual cost Actual costpostage, public notificationAdministration costs (per hour) $90.00 $90.00Independent consultants, advisors, specialists Actual cost Actual costAll consents: additional processing hours (per hour) $130.00 $150.00Discharge or withdrawal of registrable agreement – legal costs$130.00 $150.00plus officers’ time at (per hour)Processing request for removal of building line (plus$153.00 $175.00disbursements)Adjustment or revocation of easements – legal costs plus$130.00 $150.00officers’ time at (per hour)Bond preparation and/or release (up to two hours) - $300.00ENVIRONMENTAL SUSTAINABILITY INITIATIVES 2011/<strong>2012</strong> <strong>2012</strong>/2013Domestic solar hot water heating panelsFree of charge for up to fiveSolar water heating systemshours of initial processing andone monitoring inspection, afterHot water systems, i.e. wetbacks associated with wood pellet which standard charges for thestoves or low-emission wood burnerscategory of consent will applyHot water heat pump systemsSolar photo-voltaic systemsDouble glazing retrofits on buildings pre-2000Rainwater tanksEco design advisor home assessment (two hours) Free of charge Free of chargeHome Star certified assessment $400.00 $460.00All additional monitoring inspections (per visit) $130.00 $150.00
184 HUTT CITY LONG TERM PLAN <strong>2012</strong>-2022Consultant’s fees and costs of disbursements will also be additionally charged and invoicedwhen consent is completed.<strong>Term</strong>s and Late PaymentInitial and Additional FeesFees must be paid before applications are processed. Further charges will be invoiced ifadditional time is spent processing requests and/or disbursements.<strong>Term</strong>s of PaymentPayment of additional fees is due by the 20th of the month following invoice processing.Late payment will incur:• an additional administrative fee (lesser of 10% of the overdue amount or $300)• all costs and expenses (including debt collection or legal fees) associated with recovery ofthe overdue amount• daily interest (rate of 15% pa) from the date of default.BUILDING CONSENTSProject Information Memorandum (PIM), Building Consent (BC,) Amendment to BuildingConsent, Certificate for Public Use (CPU), Certificate of Acceptance Fee (COA) and ComplianceSchedules (CS)/Building Warrants of Fitness(BWF)Please note that the PIM and BC fees listed below are base fees only and do not include anyadditional administration, processing or inspections, consultant fees or Building ResearchAssociation of NZ (BRANZ) and Department of Building and Housing (DBH) levies. These willbe charged extra as and if required.TOTAL PIM AND BCVALUE OF WORKFree standing fire(includes one hour processing &1.25 hours administration)Fast Track – five daysInbuilt fire(includes one hour processing &1.25 hours administration)Fast Track – five daysStandard garages(includes up to 1.5 hours processing &1.25 hours administration)Fast Track - five days< $5,000(includes up to 1.5 hours processing &1.25 hours administration)To $10,000(includes up to 2.5 hours processing &2.5 hours administration)To $19,999(includes up to 4 hours processing &2.75 hours administration)To $50,000(includes up to 5 hours processing &2.75 hours administration)To $100,000(includes up to 7 hours processing &2.75 hours administration)To $200,000(includes up to 9 hours processing &4.5 hours administration)To $300,000(includes up to 10 hours processing &4.5 hours administration)To $500,000(includes up to 12 hours processing &4.5 hours administration)To $700,000(includes up to 12 hours processing &4.5 hours administration)To $1,000,000(includes up to 12 hours processing &4.5 hours administration)Over $1,000,000 $1,000.00+ $102.00per$200,0002011/<strong>2012</strong> <strong>2012</strong>/2013PIM BC PIM BC$100.00 $200.00 $100.00 $370.001 inspection$100.00 $250.00 $100.00 $510.002 inspections$194.00 $560.002 inspections$194.00 $321.00 $194.00 $560.002 inspections$194.00 $530.00 $194.00 $940.003 inspections$296.00 $740.00 $296.00 $1,150.003 inspections$296.00 $1,108.00 $296.00 $1,750.004 inspections$350.00 $1,737.00 $350.00 $1,800.005 inspections$350.00 $2,083.00 $350.00 $2,235.006 inspections$500.00 $2,543.00 $500.00 $2,480.006 inspections$750.00 $3,116.00 $750.00 $2,870.007 inspections$750.00 $3,805.00 $750.00 $2,870.007 inspections$1,000.00 $4,830.00 $1,000.00 $2,870.007 inspections$4,405.00+ $405.00per$200,000$1,000.00 +$102.00 per$200,000Time cost
HUTT CITY LONG TERM PLAN <strong>2012</strong>-2022185Once building consent has been granted, you will be notified of any further fees due, suchas additional administration, processing and/or inspection fees, consultant fees, BRANZ andDBH levies.The BRANZ levy is $1.00 per $1,000 for works $20,000 and over, and DBH levy is $2.01 per$1,000 for works $20,444 and over.OTHER FEES 2011/<strong>2012</strong> <strong>2012</strong>/2013All additional processing (per hour) $130.00 $130.00Inspection fee (per inspection) $130.00 $130.00Amendment fee charge per hour $155.00 $180.00Section 72 - building on land subject toActual costActual costnatural hazardsSection 75 - building on two or moreActual costActual costallotmentsVehicle crossing construction Actual cost Actual costStructural checking fee Actual cost Actual costWater connection/alteration Actual cost Actual costSewer/stormwater connection/Actual costActual costdisconnectionBackflow prevention device Actual cost Actual costSanitary sewer TV survey Actual cost Actual costStormwater TV survey Actual cost Actual costSERVICE CONNECTION APPLICATIONFEESWastewater $31.00 $36.00Stormwater $31.00 $36.00Water $82.00 $89.00CERTIFICATE FOR PUBLIC USEWhen received with a building consent $200.00 $230.00When received independently $260.00 $300.00CERTIFICATE OF ACCEPTANCEWorks under $100,000$780.00 (deposit plusnormal consent fees andlevies for DBH)$895.00 (deposit plusnormal consent fees andlevies for DBH)Works $100,000 and over$2,250.00 (deposit plusnormal consent fees andlevies for DBH)$2,590.00 (deposit plusnormal consent fees andlevies for DBH)OTHER FEES 2011/<strong>2012</strong> <strong>2012</strong>/2013COMPLIANCE SCHEDULE (CS)/BUILDING WARRANTOF FITNESS (WOF)Building WOF $130.00 $150.00Building WOF/CS inspection $130.00 per hour $150.00 per hourAmendment to CS $55.00 $63.00Commercial cable car $130.00 $150.00Residential cable car Free of charge Free of chargeENVIRONMENTAL SUSTAINABILITY INITIATIVESDomestic solar hot water heating panelsSolar water heating systemsHot water systems, ie. Wetbacks associated with woodpellet stoves or low –emission wood burnersHot water heat pump systemsSolar photo-voltaic systemsDouble glazing retrofits on buildings pre-2000Rainwater tanksEco Design Advisor home assessment (two hours)Free of chargeFree of chargeFree of chargeFree of chargeHome star certified assessment $400.00 $460.00All additional monitoring inspections (per visit) $130.00 $150.00TERMS & LATE PAYMENTBase Fees & Additional FeesBase fees must be paid before applications are processed. Further charges will be invoiced ifadditional time is spent processing requests and/or disbursements.<strong>Term</strong>s of PaymentPayment of additional consenting, administration, disbursements and consultants fees shallbe paid before application is issued. Additional inspections fees shall be paid before CodeCompliance Certificate is issued.Late payment will incur:• an additional administrative fee (lesser of 10% of the overdue amount or $300.00)• all costs and expenses (including debt collection or legal fees) associated with recovery ofthe overdue amount• daily interest (rate of 15% pa) from the date of default.
186 HUTT CITY LONG TERM PLAN <strong>2012</strong>-2022Development and Financial ContributionsDevelopment and financial contributions are payable in relation to the subdivision anddevelopment of land. The amounts payable are described in <strong>Council</strong>’s Policy on Developmentand Financial Contributions.Property InformationProperty information sent by email $10.00(up to 5mb)Property information copied to CD $15.00 (includes 30minutes processing)plus $45.00 per halfhourthereafterProperty information requested in hard copy $10.00 plus $0.50 perA4 black and whitesheet$10.00 plus$1.00 perA4 colour sheet$10.00 plus $1.00 perA3 black and whitesheet$10.00 plus$2.00 perA3 colour sheet2011/<strong>2012</strong> <strong>2012</strong>/2013$15.00(up to 5mb)$20.00 (includes 30minutes’ processing)plus $45.00 per halfhourthereafter$1.00 perA4 black and whitesheet$1.50 perA4 colour sheet$1.50 perA3 black and whitesheet$2.50 perA3 colour sheetA4 colour aerial photo $3.00 $3.50A3 colour aerial photo $7.00 $7.50Certificate of Title $15.00 $20.00Interests/document, eg transfer, easement,covenant, lease$15.00 $20.00ENVIRONMENTAL HEALTHPremises meeting the required standard by 1 July are eligible for a discount, providedre-registration is applied for by 20 August.FOOD PREMISESFEE<strong>2012</strong>/2013DISCOUNTFEEA GRADEClass One – Fruiterers, pre-packaged only (low risk, pre-packaged) $329.00 $226.00 $180.00Class Two – Dairies, service stations (small premises – ready-madefoods – some ice cream/pre-wrapped pies), clubs (medium), supplyof low-risk food$391.00 $273.00 $226.00Class Three – Clubs (large), rest homes (50), supermarkets (large), supply of high-riskfood$481.00 $334.00 $278.00$561.00 $388.00 $320.00$922.00 $633.00 $519.00Travelling Shops - food $274.00 $186.00 -Food stalls $274.00 $186.00 -Clubs/canteens (small) – type 16 – no food preparation $134.00 $93.00 $77.00Land Information Memorandum (LIM)Residential Property LIM (deposit - includes 3.5 hours’ processing time and$320.00disbursements)Commercial property LIM (deposit – includes 3.5 hours’ processing time$500.00and disbursements)Additional processing hours over 3.5 hours (per hour) $90.00
HUTT CITY LONG TERM PLAN <strong>2012</strong>-2022187<strong>2012</strong>/2013OTHER LICENCESFEE DISCOUNT FEE A GRADETravelling shops – no food $130.00 N/A Set by statuteHairdressers $271.00 $186.00 N/ACamping grounds $457.00 $427.00 N/AHawkers $51.00 N/A Set by statuteAmusement devices $82.00 N/A Set by statuteMortuaries $338.00 $231.00 N/AOffensive trades $388.00 $270.00 N/ANote: Food premises operating under approved Food Control <strong>Plan</strong>s will continue to be charged according to the listed riskcategory.ADDITIONAL CHARGES <strong>2012</strong>/2013One-off food stalls $40.00New premises – establishment fee $105.00Initial registration fee $84.00Transfer registration fee $53.00Additional inspections of registered premises or follow-up visits for noncompliance$84.00 per visitwith Food Control <strong>Plan</strong> (corrective actions)Street musician licence $20.00Amusement devices (per site for seven days)Set by statuteNOISE CONTROL <strong>2012</strong>/2013Seizure fine (stereo equipment)$158.00 and$1 per day after the1st month of storage$210.00 for 2ndseizure within a6-month periodSecurity alarms – daytime attendances $84.00Security alarms – after hours attendances $160.00Consultancy and survey fee$105.00 per hourENVIRONMENTAL POLICY<strong>2012</strong>/2013Requests for Change to District <strong>Plan</strong> (deposit) $5,111.00All actual costs related to the proposed plan change, including<strong>Council</strong> officers’ time, will be borne by the applicant as follows:• All work undertaken by <strong>Council</strong> officers in connection with the$118.00 per hourrequest for the change shall be charged against the deposit at:• All work undertaken by independent consultants, advisors and/or specialists in connection with the request for the change shallbe charged at the actual costs plus disbursements against thedeposit.• Any hearing shall be charged against the deposit at:$1,022.00 per day or part day• Hearing Commissioner time shall be recovered for time spent inhearings and deliberating (per hour)• If the proposed change is notified publicly, advertising chargeswill be actual costs payable by the applicant.• All information requested by <strong>Council</strong> shall be supplied at theapplicant’s cost.Notice of Requirement and Alterations to Notices ofRequirement (deposit)All actual costs related to the requirement, including <strong>Council</strong>officers’ time, will be borne by the Requiring Authority as follows:• All work undertaken by <strong>Council</strong> officers in connection with therequirement shall be charged against the deposit at:• All work undertaken by independent consultants, advisors and/orspecialists in connection with the requirement shall be charged atthe actual costs plus disbursements against the deposit.• Any hearing shall be charged against the deposit at:• Hearing Commissioner time shall be recovered for time spent inhearings and deliberating (per hour)• If the requirement is notified publicly, advertising charges will beactual costs payable by the Requiring Authority.• All information requested by <strong>Council</strong> shall be supplied at theRequiring Authority’s cost.<strong>Council</strong> Commissioners:Chair $85.00Members $68.00Independent Commissioners:Chair - Actual costMember of hearing panel -$68.00$5,111.00$118.00 per hour$1,022.00 per day or part day<strong>Council</strong> Commissioners:Chair $85.00Members $68.00Independent Commissioners:Chair - Actual costMember of hearing panel -$68.00
188 HUTT CITY LONG TERM PLAN <strong>2012</strong>-2022Operative District <strong>Plan</strong>Complete set $256.00Text volume $128.00Map volume $128.00GAMBLING VENUE AND BOARD VENUEClass 4 Gambling Venue and Board Venue applications $300.00HALLSCommunity rates for hall hire are set out below.The commercial rates are set at the community rate, plus 50%, with a separate negotiablecharge of up to 10% of the gross revenue of the commercial activity. A charity rate is alsoavailable by application.Community HallsCHARGE PER HOURALL FACILITIESMON - FRIALL FACILITIESWEEKENDS &HOLIDAYS<strong>2012</strong>/2013MEETING ROOMMON - FRIMEETING ROOMWEEKENDS &HOLIDAYSMoera, Eastbourne, Belmont,$15.00 $20.00 N/A N/AStokes ValleyWainuiomata, Taita, Naenae $15.00 $20.00 $10.00 $12.00Hardwick-Smith Lounge $10.00 $15.00 N/A N/ATown Hall and Horticultural HallMONDAY TO FRIDAYMAIN HALL SUPPER ROOM<strong>2012</strong>/2013KITCHEN & SUPPERROOMMAIN HALL &KITCHENALL FACILITIES8am – 12 noon $172.00 $43.00 $86.00 $225.00 $257.0012 noon – 2pm $86.00 $38.00 $54.00 $124.00 $155.002pm – 6pm $172.00 $43.00 $86.00 $225.00 $257.006pm – 11pm $193.00 $54.00 $128.00 $257.00 $306.008am – 6pm $290.00 $91.00 $172.00 $376.00 $456.002pm – 11pm $290.00 $91.00 $172.00 $376.00 $456.008am – 11pm $376.00 $129.00 $257.00 $510.00 $628.00After 11pm $76.00 $76.00 $76.00 $76.00 $76.00WEEKENDS & PUBLICHOLIDAYSMAIN HALLSUPPER ROOM<strong>2012</strong>/2013KITCHEN & SUPPERROOM MAIN HALL & KITCHENALL FACILITIES8am – 12 noon $242.00 $76.00 $124.00 $290.00 $349.0012 noon – 2pm $124.00 $48.00 $97.00 $172.00 $204.002pm – 6pm $242.00 $76.00 $124.00 $290.00 $349.006pm – 11pm $274.00 $97.00 $183.00 $359.00 $440.008am – 6pm $414.00 $124.00 $242.00 $526.00 $644.002pm – 11pm $414.00 $124.00 $242.00 $526.00 $644.008am – 11pm $526.00 $183.00 $359.00 $697.00 $864.00After 11pm $107.00 $107.00 $107.00 $107.00 $107.00LANDFILLS (ALL CHARGES INCLUDE A GOVERNMENT WASTE LEVY)<strong>2012</strong>/2013Domestic Vehicles (Cash Only)Cars and station wagons $15.00Vans, utilities, SUV (four-wheel drives), small trailers $30.00(Maximum refuse dimensions: 2.5 metres long, one metre high, 1.5 metres wide)Note: Combinations of vehicles (vans, utilities, small trucks) and trailers will cost thesum of their respective charges.All Other Vehicles (Per Tonne) $110.00Minimum charge $55.00Special burials $150.00Minimum charge $75.00Potentially Hazardous WastesBy negotiation, refer to the `<strong>Hutt</strong> <strong>City</strong> Landfill – Waste Disposal Guide’Car bodies (per tonne) $110.00TyresDisposal of more than four tyres (per tonne) regardless of vehicle type $320.00Minimum charge $160.00Note: All charges include Ministry for the Environment levy of $10 + GST per tonne.Refuse Bags Including Government LevyPlastic bags – packet of 5 $12.50Plastic bags – packet of 10 $25.00Plastic bags – packet of 50 $125.00
HUTT CITY LONG TERM PLAN <strong>2012</strong>-2022189LIBRARIES<strong>2012</strong>/2013Interloans (non-urgent) per request $15.00Interloans (urgent)At costLost itemsCurrent retail price plus a $15.00 contribution to the cost ofreplacing the itemRental collectionsVary according to format to a maximum of $10.00 per itemOverdue charges$0.50 per day for all formatsBorrower’s card replacement (per card) $5.00Internet access and computer use$1.00 per half-hourLITTERING INFRINGEMENT FEES<strong>2012</strong>/2013Minor littering Infringement fee $100.00Minor littering is defined as depositing in or on a public place or in or on private land without theconsent of the occupier: cigarette butts; wrappers/paper; chewing gum; small food waste; takeawayfood/drink containers; fish & chip papers; plastic drink bottle(s); and aluminium can(s).Note: For cigarette butt littering, this is a two step enforcement process.First step: Educate/warning – offender advised this is not acceptable.Second step: If a person is found depositing cigarette butt litter having already been warned,an infringement fee of $100.00 will be issued.<strong>2012</strong>/2013Medium littering Infringement fee $200.00Medium littering is defined as depositing in or on a public place or in or on private land withoutthe consent of the occupier: single used disposable nappy or nappies; small dumping (egshopping bags) – domestic/commercial waste in, or by, public litter bins; small dumping in orby commercial waste bins/clothing bins/recycling stations; persistent use of unofficial (non-<strong>Council</strong>) refuse bags; and small insecure load from truck or trailer.Note: Small dumping is defined as up to four shopping bags or two refuse bags or single items. Small insecure load isdefined as paper, a single item, grass clippings and dust that has come off a truck or trailer.<strong>2012</strong>/2013Major littering Infringement fee $400.00Major littering is defined as depositing in or on a public place or in or on private land without theconsent of the occupier: household waste; commercial waste; green waste; car parts; and anyother litter as defined in the Litter Act 1997 not defined as minor or medium littering above.Note: The Litter Act 1979 defines the depositing of glass or glass bottles (or broken glass or bottles) as a dangerous formof litter and thus it is considered by <strong>Council</strong> as a major littering offence. The decision whether to issue an infringementnotice for major littering or to refer the matter to the District Court will be determined on a case-by-case basis, based onthe severity and malicious intent of the alleged offence.OFFICIAL INFORMATIONThe following charges shall apply for requests made under the LocalGovernment Official Information and Meetings Act 1987 (the ‘Act’):a) If the request is made by an identifiable natural person seeking access toany personal information about that person, such requests are subject to thePrivacy Act 1993 and these charges do not apply.b) If the aggregate amount of staff time spent in actioning a request exceedsone hour the basis of charging (except for the issue of a LIM under section44A of the Act) is as follows:• Charge per additional half-hour or part thereof including search, retrieval,provision of information and supervisionc) Photocopying on standard A4 where the total number of pages exceeds 20(the first 20 pages will be free).d) All other charges incurred shall be fixed at an amount that recovers the actualcosts involved. This will include:• Producing a document by computer or other like equipment• Reproducing a photograph, film, video or audio recording• Arranging for the applicant to hear or view an audio or visual recording• Providing a copy of any map, plan or other document larger than A4,retrieval of information off–site, or any situation in which a direct charge isincurred by <strong>Council</strong> in providing the information• Where repeated requests are made from the same source in respect of acommon subject in any eight-week period, requests after the first will beaggregated for charging purposes.e) A charge may be modified or waived at the discretion of a General Managerwhere payment might cause the applicant financial hardship, or whereremission or reduction of the charge would facilitate good relations with thepublic, or assist the section, group or organisation in its work.f) The charge may not include any allowance for:• Information that is not where it ought to be• Time spent deciding whether or not access should be allowed and inwhat form (note that the actual physical editing of protected information ischargeable).g) Charges shall be paid in advance of receipt of information.<strong>2012</strong>/2013$38.00$0.20 per page
190 HUTT CITY LONG TERM PLAN <strong>2012</strong>-2022PARKING<strong>Council</strong> operates Pay & Display metered parking in the CBD of Lower <strong>Hutt</strong>.The metered area is generally from Market Grove at the southern end of the CBD to DownerStreet at the northern end, bounded by Cornwall Street and the Riverbank car park.Meter charges are structured into five tariff tiers HC1 to HC5.A small number of P15 and P60 spaces are provided, free of charge, throughout the meteredarea for additional public convenience.Mobility car parks are provided throughout the CBD, at the prevailing metered tariff.Saturday parking is free from fees within the CBD. Time restrictions (P120) apply on Saturdayto the Red HC1 and Green HC2 parking zones.Sunday parking – no fee or time restrictions apply on Sunday.Hours of Meter OperationPay & Display parking meters operate for the following hours: 9am to 5pm Monday to Friday.Tariff StructurePremium (Red HC1) ZoneShoppers (Green HC2) Zone (including Dowsecar park)Shoppers (Green HC2) Zone - Pavilion car parkCommuter (Yellow HC3) ZoneRiverbank car park (Yellow HC4) Zone$2.00 per hour increasing to $3.00 per hour forthe 2nd hourTwo-hour maximum parking durationMonday to Friday 9am to 5pmSaturday P120 (no charge)Sunday and public holidays unrestricted$1.50 per hourTwo-hour maximum parking durationMonday to Friday 9am to 5pmSaturday P120 (no charge)Sunday and public holidays unrestricted$1.50 per hourFour-hour maximum parking durationMonday to Friday 9am to 5pmSaturday, Sunday and public holidays unrestricted$1.00 per hour$6.00 maximum daily chargeNo daily maximum parking durationMonday to Friday 9am to 5pmSaturday, Sunday and public holidays unrestricted$0.70 cents per hour$4.00 maximum daily chargeA monthly pass is available at $62.00 per month(reduced to $46.00 for December and January)No daily maximum parking durationMonday to Friday 9am to 5pmSaturday, Sunday and public holidays unrestrictedOther Charges<strong>Council</strong> Pay & Display machines support alternative payments from mobile telephone, textor credit cards. A $0.50 cent per transaction fee applies.<strong>Council</strong> supports the use of SmartPark in-car meters. <strong>Hutt</strong> <strong>City</strong> <strong>Council</strong> SmartPark stored valuecards are available at <strong>Council</strong> reception. A $5.00 application fee applies. $50.00 and $100.00denominations are available.Reserved spaces - $15.00 per day for short-term applications.Construction and Temporary Traffic Management exemptions are site specific. Charges areassessed on a case-by-case basis.Parking Zones<strong>Council</strong> has adopted the following zone structure. Small changes may be required from timeto time as the CBD continues to develop.Red Premium HC1 Zone• High Street – Laings Road to Waterloo Road portion• Queens Drive – Laings Road to Waterloo Road portion• Laings Road – High Street to Queens Drive portion• Bunny Street• Margaret Street• Waterloo Road - Queens Drive to High Street portionGreen Shopper HC2 Zone• Stevens Grove parallel parks• Knights Road – Bunny Street to Laings Road portion• Queens Drive – Laings Road to Fraser Street portion• Fraser Street• High Street – Fraser Street to Laings Road portion• Ward Street• Market Grove north side• Knights Road south side – Bloomfield Terrace to Myrtle Street• Myrtle Street east side angle parking – Knights Road to Laings Road portion• Andrews Avenue• Dudley Street• Daly Street – Margaret Street to Andrews Avenue• Rutherford Street, south end• High Street – Waterloo Road to Downer Street• Cornwall Street – Pretoria Street to Kings Crescent• Cornwall Street west side – Waterloo Road to Kings Crescent• Pretoria Street, west end within CBD
HUTT CITY LONG TERM PLAN <strong>2012</strong>-2022191• Raroa Road – east of Cornwall Street• Kings Crescent - Cornwall Street to Queens Drive• Osborne Place• Queens Drive – Kings Crescent to Waterloo Road• Waterloo Road – Bloomfield Terrace to Queens Drive• Bloomfield Terrace – Kings Crescent to Knights Road• Pavilion car park (four-hour maximum parking duration)• Dowse car park• Laings Road – Queens Drive to Myrtle StreetYellow Commuter HC3 Zone• Fountain car park (Laings Road)• Myrtle Street west side – Laings Road to Knights Road• Stevens Grove angle parking portion• Rutherford Street, south of Queens Drive• Raroa Road – High Street to Cornwall Street• Cornwall Street east side – Kings Crescent to Waterloo Road• Cornwall Street – Waterloo Road to Knights Road• Knights Road – Cornwall Street to Bloomfield Terrace• Knights Road north side – Myrtle Street to Bloomfield Terrace• Market Grove south sideYellow Riverbank HC4 Zone• Riverbank car park• Myrtle Street – west side only, Laings Road to Huia StreetResidents’ Parking Schemes<strong>Council</strong> does not currently support any Residents’ Parking Scheme.Penalties<strong>Council</strong> sets the penalties in accordance with the maximum permitted in the TransportAct 1962.Metered ParkingFailure to display a valid Pay & Display ticket $40.00Overstaying, where the excess time is:Less than 30 minutes $12.00More than 30 minutes $15.00More than one hour $21.00More than two hours $30.00More than four hours $42.00More than six hours $57.00Parking on a Mobility car park, without displaying a valid Mobility Pass card $150.00RECYCLING<strong>2012</strong>/2013Replacement recycling containers $10.00ROADINGSubdivision Inspection and Approval Charges<strong>2012</strong>/2013Boundary adjustment $132.30Additional lots/unit titles - 3.43% of total construction cost for one new lot$132.30reducing by 0.07% for each additional lot to 0.7% for 40 or more additionallots. This is the minimum fee irrespective of whether any construction work isnecessary.<strong>2012</strong>/2013MOTOR CROSSING CHARGESSTANDARD FEE ADMIN/ INSPECTIONConcrete dished crossing per square metre $130.00 $72.00Extensions to existing concrete crossings per square metre $130.00 $72.00Installation of concrete dished crossing in conjunction with road$65.00 $72.00reconstruction work per square metreConcrete block crossing/pipe crossing/‘slot’ type crossing$130.00 $72.00per square metreDeposit for privately installed crossing$272.00($200.00 refunded upon satisfactory completion ofcrossing)
192 HUTT CITY LONG TERM PLAN <strong>2012</strong>-2022Road Corridor Management - Cost RecoveryPROPOSALS, ADMINISTRATION AND MONITORING ON TIME BASIS: <strong>2012</strong>/2013Engineer (per hour) $118.00Inspector (per hour) $102.00SPORTSFIELDS AND PARKSSeason ChargesSet to recover the percentage of operating cost identified below plus the full operating cost ofancillary services:RECOVERY RATESPERCENTAGE LEVEL 1 LEVEL 2 LEVEL 3 CHILDREN TRAINING/WINTERSports 30 20 10 5 5Cricket/Croquet 25 15 10 5 N/AOne-off or Single Day HireCharged at 10% of the season charge per game or where the game lasts three hours orlonger, 15% of the season charge per day.SPECIAL CHARGES <strong>2012</strong>/2013Events and commercial operatorsBy quotationPicnic bookings (30 or more people) $50.00Filming per hour $150.00Marquees for picnics/promotions - small $100.00- up to 50m 2 $200.00- up to 100m 2 $400.00- larger $600.00Weddings $100.00Hire of rooms, social facilities, training fields etc.By quotationNo. 1 field at <strong>Hutt</strong> Recreation Ground $650.00Note: Bookings for the season will take priority over casual bookings. A bond may be payable in certain circumstances.STADIAWALTER NASH STADIUM <strong>2012</strong>/2013One court (per hour) $75.00Two courts (per hour) $127.00Function room (per hour) $23.00Note: These are maximum charges.These charges include:• All permanent seating• Set-up of courts (ie hoops)• Clocks/Scoreboards• Changing rooms and showersSTORMWATERStormwater connection fee (see Environmental Consentsintroductory text on page 182)SWIMMING POOLS2011/<strong>2012</strong> <strong>2012</strong>/2013$31.00 $36.00<strong>2012</strong>/2013Casual RatesAdult $4.50Child $3.00Over 65s $3.00Spectator (non-supervising adult) $1.50Family pass (two adults/four children) $12.50Concession RatesAdult 10 swim $39.50Adult 30 swim $96.60Child 10 swim $26.10Child 30 swim $64.50Over 65s 10 swim $26.10Over 65s 30 swim $64.50Pool HireRegular hire (25 metres per hour) $60.00Casual hire (25 metres per hour) $87.00Regular hire (50 metres per hour) – Naenae and Wainuiomata Pools $125.00Casual hire (50 metres per hour) – Naenae and Wainuiomata Pools $184.00Lane charge (25 metres per hour) $18.00School GroupsGroup hire for lessons (per head) $1.00Meeting RoomsCasual hire (per hour) $20.00
HUTT CITY LONG TERM PLAN <strong>2012</strong>-2022193WASTEWATERWastewater connection fee (see Environmental Consentsintroductory text on page 182)2011/<strong>2012</strong> <strong>2012</strong>/2013$31.00 $36.00<strong>2012</strong>/2013CONSENT + $240 IFCONDITIONAL CONSENTTRADE WASTE CLASSCONSENT FEESREQUIREDClass 1: High Risk $1,640.00 $1,880.00Class 2: Moderate Risk $825.00 $1,065.00Class 3: Low Risk $420.00 $660.00Class 4: Minimal Risk $170.00 $410.00Class 5: Minimal Risk Low Flow $85.00 N/AApplication fee $85.00Re-inspection fee $85.00Late payment additional fee $85.00Trade Waste User ChargesWATER2011/<strong>2012</strong> <strong>2012</strong>/2013Upper Belmont Development Levy (per lot) $6,363.00Water connection fee (see Environmental Consents$82.00 $89.00introductory text on page 182)Fee for use of water by builders on unmetered industrial$70.00and commercial sitesCharge for ordinary supply Class 2 WaterMinimum chargeUniform AnnualChargeDomestic water meter rental $65.00Normal users per cubic metreUp to 100,000 cubic metres $1.66In excess of 100,000 cubic metres $1.19Water supplied by hydrantPer cubic metre $1.66Minimum charge $29.00Back flow prevention – annual inspection charge $160.00Flow (per cubic metre)Total suspended solidsCOD (chemical oxygen demand)<strong>2012</strong>/2013$0.453 per cubic metre$0.749 per kilogram$0.288 per kilogram
HUTT CITY LONG TERM PLAN <strong>2012</strong>-2022195DEFINITIONSThese definitions are intended to define terms used in this <strong>Long</strong> <strong>Term</strong> <strong>Plan</strong> in plain English. For legaldefinitions see the Local Government Act 2002.Annual <strong>Plan</strong>A plan that describes the activities of the local authority, with a particular focus on the financial yearfor which the document is produced.Appropriation/AppropriatedMoney that has been set aside from, or brought into, an operating or revenue account.AssetSomething of value that <strong>Council</strong> owns on behalf of the people of <strong>Hutt</strong> <strong>City</strong>, such as roads, drains,parks and buildings.Asset Management <strong>Plan</strong>A long term plan for managing an asset to ensure that its capacity to provide a service is kept up andcosts over the life of the asset are kept to a minimum.Capital ExpenditureExpenditure that will increase the value of <strong>Council</strong>’s assets.Capital ValueValue of land including any improvements.Community BoardsLocal elected bodies set up under the Local Government Act. Community boards are consulted by<strong>Council</strong> and can represent community concerns to <strong>Council</strong>. <strong>Hutt</strong> <strong>City</strong> <strong>Council</strong> has three communityboards: Eastbourne, Petone and Wainuiomata.Community CommitteesLocal committees set up by <strong>Council</strong>. Community committees are consulted by <strong>Council</strong> and canrepresent community concerns to <strong>Council</strong>. Following the October 2010 election <strong>Council</strong> establishedfour community committees covering the Central, Western, Northern and Eastern wards.Community OutcomeAn outcome or goal for the community that is identified as a priority.<strong>Council</strong>-Controlled Organisations (CCOs)Companies in which <strong>Council</strong> is at least 50% shareholder that independently manage facilitiesand deliver services and undertake developments on behalf of the <strong>Hutt</strong> <strong>City</strong> community. Wherenecessary, <strong>Council</strong> funds these organisations.<strong>Council</strong>-Controlled Trading Organisations (CCTOs)CCOs that operate a trading undertaking for the purpose of making a profit.Employee CostsExpenditure on staff. This includes wages, salaries and related taxes, training and recruitment costs.Financial Year<strong>Council</strong>’s financial year runs from 1 July to 30 June of the following year.Forecast Financial StatementThis is a 10-year plan for <strong>Council</strong>’s revenue and expenditure, cash flows and borrowing programme.Land ValueValue of land, excluding any improvements.Local Government Act 2002The key legislation that defines the powers and responsibilities of local authorities like <strong>Hutt</strong> <strong>City</strong><strong>Council</strong>.<strong>Long</strong> <strong>Term</strong> <strong>Plan</strong> (LTP)A plan that describes the activities of the local authority, the community outcomes and long termfocus for the decisions and activities of the local authority.Maintenance CostsExpenditure in relation to repairs and maintenance of <strong>Council</strong>’s assets.Mana WhenuaPeople with the mana of the land.Operating ExpenditureExpenditure for the normal services of <strong>Council</strong>.Operating ProjectsSignificant projects that do not result in the creation of <strong>Council</strong> assets.Performance MeasureA measure that shows how well <strong>Council</strong> is doing in achieving the goals it has set for itself.Port Nicholson Block Settlement TrustA Trust established in August 2008 to receive and manage the settlement package for TaranakiWhanui ki Te Upoko o Te Ika who can whakapapa to Wellington at 1840.
196 HUTT CITY LONG TERM PLAN <strong>2012</strong>-2022RatesFunds collected by <strong>Council</strong> from levies on property. These are based on the capital value of theproperty but the term is often used to also include Targeted Rates.SignificanceDegree of importance of the issue, proposal, decision or matter as assessed by the local authorityin terms of its likely consequences for the current and future social, economic, environmental orcultural wellbeing of the community.Significant ActivitiesThe <strong>Long</strong> <strong>Term</strong> <strong>Plan</strong> and Annual <strong>Plan</strong> list 17 separate significant activities that fall within five groupsof activities.Supplier CostsExpenditure for the purchase of general goods and services.Support CostsThe internal allocation of expenditure incorporated in the Managing Services activity.TaongaA highly prized resource.Targeted RatesAny rate levied other than the general rate, which is targeted at users of a service such as watersupply, wastewater and the Jackson Street Programme.Te AtiawaLocal tangata whenua with inherited land ownership and kinship to Northern Taranaki Te Atiawa.Te Runanganui o Taranaki Whanui ki te Upoko o te Ika a MauiA representative Maori <strong>Council</strong> made up from local tangata whenua and representing the eightTaranaki tribes within the Wellington region.User ChargesIncome to <strong>Council</strong> through fees paid by those who use specific services provided by <strong>Council</strong>.Wellington Tenths TrustLocal tangata whenua with inherited land ownership in Wellington and <strong>Hutt</strong> Valley and kinship toNorthern Taranaki Te Atiawa.
198 HUTT CITY LONG TERM PLAN <strong>2012</strong>-2022CONTACT DETAILS<strong>Hutt</strong> <strong>City</strong> <strong>Council</strong>Address: Administration Building30 Laings RoadLower <strong>Hutt</strong>Postal Address: Private Bag 31 912Lower <strong>Hutt</strong> 5010Telephone: 570 66660800 HUTT CITYAfter HoursEmergencies: 570 6666Facsimile: 569 4290Email: contact@huttcity.govt.nzWebsite: www.huttcity.govt.nzWar Memorial LibraryAddress: Cnr Queens Drive & Woburn RoadLower <strong>Hutt</strong>Telephone: 570 6633Eastbourne Community LibraryAddress:Rimu StreetEastbourneMoera Community LibraryAddress: Cnr Randwick Road & Randwick CrescentMoeraTelephone: 568 4720Naenae Community LibraryAddress: Hillary CourtNaenaeTelephone: 567 2859Petone Community LibraryAddress: Britannia StreetPetoneTelephone: 568 6253Stokes Valley Community LibraryAddress: Scott CourtStokes ValleyTelephone: 562 9050Taita Community LibraryAddress: Taine StreetTaitaTelephone: 567 2767Wainuiomata Community LibraryAddress: Queen StreetWainuiomataTelephone: 564 5822
HUTT CITY LONG TERM PLAN <strong>2012</strong>-2022199MAYOR AND COUNCILLORSRay Wallace, JPMayorT: 570 6846E: ray.wallace@huttcity.govt.nzCENTRAL WARD COUNCILLORSDavid Bassett, JPT: 566 4929M: 021 135 9391E: david.bassett@huttcity.govt.nzChris MilneT: 586 3890M: 027 442 2708E: chris.milne@huttcity.govt.nzDavid Bassett, JPDeputy MayorT: 566 4929M: 021 135 9391E: david.bassett@huttcity.govt.nzEASTERN WARD COUNCILLORSLisa BridsonT: 569 4690M: 021 879 468E: lisa.bridson@huttcity.govt.nzRoger StylesT: 934 3270M: 027 480 0072E: roger.styles@huttcity.govt.nzHARBOUR WARD COUNCILLORSRoss Jamieson, JPT: 562 7231M: 027 442 7319E: ross.jamieson@huttcity.govt.nzMichael LulichT: 977 3166M: 021 030 4561E: michael.lulich@huttcity.govt.nz
200 HUTT CITY LONG TERM PLAN <strong>2012</strong>-2022NORTHERN WARD COUNCILLORSAngus Finlayson, QSM, JPT: 566 5046M: 027 445 3035E: angus.finlayson@huttcity.govt.nzGwen McDonaldT: 563 7212M: 027 454 0546E: gwen.mcdonald@huttcity.govt.nzWAINUIOMATA WARD COUNCILLORSKen LabanT: 971 8982M: 029 200 0044E: ken.laban@huttcity.govt.nzMargaret WillardT: 973 1378M: 027 363 2967E: margaret.willard@huttcity.govt.nzWESTERN WARD COUNCILLORSMargaret Cousins, JPT: 586 2135E: margaret.cousins@huttcity.govt.nzMax ShierlawT: 589 3669M: 027 260 6852E: max.shierlaw@huttcity.govt.nz
HUTT CITY LONG TERM PLAN <strong>2012</strong>-2022201COMMUNITY BOARD MEMBERSEASTBOURNE COMMUNITY BOARDTELEPHONE MOBILE EMAILDerek Wilshere CHAIR 562 7920 027 430 3596 derek.wilshere@huttcity.govt.nzVirginia Horrocks562 8381 021 230 8210 virginia.horrocks@huttcity.govt.nzDEPUTY CHAIRRobert Ashe 562 0293 027 499 0409 robert.ashe@huttcity.govt.nzSarah Crawford - - sarah.crawford@huttcity.govt.nzMurray Gibbons 562 8567 021 236 1099 murray.gibbons@huttcity.govt.nzPETONE COMMUNITY BOARDGerald Davidson CHAIR 938 3723 - gerald.davidson@huttcity.govt.nzMason Branch DEPUTY CHAIR 569 1270 027 480 0365 mason.branch@huttcity.govt.nzRichard Cole 586 1113 - richard.cole@huttcity.govt.nzMike Fisher 976 7322 021 252 1773 mike.fisher@huttcity.govt.nzPeter Foaese 586 2945 0274 610 376 peter.foaese@huttcity.govt.nzTui Lewis 970 5159 021 271 6249 tui.lewis@huttcity.govt.nzWAINUIOMATA COMMUNITY BOARDTerry Stallworth CHAIR - 0272 749 511 terry.stallworth@huttcity.govt.nzKarl Dickson DEPUTY CHAIR 564 9001 0274 341 682 karl.dickson@huttcity.govt.nzCampbell Barry 564 5590 0272 160 364 campbell.barry@huttcity.govt.nzDavid Elliott 973 2239 021 284 1494 david.elliott@huttcity.govt.nzHeather Robb 564 8577 - heather.robb@huttcity.govt.nzSamantha Scott 564 4196 - samantha.scott@huttcity.govt.nzCOMMUNITY COMMITTEE MEMBERSTELEPHONE MOBILE EMAILCENTRAL COMMUNITY COMMITTEESue Lafrentz CHAIR 567 0856 021 058 1088 sue.lafrentz@huttcity.govt.nzAlison McKone DEPUTY CHAIR 973 0977 027 693 4028 alison.mckone@huttcity.govt.nzGlenda Barratt 976 8500 021 128 9377 glenda.barratt@huttcity.govt.nzMatt Renata 938 0300 027 323 4683 matt.renata@huttcity.govt.nzEASTERN COMMUNITY COMMITTEETed Heslin CHAIR 567 7753 - ted.heslin@huttcity.govt.nzMichael Ellis DEPUTY CHAIR 577 3877 - michael.ellis@huttcity.govt.nzBarbara Branch 565 3303 027 485 9101 barbara.branch@huttcity.govt.nzEphraim Gazo 970 4473 021 053 5628 ephraim.gazo@huttcity.govt.nzNORTHERN COMMUNITY COMMITTEELeigh Sutton CHAIR 563 5184 027 306 8362 leigh.sutton@huttcity.govt.nzDina Awarau DEPUTY CHAIR 567 6414 027 224 5824 dina.awarau@huttcity.govt.nzFred Allen 934 0559 027 222 2100 fred.allen@huttcity.govt.nzLeole Malama 567 5073 027 368 6587 leole.malama@huttcity.govt.nzWestern Community CommitteeRick Mooney CHAIR 586 1895 021 742 596 rick.mooney@huttcity.govt.nzPete Matcham DEPUTY CHAIR 565 1083 021 525 849 pete.matcham@huttcity.govt.nzJill Berridge, JP 566 8781 021 488 682 jill.berridge@huttcity.govt.nzLinda Brewer 565 0248 021 246 8334 linda.brewer@huttcity.govt.nzSTRATEGIC LEADERSHIP TEAMPOSITION TELEPHONE EMAILTony Stallinger Chief Executive 570 6773 tony.stallinger@huttcity.govt.nzJoycelyn Foo General Manager Governance &570 6736 joycelyn.foo@huttcity.govt.nzRegulatoryMatt Reid General Manager Community Services 570 6878 matt.reid@huttcity.govt.nzKim Kelly General Manager Strategic Services 570 6949 kim.kelly@huttcity.govt.nzBruce Sherlock General Manager <strong>City</strong> Infrastructure 570 6833 bruce.sherlock@huttcity.govt.nz
202 HUTT CITY LONG TERM PLAN <strong>2012</strong>-2022INDEPENDENT AUDITOR’S REPORTTo the readers of <strong>Hutt</strong> <strong>City</strong> <strong>Council</strong>’s <strong>Long</strong> <strong>Term</strong> <strong>Plan</strong> for the ten years commencing1 July <strong>2012</strong>The Auditor-General is the auditor of <strong>Hutt</strong> <strong>City</strong> <strong>Council</strong> (the <strong>City</strong> <strong>Council</strong>). The Auditor Generalhas appointed me, John O’Connell, using the staff and resources of Audit New Zealand, toreport on the <strong>Long</strong> <strong>Term</strong> <strong>Plan</strong> (LTP) on her behalf. We have audited the <strong>Council</strong>’s LTP dated28 June <strong>2012</strong> for the ten years commencing 1 July <strong>2012</strong>.The Auditor-General is required by section 94(1) of the Local Government Act 2002 (the Act) toreport on:• the extent to which the LTP complies with the requirements of the Act; and• the quality of information and assumptions underlying the forecast information providedin the LTP.OPINIONOverall OpinionIn our opinion the <strong>Council</strong>’s LTP dated 28 June <strong>2012</strong> provides a reasonable basis for longterm integrated decision-making by the <strong>Council</strong> and for participation in decision-makingby the public and subsequent accountability to the community about the activities ofthe <strong>Council</strong>.In forming our overall opinion, we considered the specific matters outlined in section 94(1) ofthe Act which we report on as follows.Opinion on Specific Matters Required by the ActIn our view:• the <strong>Council</strong> has complied with the requirements of the Act in all material respectsdemonstrating good practice for a council of its size and scale within the context ofits environment; and• the underlying information and assumptions used to prepare the LTP provide areasonable and supportable basis for the preparation of the forecast information.Actual results are likely to be different from the forecast information since anticipated eventsfrequently do not occur as expected and the variation may be material. Accordingly, weexpress no opinion as to whether the forecasts will be achieved.Our report was completed on 28 June <strong>2012</strong>. This is the date at which our opinion is expressed.The basis of the opinion is explained below. In addition, we outline the responsibilities of the<strong>Council</strong> and the Auditor, and explain our independence.BASIS OF OPINIONWe carried out the audit in accordance with the International Standard on AssuranceEngagements (New Zealand) 3000: Assurance Engagements Other Than Audits or Reviewsof Historical Financial Information and the Auditor-General’s Auditing Standards, whichincorporate the International Standards on Auditing (New Zealand). We have examined theforecast financial information in accordance with the International Standard on AssuranceEngagements 3400: The Examination of Prospective Financial Information.Those standards require that we comply with ethical requirements and plan and carry outour audit to obtain all the information and explanations we considered necessary to obtainreasonable assurance that the LTP does not contain material misstatements. If we hadfound material misstatements that were not corrected, we would have referred to them inour opinion.An audit involves performing procedures to obtain audit evidence about the forecastinformation and disclosures in the LTP. The procedures selected depend on our judgement,including the assessment of risks of material misstatement of the information in the LTP.In making those risk assessments we consider internal control relevant to the preparation ofthe <strong>Council</strong>’s LTP. We consider internal control in order to design audit procedures that areappropriate in the circumstances, but not for the purpose of expressing an opinion on theeffectiveness of the <strong>Council</strong>’s internal control.Our audit procedures also include assessing whether:• the LTP provides the community with sufficient and balanced information about thestrategic and other key issues, choices and implications it faces and provides forparticipation by the public in decision-making processes;• the <strong>Council</strong>’s financial strategy, supported by financial policies is financially prudent, and hasbeen clearly communicated to the community in the LTP;• the presentation of the LTP complies with the legislative requirements of the Act;• the decision-making and consultation processes underlying the development of the LTP arecompliant with the decision-making and consultation requirements of the Act;• the information in the LTP is based on materially complete and reliable asset oractivity information;• the agreed levels of service are fairly reflected throughout the LTP;
HUTT CITY LONG TERM PLAN <strong>2012</strong>-2022203• the <strong>Council</strong> ’s key plans and policies have been consistently applied in the development ofthe forecast information;• the assumptions set out within the LTP are based on best information currently availableto the <strong>Council</strong> and provide a reasonable and supportable basis for the preparation of theforecast information;• the forecast information has been properly prepared on the basis of the underlyinginformation and the assumptions adopted and the financial information complies withgenerally accepted accounting practice in New Zealand;• the rationale for the activities is clearly presented;• the levels of service and performance measures are reasonable estimates and reflect thekey aspects of the <strong>Council</strong>’s service delivery and performance; and• the relationship of the levels of service, performance measures and forecast financialinformation has been adequately explained within the LTP.We do not guarantee complete accuracy of the information in the LTP. Our proceduresincluded examining on a test basis, evidence supporting assumptions, amounts and otherdisclosures in the LTP and determining compliance with the requirements of the Act. Weevaluated the overall adequacy of the presentation of information. We obtained all theinformation and explanations we required to support our opinion above.INDEPENDENCEWhen reporting on the LTP we followed the independence requirements of the Auditor-General, which incorporate the independence requirements of the External Reporting Board.Other than this report and in conducting the audit of the LTP Statement of Proposal and theannual audit, we have no relationship with or interests in the <strong>Council</strong> or any of its subsidiaries.John O’ConnellAudit New ZealandOn behalf of the Auditor-GeneralWellington, New ZealandRESPONSIBILITIES OF THE COUNCILThe <strong>Council</strong> is responsible for preparing an LTP under the Act, by applying the <strong>Council</strong>’sassumptions and presenting the financial information in accordance with generally acceptedaccounting practice in New Zealand. The <strong>Council</strong> is also responsible for such internal controlas it determines is necessary to enable the preparation of an LTP that is free from materialmisstatement.The <strong>Council</strong>’s responsibilities arise from section 93 of the Act.RESPONSIBILITIES OF THE AUDITORWe are responsible for expressing an independent opinion on the LTP and reporting thatopinion to you based on our audit. This responsibility arises from section 15 of the Public AuditAct 2001 and section 94(1) of the Act.It is not our responsibility to express an opinion on the merits of any policy content withinthe LTP.