Special Reports: (a) Cairn India: Upgrade to Buy, (b ... - Motilal Oswal
Special Reports: (a) Cairn India: Upgrade to Buy, (b ... - Motilal Oswal
Special Reports: (a) Cairn India: Upgrade to Buy, (b ... - Motilal Oswal
- No tags were found...

Create successful ePaper yourself
Turn your PDF publications into a flip-book with our unique Google optimized e-Paper software.
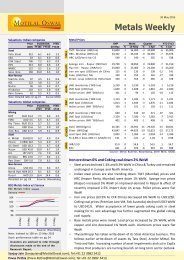
<strong>Special</strong> <strong>Reports</strong>: (a) <strong>Cairn</strong> <strong>India</strong>: <strong>Upgrade</strong> <strong>to</strong> <strong>Buy</strong>, (b) Sec<strong>to</strong>r Update:Landmark reforms… …Oil PSUs <strong>to</strong> benefit, (c) 4QFY13 resultspreview and (d) update on under-recovery. High supply, low demand weakens crude: Brent prices slide <strong>to</strong>USD109/bbl (-6% MoM) in Mar-13, mainly due <strong>to</strong> highersupply from non-Opec countries and weak demand. Reuters Singapore GRM down 17% MoM <strong>to</strong> USD8.7/bbl:Restart of large refining capacity post maintenance shutdowns,increased product supply, resulting in lower cracks, particularlyfor au<strong>to</strong> fuels. Medium term outlook subdued, with annualcapacity adds of >1mmbbl/d v/s demand at ~0.8mmbbl/d. Domestic price premium expands in Petchem: Domestic pricepremium enhanced MoM due <strong>to</strong> reduction in internationalprices led by weaker Chinese demand. S<strong>to</strong>ck performance: Expect ONGC and OINL <strong>to</strong> continue <strong>to</strong> rallyon the back of diesel reforms and expected natural gas pricehike. <strong>Upgrade</strong> <strong>Cairn</strong> <strong>to</strong> <strong>Buy</strong> on: a) expect reserve addition withexploration recommencement, b) currently fac<strong>to</strong>r long termBrent of USD75/bbl, c) ramp-up largely on track and d) withlarge cash balance, expect higher dividend/share buyback. Valuation and view:• On the back of ongoing reforms, we continue our positivestance on ONGC and OINL. BPCL is the <strong>to</strong>p pick in OMCs forits E&P upside potential.• RIL's new refining/petchem projects likely <strong>to</strong> add <strong>to</strong> earningsfrom end-FY15E/FY16E, but medium term outlook on corebusiness remains weak, with RoE reaching sub-13%, Neutral.• Neutral on GAIL/GSPL due <strong>to</strong> headwinds on incremental gas.• <strong>Buy</strong> on PLNG as domestic gas scarcity augurs well.Harshad Borawake (HarshadBorawake@<strong>Motilal</strong><strong>Oswal</strong>.com ); +91 22 3982 5432Kunal Gupta (Kunal.Gupta@<strong>Motilal</strong><strong>Oswal</strong>.com ) ; +91 22 3982 54451US crude inven<strong>to</strong>ry highest since 1990400350300250Reuters Singapore GRM (USD/bbl)12840In mmbblMar-89 Mar-95 Mar-01 Mar-07 Mar-13Mar-10 Mar-11 Mar-12 Mar-131-M Relative S<strong>to</strong>ck PerformanceCAIRNONGCOINLHPCLBPCLIOC(7)(9)MRPL(12)CPCLGAILGSPLPLNGValuation: Coverage universeReco M Cap P/E (x) P/B (x) EV/EBITDA (x)USD b FY13E FY14E FY15E FY13E FY14E FY15E FY13E FY14E FY15EIntegrated/UpstreamRIL* Neutral 46.1 10.9 10.5 9.9 1.3 1.1 1.0 8.2 8.2 7.8ONGC <strong>Buy</strong> 48.8 10.5 8.5 5.9 1.7 1.6 1.3 4.4 3.4 2.4CAIRN <strong>Buy</strong> 10.2 4.4 5.3 5.8 1.2 1.0 0.9 3.1 2.8 2.7OINL <strong>Buy</strong> 5.7 9.1 7.1 5.2 1.6 1.4 1.2 5.1 3.4 2.2OMCsIOC <strong>Buy</strong> 12.9 12.6 10.0 7.6 1.1 1.0 0.9 12.2 8.2 6.4BPCL <strong>Buy</strong> 5.0 9.6 11.5 10.1 1.5 1.4 1.3 8.1 7.2 6.4HPCL <strong>Buy</strong> 1.8 21.2 10.7 8.8 0.7 0.7 0.6 49.2 10.4 8.5Independent RefinersMRPL Neutral 1.6 NA 6.4 5.8 1.2 1.1 0.9 10.8 4.5 3.8CPCL <strong>Buy</strong> 0.3 NA 4.3 4.3 0.6 0.6 0.5 NA 4.9 4.8Gas CompaniesGAIL** Neutral 7.3 9.5 9.3 9.6 1.6 1.4 1.3 3.9 3.8 3.8GSPL Neutral 0.7 8.0 7.8 7.5 1.4 1.2 1.0 4.6 4.1 4.0PLNG <strong>Buy</strong> 1.9 8.9 10.4 9.2 2.4 2.0 1.7 6.8 6.6 5.8IGL UR 0.7 10.8 9.4 8.4 2.7 2.3 1.9 5.6 4.7 4.0*No. of shares adj. for treasury shares; **P/E adj. for investmentsIntg/UpstreamOMC'sGas/CGD RefinersRILIGL(6)(6)(3)(5)(5)(1)April 20131119
Index<strong>Special</strong> ReportCompany Update: <strong>Cairn</strong> <strong>India</strong>….......................…………………………………………………………………………………………………3Sec<strong>to</strong>r Update on Oil PSUs………………………………………................……………………………………………………………………….44QFY13 Results Preview…..............................…………………………………………………………………………………………………..5Update on under recoveries – MTM diesel loss at INR6.5/ltr……………………………………………………………………….…6Oil market trends…………………………………………………………………………………….…………………………………………………………………7US weekly petroleum data………………………………………………………………………………….……………………….…………………………….8GRM and product spreads ……………………………………………………..………………………………………………………………………..……….9Petchem margin trend………………………………….…………..……………………………………………………………………………………………..11Refinery throughput and domestic consumption……………………………………………….…………………………………………………..14Update on under-recoveries and domestic fuel pricing…………………………………………………………………………………………..15Industry News…………………………………………………………………..……………………………………………………………………………………..17O&G s<strong>to</strong>ck performances during the month…………………..……………………………………………………………………………………….20Valuation comparison <strong>to</strong> Global peers…………………..………………………………………………………………………………………………..21(Please click on the link <strong>to</strong> go <strong>to</strong> the respective page)2 April 2013
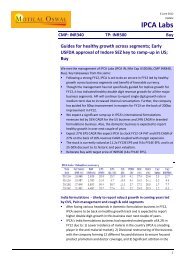
SPECIAL REPORT<strong>India</strong> Energy: Landmark reforms … Oil PSUs <strong>to</strong> benefitUnder-recovery likely <strong>to</strong> halve in 2years: Diesel reforms (INR0.45/ltr price hike per month) <strong>to</strong> cut under-recovery by 50% <strong>to</strong> INR864bin FY15E v/s INR1.6t in FY13E. Upstream subsidy sharing in FY11 and FY12 s<strong>to</strong>od at 39% and 40% and in 9MFY13 at ~36%. To beconservative, we are compelled <strong>to</strong> increase the upstream sharing in future years, but as there is no scientific method <strong>to</strong> predict futuresharing, we maintain the upstream sharing at 40% even for future years.Expect reform benefits <strong>to</strong> incentivize; Government <strong>to</strong> pursue the announced reforms: Diesel reforms will not only better oil PSUsfinancials, but benefit the government through: 1) increased revenues (taxes/dividend), 2) lower expenditure (subsidies) and 3)higher valuations for its stake in PSUs (positive for divestments – IOC’s OFS likely in FY14).Upstream companies better placed: In the first leg of reforms, we believe upstream companies, ONGC and Oil <strong>India</strong>, are best playswith likely earnings CAGR of ~35% in FY13E-15E. However, earnings benefit <strong>to</strong> OMCs will be limited only <strong>to</strong> the extent of interest costreduction as they already share nil under-recovery. Maintain Neutral on GAIL due <strong>to</strong> headwinds for incremental gas, which couldresult in network under-utilization/lower return ratios and likely profitability impact on LPG/petchem due <strong>to</strong> the expected gas pricehike. Among OMCs, BPCL is our <strong>to</strong>p pick due <strong>to</strong> its E&P upside potentialLikely gas price hike, another trigger for upstream: Rangarajan Committee’s formula on domestic gas pricing implies a likely gas priceof USD8/mmbtu v/s USD4.2/mmbtu now. And a likely APM gas price increase ahead of RIL’s scheduled KG-D6 price revision in March-14 will be another trigger for ONGC and Oil <strong>India</strong> (we model USD7/mmbtu from FY15E).Refer our report datedMarch 14, 2013Expect au<strong>to</strong> fuel deregulation <strong>to</strong> improve OMCs’ marketing business profitability: In a deregulatedscenario, while OMCs will lose some market share <strong>to</strong> private retailers (RIL, Shell, Essar Oil), they arelikely <strong>to</strong> benefit more from a likely increase in retail marketing margins from the current cap ofINR1.2/litre <strong>to</strong> at least INR2/litre. In FY04 (small period of deregulation), OMCs au<strong>to</strong> fuel marketingmargin was at ~INR2.5/litre, that <strong>to</strong>o when the pump prices of au<strong>to</strong> fuels were at ~INR35/litre Valuation and view: Prefer ONGC, OIL, BPCL: On the back of ongoing reforms, we continue ourpositive stance on upstream (ONGC/OIL) and OMCs. BPCL is our <strong>to</strong>p pick among OMCs for its E&Pupside potential. RIL's new projects are likely <strong>to</strong> add <strong>to</strong> earnings only from FY15/FY16, and mediumterm core business outlook remains weak. Maintain Neutral on GAIL and GSPL due <strong>to</strong> headwinds forincremental gas in the medium term. However, domestic gas scarcity augurs well for Petronet LNG.4April 2013
SPECIAL REPORT4QFY13 Results PreviewGRM up 36% QoQ, Brent increases QoQ: Brent average crude price for 4QFY13 was higher QoQ at USD113/bbl (averaged~USD110/bbl for 9MFY13), mainly due <strong>to</strong> supply cuts by Opec (~1 mmbbl/d) and returning positive sentiments on the demandfront. Reuters Singapore GRM jumped 36% QoQ <strong>to</strong> an average USD8.8/bbl in 4QFY13 v/s USD6.5/bbl in 3QFY13. This was primarilydriven by higher au<strong>to</strong> fuel cracks and maintenance shutdowns in the US. Petchem spreads recover QoQ: In 4QFY13, polymer spreads over naphtha and integrated polyester spreads are up QoQ by 4-11%range. Similarly, YoY, PE spreads are up 29% and PP spreads 41%. Domestic price premium <strong>to</strong> polymer reduced during the quarterprobably due <strong>to</strong> higher imports.Diesel reforms and lower LPG losses lead <strong>to</strong> QoQ decline in under-recovery: Estimate 4QFY13E under-recovery at INR372b, down5% QoQ, primarily led by diesel reforms and lower LPG subsidies . Diesel reforms - a) market pricing for bulk consumers and b)monthly price hike of INR0.45/lt led <strong>to</strong> lower diesel under-recovery at INR186b during 4QFY13, v/s INR196b in 3QFY13. Recentcorrection in crude prices resulted in diesel under-recovery reaching INR8.2/lt (lowest in last 18 months). We model upstreamsharing at 40% and downstream sharing at nil for FY13E/FY14E/FY15E, with the balance being the government's share.5 April 2013
OIL: Brent down 6% MoM due <strong>to</strong> higher supplies Brent averaged USD109/bbl (-6%MoM) mainly due <strong>to</strong> higher supplies(all time high) from non-OPECcountries and weakening demand. Global product demand: Jan-13average at 91.9mmbbl/d was 3.6%higher than 3-yr avg of 89.4mmbbl/d OPEC spare capacity has averaged at~3.4mmbbl/d in the last 3 monthsYoY oil production and demand change (%)Oil Product Demand (mmbbl/d) YoY Change (%) - RHS948%894%840%79-4%Feb-05 Feb-07 Feb-09 Feb-11 Feb-13OPEC crude supply (mmbbl/d)Spare Capacity (RHS)OPEC SUPPLY338317295274252Feb-05 Feb-07 Feb-09 Feb-11 Feb-13Brent oil price trend (USD/bbl) Brent forward curve (USD/bbl) Brent oil price in USD/bbl and INR/bbl150Brent Spot Aug-04 Mar-06Brent (USD/bbl) Brent (INR/bbl) - RHSMar-10 Mar-11 Mar-131507,0001201601205,60090120904,20080602,8006040301,40000-30Mar-05 Mar-07 Mar-09 Mar-11 Mar-13Dec-01 Apr-05 Aug-08 Jan-12 May-15 Sep-18Mar-05 Mar-07 Mar-09 Mar-11 Mar-13Crude price differentials (USD/bbl) Brent-WTI spread (USD/bbl) <strong>India</strong>n basket price trend (USD/bbl)12Arab L-H WTI - Maya (RHS)24912603-120-24Mar-05 Mar-07 Mar-09 Mar-11 Mar-13Brent less WTI (USD/bbl) Oil <strong>to</strong> gas ratio (x) - RHS3070204510200-5-10-30Mar-05 Mar-07 Mar-09 Mar-11 Mar-137 April 2013
US Weekly Petroleum Data: Oil inven<strong>to</strong>ry highest since 1990 US crude inven<strong>to</strong>ry increased <strong>to</strong> 388.6mmbbl in the last week of Mar-13,highest since 1990, on back of weakdemand and resumption of refineriespost maintenance shutdowns. US refinery utilization averaged ~86%in the last week of March-13. Distillate inven<strong>to</strong>ries are ~21% belowthe last 5-year averageWeek ended Weekly variation Yearly variationVariation (%) from22-Mar-13 29-Mar-13 WoW WoW (%) 30-Mar-12 YoY (%) 1-Yr Avg 3-Yr Avg 5-Yr AvgInven<strong>to</strong>ry DataCrude Oil 385.9 388.6 2.7 0.7 362.4 7.2 4.1 8.3 11.8Gasoline 221.2 220.7 -0.6 -0.3 221.9 -0.6 4.3 2.0 3.1Distillates 115.3 113.0 -2.3 -2.0 135.9 -16.9 -7.8 -21.1 -20.9Products SuppliedTotal Products 18.9 19.0 0.1 0.5 18.2 4.3 1.1 0.1 -0.6Gasoline 8.4 8.5 0.1 1.5 8.8 -3.0 -1.7 -3.8 -4.7Distillates 4.2 3.9 -0.3 -8.1 3.6 7.9 5.7 3.6 2.8RefineryUtilization (%) 85.7 86.3 0.6 0.7 85.7 0.7 -1.8 -0.2 1.1ImportsCrude Imports 8.2 7.9 -0.2 -2.8 9.8 -18.9 -5.5 -9.9 -11.9Gasoline 0.5 0.6 0.1 17.8 0.9 -32.8 -5.3 -21.7 -29.8US crude oil inven<strong>to</strong>ry (mmbbl)US distillate inven<strong>to</strong>ry (mmbbl)US gasoline inven<strong>to</strong>ry (mmbbl)425390355320285250Range (2008-12) Range (2008-12) Average (2008-12)1 18 35 52Week18616213811490Range (2008-12) Range (2008-12) Average (2008-12)1 18 35 52WeekUS <strong>to</strong>tal product supplied (mmbbl/d) US refinery utilization (%) US crude imports (mmbbl)250230210190170Range (2008-12) Range (2008-12) Average (2008-12)1 18 35 52Week23Range (2008-12) Range (2008-12) Average (2008-12)94Range (2008-12) Range (2008-12) Average (2008-12)2220841974171 18 35 52Week641 18 35 52Week8April 2013
GRM: Down 17% MoM led by lower au<strong>to</strong> fuel cracks Reuters Singapore GRM was down17% MoM <strong>to</strong> USD8.7/bbl: This isprimarily driven by lower au<strong>to</strong> fuelcracks due <strong>to</strong> resumption of facilitiespost maintenance shutdowns in US. While, the medium term GRM outlookcontinues <strong>to</strong> remain subdued, weexpect GRM <strong>to</strong> be volatile (occasionalspurts) due <strong>to</strong> occasional bunching upof shutdownsReuters Singapore GRM (USD/bbl)129630Mar-05 Mar-06 Mar-07 Mar-08 Mar-09 Mar-10 Mar-11 Mar-12 Mar-13Gasoline spreads (USD/bbl) Diesel spreads (USD/bbl) LPG spreads (USD/bbl)271890-9Mar-05 Mar-07 Mar-09 Mar-11 Mar-13403020100Mar-05 Mar-07 Mar-09 Mar-11 Mar-13200-20-40-60Mar-05 Mar-07 Mar-09 Mar-11 Mar-13Naphtha spreads (USD/bbl) Jet/Kero spreads (USD/bbl) Fuel oil spreads (USD/bbl)20401010300020-10-10-20Mar-05 Mar-07 Mar-09 Mar-11 Mar-13100Mar-05 Mar-07 Mar-09 Mar-11 Mar-13-20-30Mar-05 Mar-07 Mar-09 Mar-11 Mar-139 April 2013
GRM: Over capacity + sluggish demand = range bound marginsSingapore GRM down MoM (USD/bbl)(USD/bbl) Mar-12 Feb-13 Mar-13 MoM (%) YoY (%) 4QFY12 3QFY13 4QFY13 QoQ (%) YoY (%) FY12 FY13 YoY (%) 1 Yr Avg 3 Yr Avg 5 Yr AvgSingapore GRM 5.7 10.5 8.7 -17.1 52.4 7.5 6.5 8.8 35.4 17.4 8.3 7.7 -7.3 7.8 7.1 6.1Oil, Product Prices and Cracks (USD/bbl)(USD/bbl) Mar-12 Feb-13 Mar-13 M-o-M (%) Y-o-Y (%) 4QFY12 3QFY13 4QFY13 Q-o-Q (%) Y-o-Y (%) FY12 FY13 Y-o-Y (%)Oil PricesWTI 106.2 95.3 92.9 -2.5 -12.5 102.9 88.1 94.3 7.0 -8.3 97.3 92.0 -5.4Brent 124.9 116.5 109.2 -6.2 -12.6 118.6 110.4 112.9 2.2 -4.8 114.5 110.5 -3.5Dubai 122.3 111.1 105.4 -5.1 -13.8 116.1 107.2 108.0 0.8 -6.9 110.0 106.9 -2.8<strong>India</strong>n Basket 123.4 113.1 106.8 -5.5 -13.4 117.2 108.3 109.8 1.3 -6.3 111.8 108.3 -3.1Product PricesLPG 90.2 78.2 69.4 -11.3 -23.1 87.3 83.2 75.2 -9.6 -13.9 75.3 74.3 -1.2Gasoline 134.4 129.9 120.8 -7.0 -10.1 127.9 117.7 123.6 5.0 -3.4 121.7 119.3 -2.0Diesel 136.1 132.9 123.7 -6.9 -9.1 132.6 125.1 127.8 2.1 -3.6 128.0 125.1 -2.2Jet/Kero 136.2 133.9 123.6 -7.7 -9.3 131.9 126.8 128.6 1.4 -2.5 128.4 126.1 -1.8Naphtha 117.6 109.2 100.4 -8.0 -14.7 111.7 102.7 104.7 1.9 -6.3 105.3 101.1 -3.9Fuel Oil 121.3 104.8 102.4 -2.3 -15.6 119.4 101.6 103.2 1.6 -13.6 111.2 104.4 -6.2Product Cracks (v/s Dubai)LPG -32.1 -32.9 -36.0 -9.5 -12.2 -28.8 -24.0 -32.9 -36.8 -14.1 -34.7 -32.6 6.1Gasoline 12.2 18.8 15.4 -17.9 26.9 11.8 10.5 15.5 48.3 31.8 11.7 12.4 5.6Diesel 13.9 21.8 18.3 -16.0 32.0 16.5 18.0 19.8 10.1 19.6 18.0 18.2 1.1Jet/Kero 13.9 22.8 18.2 -20.4 30.5 15.9 19.6 20.6 4.7 29.5 18.4 19.2 4.2Naphtha -4.6 -1.9 -5.0 -161.9 -8.3 -4.3 -4.5 -3.4 25.5 22.5 -4.7 -5.8 -23.6Fuel Oil -1.0 -6.3 -3.0 52.5 -213.2 3.4 -5.5 -4.8 13.5 nm 1.3 -2.5 nm10April 2013
Polymer Margins: International prices down on weak demand Domestic price premium MoM led byfall in international polymer/Naphthaprices. Fall in prices is probably due <strong>to</strong>weaker than expected Chinesedemand. Domestic polymer prices aremarginally (1-2%) up MoM Petchem margins seem <strong>to</strong> be inrecovery mode (PE/PP margins are up~12%MoM, PVC up 55% MoM).Key polymer price trends (INR/kg)10080PE PP PVC604020Mar-05 Mar-07 Mar-09 Mar-11 Mar-13Premium/discount <strong>to</strong> international prices (INR/kg)6040PE PP PVC200-20Mar-05 Mar-07 Mar-09 Mar-11 Mar-13PE spread over naphtha (INR/kg) PP spread over naphtha (INR/kg) PVC spread over naphtha (INR/kg)5244362820AprMin 2008-12 5 yr range FY13MayJunJulyAugSeptOctNovDecJanFebMar5244362820AprMin 2008-12 5 yr range FY13MayJunJulyAugSeptOctNovDecJanFebMar3020100-10AprMin 2008-12 5 yr range FY13MayJunJulyAugSeptOctNovDecJanFebMarPE spread overn naphtha (USD/mt) PP spread over naphtha (USD/mt) PVC spread over naphtha (USD/mt)Naphtha Ethylene Polyethylene2,0001,5001,0005000Mar-05 Mar-07 Mar-09 Mar-11 Mar-13Naphtha Propylene Polypropylene2,4001,8001,2006000Mar-05 Mar-07 Mar-09 Mar-11 Mar-13Naphtha Price Ethylene PVC1,8001,3509004500Mar-05 Mar-07 Mar-09 Mar-11 Mar-1311 April 2013
Polymer Margins: Domestic price premium improved MoMMar-12 Feb-13 Mar-13 MoM (%) YoY (%) 4QFY12 3QFY13 4QFY13 QoQ (%) YoY (%) FY12 FY13 YoY (%)Exch. Rate (INR/USD) 50.4 53.8 54.4 1.1 8.1 50.3 54.2 54.2 0.0 7.8 47.9 54.4 13.5Naphtha (USD/MT) 1,035 961 883 (8.0) (14.7) 983 903 921 1.9 (6.3) 927 890 (3.9)Naphtha (INR/kg) 55 54 51 (7.0) (7.8) 52 51 52 1.9 1.0 47 51 9.1International Prices (US$/MT)PE 1,421 1,497 1,473 (1.6) 3.6 1,351 1,357 1,472 8.5 8.9 1,382 1,371 (0.8)PP 1,452 1,533 1,491 (2.7) 2.7 1,382 1,413 1,502 6.3 8.6 1,481 1,429 (3.5)PVC 1,042 1,064 1,057 (0.6) 1.4 1,003 969 1,049 8.3 4.6 1,050 998 (5.0)Simple Spreads over Naphtha (USD/mt)PE 386 536 589 10.0 52.6 368 454 551 21.5 49.7 456 481 5.6PP 417 572 608 6.3 45.8 399 509 581 14.0 45.4 555 539 (2.8)PVC 7 103 174 68.5 2439.7 20 66 128 95.3 554.6 124 108 (13.0)Domestic Prices (INR/kg)PE 85.4 93.4 94.4 1.1 10.5 83.4 89.4 93.0 4.1 11.6 79.1 91.1 15.1PP 87.4 98.7 99.7 1.0 14.1 84.1 92.2 97.9 6.2 16.4 84.5 92.9 10.0PVC 56.5 64.0 65.5 2.3 15.9 56.2 62.0 63.5 2.4 13.1 56.9 62.5 9.7Simple Spreads over Naphtha (INR/kg)PE 30.6 39.0 43.8 12.3 43.4 31.4 37.9 40.6 7.0 29.1 32.5 40.2 23.7PP 32.6 44.4 49.2 10.8 50.8 32.1 40.7 45.4 11.5 41.3 37.9 42.1 11.2PVC 1.7 9.7 15.0 54.9 771.1 4.2 10.6 11.1 4.7 160.7 10.3 11.6 12.7Prem/(Disc) <strong>to</strong> International Prices (%)PE 13.5 10.3 12.0 16.7 (10.8) 16.9 15.7 11.0 (30.0) (34.8) 14.0 17.2 23.5PP 13.7 13.9 16.9 21.8 23.1 15.2 14.6 14.5 (0.8) (4.8) 13.8 14.3 3.9PVC 2.5 6.4 8.3 30.6 239.1 6.1 12.4 6.3 (49.1) 3.1 8.3 10.3 24.712April 2013
Polyester Margins: Improve on MoM basis(INR/kg) Mar-12 Feb-13 Mar-13 MoM (%) YoY (%) 4QFY12 3QFY13 4QFY13 QoQ (%) YoY (%) FY12 FY13 YoY (%)Polyester Intermediates PricesPTA 63.3 69.7 69.5 (0.3) 9.8 63.3 64.6 69.5 7.6 9.8 63.1 64.4 2.0MEG 57.5 68.9 67.6 (1.9) 17.6 60.3 64.3 68.3 6.1 13.3 60.2 61.4 2.0Polyester PricesPOY 92.4 97.5 97.5 0.0 5.5 91.7 94.0 97.3 3.6 6.1 91.8 94.1 2.4PSF 96.8 102.3 100.3 (2.0) 3.6 96.4 98.3 101.4 3.2 5.2 97.8 97.7 (0.2)Integrated Polyester SpreadsPOY 48.9 54.4 57.6 5.8 17.8 50.5 53.2 55.8 5.0 10.5 55.0 53.8 (2.2)PSF 53.2 59.2 60.4 1.9 13.5 55.2 57.5 59.9 4.3 8.6 61.0 57.4 (5.9)POY and PSF price trend (INR/kg)PTA and MEG price trend (INR/kg)PTA spread over naphtha (INR/kg)130POY PSF Cotlook A (cents/lbs) - RHS250110200901501007050500Mar-05 Mar-07 Mar-09 Mar-11 Mar-138065PTA MEG503520Mar-05 Mar-07 Mar-09 Mar-11 Mar-13463626166AprMin 2008-12 5 yr range FY13MayJunJulyAugSeptOctNovDecJanFebMarPOY spread over naphtha (INR/kg) PSF spread over naphtha (INR/kg) MEG spread over naphtha (INR/kg)68Min 2008-12 5 yr range FY1386Min 2008-12 5 yr range FY1360Min 2008-12 5 yr range FY1358704548543038381528220AprMayJunJulyAugSeptOctNovDecJanFebMarAprMayJunJulyAugSeptOctNovDecJanFebMarAprMayJunJulyAugSeptOctNovDecJanFebMar13April 2013
<strong>India</strong> Refinery throughput and domestic fuel consumptionRefinery throughput trendMonthly ComparisonQuarterly ComparisonAnnual ComparisonKBPD Feb-12 Jan-13 Feb-13 MoM (%) YoY (%) 4QFY12 3QFY13 4QFY13 QoQ (%) YoY (%) FY12 FY13 YoY (%)Total 3,525 3,631 3,699 1.9 4.9 3,477 3,548 3,665 3.3 5.4 3,354 3,437 2.5PSUsHPCL 322 343 354 3.2 9.9 321 337 349 3.3 8.6 326 307 (6.1)BPCL 496 471 477 1.4 (3.7) 476 444 474 6.9 (0.4) 452 462 2.1IOC 1,143 1,139 1,174 3.1 2.7 1,142 1,138 1,156 1.6 1.2 1,120 1,096 (2.1)MRPL 282 308 331 7.3 17.2 271 306 320 4.4 17.8 258 277 7.3CPCL 224 226 229 1.6 2.4 222 203 227 12.3 2.6 213 186 (12.5)PrivateRIL 674 673 667 (0.9) (1.0) 663 649 670 3.2 1.0 654 656 0.2ESSAR 328 417 414 (0.6) 26.4 327 411 416 1.0 27.2 272 393 44.7Total consumption (kbpd) Petrol consumption (kbpd) Diesel consumption (kbpd)3,2503,0002,7502,5002,250Total YoY (%)Feb-09 Feb-10 Feb-11 Feb-12 Feb-13Domestic fuel consumption statistics30%20%10%0%-10%400350300250200Petrol YoY (%)Feb-09 Feb-10 Feb-11 Feb-12 Feb-1330%20%10%0%-10%1,7001,5001,3001,100900700Diesel YoY (%)Feb-09 Feb-10 Feb-11 Feb-12 Feb-13Monthly ComparisonQuarterly ComparisonAnnual Comparisonkbpd Feb-12 Jan-13 Feb-13 MoM (%) YoY (%) 4QFY12 3QFY13 4QFY13 QoQ (%) YoY (%) FY12 FY13 YoY (%)Total 3,142 3,075 3,207 4.3 2.0 3,075 3,135 6,282 100.4 104.3 2,965 3,089 4.2Key ProductsPetrol 359 356 388 8.9 7.9 356 369 744 101.5 109.3 348 363 4.1Naphtha 258 305 276 (9.7) 6.9 256 296 581 96.1 127.5 267 296 10.9LPG 534 489 528 7.8 (1.2) 513 490 1,017 107.7 98.1 487 492 0.9Diesel 1,422 1,403 1,443 2.9 1.5 1,395 1,436 2,846 98.2 104.0 1,327 1,412 6.4Kerosene 182 157 174 11.2 (4.2) 174 159 331 108.7 90.7 175 160 (9.0)ATF 123 115 119 3.2 (3.4) 121 114 235 106.1 93.4 118 111 (6.2)Fuel Oil 162 126 124 (1.7) (23.2) 155 133 251 88.3 61.6 169 145 (14.0)30%20%10%0%-10%14April 2013
Under recoveries trend and domestic fuel pricing Latest fortnight daily under recoveryrun-rate at INR3.5b, implying annualunder recovery at INR1.2t. Impact of INR1/ltr price hike onunder recoveries• Diesel : ~INR80b• Kerosene: ~INR10b• LPG hike of INR25/cyl: ~INR26bPetrol and diesel price difference (INR/lt)Domestic retail petrol price trend (INR/lt)Petrol (INR/ltr)Chg (%) - RHS80604020-Dec-04Dec-05Nov-06Oct-07Sep-08Aug-09Jul-10Jun-11May-12Apr-1320%10%0%-10%-20%Fortnightly diesel under recoveries (INR/lt) Fortnightly kerosene under recoveries (INR/lt) Fortnightly LPG under recoveries (INR/cyl)Domestic retail diesel price trend (INR/lt) Domestic retail Kerosene price trend (INR/cyl) Domestic retail LPG price trend (INR/cyl)6048362412-Diesel (INR/ltr)Chg (%) - RHS20%10%0%-10%-20%2015105-Kerosene (INR/ltr)Chg (%) - RHS30%20%10%0%-10%400300200100-20%10%0%-10%-20%Dec-04Dec-05Nov-06Oct-07Sep-08Aug-09Jul-10Jun-11May-12Apr-13Dec-04Dec-05Nov-06Oct-07Sep-08Aug-09Jul-10Jun-11May-12Apr-13Dec-04Dec-05Nov-06Oct-07Sep-08Aug-09Jul-10Jun-11May-12Apr-13Mar-12Apr-12May-12Jun-12Jul-12Aug-12Sep-12Oct-12Nov-12Dec-12Jan-13Feb-13Mar-13Mar-12Apr-12May-12Jun-12Jul-12Aug-12Sep-12Oct-12Nov-12Dec-12Jan-13Feb-13Mar-13Mar-12Apr-12May-12Jun-12Jul-12Aug-12Sep-12Oct-12Nov-12Dec-12Jan-13Feb-13Mar-1314.413.912.59.212.117.111.79.810.09.09.211.38.66.531.031.530.527.228.532.733.931.330.930.631.633.430.5571481396319231347469479521461481439435LPG (INR/Cyl)Chg (%) - RHS15April 2013
Under recoveries: Model upstream sharing at 40%We model upstream sharing at 40% in FY13/FY14/FY15(INR b) FY05 FY06 FY07 FY08 FY09 FY10 FY11 FY12 FY13E FY14E FY15EFx Rate (INR/USD) 44.9 44.3 45.2 40.3 46.0 47.5 45.6 47.9 54.5 54.0 53.0Brent (USD/bbl) 42 58 64 82 85 70 86 114 111 110 110Gross Under recoveries (INR b)Petrol 2 27 20 73 52 52 27 0 0 0 0Diesel 22 126 188 353 523 93 348 819 909 516 153Kerosene 95 144 179 191 282 174 200 278 305 296 277LPG 84 102 107 156 176 143 205 284 407 406 441Total 201 400 494 773 1,033 461 780 1,385 1,620 1,218 870Gross Under recoveries Sharing (INR b)Government 0 115 241 353 713 260 410 829 972 731 522Ups tream 59 140 205 257 329 145 303 552 648 487 348OMC's 142 138 48 163 (9) 56 67 0 0 0 0Total 201 400 494 773 1,033 461 780 1,385 1,620 1,218 870Gross Under recoveries Sharing (%)Government 0 29 49 46 69 56 53 60 60 60 60Ups tream 30 35 42 33 32 31 39 40 40 40 40OMC's 70 35 10 21 (1) 12 9 0 0 0 0Total 100 100 100 100 100 100 100 100 100 100 100Upstream Sharing (INR b)ONGC 41 120 170 220 281 116 249 445 527 400 285OIL 7 10 20 23 30 15 33 74 86 65 47GAIL 11 11 15 14 18 13 21 32 34 22 16Total 59 140 205 257 329 144 303 550 648 487 348Upstream Sharing (%)ONGC 69 85 83 86 86 80 82 81 81 82 82OIL 12 7 10 9 9 11 11 13 13 13 13GAIL 19 8 7 5 5 9 7 6 5 5 5Total 100 100 100 100 100 100 100 100 100 100 100Note: We have assumed a diesel price hike of INR0.45/lt every month in our estimates16April 2013
Industry News - InternationalOil Demand growth estimates from IEA, OPEC, EIAOil demand growth (mmbbl/d) 2012 2013 RemarksIEA (Oil Market Report) 0.9 0.8 Believes US sequester, worsening Chinese business sentiment and continueddeterioration in European employment lend will keep oil demand growth lowOPEC (Monthly Oil Market Report) 0.8 0.8 Maintained 2013 oil demand, expects major growth from ChinaEIA (Short-Term Energy Outlook) 0.8 1.0 Expects non-OECD countries <strong>to</strong> drive growth momentum in 2013Burnable ice’ discovery gives Japan hopeof 100-year gas supplyJapan has extracted natural “ice gas” frommethane hydrates beneath the sea off itscoasts in a technological coup, opening upa super-resource that could meet thecountry’s gas needs for the next centuryand change the world’s energy outlook.JOGMEC said an exploration ship hadsuccessfully drilled 1,000ft below theseabed in<strong>to</strong> deposits of methane hydrate,an ice-like solid that s<strong>to</strong>res gas moleculesbut requires great skill <strong>to</strong> extract safely.“Methane hydrates available withinJapan’s terri<strong>to</strong>rial waters may well be able<strong>to</strong> supply the nation’s natural gas needsfor a century,” said company, adding thatthe waters under exploration also containlarge reserves of rare earth metals.Saudi Arabia <strong>to</strong> Drill for Shale Gas ThisYearSaudi Arabia, the world's largest exporterof crude oil, will push ahead this year withexplora<strong>to</strong>ry drilling of shale and otherunconventional gas reserves which couldbe twice the size of its conventional gasreserves, which <strong>to</strong>tal 286 trillion cubicfeet, Minister of Oil Ali al-Naimi said. "Thisyear alone we are going <strong>to</strong> test sevenwells for shale. We have rough estimatesof 600 trillion cubic feet of unconventionalshale gas. The potential is very huge andwe plan <strong>to</strong> exploit it," he said during aCredit Suisse conference. Saudi outputeased <strong>to</strong> 9.2 million barrels a day inDecember, from 9.6 million the previousmonth.Shell <strong>to</strong> offload Australia’s GeelongrefineryShell is planning <strong>to</strong> sell its 120,000 b/dGeelong refinery in Australia's Vic<strong>to</strong>riastate, but will turn it in<strong>to</strong> an oil productimport terminal if it fails <strong>to</strong> find a buyer.Its 79,000 b/d Clyde refinery in Sydneywas converted <strong>to</strong> a similar facility lastyear. Conversion of Geelong in<strong>to</strong> animport terminal will leave Australia withfour refineries with a combined capacityof about 427,000 b/d against productdemand of around 1mn b/d. Australia isbecoming increasingly dependent onimported crude and products as domesticproduction declines and its downstreamindustry faces increased competition fromlarger, more efficient Asia-Pacificrefineries17 April 2013
Industry News - DomesticGail <strong>India</strong> books LNG output facility in USfor 20 yearsGail <strong>India</strong> has booked 2.3 million <strong>to</strong>nnes ofLNG production capacity in the US. It hassigned a deal with US energy firmDominion for using capacity at its CovePoint terminal at Lusby in Maryland."Dominion is marketing 4.6 mtpa and Gailhas booked 50% of such capacity for 20years," the company said in a statement. Amajor Japanese buyer holds the balancecapacity in the terminal. Construction ofthe terminal is expected <strong>to</strong> start in 2014and the liquefaction facilities will becommissioned by 2017, it said."Gail has a positive outlook on Henry HubindexedLNG exports from the US and thathas prompted us <strong>to</strong> sign this terminalservice agreement, which follows our dealwith Cheniere signed in 2011. Thecontracts signed with Cheniere andDominion make Gail one of the largestHenry Hub LNG portfolio holders andprovide us an opportunity <strong>to</strong> marketabout 6 mmtpa of LNG from the US," Gailchairman & managing direc<strong>to</strong>r BC Tripathisaid.OVL completes Azerbaijan acquisitionUS energy firm Hess Corporation hascompleted the USD1b sale of its stakes inoil-rich Chirag and Guneshli fields and anassociated pipeline in Azerbaijan <strong>to</strong> ONGCVidesh (OVL). "The acquisition would bring9% additional proved reserves <strong>to</strong> OVLportfolio and daily oil production of about19,000 barrels," an ONGC official said. Thecompany had signed a deal with HessCorp in September last year. The dealincludes acquisition of Hess Corp's 2.72%stake in Chirag and the deepwater portionof Guneshli fields in the prolific CaspianSea region and a 2.36% stake in the Baku-Tbilisi-Ceyhan pipeline.BP-operated oil and gas fields are locatedin the south Caspian Sea, about 95 km offthe coast of Azerbaijan. OVL's otherpartners in the fields are State OilCompany of Azerbaijan Republic, Chevron,Sta<strong>to</strong>il, ExxonMobil, Inpex, Turkish NOC-TPAO and I<strong>to</strong>chu.<strong>Cairn</strong> <strong>India</strong> starts oil output fromAishwariya field in Rajasthan Block<strong>Cairn</strong> <strong>India</strong> Ltd has commenced oilproduction from the Aishwariya field inthe Rajasthan Block bordering Pakistanand also begun commercial sale of gasfrom there. <strong>Cairn</strong> <strong>India</strong> plans <strong>to</strong> raise oiloutput from the new field <strong>to</strong> 10,000barrels per day and <strong>to</strong> invest more thanINR60b (USD1.1 billion) in exploration anddevelopment in the fiscal year beginningApril, P. Elango, a member of the boardsaid. The fields in the Rajasthan Blockproduce about 175,000 bpd andcontribute more than 23 percent of <strong>India</strong>'sdomestic production, the company said.Besides <strong>Cairn</strong> <strong>India</strong> began natural gassales from its prolific Rajasthan block onborders with Pakistan. It will initiallyproduce about 5 million standard cubicfeet per day (0.15 million standard cubicmeters per day) of gas, which will go up <strong>to</strong>a maximum of 1 mmscmd by next year.<strong>Cairn</strong> <strong>India</strong> CEO P Elango said thecompany can produce more "provided weget timely regula<strong>to</strong>ry approvals". "We canmake (this block) the largest producingfield in the country," he said18 April 2013
Industry News - DomesticRIL spuds first exploration well in fiveyearsRIL has spud its first exploration well inmore than five years on the flaggingnatural gas fields in KG-D6 block as it looksfor new reserves <strong>to</strong> supplement fallingoutput. The MJ-1 exploration well on theDhirubhai-1 and 3 gas fields in the KG-DWN-98/3 or KG-D6 block "was spud inearly March and is drilling ahead," saidNiko Resources, the firm's minoritypartner in the Krishna Godavari basinblock.The well is targeting a Mesozoic synriftclastic reservoir, similar <strong>to</strong> the producingMA oil and gas field in the same block.The well be drilled over two kilometresdeeper than and directly beneath theproducing D1&D3 fields in the block.Results of the well are expected in April orMay, Niko said. RIL has given the well apre-drill best case gross prospectiveresource of 819 billion cubic feet of gasand 56 million barrels of liquids. MJ-1 wellwill probe the Mesozoic synrift clasticreservoir lying below the D1-D3 (Pliocene)Mining Lease area.Iran slips <strong>to</strong> 7th slot among crude oilsuppliers <strong>to</strong> <strong>India</strong>With <strong>India</strong> cutting import of oil from Iran,the Persian Gulf nation has slipped fourplaces <strong>to</strong> become <strong>India</strong>'s seventh-largestcrude oil supplier in current fiscal. Iran,which was <strong>India</strong>'s second biggest supplierof crude oil after Saudi Arabia in 2010-11,supplied 9.7 million <strong>to</strong>ns during April-December period of current year, the LokSabha was informed. The supplies fromIran were behind Saudi Arabia's 24.8 mmt,Iraq's 17.2 mmt, Venezuela's 15.1 mmt,Kuwait's 13.2 mmt and UAE's 11.4 mmt.<strong>India</strong> had last fiscal (2011-12) relegatedIran <strong>to</strong> third spot with 18.1 mmt ofimports. In a written reply <strong>to</strong> a question,Minister of State for Petroleum & NaturalGas Panabaaka Lakshmi said Iran had in2009-10 supplied 21.2 mmt which camedown <strong>to</strong> 18.5 mmt in 2010-11 and <strong>to</strong> 18.1mmt in the year after. It may end the fiscalwith import of about 13 million <strong>to</strong>ns incurrent fiscal. During current fiscal, Iraniansupplies made up for 7.2 per cent of the<strong>India</strong>'s oil imports, down from 10.5 percent in the previous fiscal (2011-12).ONGC, Oil <strong>India</strong> make joint bid forMozambique gas stakeONGC and Oil <strong>India</strong> have made a joint bid<strong>to</strong> acquire up <strong>to</strong> 20% stake in a gaintMozambique gas field. GAIL <strong>India</strong> shunnedthe offer as it felt the asking price ofaround USD4 billion was <strong>to</strong>o high. Sourcesprivy <strong>to</strong> the development said OVL-OILhave made a non-bidding offer at theclose of deadline. Videocon and Anadarkoare running almost common auctionprocess but will do separate saletransaction for selling stake in theMozambique's offshore Area 1, which mayhold as much as 70 Trillion cubic feet ofgas resources.Sources said while Videocon has put onoffer all of its stake <strong>to</strong> cut its debt,Anadarko is wanting <strong>to</strong> reduce its holding<strong>to</strong> 26.5 per cent. It wasn't howeverimmediately clear if OVL-OIL combinehave made a single offer or have madeseparate offers <strong>to</strong> Anadarko andVideocon. Anadarko is the opera<strong>to</strong>r of theblock with 36.5 per cent stake whileVideocon and a unit of BPCL hold 10 percent stake each.19 April 2013
O&G s<strong>to</strong>ck performanceAbsolute s<strong>to</strong>ck performance (%)1 MONTH ABSOLUTEGSPL (1)PLNGIGL<strong>Cairn</strong>IOCBPCLHPCLGAILOILONGCRIL(12)(8)(8)(9)(10)(7)(4)(1)(2)73 MONTH ABSOLUTEGSPL (11)PLNG(15)IGL<strong>Cairn</strong> (15)IOCBPCLHPCL2GAIL (10)OILONGCRIL (7)99813216 MONTH ABSOLUTEGSPL(16)PLNG(16)IGL<strong>Cairn</strong> (18)IOCBPCLHPCL (8)GAIL (18)OILONGCRIL (9)71177111 YEAR ABSOLUTEGSPL (11)PLNG (16)IGL (26)<strong>Cairn</strong> (23)IOCBPCLHPCLGAIL (12)OILONGCRIL81301176(20) 0 20(20) 0 20 40(20) 0 20(50) 0 50Relative s<strong>to</strong>ck performance (%)1 MONTH RELATIVEGSPLPLNGIGL<strong>Cairn</strong>(9)IOCBPCLHPCLGAILOILONGC(5)(6)(6)RIL (7)(5)(1)11193 MONTH RELATIVEGSPL (8)PLNG (12)IGL<strong>Cairn</strong>IOCBPCLHPCLGAILOILONGCRIL(12)(7)(4)512121116246 MONTH RELATIVEGSPL (17)PLNGIGL<strong>Cairn</strong>IOCBPCLHPCLGAILOILONGCRIL(17)(19)(19)(10)(10)6106691 YEAR RELATIVEGSPL (20)PLNGIGL<strong>Cairn</strong>(32)IOCBPCLHPCLGAILOILONGCRIL(25)(35)(22)(1)(9)(8)(3)48(10) (5) 0 5 10 15(30) (10) 10 30(30) (20) (10) 0 10 20(40) (20) 0 2020 April 2013
Valuation comparison <strong>to</strong> Global peersM. Cap PE (x) P/BV (x) EV/EBIDTA (x)(USDb) CY12/FY13 CY13/FY14 CY14/FY15 CY12/FY13 CY13/FY14 CY14/FY15 CY12/FY13 CY13/FY14 CY14/FY15Integrated Oil CompaniesReliance Industries 47.2 11.1 10.7 10.1 1.3 1.2 1.1 8.4 8.4 8.0Big 5 average 9.4 9.4 9.0 1.7 1.6 1.5 4.2 4.3 4.2North America average 11.3 11.2 10.4 1.4 1.3 1.2 4.5 4.3 4.0Europe average 14.9 9.9 8.9 1.0 0.9 0.9 3.8 3.7 3.5Asia & Others average 11.1 9.4 8.7 1.3 1.2 1.1 5.8 5.2 4.8Global Average 11.7 9.9 9.2 1.3 1.2 1.1 5.2 4.8 4.4Upstream CompaniesONGC 49.9 10.7 8.6 6.0 1.8 1.6 1.4 4.6 3.5 2.5Oil <strong>India</strong> 5.6 9.0 7.0 5.1 1.6 1.4 1.2 5.0 3.3 2.2<strong>Cairn</strong> <strong>India</strong> 10.3 4.5 5.3 5.9 1.2 1.0 0.9 3.1 2.9 2.7North America average 18.3 16.1 12.8 1.8 1.6 1.4 6.1 5.1 4.4Europe average 10.4 10.6 9.5 1.6 1.4 1.3 3.8 4.0 3.5Asia & Others average 11.6 11.9 9.8 1.5 1.4 1.3 5.7 5.5 4.6Global Average 14.4 13.6 11.1 1.6 1.5 1.4 5.5 5.0 4.3RefinersBPCL 5.0 9.7 11.7 10.2 1.5 1.4 1.3 8.2 7.2 6.4CPCL 0.3 NA 4.3 4.3 0.6 0.6 0.5 NA 4.9 4.8HPCL 1.8 21.5 10.9 8.9 0.7 0.7 0.7 49.3 10.4 8.5IOC 12.7 12.4 9.8 7.5 1.1 1.0 0.9 12.0 8.1 6.3MRPL 1.7 NA 6.6 5.9 1.3 1.1 1.0 11.0 4.6 3.8North America average 7.5 7.3 7.8 1.4 1.3 1.1 4.0 3.9 4.1Europe average 13.7 11.2 10.0 1.3 1.2 1.2 5.8 5.6 5.4Japan average 45.8 10.7 12.8 1.1 1.0 0.9 12.9 9.2 8.6Asia & Others average 87.1 19.2 16.2 2.6 2.4 2.3 18.3 11.1 10.5Global Average 45.6 13.5 12.2 1.9 1.7 1.6 11.1 7.8 7.5Gas UtilitiesGAIL 7.5 9.7 9.5 9.8 1.7 1.5 1.3 3.9 3.9 3.8GSPL 0.7 8.2 8.1 7.7 1.4 1.2 1.1 4.7 4.2 4.1IGL 0.7 11.2 9.8 8.8 2.8 2.4 2.0 5.8 4.9 4.2Petronet LNG 2.0 9.0 10.6 9.4 2.4 2.0 1.7 6.9 6.6 5.9North America average 25.9 24.1 20.4 2.8 2.7 2.7 13.2 11.3 9.9Asia & Others average 23.7 20.6 19.1 5.0 4.3 3.9 13.7 12.2 11.1Global Average 25.5 23.4 20.2 3.2 3.0 2.9 13.3 11.5 10.1Petrochemical CompaniesNorth America average 15.2 12.6 10.4 2.1 2.1 1.9 8.0 7.0 6.4Europe average 14.6 13.3 12.1 2.3 2.3 2.1 7.4 7.0 6.6Japan average 63.3 19.4 17.3 1.4 1.4 1.3 8.5 9.1 7.9Asia & Others average 40.7 15.7 13.7 1.2 1.2 1.1 16.9 20.2 19.0Global Average 28.6 14.7 12.9 1.9 1.8 1.7 10.3 10.9 10.1*All averages are weighted averages21April 2013
Valuation comparison <strong>to</strong> Global peers: Integrated CompaniesINTEGRATED E&P M Cap Abs performance (%) Relative performance (%)PE (x) P/BV (x) EV/EBIDTA (x)(USD b) 1-M 6-M 1-yr 3-yr 1-M 3-mo 6-M 1-yr 3-yr<strong>India</strong>n CompaniesReliance Inds 47 (4) (9) 4 (31) (4) (5) (8) (3) (35) 12.2 11.8 11.2 1.4 1.3 1.2 7.7 8.3 7.9International MajorsBP 134 4 6 2 (28) 3 (3) (3) (9) (36) 7.7 8.2 7.3 1.1 1.1 1.0 4.4 4.3 4.0Chevron 229 0 1 12 52 (3) (2) (6) 0 14 9.6 9.5 9.4 1.7 1.5 1.4 3.9 4.0 3.9Exxon Mobil 403 1 (2) 6 34 (2) (7) (9) (5) 0 11.4 11.2 10.7 2.5 2.2 2.1 4.7 5.1 5.0Royal Dutch Shell 209 (2) (1) (1) 10 (3) (6) (10) (12) (1) 7.7 7.7 7.6 1.1 1.0 0.9 3.9 3.8 3.7Total 114 (2) (2) (1) (15) (3) (11) (11) (12) (24) 6.9 7.1 7.1 1.2 1.1 1.0 3.1 3.2 3.1Weighted Average 9.4 9.4 9.0 1.7 1.6 1.5 4.2 4.3 4.2US/CanadaConocoPhillips 72 3 3 2 47 (0) (9) (4) (8) 10 10.4 10.9 9.7 1.4 1.3 1.2 3.9 4.2 3.8Hess Corp 25 5 33 23 14 2 21 25 11 (14) 12.2 11.4 11.8 1.1 1.0 1.0 4.3 4.3 4.4Marathon 23 3 11 7 71 (0) (4) 4 (4) 29 12.9 11.2 10.5 1.2 1.1 1.0 3.4 3.0 2.9Occidental 65 (1) (5) (14) (6) (4) (6) (11) (23) (29) 11.7 11.1 10.4 1.6 1.5 1.3 5.1 4.5 4.1Husky Energy 29 (8) 9 18 (1) (10) (8) 2 6 (26) 13.8 14.9 12.9 1.5 1.5 1.4 5.6 5.6 4.8Suncor Energy 45 (0) (12) (5) (14) (3) (19) (18) (15) (35) 9.4 9.7 9.3 1.1 1.1 0.9 4.5 4.5 4.2Weighted Average 11.3 11.2 10.4 1.4 1.3 1.2 4.5 4.3 4.0EuropeENI 82 2 3 3 1 1 (12) (6) (9) (9) 8.8 9.0 8.5 1.1 1.0 1.0 2.9 2.9 2.8MOL 7 (1) (12) (6) (21) (2) (11) (20) (16) (29) 8.7 8.7 8.0 0.9 0.9 0.8 5.2 5.0 4.7Norsk Hydro 9 (1) (7) (18) (41) (2) (18) (16) (27) (47) 102.3 24.2 14.2 0.7 0.7 0.7 9.6 7.2 5.7OMV 14 0 23 29 13 (1) 14 11 15 2 7.4 7.6 7.5 0.9 0.9 0.8 3.5 3.6 3.5Repsol YPF SA 26 (5) 7 (12) (13) (6) (6) (3) (22) (22) 10.1 9.6 9.2 0.8 0.7 0.7 4.8 4.6 4.4Weighted Average 14.9 9.9 8.9 1.0 0.9 0.9 3.8 3.7 3.5OthersChina Petroleum & Chem 105 2 26 7 38 3 3 19 (0) 30 10.4 8.3 8.0 1.2 1.1 1.0 5.7 4.9 4.6CNOOC 86 2 (4) (6) 7 3 (9) (10) (13) 3 8.2 8.5 8.2 1.7 1.5 1.3 3.7 3.6 3.3Petrobras 111 9 (20) (17) (50) 8 (17) (27) (27) (55) 11.1 7.3 6.5 0.7 0.6 0.6 6.2 5.6 4.7PetroChina 256 (1) 3 (8) 9 0 (4) (4) (14) 5 12.6 11.1 10.4 1.4 1.3 1.2 6.3 5.7 5.3PTT 31 (6) 0 (9) 15 (5) (10) (14) (28) (39) 8.5 7.9 7.5 1.4 1.3 1.2 6.0 5.7 5.3Weighted Average 11.1 9.4 8.7 1.3 1.2 1.1 5.8 5.2 4.8Global Average 14.6 10.5 9.4 1.3 1.2 1.1 4.8 4.5 4.2*All averages are weighted averagesCY12/FY13CY13/FY14CY14/FY15CY12/FY13CY13/FY14CY14/FY15CY12/FY13CY13/FY14CY14/FY1522April 2013
N O T E S23April 2013
DisclosuresThis report is for personal information of the authorized recipient and does not construe <strong>to</strong> be any investment, legal or taxation advice <strong>to</strong> you. Thisresearch report does not constitute an offer, invitation or inducement <strong>to</strong> invest in securities or other investments and <strong>Motilal</strong> <strong>Oswal</strong> Securities Limited(hereinafter referred as MOSt) is not soliciting any action based upon it. This report is not for public distribution and has been furnished <strong>to</strong> you solelyfor your information and should not be reproduced or redistributed <strong>to</strong> any other person in any form.Unauthorized disclosure, use, dissemination or copying (either whole or partial) of this information, is prohibited. The person accessing thisinformation specifically agrees <strong>to</strong> exempt MOSt or any of its affiliates or employees from, any and all responsibility/liability arising from such misuseand agrees not <strong>to</strong> hold MOSt or any of its affiliates or employees responsible for any such misuse and further agrees <strong>to</strong> hold MOSt or any of itsaffiliates or employees free and harmless from all losses, costs, damages, expenses that may be suffered by the person accessing this information due<strong>to</strong> any errors and delays.The information contained herein is based on publicly available data or other sources believed <strong>to</strong> be reliable. While we would endeavour <strong>to</strong> updatethe information herein on reasonable basis, MOSt and/or its affiliates are under no obligation <strong>to</strong> update the information. Also there may beregula<strong>to</strong>ry, compliance, or other reasons that may prevent MOSt and/or its affiliates from doing so. MOSt or any of its affiliates or employees shall notbe in any way responsible and liable for any loss or damage that may arise <strong>to</strong> any person from any inadvertent error in the information contained inthis report . MOSt or any of its affiliates or employees do not provide, at any time, any express or implied warranty of any kind, regarding any matterpertaining <strong>to</strong> this report, including without limitation the implied warranties of merchantability, fitness for a particular purpose, and noninfringement.The recipients of this report should rely on their own investigations.This report is intended for distribution <strong>to</strong> institutional inves<strong>to</strong>rs. Recipients who are not institutional inves<strong>to</strong>rs should seek advice of their independentfinancial advisor prior <strong>to</strong> taking any investment decision based on this report or for any necessary explanation of its contents.MOSt and/or its affiliates and/or employees may have interests/positions, financial or otherwise in the securities mentioned in this report. Toenhance transparency, MOSt has incorporated a Disclosure of Interest Statement in this document. This should, however, not be treated asendorsement of the views expressed in the report.Disclosure of Interest StatementCompanies where there is interest1. Analyst ownership of the s<strong>to</strong>ck None2. Group/Direc<strong>to</strong>rs ownership of the s<strong>to</strong>ck IOC3. Broking relationship with company covered None4. Investment Banking relationship with company covered NoneAnalyst Certification: The views expressed in this research report accurately reflect the personal views of the analyst(s) about the subject securitiesor issues, and no part of the compensation of the research analyst(s) was, is, or will be directly or indirectly related <strong>to</strong> the specific recommendationsand views expressed by research analyst(s) in this report. The research analysts, strategists, or research associates principally responsible forpreparation of MOSt research receive compensation based upon various fac<strong>to</strong>rs, including quality of research, inves<strong>to</strong>r client feedback, s<strong>to</strong>ck picking,competitive fac<strong>to</strong>rs and firm revenues.24April 2013
Regional Disclosures (outside <strong>India</strong>)This report is not directed or intended for distribution <strong>to</strong> or use by any person or entity resident in a state, country or any jurisdiction, where suchdistribution, publication, availability or use would be contrary <strong>to</strong> law, regulation or which would subject MOSt & its group companies <strong>to</strong> registration orlicensing requirements within such jurisdictions.For U.K.This report is intended for distribution only <strong>to</strong> persons having professional experience in matters relating <strong>to</strong> investments as described in Article 19 ofthe Financial Services and Markets Act 2000 (Financial Promotion) Order 2005 (referred <strong>to</strong> as "investment professionals"). This document must notbe acted on or relied on by persons who are not investment professionals. Any investment or investment activity <strong>to</strong> which this document relates isonly available <strong>to</strong> investment professionals and will be engaged in only with such persons.For U.S.<strong>Motilal</strong> <strong>Oswal</strong> Securities Limited (MOSL) is not a registered broker - dealer under the U.S. Securities Exchange Act of 1934, as amended (the"1934act") and under applicable state laws in the United States. In addition MOSL is not a registered investment adviser under the U.S. Investment AdvisersAct of 1940, as amended (the "Advisers Act" and <strong>to</strong>gether with the 1934 Act, the "Acts), and under applicable state laws in the United States.Accordingly, in the absence of specific exemption under the Acts, any brokerage and investment services provided by MOSL, including the productsand services described herein are not available <strong>to</strong> or intended for U.S. persons.This report is intended for distribution only <strong>to</strong> "Major Institutional Inves<strong>to</strong>rs" as defined by Rule 15a-6(b)(4) of the Exchange Act and interpretationsthereof by SEC (henceforth referred <strong>to</strong> as "major institutional inves<strong>to</strong>rs"). This document must not be acted on or relied on by persons who are notmajor institutional inves<strong>to</strong>rs. Any investment or investment activity <strong>to</strong> which this document relates is only available <strong>to</strong> major institutional inves<strong>to</strong>rsand will be engaged in only with major institutional inves<strong>to</strong>rs. In reliance on the exemption from registration provided by Rule 15a-6 of the U.S.Securities Exchange Act of 1934, as amended (the "Exchange Act") and interpretations thereof by the U.S. Securities and Exchange Commission("SEC") in order <strong>to</strong> conduct business with Institutional Inves<strong>to</strong>rs based in the U.S., MOSL has entered in<strong>to</strong> a chaperoning agreement with a U.S.registered broker-dealer, <strong>Motilal</strong> <strong>Oswal</strong> Securities International Private Limited. ("MOSIPL"). Any business interaction pursuant <strong>to</strong> this report will have<strong>to</strong> be executed within the provisions of this chaperoning agreement.The Research Analysts contributing <strong>to</strong> the report may not be registered /qualified as research analyst with FINRA. Such research analyst may not beassociated persons of the U.S. registered broker-dealer, MOSIPL, and therefore, may not be subject <strong>to</strong> NASD rule 2711 and NYSE Rule 472 restrictionson communication with a subject company, public appearances and trading securities held by a research analyst account.25April 2013
For Singapore<strong>Motilal</strong> <strong>Oswal</strong> Capital Markets Singapore Pte Limited is acting as an exempt financial advisor under section 23(1)(f) of the Financial Advisers Act(FAA)read with regulation 17(1)(d) of the Financial Advisors Regulations and is a subsidiary of <strong>Motilal</strong> <strong>Oswal</strong> Securities Limited in <strong>India</strong>. This research isdistributed in Singapore by <strong>Motilal</strong> <strong>Oswal</strong> Capital Markets Singapore Pte Limited and it is only directed in Singapore <strong>to</strong> accredited inves<strong>to</strong>rs, as definedin the Financial Advisers Regulations and the Securities and Futures Act (Chapter 289), as amended from time <strong>to</strong> time.In respect of any matter arising from or in connection with the research you could contact the following representatives of <strong>Motilal</strong> <strong>Oswal</strong> CapitalMarkets Singapore Pte Limited:Nihar OzaKadambari BalachandranEmail: niharoza.sg@motilaloswal.comEmail : kadambari.balachandran@motilaloswal.comContact: (+65) 68189232 Contact: (+65) 68189233 / 65249115Office address: 21 (Suite 31), 16 Collyer Quay, Singapore 049318<strong>Motilal</strong> <strong>Oswal</strong> Securities LimitedM E M B E R O F B S E A N D N S E<strong>Motilal</strong> <strong>Oswal</strong> Tower, Sayani Road, Prabhadevi, Mumbai 400 025, INDIABOARD: +91 22 3982 5500 | WEBSITE: www.motilaloswal.com26April 2013


![Electronic Contract Note [ECN] â DECLARATION (VOLUNTARY) To ...](https://img.yumpu.com/48604692/1/158x260/electronic-contract-note-ecn-a-declaration-voluntary-to-.jpg?quality=85)