with supplementary material - Watercare
with supplementary material - Watercare
with supplementary material - Watercare
- No tags were found...

You also want an ePaper? Increase the reach of your titles
YUMPU automatically turns print PDFs into web optimized ePapers that Google loves.
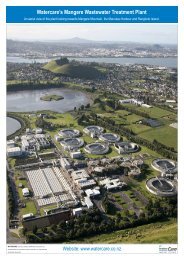
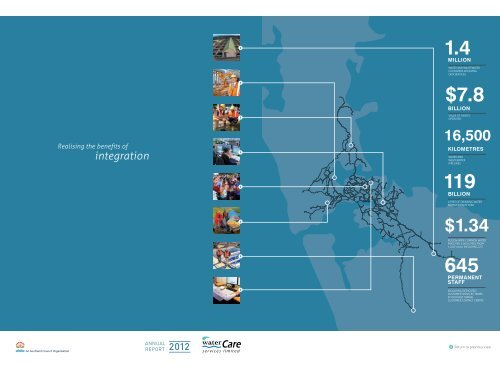
<strong>Watercare</strong> Services Limited2012 ANNUAL REPORT<strong>Watercare</strong>’sNetworksAnd the Local Board areas that we serveGreat Barrier Island InsetRodneyHibiscus Coast and BaysUpper HarbourKaipatikiDevonport - TakapunaWaihekeHenderson - MasseyAlbert - EdenWaitemataOrakeiWhauWaitakere RangesPuketapapaMangere - OtahuhuMaungakiekie - TamakiHowickOtara - PapatoetoeManurewaPapakuraFranklinDAMWASTEWATER TREATMENT PLANTWATER TREATMENT PLANTBULK WATER SUPPLY NETWORKMAIN WASTEWATER COLLECTION NETWORKLocal BoardsReturn to contents pagewatercare’s networks PAGE 3
<strong>Watercare</strong> Services Limited2012 ANNUAL REPORTkey to PerformanceMeasurement12345678Safe and reliable waterManagement of water resources to provide a safe and reliable water supply.Healthy waterwaysManagement of wastewater discharges to maintain or improve the health of the environment.Health, safety and well-beingTo be an industry-best workplace.Customer satisfactionProviding customers <strong>with</strong> great service and great value.Stakeholder relationsTo be responsive to stakeholder requirements.Sustainable environmentTo minimise and/or mitigate the adverse impact of the company’s operations on the environment.Effective asset managementManaging assets to ensure the use of existing assets is maximised while optimising the scope, timing and costof new investments.Sound financial managementManagement of the company to meet business objectives at the lowest cost.How to read the performance rulers(Pages 26-60)<strong>Watercare</strong> uses performance rulers to measure achievements against 42 targets in the eight focus areas shown above.The way some rulers are presented has changed this year (indicated <strong>with</strong> a starhas remained the same.) although the methodology for calculating the results3e. Percentage performance: staff training.Target: 20 hours, training and study per employee.AchievedTARGET 100%This year’s performance10 20 30 40 50 60 70 80 90 1002012 SCORE100%<strong>Watercare</strong> continued to invest significantly in the training and development of staff during2011/12, <strong>with</strong> an average of 21.7 hours per employee spent undertaking training or studythroughout the year. The Engineering Graduate support group continues <strong>with</strong> 25 graduatescurrently working towards chartered status. All water and wastewater operational staff areactively encouraged to pursue formal qualifications, <strong>with</strong> 4 staff achieving Certificate orDiploma-level qualifications during 2011/12.KEYTarget metTarget not metGood performancebut could do better2008 2009 2010 201185% 90% 85% 69%Previous years’ resultsfor comparisonPAGE 4 key to performance measurementReturn to contents page
<strong>Watercare</strong> Services Limited2012 ANNUAL REPORTPerformancesummary<strong>Watercare</strong> measures and manages our sustainability performance against42 targets <strong>with</strong>in eight focus areas. The focus areas are: safe and reliablewater; healthy waterways; health, safety and well-being; customersatisfaction; stakeholder relations; sustainable environment; effective assetmanagement; and sound financial management. The chart below shows<strong>Watercare</strong>’s performance this year against a target of 100 per cent.FoCuS 795 %FoCuS 897 %percentage10095908580757065605550454035302520151097 %FoCuS 199 %FoCuS 212Safe and reliable water 97%In 2011/12, <strong>Watercare</strong> has:• Continued to supply quality drinking water to 1.4 million Aucklandresidents and businesses• Improved the security of water supply at Ardmore Water TreatmentPlant which treats 61% of Auckland’s drinking water• Greatly improved drinking water quality for the Franklin area.Outlook: Progress the $350 million Hunua No.4 water transmissionpipeline work.Healthy waterways 99%In 2011/12, <strong>Watercare</strong> has:• Continued to meet high wastewater discharge standards andlevels of service at metropolitan plants• Improved the compliance of rural wastewater treatment plantsinherited from Auckland’s legacy councils in 2010.Outlook: Continue planned infrastructure maintenance and renewalsprojects to improve the health of regional waterways.FoCuS 690 %95 %FoCuS 5100 %FoCuS 498 %FoCuS 334Health, safety and well-being 98%In 2011/12, <strong>Watercare</strong> has:• Sustained a staff and contractor focus on health and safety• Performed extremely well against a range of health, safety andwell-being measures.Outlook: Continue to invest in staff development and training.Customer satisfaction 100%In 2011/12, <strong>Watercare</strong> has:• Improved measured service levels in all contacts <strong>with</strong> customers• Introduced a range of online self-service and electronic billing options.Outlook: Ensure continuous improvement in responding quickly andefficiently to customers’ requirements.77FoCuSFoCuS66FoCuSFoCuS88FoCuSFoCuSFoCuS FoCuS55percentagepercentage10095 10090 9585 9080 8575 8070 7565 7060 6555 6050 5545 5040 4535 4030 3525 3020 2515 2010 1510FoCuSFoCuS44FoCuS FoCuS 11FoCuSFoCuS33FoCuSFoCuS22Overall scorefor focus arEA98 %56Stakeholder relations 95%In 2011/12, <strong>Watercare</strong> has:• Contributed to the development of the Long Term Plan and developed anew Statement of Intent in consultation <strong>with</strong> Auckland Council• Continued to work closely <strong>with</strong> environmental and Maori advisory groups.Outlook: Focus on engagement <strong>with</strong> local boards and other key stakeholders.Sustainable environment 90%In 2011/12, <strong>Watercare</strong> has:• Expanded the focus of reducing the impact of midges and odours to thecommunities surrounding the wastewater treatment plants and networksacquired through integration• Begun rehabilitation of the Puketutu Island <strong>with</strong> biosolids, a whole-lifeproject enabling saving to ratepayers of $22 million in real terms.Outlook: Continue to implement sustainability across the company’s activities.Each section has a keywhich highlights thescore for that particularfocus group. The aboveexample shows theoverall score for focus 3,the highlighted segmentshows how it relates tothe main wheel.7Effective asset management 95%In 2011/12, <strong>Watercare</strong> has:• Continued <strong>with</strong> the staged completion of $48 million Waikato TreatmentPlant upgrade• Delivered 97.5% of planned Infrastructure operations capital projects,<strong>with</strong>in the $243 million capital programme.Outlook: Ensure effective delivery of the Asset Management Plan for theperiod 1 July 2012 to 30 June 2022.8Sound financial management 97%In 2011/12, <strong>Watercare</strong> has:• Maintained focus on meeting interest targets and financial ratios.• Continued to concentrate on procurement efficiency, realising savingsof $3.5 million.Outlook: Maintain our focus on leveraging efficiencies and gainsfrom the integrated company.Return to contents pageperformance summary PAGE 5
<strong>Watercare</strong> Services Limited2012 ANNUAL REPORTsustainabilityimpacts ofcompany activities<strong>Watercare</strong> owns and operate assets…Initiative and Sustainability impacts Outcome to date Outlook 2012/13... <strong>with</strong> a focus on energyInternal power generation met more than 30%of <strong>Watercare</strong>’s total energy requirements in2011/12 through biogas engines and hydrogeneration from water supply dams. Theengines also provide low-grade waste heatto sustain the anaerobic digesters, whichneutralise the solid waste products andproduce biogas in the process.66Second annual carbon abatement report approved by theMinistry for the Environment, and Emissions units credited to<strong>Watercare</strong>’s account66Optimising biogas engine operating routine66Investigating benefits of increased use of off-peak energytariffs66Proposing participation in instantaneous reserves market andproposing control and operating changes to reduce powerusage and shift usage to off-peak66Assess benefits of biogas storage to achieve reducedflaring, improved engine operation and maximise peakdemand generation66Achieve energy reduction <strong>with</strong> major consumers such asthe Mangere aeration system66Work <strong>with</strong> network companies to reduce “RegionalCoincident Peak Demand”66Research initiatives such as “Contract for Differences” toreduce costs... <strong>with</strong> a thorough maintainance programmeThe Reliability-Centred Maintenance (RCM)programme provides a balance betweenenvironmental and service risk by identifyingoptimum frequency for maintenance of assetsand determining when assets can continue tobe used until they need replacing.... and plans the next assets neededMaster Planning provides a comprehensivereview of facilities to ensure that futurecapacity requirements and regulatoryrequirements needed by the growing regioncan be met in a cost-effective manner.66Completed the implementation of RCM to wholesale parts ofthe business66Reliability block models developed on an as needed basis66RCM assisting other maintenance projects66RCM assisting capital projects and equipment66Huia Water Treatment Plant and Mangere WastewaterTreatment Plant Master Plans completed66Rosedale Network Facility Plan and Rosedale WastewaterTreatment Plant Master Plan substantially completed66Programme for preparation of water network zonemanagement plans developed, 11 substantially completed66Align RCM models <strong>with</strong> SAP ERP system66Review asset failure data, update RCM Weibull data setsand run RCM model simulations to improve maintenance,procurement and design activities as well as assetperformance66Prepare other major water treatment plant master plans66Continue development of water network zonemanagement plans66Continue development of wastewater network masterplans<strong>Watercare</strong> is contributing to the rehabilitation of Auckland’s natural environment…Initiative and Sustainability impacts Outcome to date Outlook 2012/13... through rehabilitation projects<strong>Watercare</strong>’s Coastal Walkway is a 13 km publicwalking track linking important public reservesto the north (Ambury Farm Park) and south(Otuataua Stonefields).66Further rehabilitation work undertaken at OruarangiCreek mouth66Additional land purchased to enhance open space and thecoastal area66Continue to maintain the area66Integrate Coastal walkways to into the new PuketutuIsland parklandPuketutu Island will be rehabilitated <strong>with</strong>treated biosolids over a 35-year period. Thislong-term, cost-effective solution rehabilitatesa former quarry and will result in a newregional park for the people of Auckland.66Consents and appeals finalised in 2011 66Begin application of biosolids in 201366Commence enabling works as scheduled in 201266Establish Governance TrustPond Two is a former oxidation pond that willbe an ecological reserve planted <strong>with</strong> treesafter being treated <strong>with</strong> biosolids. The projectis a least-cost solution and its proximity to thetreatment plant minimises truck movements inurban areas.66Rehabilitation progressing66Submitted the Post-Closure Care Plan for approval66Continue rehabilitation.66Obtain approval for the Post-Closure Care Plan fromthe Auckland Council... through community partnershipsTree planting: throughout the Greater Aucklandarea <strong>Watercare</strong> is supporting community-ledtree-planting initiatives.The <strong>Watercare</strong> Harbour Clean-Up Trust issponsored by <strong>Watercare</strong> to remove litter fromthe Waitemata Harbour and the Tamaki Estuary.66Continued riparian planting in the Waitakere and Hunuaranges and <strong>with</strong> the Waikato RiverCare Trust66Continued native tree-planting programmes for localschools through Trees for Survival initiative66On 26 June a significant milestone was reached - a totalof 3 million litres of rubbish has been removed since theTrust began operations66New website for the Trust’s activities launched,www.harbourcleanup.org.nz and new Facebook pagewww.facebook.com/pages/<strong>Watercare</strong>-Harbour-Clean-Up-Trust/20192012988225766Continue planting project for the Waikato RiverCareTrust and in the Waitakere and Hunua ranges66Maintain support of Trees for Survival66The Trust has implemented a new contract for littercollection from July 2012PAGE 6 sustainability impacts of company activitiesReturn to contents page
<strong>Watercare</strong> Services Limited2012 ANNUAL REPORTThe valve intake tower at Cosseys Dam.KEYEnvironmentalSocialEconomic<strong>Watercare</strong> builds major new infrastructure where needed for the growth of AucklandInitiative and Sustainability impacts Outcome to date Outlook 2012/13... water supply infrastructureHunua No.4 Watermain will provide for populationgrowth and increased security of water supply tothe Auckland region through approximately 35kmof trunk watermain from Manukau City to centralAuckland. Approx. $350m cost.66Redoubt Rd to Campbell Rd (28km) under construction in stages overthe next 4 years66Areas of advance works already completed to coordinate <strong>with</strong>infrastructure works by others66Progress design and consents for futurestages of the project between Epsom andKhyber Pass66Continue construction in theManukau area... wastewater treatment infrastructureCentral Interceptor will provide for populationgrowth, mitigate risks of pipe failure and reducewastewater overflows in central Auckland. Thecentral wastewater interceptor will go from centralAuckland to the Mangere Wastewater TreatmentPlant. Approx. $800m.66Concept design completed66Consultation and preparation of consent application continuing66Final drafts of consent application documents are complete andundergoing final review66Complete resource consent application forsubmission by August 201266Public notification of main works packagelate 2012; hearing early 2013<strong>Watercare</strong> contributes to the well-being of communitiesInitiative and Sustainability impacts Outcome to date Outlook 2012/13... improving their neighbours’ quality of lifeMidge control: <strong>Watercare</strong> is minimising the impactof midges on the local communities near Mangereand Rosedale wastewater treatment plants byreducing midge populations and habitats.Odour control: <strong>Watercare</strong> is minimising the impactof odour on the local communities living near thewastewater treatment plants.... making things easy for customersMonthly billing will enable households to spreadthe cost of water across the year and detect leaksmore easily. They were previously billed on athree-monthly or six-monthly basis.Volumetric charging of wastewater enableshouseholds to be charged for what they really use.Before, the cost of wastewater was mostly a fixedcharge integrated in the rates. Households hadlittle economic interest in using water more wisely.Water demand management promotes efficientand wise use of water. It is seen as key topromoting the sustainable use of the region’swater resources.... engaging <strong>with</strong> stakeholdersEngaging <strong>with</strong> the community: <strong>Watercare</strong>is engaging in open communication <strong>with</strong>stakeholders using a variety of methods.... investing in staffThe Graduate Engineering Programme enablesengineering graduates to gain widespreadexperience and exposure during their earlycareer years <strong>with</strong> <strong>Watercare</strong>.66Conducted regular field surveys of midge species and numbers66Proactive measures used for controlling midge breeding grounds66Enclosed odorous processes66Operated biofilter odour beds66Held regular meetings <strong>with</strong> odour auditors and local community66Since 1 July 2012, all Aucklanders receive a monthly bill66Monthly billing undertaken following customer consultationand feedback66Since 1 July 2012, wastewater charges are not included in Council ratesany longer and are mostly based on volume66Adopted a target of 15% reduction in water demand by 2025 throughthe Regional Water Demand Management Plan66Started preparing demand management tools to achieve the target66The new 2012 wastewater tariff underwent public consultation as partof the development of the Auckland Plan66Continued to deliver the Adopt A Stream initiative in Auckland schools,The Rain Forest Express and increased use of social media in deliveringkey messages66Held open Board meetings <strong>with</strong> agendas and minutes available online.66Held 5 public open days to explain the Central Interceptor project andreceive community feedback66Held public meetings in Helensville and in Kumeu, Huapai andRiverhead in relation to wastewater servicing66Extensive engagement <strong>with</strong> Local Boards66Continuing support of Engineering Graduate group activities66In-house mentoring group continuing to run successfully66Continuing support of IPENZ-recognised professionaldevelopment workshops66Continue midge control programmes66Continue to undertake odour monitoringprogrammes66Continue to respond to odour complaints66Support given to Aucklanders by increasedstaff and training at <strong>Watercare</strong>’s contactcentre66Support given to Aucklanders by increasedstaff and training at <strong>Watercare</strong>’scontact centre66Continue existing programmes66Continue preparing more tools to achievethe targets66Set up the monitoring of demand acrossthe region66Continue Adopt A Stream and <strong>Watercare</strong>ledscience lessons66Continue the Rain Forest Express service66Undertake customer service survey66<strong>Watercare</strong> will continue to developgraduate engineers by providing arange of experiences during their earlypostgraduate years and ongoing supporttowards them achieving chartered statusReturn to contents pagesustainability impacts of company activities PAGE 7
<strong>Watercare</strong> Services Limited2012 ANNUAL REPORTChairman’sreport“<strong>Watercare</strong> is building on the significant efficienciesrealised since integration to balance the need forgrowth <strong>with</strong> excellent levels of service.”<strong>Watercare</strong>’s first full year as an integratedwater and wastewater service provider hasbeen a successful one.I am pleased to commend the managementand staff of <strong>Watercare</strong> for their work inbuilding on last year’s integration process,and acknowledge the contribution of myBoard colleagues.In the year and a half since November 2010,the company can claim many successes, butin my mind there are two achievements whichstand out:• the seamless transition from a bulk supplierserving six customers to a retail businessservicing 1.4 million customers, <strong>with</strong> noimpact on the service delivery to thosecustomers, and• the contribution <strong>Watercare</strong> continues tomake to the success of Auckland as one ofthe world’s most liveable cities through thedelivery of safe, reliable drinking water andenvironmentally sustainable collection andtreatment disposal of wastewater.As we look to the year ahead and beyond,<strong>Watercare</strong> will continue to manage competingdemands on its resources and funding. Thismeans the business must prioritise whenmaking decisions about Auckland’s futurewater and wastewater needs.This city is growing at a fast pace, so<strong>Watercare</strong> needs to be able to supply for peaksummer water use and meet the demandfor wastewater services for an increasingpopulation at affordable prices.<strong>Watercare</strong> is forecasting $4.8 billion incapital investment over the next 10 years.The majority of that investment is directedtowards renewing and improving the existinginfrastructure, whilst ensuring sufficientcapacity is available to cope <strong>with</strong> growthprojections.Key infrastructure projects in the next10 years include:• the Hunua No.4 Watermain pipeline, whichwill provide for growth and improve securityof supply to central Auckland and the NorthShore ($350 million)• North Harbour watermain duplication toprovide for growth on the North Shore andin Rodney and improve security of supplyfrom key water sources ($265 million)• upgrade of the Huia Water Treatment Plant($185 million) to renew existing assets andimprove security of supply• expansion of the Waikato Water TreatmentPlant (which is a staged upgrade of theexisting plant) to 150 mega-litres per day• upgrade and expansion of the rural watertreatment plants ($100million)• expansion of the biological nutrient removal(BNR) treatment capacity at the MangereWastewater Treatment Plant ($135 million)• the Northern Interceptor, which will caterfor growth in West Auckland and the NorthShore, and improve performance of theexisting wastewater system leading to theRosedale plant ($168 million)• the Central Interceptor – an $800 millionproject which will cater for growth in centralAuckland, replacing aged assets nearing theend of their lives and significantly reducingcombined sewer overflows, and• the Waterfront Interceptor – a $135 millionproject designed to address combined seweroverflows in Herne Bay and Grey Lynn.Whilst <strong>Watercare</strong> is planning ahead tosafeguard the security of Auckland’s watersupply, it is essential that all consumersendeavour to reduce the amount of waterused individually. To that end, <strong>Watercare</strong>is actively supporting the promotion ofawareness of water consumption <strong>with</strong>volumetric charging and monthly billing;minimising leaks while lifting networkefficiency; and working <strong>with</strong> major users toencourage a focus on water conservation.The <strong>Watercare</strong> board comprises a range ofskills and it is our role to ensure investmentdecisions are economically sound and aligned<strong>with</strong> the strategic outcomes sought by ourshareholder, Auckland Council.During this year, Pat Snedden retired fromthe <strong>Watercare</strong> board – his constructive andthoughtful contribution during his nine-yeartenure was greatly appreciated. At the end of2011 we welcomed Mike Allen to the board.<strong>Watercare</strong> is committed to delivering waterand wastewater services that meet the needsand expectations of this growing region. Ourfocus for the coming year is to maintain a highlevel of service delivery and increase muchneededsystem capacity.A successful year requires the contributionof a large number of people and processestogether <strong>with</strong> the establishment andmaintenance of key relationships, bothexternal and internal.My thanks to you all.Ross B KeenanChairmanPAGE 8 chairman’s reportReturn to contents page
<strong>Watercare</strong> Services Limited2012 ANNUAL REPORTdirectors’profilesRoss Keenan, 68BCom, FCITChairmanRoss Keenan joined the <strong>Watercare</strong> board in March 2010 and wasappointed Chairman in December 2010. He is an experiencedcompany director, <strong>with</strong> corporate governance and executiveexperience across a diverse range of companies including airways,tourism, telecommunications, health and property development.Ross has particular knowledge and experience in the retail andwholesale water and wastewater services industry and previouslyserved as the Chairman of Metro Water Limited.General disclosure of interests:Chair, Allied Work Force Group Ltd; Chair, Ngai Tahu Tourism Ltd;Director, Ngai Tahu Seafood Ltd; Director, Touchdown LtdDavid Clarke, 53BE (Hons), ME, BBS, MBA, MInstD, FNZIMDeputy Chairman; Chair of the Capital Review GroupDavid Clarke has considerable experience in the areas ofbiotechnology, IT, health, food and related sectors. He has beenthe inaugural chair for multiple technology industries andhas strong commercial and governance skills. His backgroundincludes engineering, finance, marketing and sales. David is afellow of the New Zealand Institute of Management and memberof the NZ Institute of Directors.General disclosure of interests:Chairman, Optima Corporation Ltd – Software (Ambulance/Firesystems and Airlines Rostering); Chairman, TRGG Ltd – RadiologyServices; Chairman, NZ Institute of Rural Health; Chairman, KordiaLtd; Chairman, Skin Institute; Director, Hawkins Watts Ltd – Penrosebased food company; Director, Cranleigh Merchant Bankers; Director,FarmIQ Systems Ltd; Director, Ngai Tahu Tourism Ltd; Director, HyndsGroup Ltd; Trustee, South Auckland Foundation (Middlemore/CMDHB)Peter S Drummond, 59MNZM, AFInstDPeter Drummond is an experienced director and chairman, <strong>with</strong>extensive international business management and marketingexpertise. He was previously Chairman of <strong>Watercare</strong> and bringsextensive knowledge of the wholesale and retail water servicesindustry. He has also served on the boards of Vector, MidCentralHealth and HortResearch Ltd, as well as a large range ofcommunity organisations such as Variety - The Children’s Charity.Peter rejoined the <strong>Watercare</strong> Board in March 2010.General disclosure of interests:Chairman, United Fire Brigade Association; Chairman, ApplianceConnection Ltd; Chairman, <strong>Watercare</strong> Harbour Clean Up Trust; Chairman,Variety Medical Missions South Pacific; Chairman, Ngati Whatua o Orakiwhai maia; International President Variety Childrens Charity; Director,NARTA New Zealand Ltd; Director, NARTA International Pty LtdCatherine Harland, 50BA, PGDipBus (Marketing), MBA, JPCatherine Harland has a background in research, consultancy andpublic policy in local and central government. She was a localgovernment member in Auckland for 15 years, serving on andchairing major regional and city committees. Currently, Catherineis project leader at the New Zealand Institute, an independentthinktank. Previously, she worked <strong>with</strong> AUT University’s Instituteof Public Policy and was engaged in consultancy work <strong>with</strong> theAuckland water industry. Catherine is a Justice of the Peace andserved on the Auckland Observatory and Planetarium Trust Boardfor 11 years, five of those as Chair.General disclosure of interests:Director, McHar Investments Ltd ; Director, Interface Partners Ltd;Trustee, Auckland Restorative Justice Trust; Trustee, One Tree HillJubilee Educational TrustSusan Huria, 52FPRINZ, MInstDChair of the Organisation CommitteeSusan Huria is a specialist in the Maori sector, working<strong>with</strong> Maori organisations on constitutional reviews, boardappointments, support and strategic advice. She hasextensive governance, marketing communications andgeneral management experience. Susan was an executiveat Auckland International Airport and worked in marketingand communications for 10 years, before starting her ownmanagement practice, Huria Anders, in 2000.General disclosure of interests:Deputy Chair, AgResearch Ltd ; Director, Northland PortCompany Ltd; Director and Shareholder, Huria Anders Ltd;Director and Shareholder, Susan Huria (2003) Associates Ltd;Director and Shareholder, Te Ara Tika Properties Ltd ; Director,Vermilion Design Ltd; Director, Airways Corporation of NewZealand Ltd; Director, Veterinary Enterprises Group Limited;Trustee, First FoundationTony Lanigan, 64BE (Hons), PhD, FIPENZ, MICETony Lanigan is a professional civil engineer (FIPENZ),project-management consultant and former General Managerof Fletcher Construction. He was Chancellor of AucklandUniversity of Technology and a director of InfrastructureAuckland. Tony is currently Vice Chairman of Habitat forHumanity in New Zealand and Chair of theNZ Housing Foundation. He is a Director of theNZ Transport Agency (NZTA).General disclosure of interests:Vice Chairman, Habitat for Humanity International; Director, NZHousing Foundation; Director, NZ Transport Agency; Director,Hargrave Project Management Limited; Director, A G Lanigan &Associates LimitedMike Allen, 51LLB, BComMike Allen has extensive experience in investment bankingand general management in both New Zealand and the UK.He has previously consulted to the Australasian water andinfrastructure sectors. Mike is chairman of EnvironmentalInvestments Limited.General disclosure of interests:Chairman: Coats plc; Director, Guinness Peat Group: Director,Godfrey Hirst Limited; Director, Innoflow Australia Limited;Director, Tower Insurance; Director, Tainui Group HoldingsLimited; Director, Breakwater Consulting LimitedJeff Todd, 70CBE, BCom, FCA, FInstDChairman of the Audit and Risk CommitteeJeff Todd is a chartered accountant and company director,and was formerly managing partner for New Zealand andthe Pacific for Price Waterhouse (now PwC). He is a formerChairman of the Southern Cross Medical Care Society,Southern Cross Healthcare Trust and The New ZealandGuardian Trust Company Ltd, and Director of the ReserveBank of New Zealand and the ANZ Banking Group (NZ) Ltd.Jeff has a particular interest in corporate governance and is afellow of the NZ Institute of Directors.General disclosure of interests:Chairman, Dynasty Hotel Group Limited; Chairman, SanfordLimited; President, Auckland Medical Research Foundation;Trustee, Goodfellow Foundation; Trustee, ChristianHealthcare TrustPAGE 10 Directors’ profilesReturn to contents page
<strong>Watercare</strong> Services Limited2012 ANNUAL REPORTchiefexecutive’sreport“Our focus for the coming year is to maintain ahigh standard of service to meet the expectationsof a continually growing region.”Over the last year, <strong>Watercare</strong> has continuedto mature as an integrated business.While Auckland’s growing populationdrives increasing demand for water andwastewater services, <strong>Watercare</strong> is working toreduce water demand and expand capacityin the system where required, while alsomaintaining service level standards andminimising costs to customers.Since November 2010, <strong>Watercare</strong> hasbrought into place the operational andretailing functions of the former six localnetwork operators and councils, <strong>with</strong>outcompromising service delivery toour customers.Each day, we deliver the things ourcustomers want from us: secure and safedrinking water, and the collection, treatmentand disposal of wastewater in a way thatkeeps our environment and waterwayshealthy.of safe drinking water to our customers,and that enable their wastewater to becollected and treated while minimisingimpacts on our environment. This is evenas we integrated some under-performingwater and wastewater assets from theformer local network operators into themainstream network.Following integration we quickly moved toimprove treatment at the non-metropolitanwater treatment plants, including theinstallation of process upgrades atWarkworth and Wellsford to meet arequired increase in performance.We also introduced process changes toimprove effluent quality at non-compliantwastewater treatment plants, whilecompliance was maintained at allother metropolitan wastewatertreatment plants.Future-proofing the water andwastewater network<strong>Watercare</strong>’s aim is to develop, operate,maintain and replace assets over the longterm in order to deliver high-quality servicelevels and meet foreseeable future needs.Reducing water demand now defers theneed for expensive upgrades and is animportant focus for us.<strong>Watercare</strong>’s services are delivered via$7.8 billion worth of assets – Auckland’sentire water and wastewater infrastructure– and we are focused on using Aucklanders’investment in these assets wisely and well.This year, by striving for efficiencies suchas integrated programme delivery andproject design modification, we finishedthe year having completed the scheduledinfrastructure programme, spending97 per‐cent of our $243 million budget.In this year’s Annual Report I am pleased toshare the excellent progress <strong>Watercare</strong> ismaking in delivering those services.We are a company which carefully focusesits efforts and resources in order to deliverwhat our shareholder requires and what our1.4 million customers expect.My hope is that, over time, we will seegreater public recognition of <strong>Watercare</strong>’srole. Here are some of the achievementsthat I believe deserve a mention.Water and wastewater service deliveryThis year we have delivered water andwastewater services <strong>with</strong>out majorinterruption, and maintained excellentlevels of service.Every day, our network teams are on thejob throughout Auckland maintaining the16,500-kilometre network of pipes andplants that enable the continuous supply“Since integration in November 2010, <strong>Watercare</strong> has achievedregional cost efficiencies of more than $100 million.”The majority of the established waterassets – most of which are gravity supplied– continue to serve us well. Much of therequired upgrade work has been completed,is underway or is planned.Our two largest wastewater treatmentplants are state of the art. The high qualityof treatment at Mangere means we candischarge close to the shore. An internationalexpert group recently advised that the2003-2007 upgrade was “an outstandingsuccess story in relation to protection ofpublic health and the environment” and thecondition of Manukau Harbour hasbenefited substantially.<strong>Watercare</strong> plans capital works projectswhich future-proof for growth anddevelopment in the Auckland region, andwhich replace ageing infrastructure andensure security of water supply.New significant infrastructure can be subjectto long lead times, sometimes a decade ormore. This requires considerable foresightand planning from <strong>Watercare</strong>, workingclosely <strong>with</strong> Auckland Council.In the last two years, completed majorinfrastructure includes Project Hobson, theSwanson Branch Wastewater Storage Tank,and Southwestern Interceptor upgrades.PAGE 12 chief executive’s reportReturn to contents page
<strong>Watercare</strong> Services Limited2012 ANNUAL REPORTThe new tariff will address inconsistentcharging across the former council areas.The tariff was selected by Auckland Council,based on principles of equity and fairness,and approved by the <strong>Watercare</strong> boardfollowing public consultation in early 2012as part of the council’s Long Term Plan.Many Aucklanders will benefit from thischange as they will be paying less thanthey did in 2011/12, but some householdswill face increases compared to whatthey paid during that period previously.Recognising that some customers stillstruggle to manage their household costs,<strong>Watercare</strong> established the Water UtilityConsumer Assistance Trust in late 2011.While the trust receives funding from<strong>Watercare</strong>, it operates independently. Thetrust has the ability to grant remissionsto residential customers who meet itseligibility criteria and are deemed to bestruggling to manage their water and/orwastewater costs.In 2011/12, 150 customers were registered<strong>with</strong> the Water Utility Consumer AssistanceTrust. To date, 52 customers have hadhardship relief approved by the trust.We have also continued refining ourcentralised contact centre. Here, at oursingle point of contact for all calls to<strong>Watercare</strong>, we are now seeing consistentlyhigh levels of service against service targets,such as response to incidents, notification ofshutdowns, correspondence and complaints.In the lead-up to 1 July 2012, we preparedfor the implementation of monthly billing.Shifting the billing frequency to monthly – alarge project which meant reconfiguringa number of systems all at the sametime – is a business change that has beenimplemented because it benefits both ourcustomers and <strong>Watercare</strong>.Customer feedback had indicated thatmanaging home budgets would be easier ifthey received a bill every month, rather thana large bill every quarter or six months. Andfrom a business perspective, while monthlybilling adds some initial cost to <strong>Watercare</strong>,this change – along <strong>with</strong> the company’sgradual shift to electronic billing – willalso create savings over time, helping thebusiness to minimise water and wastewatercharges to our customers.SustainabilityOur commitment to protecting theenvironment is embedded in our businessand operations. The company is focused ondelivering services that balance the needsto provide critical infrastructure to a growingregion, while also ensuring our operations andservices are delivered in a sustainable way.This year, having employed a full-timeSustainability Manager, we began expandingour corporate sustainability programme,capitalising on the work done by the<strong>Watercare</strong> ‘Zero Waste’ group. We are alsopartnering <strong>with</strong> EcoMatters Environment“Our commitment to protecting the environment is embeddedin our business and operations.”Trust to help our domestic customers achievewater savings at home, and continuing otherexternal sustainability initiatives while alsoplanning new ones <strong>with</strong>in <strong>Watercare</strong>’s newsustainability framework.Examples of our sustainability activities thisyear include the following:• Our core business sustainability impactssuch as:• internal power generation, whichin 2011/12 met more than 30% of<strong>Watercare</strong>’s total energy through biogasengines and hydro generation fromwater supply dams• projects such as the Hunua No.4Watermain and Central Interceptor,which will provide for population growth• direct community engagement whichenables <strong>Watercare</strong> to integratecommunity needs into projectdevelopment• Through the Adopt A Stream programme,our dedicated educator helped nearly 6000students learn about water and its vital role<strong>with</strong>in our environment• The <strong>Watercare</strong> Harbour Clean-Up Trustcontinued overseeing the removal of litterfrom Auckland’s habours and promoting theconcept of rubbish-free waterways• In close consultation <strong>with</strong> iwi and AucklandCouncil, work is underway on PuketutuIsland to rehabilitate its 40 hectares ofquarried land <strong>with</strong> biosolids from theMangere Wastewater Treatment Plant.Preparation for building the biosolidsplacement area has begun and the site isscheduled to be operational in October2013. Over time, as the site is graduallyrehabilitated, more and more land will berelinquished back to Auckland Council andopened to the public. On completion of thequarry rehabilitation in 35 year’s time, thewhole island will be available as publicopen space.Although the tragic accident that took thelife of our colleague Philomen Gulland andseriously injured Ian Winson, James Millard andHarry Barnett was recorded in last year’s AnnualReport, the event is so strongly embedded inour memories that it just seems too prematureto consign it to history. Since the accident,<strong>Watercare</strong> has supported the families ofPhilomen and Ian and we’ve also endeavouredto aid the recovery of Ian, James and Harry.We are pleased that they are making steadyprogress. The Department of Labour is takingproceedings against <strong>Watercare</strong>.As we move into the second half of 2012,I am heartened by the progress we have madeas a business, and the commitment showndaily by all our staff in providing high-qualitywater and wastewater services to the peopleof Auckland.K M FordChief ExecutivePAGE 14 chief executive’s reportReturn to contents page
<strong>Watercare</strong> Services Limited2012 ANNUAL REPORTgovernance<strong>Watercare</strong> is a wholly owned subsidiary of Auckland Council (theShareholder). The Board of Directors (the Board) and management of<strong>Watercare</strong> remain committed to ensuring that the company applies bestpracticegovernance policies and procedures. The Board is ultimatelyresponsible for all decision making by the company.Operational responsibility is delegatedto the Chief Executive by way of a formaldelegated authority framework. The Boardcomprises eight independent, non-executivedirectors. Their profiles and disclosures ofinterests are published on page 10. Directors,including the chair, are appointed by theShareholder.1. ACCOUNTABILITYShareholderThe Board is appointed by the Shareholderto govern <strong>Watercare</strong> in accordance <strong>with</strong>the statutory obligations and in accordance<strong>with</strong> the agreed Statement of CorporateIntent (SCI).The SCI sets out the activities to beundertaken by <strong>Watercare</strong> and specificeconomic, social and environmentalobjectives for the company. It establishesperformance targets which are used tomeasure the company’s performance.<strong>Watercare</strong> must consult <strong>with</strong> the Shareholder,Local Boards, the Maori Statutory Board andthe public during the development of theSCI. The Shareholder’s comments regardingthe draft SCI were presented to the public atone of <strong>Watercare</strong>’s public Board meetings.Prior to the Board adopting the draft SCIin 2011/12, the public was invited to theBoard meeting on 26 May 2011 to considerShareholder comments on the SCI.<strong>Watercare</strong> delivered the 2011/12 SCI tothe Shareholder on 30 June 2011, and thedocument is available on the companywebsite www.watercare.co.nz.Performance<strong>Watercare</strong> is required by legislation toreport quarterly to Auckland Councilthrough the Accountability andPerformance Committee. The performanceof the company against the measures inthe SCI is reported to the Board monthlyand to the Shareholder quarterly. Thisannual report records performanceof the company against non-financialperformance measures included in the SCI.The non-financial performance measuresare set out on pages 113-115. A wider setof measures including social, economic,environmental and selected SCI measureshave been grouped under eight headingsand the performance of the companyagainst these is reported on pages 24-61.These measures are selected to reflect theperformance of the integrated companyacross a broad base.2. TRANSPARENCY AND OPENNESSLegislative framework<strong>Watercare</strong> is a limited liability companyregistered under the Companies Act 1993,and a local government organisation.The Local Government Acts of 1974 and2002 define the role and duties of localgovernment organisations in New Zealand.The legislative framework enabling andgoverning <strong>Watercare</strong>’s operations as theregional provider of water and wastewaterservices in Auckland is largely found inthree Acts and amendments:1. Local Government (Tamaki MakaurauReorganisation) Act 20092. Local Government (Auckland Council)Act 20093. Local Government (AucklandTransitional Provisions) Act 2010The company’s obligations to deliver waterand wastewater services for Auckland areestablished under Part 5 section 57(1) ofthe Local Government (Auckland Council)Act 2009 which stipulates that an Aucklandwater organisation:(a) must manage its operations efficiently<strong>with</strong> a view to keeping the overallcosts of water supply and wastewaterservices to its customers (collectively)at the minimum levels consistent<strong>with</strong> the effective conduct of itsundertakings and the maintenance ofthe long-term integrity of its assets; and(b) must not pay any dividend ordistribute any surplus in any way,directly or indirectly, to any owner orshareholder; and(c) is not required to comply <strong>with</strong> section68(b) of the Local Government Act2002 (avoiding the requirement to pay adividend); and(d) must have regard for public safety (forexample, the safety of children in urbanareas) in relation to its structures.Also under the legislative framework:• the company became a Council ControlledOrganisation on 1 July 2012, and mustremain a CCO of Auckland Council at leastuntil 30 June 2015• at least two Board meetings a year arerequired to be held in public; before 30June to consider the Council’s commentson the draft SCI, and after 1 July to considerthe company’s performance under the SCIin the previous year• the company’s financial statements, theSCI and specified long-term plans must beaudited by the Auditor–General, or by anauditor acting on behalf of theAuditor–General.Company goals and strategiesThe goals and strategies for <strong>Watercare</strong> areset as part of the process of developing theSCI in association <strong>with</strong> the Shareholder and<strong>with</strong> approval by the <strong>Watercare</strong> Board ofDirectors. The process follows the receipt ofthe Mayor of Auckland’s letter of expectationwhich includes the vision and objectives forAuckland and the outcomes sought by theAuckland Plan. A draft SCI is then preparedby <strong>Watercare</strong> as the basis of consultation<strong>with</strong> the Shareholder which identifies therelationship between <strong>Watercare</strong>’s activityand delivery of the outcomes sought bythe Mayor and those specified <strong>with</strong>in theAuckland Plan. Prior to final adoption bythe Board, comment on the final draft SCIis invited from Local Boards, the MaoriStatutory Board and key stakeholders. Thisyear, <strong>Watercare</strong> hosted a joint workshopbetween the Board and Auckland Councilcouncillors to discuss water and wastewaterstrategy as a precursor to the developmentof a new water strategy, as required as partof the Auckland Plan.Return to contents pagegoverence PAGE 17
<strong>Watercare</strong> Services Limited2012 ANNUAL REPORT<strong>Watercare</strong>’s objectives are closely aligned <strong>with</strong>those of Auckland Council, Local Boards and keystakeholders such as tangata whenua.Of special importance are the Local Boardswhich represent local communities undera co-governance model <strong>with</strong> the AucklandCouncil governing body. <strong>Watercare</strong>maintains purposeful relationships <strong>with</strong> theLocal Boards chairs and members arrangedthrough a dedicated company executivewhich ensures flexible, transparent andtimely communication and ready access tomeaningful information. The relationshipand channels of communication recognisethe diverse needs of Local Boards andcommunities and the varying level ofinterest in <strong>Watercare</strong>’s services and projects.Performance of the Board and ChiefExecutiveThe performance of the Board is reviewedby the Shareholder annually, both inrelation to the Board as a whole and thecontribution of its individual members.Board remuneration is determined by theShareholder. The performance of the ChiefExecutive is reviewed annually by the Board.Transparency in reporting<strong>Watercare</strong> remains committed totransparent reporting. Recognising this, thecompany publishes:• an annual Statement of CorporateIntent (SCI)• an annual Financial Plan• annual and long-term Asset ManagementPlan (AMP)• an annual report that reports performanceagainst the SCI, non-mandatory measures,and the United Nations’ Global ReportingG3 Initiative guidelines (see page 116)• an overview of current water storage levelsand other information published weekly• special reports and project newsletters forinterested parties.The Board agenda, papers and minutes ofthe previous meeting are made available inadvance of the Board meeting through thecompany website.Below: Members of the <strong>Watercare</strong> Board of Directors visit Ardmore Water Treatment Plant: from left,Tony Lanigan; Catherine Harland; Susan Huria; Ross Keenan (Chairman); and Jeff Todd; <strong>with</strong> StuartUrquhart, Operations Controller and Gil Miers, Treatment Plant Manager.Setting standards of conduct for staff<strong>Watercare</strong> demands the highest standardsof behaviour from its staff. All policiesgoverning the conduct of employees arepublished on the company’s intranetincluding: Business Conduct and EthicsPolicy, Gift and Inducement Policy Conflictof Interest Policy, Control of DiscretionaryExpenditure and Protected DisclosuresPolicy. All contracts managed by staffmust be in writing. The policies also setout the delegated authority <strong>with</strong>in thecompany. <strong>Watercare</strong>’s projects are subjectto internal probity reviews, and externalprobity auditors are appointed to provideadditional assurance on major projects.Complaints disclosureAny complaints against the company andthe quality of response are recorded. Targetshave been set for the management ofthese processes and the level of serviceis reported in the Annual Report, to theShareholder quarterly, to the Board monthlyand are made public at the board meetingsand published on <strong>Watercare</strong>’s website.WhistleblowingThe company has a specific policy toreceive and deal <strong>with</strong> information aboutany serious wrong-doing <strong>with</strong>in thecompany, as required by the ProtectedDisclosures Act 2000. <strong>Watercare</strong>’s policyprescribes how its <strong>Watercare</strong> staff andothers report matters of serious wrongdoing,and provides contacts to whom suchreporting can be made. The policy definesserious wrong-doing and applies to presentand past employees, and to any individualeither seconded to or working on a contractbasis for <strong>Watercare</strong>.3. INTEGRITYCorporate governance charterThe charter defines the duties andobligations of the Board and Boardmembers covering fiduciary duty, duty ofcare, diligence, legal and statutory dutiesand conflicts of interest. It incorporatesthe principles of the New Zealand Instituteof Directors’ Code of Proper Practice forDirectors, relevant sections of thePAGE 18 GovernanceReturn to contents page
<strong>Watercare</strong> Services Limited2012 ANNUAL REPORT<strong>Watercare</strong>’s Board of Directors applies its specialistknowledge through subcommittees such as the Audit andRisk Committee and the Capital Projects Review Group.New Zealand Exchange Limited (NZX)Corporate Governance Best Practice Codeand the Securities Commission’s nineprinciples of corporate governance.Disclosures of interestA register of directors’ interests ismaintained by <strong>Watercare</strong> and is updatedas and when necessary. Directors’ interestsare a standard agenda item at every Boardmeeting. Any disclosure of interest isrecorded in the meeting minutes and theparticipant refrains from taking part inthe discussion or voting on any relatedresolution. In 2011/12, Board membersdisclosed a potential conflict of interest ontwo occasions.Audit and Risk CommitteeThe Board is responsible for appointing themembers of the Audit and Risk Committee.The committee’s role is to assist the Boardto fulfil its responsibilities in the areasof financial reporting and to provideassurance regarding compliance <strong>with</strong>internal controls, policies and procedures.Its responsibilities are established in theAudit and Risk Committee Charter whichis reviewed annually. The committee hasno delegated authority. In carrying out itsduties, the committee meets regularly <strong>with</strong>the external and internal auditors (both <strong>with</strong>and <strong>with</strong>out management present) and themanagement of the company. At least onemember must have accounting or financialmanagement expertise. The chairman of theBoard may not be chairman of the Audit andRisk Committee. The current chairman of theAudit and Risk Committee is Jeff Todd. All<strong>Watercare</strong>’s directors receive the papers ofthe Audit and Risk Committee inadvance, and all are invited to attendcommittee meetings.Organisation CommitteeFollowing completion of the integrationprocess the Board established anOrganisation Committee to provide a linkbetween the Chief Executive and the Boardaround senior staff remuneration andorganisational development. The committeeconsists of two Board members: Susan Huriaas Chair, and Ross Keenan. The Committeeprovides a reference point for the ChiefExecutive in matters around organisationalchange and succession planning.Capital Project Review GroupThe Capital Projects Review Group (theGroup) is chaired by a member of the<strong>Watercare</strong> Board of Directors, currentlyDavid Clarke, and includes other Boardmembers and senior management asrequired. The Group is responsible forreviewing the process and formulation ofthe company’s Asset Management Plan(AMP), including a review of the businessdrivers and prioritisation methodologyincluded <strong>with</strong>in the AMP framework. TheGroup also reviews the capital planningand expenditure process, the projectreporting framework and the developmentof specific strategic projects. Papers that<strong>Watercare</strong> Governance Planning Cycle*approvalFinal ShareholderDraft SOI negotiated and revisedSO Ia do pt e dTariffs set andFunding PlanapprovedAprMart i o nFebMayl t aJunJanare reviewed by the Group are circulatedto all Board members and all members ofthe Board of Directors can attend Groupmeetings. All major capital projects requireapproval of the full Board.Regular independent reviews<strong>Watercare</strong> subjects its planning,operations and reporting to review byindependent consultants on a regularbasis. This year, the Board and the Auditand Risk Committee received reportsfrom specialist advisers on risk andcontrol issues to inform the maintenanceand development of good practice andprocedures. The company is committedto a culture of continuous improvementand seeks independent feedback fromspecialist advisers as necessary to achievethis objective.f c o n s uAnnual Repo r tand PlanbeginsFinancialprocessA s s e t M a n a g e m e n tSOI ProcessAsset Management PlanFinancial Planning ProcessAnnual Report* From 1 July 2012, <strong>Watercare</strong> will produce a Statement of Intent (SOI) rather than an SCI.DecJulAugNovr i fSepOctT aShareholderpresentationtariff-settingPl a nof expectationreceivedMayoral letterTariff options preparedS O Id r a f tp r e p a r e dReturn to contents pageGovernance PAGE 19
<strong>Watercare</strong> Services Limited2012 ANNUAL REPORTSuzanne Naylor, OperationsHeadworks Engineer,and Anin Nama, NetworkManager Operations, <strong>with</strong><strong>Watercare</strong> Board membersat Cosseys Dam in theHunua Ranges.4. STEWARDSHIPIndemnity and insurance<strong>Watercare</strong> has executed a deed ofindemnity <strong>with</strong> each director whichindemnifies the director in accordance<strong>with</strong> the company’s constitution, andgrants certain rights in respect of access todocuments and the maintenance of liabilityinsurance cover.Board meetingsThe Board had seven Board meetingsscheduled during the year. In addition, itsmembers met three times in workshopsto allow the Board to progress matters ofpolicy to finality. The matters discussedwere later dealt <strong>with</strong> at Board meetingsonce the policies and strategies werefinalised. At two meetings the publicwas invited to provide feedback (one onperformance for the previous year and theother on the SCI for the following year).The Board invites the public to attend allpublic sessions of Board meetings.Risk management<strong>Watercare</strong>’s framework for risk identification,measurement and reporting is welldeveloped, and meets the requirements ofthe Australian and New Zealand Standard4360. There are regular external reviewsto ensure the company meets and exceedsgood-practice measures in risk management.As part of the risk management framework,the company has established a Risk SteeringCommittee which meets six times per yearto monitor emerging risk and risk-mitigatingactions and strategies. The committeecomprises the Chief Executive, seniormanagement, the internal auditor andthe risk manager. Risks that have seriousconsequences are in turn directly monitoredby the Board, <strong>with</strong> updates presented toeach Board meeting.External auditorThe Auditor-General is the auditor of thecompany’s financial statements. The Auditor-General has appointed Jamie Schmidt,using the staff and resources of Deloitte,to undertake the external audit work onbehalf of the Auditor-General, in accordance<strong>with</strong> the Auditor-General’s Audit Standards,which incorporate New Zealand AuditingStandards. Deloitte has no relationship<strong>with</strong> the company outside of the audit andrelated assurance activities. This satisfies theindependence requirements of the Auditor-General and the Institute of CharteredAccountants of New Zealand.Regulators<strong>Watercare</strong> is subject to regulation in planning,health and environmental matters. Theprincipal regulators include Auckland Council,Waikato Regional Council and the Ministry ofHealth. The company also engages <strong>with</strong> thesebodies by providing input on the impacts ofexisting and proposed policy and regulationon <strong>Watercare</strong>’s activities.Advisory groups<strong>Watercare</strong> has a standing consultative andadvisory committee, the EnvironmentalAdvisory Group that comments on companyplans and projects in 2011/12. TheEnvironmental Advisory Group comprisesexperts who advise on how the company’sactivities impact on the environment. Inaddition, <strong>Watercare</strong> is developing a newMaori advisory group, the Mana WhenuaForum, which will advise <strong>Watercare</strong> onhow its plans and operations impact onMaori and on the relationship between thenatural environment and Maori. The reportof the Environmental Advisory Group and asummary of the new Mana Whenua Forumcan be found on pages 22 and 23.Other stakeholders<strong>Watercare</strong> consults extensively <strong>with</strong>the Shareholder, the Accountability andPerformance Committee, environmentalregulators, special interest groups andadvisory groups. Considerable effortis also put into engaging <strong>with</strong> partiesand communities likely to be affectedby the activities of the company in theirneighbourhood. The performance of<strong>Watercare</strong>’s performance is very closelymonitored in terms of the level and qualityof the service provided to both customersand the community. The level of service isreported to the Board monthly and to theShareholder on a quarterly basis.Official information requestsIn 2011/12, <strong>Watercare</strong> received 12 requestsunder the Local Government OfficialInformation and Meetings Act 1987.The average response rate was 7.3 days.Board Member Attendance2011/12Date Appointed Date Retired Attendance at Boardmeetings/workshopsAttendance at Audit& Risk CommitteeAttendance at CapitalProjects Working GroupRoss Keenan (Chairman) March 2010 10/10 4/5 4/4David Clarke (Deputy Chairman,Chair Capital Projects Working Group)July 2008 10/10 4/4Mike Allen Dec 2011 4/5 0/1Susan Huria July 2008 9/10Peter Drummond March 2010 7/10 4/4Jeff Todd (Chairman, Audit & Risk Committee) May 2007 10/10 5/5Catherine Harland May 2011 10/10 5/5Tony Lanigan May 2011 9/10 4/4Pat Snedden Dec 2002 Dec 2011 5/5 3/3PAGE 20 GovernanceReturn to contents page
<strong>Watercare</strong> Services Limited2012 ANNUAL REPORT<strong>Watercare</strong> at worklocal boardrelationshipsLocal Boards are a key part of Auckland’s governance, enabling localrepresentation and decision-making on behalf of local communities.There are 21 Local Boards throughout the Auckland region fromRodney to Franklin.Pictured left to right: Central Interceptor Project Manager Mike Sheffield discusses the project <strong>with</strong> Albert-Eden Local Board members and Council Parks staff;contractors installing new water filtration equipment at the Pukekohe Water Treatment Plant; Planning Manager Belinda Petersen talks <strong>with</strong> local residentsat a Central Interceptor community open day.<strong>Watercare</strong> recognises the important roleof Local Boards in local decision-makingand community representation, and hasworked to build purposeful relationships<strong>with</strong> the board chairs and membersbased on flexible, transparent and timelycommunication.An operational engagement plan has beendeveloped, agreed and is in place <strong>with</strong> theLocal Boards to help facilitate the workingrelationship. This is supported by a dedicatedstaff executive who works to help maintainthe relationships and communication flows.The nature of <strong>Watercare</strong>’s relationship <strong>with</strong>various Local Boards varies due to the rangeof issues, local priorities and varying levelsof community interest. To date, the majorityof Local Board engagement has focused onareas where there is significant activity orpublic interest. However, the major premisefor all Local Board communication has been afree flow of information regarding issuesof mutual interest consistent <strong>with</strong> a nosurprises approach.Notable activities over the past 12 monthshave been <strong>with</strong> Rodney Local Board inengaging <strong>with</strong> the Helensville communityto obtain resource consents for thewastewater treatment plant, and <strong>with</strong> theKumeu, Huapai and Riverhead communityto prepare for new wastewater connections.Similarly, <strong>Watercare</strong> has communicated<strong>with</strong> the Franklin Local Board and keystakeholders during installation of the new$14 million Pukekohe local watermain.Local Boards in the central area haveprovided <strong>Watercare</strong> <strong>with</strong> constructivefeedback on works in local parks associated<strong>with</strong> the proposed Central Interceptorproject, and feedback from the boards wasincorporated into five public open daysheld along the proposed route.<strong>Watercare</strong> has also worked <strong>with</strong> the LocalBoards to help increase understandingof the Auckland-wide network dischargeconsent application which will build onthe work previously undertaken on theNorth Shore in authorising and managingwet-weather overflow impacts on sensitivereceiving environments.<strong>Watercare</strong>’s issues that impact LocalBoards are diverse and varied, and requirea variety of approaches. The company willcontinue to remain flexible and responsivein working <strong>with</strong> Local Boards to best meettheir individual needs.In the coming 12 months, <strong>Watercare</strong>will look to build on the excellentfoundation established and remainresponsive to the needs of Local Boards inrepresenting the interests of their diverselocal communities.Return to contents pagelocal board relationships PAGE 21
<strong>Watercare</strong> Services Limited2012 ANNUAL REPORTEngagement<strong>with</strong> tangatawhenuaMana Whenua Forum<strong>Watercare</strong> has recently consulted <strong>with</strong> hapu and iwi fromthroughout Tamaki Makaurau on their preferred form ofengagement <strong>with</strong> <strong>Watercare</strong>. Following a series of hui(meetings), a resolution was passed to establish aMana Whenua Forum in conjunction <strong>with</strong> <strong>Watercare</strong>.Hapū and iwi in Tāmaki Makaurau have agreed to sign aRelationship Agreement <strong>with</strong> <strong>Watercare</strong>. The Forum willcomprise designated representatives from eachMana Whenua entity.The Relationship Agreement has been designed topromote partnership, protection, and focused action.An associated Charter has been prepared which includesthe following principles:• Relationship Building – Building understanding andenhancing the relationship between mana whenuaand <strong>Watercare</strong>• Integrity – Ensuring cultural integrity and respect• Opportunities – Identifying opportunities of mutual interestand benefit• Best practice – Advising on best practices for meeting<strong>Watercare</strong>’s cultural, environmental, social and economicresponsibilities• Efficiency – Establishing efficient, collective processes forbuilding the relationship and engagement.Māori Advisory GroupThe Māori Advisory Group (MAG) was established in 2001 inrecognition of the stewardship role of Māori in relation to thesupply of water services in the Auckland region. The group’s rolewas to provide advice to <strong>Watercare</strong> from a Māori perspectiveon <strong>Watercare</strong>’s response to national and local policy and plansand the development of <strong>Watercare</strong>’s infrastructure projects.In addition, the MAG provided guidance to <strong>Watercare</strong>’s seniormanagers on cultural issues and facilitated relationship buildingand understanding between <strong>Watercare</strong> management and iwi.The MAG was not established to represent the different ManaWhenua groups, but rather to advise <strong>Watercare</strong> on mattersrelating to iwi, including how to approach and relate to themana whenua groups. Recent projects the MAG has providedadvice on include the Hunua No. 4 Watermain project, theCentral Interceptor project, wastewater network consents andthe management of biosolids.<strong>Watercare</strong> acknowledges and thanks the members of theMāori Advisory Group for their contribution to <strong>Watercare</strong> overthe last decade by assisting management in understandingMāori culture and protocols, the implications of the Treaty ofWaitangi, the history of the region from an iwi perspective, thevalue of water to Māori, and the significance of kaitiakitanga(guardianship and conservation). In particular, <strong>Watercare</strong> wishesto recognise the MAG Chairman, Bill Kapea, for his long-standingcommitment and support to <strong>Watercare</strong> and the MAG over years.The Māori Advisory Group members were:ChairmanWilliam KapeaMembersNorma Rae ArlidgePaul BrownGeorge KahiKowhai OlsenPita PouLucile RutherfurdHeta TobinPamera Warner<strong>Watercare</strong> wishes to thank Tame Te Rangi forhis contribution as Mana Whenua ForumInterim Chair.Return to contents pageengagement <strong>with</strong> tangata whenua PAGE 23
<strong>Watercare</strong> Services Limited2012 ANNUAL REPORTpercentageSedimentation beds atArdmore Water TreatmentPlant, where settlementof suspended solids takesplace as part of the watertreatment process.77FoCuSFoCuS66FoCuSFoCuS88 FoCuSFoCuSFoCuS 5FoCuS 5percentage100959085807570656055504540353025201510100959085807570656055504540353025201510FoCuSFoCuS44FoCuS 1FoCuS 1FoCuSFoCuS22FoCuSFoCuS33Overall scorefor focus arEA97 %See page 5<strong>Watercare</strong> is on schedule to complete a $22 million upgrade ofthe company’s Ardmore Water Treatment Plant which will provideadditional capacity and increased security of water supply toAucklanders. The upgrade works will enhance the plant’s ‘RapidRestart’ capability, reducing any disruption of Auckland’s watersupply following operational interruption. In addition, improvedsolids-handling systems will improve long-term capacity andprovide additional environmental protection against potentialoverflows. Contractors have already completed de-sludging,drainage and pipe-strengthening activities on site, and work iscontinuing on construction of overflow chambers and earthworks.Anin Nama (r), Operations Manager Networks,and Stuart Urquhart (l), Operations Controller,surveying the sedimentation beds at ArdmoreWater Treatment Plant.Return to contents pagesafe and reliable water PAGE 25
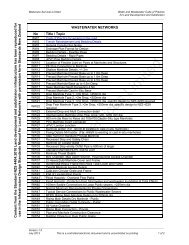
<strong>Watercare</strong> Services Limited2012 ANNUAL REPORT1safe andreliablewater1a. Percentage of drinking water treated in <strong>Watercare</strong>’s plants that are graded ‘A’ by the Ministry of Health.Target: 100% by 2020.TARGET 100%10 20 30 40 50 60 70 80 90 1002012 SCORE92%Water quality has been maintained based on the 2010 grading assessment carried out by the Auckland District HealthBoard on behalf of the Ministry of Health 1 . All the metropolitan water treatment plants that supply the bulk of drinkingwater to the people in the Auckland region meet the ‘A’ grade standard.201192%Of the smaller non-metropolitan plants transferred to <strong>Watercare</strong> on 1 November 2010, nine remain ungraded. <strong>Watercare</strong>is continuing <strong>with</strong> a programme of work to ensure all plants meet the ‘A’ grade standard by 2020, at a capital cost of $100million for both water treatment plants and the distribution network.1b. Percentage of drinking water distributed through the <strong>Watercare</strong> network that is graded ‘a’ by theMinistry of Health. Target: 100% by 2020.TARGET 100%10 20 30 40 50 60 70 80 90 1002012 SCORE89%The same risk-based assessment used for water treatment plants also applies to the pipes and pump stations that makeup the water distribution networks. The metropolitan network is graded ‘a’ under the Ministry of Health’s standardsand supplies the bulk of the drinking water to the people in the Auckland region. Of the 15 non-metropolitan networks(inherited on 1 November 2010), three are ‘a’ graded, three are ‘b’ graded and nine are ungraded. <strong>Watercare</strong> has set inplace a programme to ensure that all the networks meet the ‘a’ grade standard by 2020.201189%1c. Percentage performance against Statement of Corporate Intent target: quality of drinking water.Target: 100% by 2020.TARGET 100%10 20 30 40 50 60 70 80 90 1002012 SCORE100%<strong>Watercare</strong> fully met the Ministry of Health’s Drinking Water Standards for New Zealand (DWSNZ), at Ministry ofHealth-graded water treatment plants (Ruler 1a). The DWSNZ standards are based on a quality assurance approach,underpinned by the requirement to develop public health risk-management plans. Information on DWSNZ is availableat www.moh.govt.nz\water.2011100%1The next grading assessment is due in the last calendar quarter of 2012.PAGE 26 safe and reliable waterReturn to contents page
<strong>Watercare</strong> Services Limited2012 ANNUAL REPORTSupporting informationFig. 1 Water and wastewater factsFig. 8 Grading of water treatment plants and networksFig. 9 Drinking water qualityFig. 10 Typical analysis of Auckland’s drinking waterFig. 11 Water supply interruptionsFig. 12 Water supply restorationFig. 13 Water quality complaintsKEYTarget metTarget not metGood performancebut could do betterPresentation of rulerupdated from 20111d. Percentage performance against Statement of Corporate Intent target: service interruption to customerconnection ratio. Target: less than 10 per 1,000 connections.TARGET 100%10 20 30 40 50 60 70 80 90 1002012 SCORE100%<strong>Watercare</strong> monitors the number of times the water supply to its customers is disrupted as a measure of reliability of service.The SCI target is set at achieving fewer than 10 interruptions per 1,000 connections for the year. The result for the year from1 July 2011 was 5.8, which was well <strong>with</strong>in the target.2010 2011100% 100%1e. Percentage performance against Statement of Corporate Intent target: service restorationfollowing unplanned shutdowns. Target: greater than or equal to 90%.TARGET 90%10 20 30 40 50 60 70 80 90 1002012 SCORE100%<strong>Watercare</strong> has a target of restoring greater than 90% of unplanned water shutdowns <strong>with</strong>in 5 hours. The result for the 2011/12period was 98%, achieving the target.2011100%1f. Percentage performance against Statement of Corporate Intent target: unaccounted–for water loss.Target: less than 17.7million m 3 per year.TARGET 100%10 20 30 40 50 60 70 80 90 1002012 SCORE100%<strong>Watercare</strong> operates a continuous process of identifying, assessing and addressing water losses from its system that cannot beaccounted for. For 2011/12 the volume of unaccounted-for water from the <strong>Watercare</strong> system was 15.2 million m³ against atarget of less than 17.7 million m³, achieving the target.2011100%1g. Percentage performance against Statement of Corporate Intent target: water quality complaints.Target: less than 5 complaints per 1,000 connections.TARGET 100%10 20 30 40 50 60 70 80 90 1002012 SCORE100%<strong>Watercare</strong> monitors the number and type of water quality complaints received from customers. The result of 4.1 complaints per1000 connections covering taste, odour and appearance per 1,000 connections was lower than the target of 5 per year.201188%Return to contents pagesafe and reliable water PAGE 27
<strong>Watercare</strong> Services Limited2012 ANNUAL REPORT<strong>Watercare</strong> at workCost-effective investment providing clearerdrinking water for Pukekohe customers<strong>Watercare</strong> inherited the Franklin WaterTreatment Plant facilities on 1 November2010, and quickly began a retrofit upgradeproject to address a number of complaintsfrom Pukekohe customers about ongoingdiscolouration of local drinking water. Priorto the plant upgrade, naturally occurring ironand manganese particles in the bore waterwere reacting to the addition of chlorineas part of the treatment process, causing aslight (completely non-hazardous) orangetint in some Pukekohe residents’ treatedtap water.In mid-2011 <strong>Watercare</strong>’s Water SupplyProcess Engineering group began pilottesting of additional filtration systemsat Pukekohe to address the waterdiscolouration, a problem unique to thelocal water supply. Water Supply OperationsManager Shayne Cunis says that <strong>Watercare</strong>worked <strong>with</strong> contractor Canadian PacificLimited to reach a solution to the problemwhich utilises three containerised membranefiltration units. The containerised units weredesigned so that when they are no longerrequired at Pukekohe they can be relocatedand stored for emergency use, such asproviding a treated water supply in the eventof a natural disaster.The containerised membrane filtrationunits re-use several high-quality filtrationmembranes that had become available aspart of <strong>Watercare</strong>’s expansion project atthe Waikato Water Treatment Plant. Thisapproach allowed the company to reducethe overall equipment costs of the projectsignificantly, <strong>with</strong>out compromising on thequality of water treatment.The filtration process now in use at Pukekoheadvances the oxidation reaction <strong>with</strong>in thewater treatment plant, removing the ironand manganese solids by way of a filtrationbarrier and allowing <strong>Watercare</strong> to providePukekohe residents <strong>with</strong> vastly improveddrinking water. Shayne says the project wascompleted in January 2012, and <strong>Watercare</strong>has since seen a significant reduction inthe number of water quality complaintsfrom Pukekohe customers. “Since thecompletion of this project we’ve noticed ahuge reduction in the number of ‘dirty water’complaints being received from Pukekohecustomers, from almost 50 per month in late2010 to virtually none in 2012,” he says.Shayne explains, “<strong>Watercare</strong> is workingon a permanent long-term solution whichaddresses Pukekohe’s requirement foradditional water supply due to populationgrowth. We’re currently constructing a newwater supply pipeline which will drawPukekohe drinking water from the WaikatoTreated Watermain, and this is scheduled foroperation by June 2013.”Process Engineer Jeremy Booth says thePukekohe membrane plant project is justone aspect of <strong>Watercare</strong>’s innovativeapproach to upgrading the company’s watertreatment facilities in the Franklin district.“We’ve made a substantial investment intoautomated, online monitoring of watertreatment facilities in Franklin, which meanswe’re able to keep an eye on water qualityfrom our centralised control room and actquickly if there’s a problem.”Jeremy adds that at a number of smallerlocal facilities – such as the water treatmentplant at Glenbrook Beach – <strong>Watercare</strong> hasinstalled UV treatment systems, and thesehave been very successful in helping toprovide local communities <strong>with</strong> safe andreliable drinking water.Pictured left to right are:Process Engineer Jeremy Booth,Southern Area Water SupplyManager Gil Miers, and SeniorProcess Engineer Tom Surreyon site at <strong>Watercare</strong>’s PukekoheMembrane Plant.PAGE 28 safe and reliable waterReturn to contents page
<strong>Watercare</strong> Services Limited2012 ANNUAL REPORTWater Utility Consumer Assistance Trust establishedto help support at-risk Auckland consumers<strong>Watercare</strong> established the Water UtilityConsumer Assistance Trust in late 2011 <strong>with</strong>the purpose of providing “financial support tocustomers of <strong>Watercare</strong> who are struggling tomanage their water and/or wastewater costs.”The trust has been granted a nominal budgetof up to $1 million per year. The Trust reliesheavily on advice from budgeting centresincluding the Otara, Otahuhu, Mangere andAuckland Central budgeting services. TheTrust has its own secretary and operates in afully independent manner.Customers (including tenants) are alertedto the trust via the <strong>Watercare</strong> credit team;our Customer Centre; in overdue accountreminder letters; on the <strong>Watercare</strong> and Trustwebsites www.waterassistance.org.nz; and viabudget advisory service and Citizens’ AdviceBureau offices.Trust results as of July 2012:• 150 <strong>Watercare</strong> customers registered<strong>with</strong> the Trust• 52 applications granted – total value$41,192Trustees:• John Lusk (chairman)– retired senior commercial lawyer(<strong>Watercare</strong> Services Limited appointee)• Dr Bruce Hucker (deputy chairman)– former Deputy Mayor of Auckland City(<strong>Watercare</strong> appointee)• Anne Candy– former Deputy Mayor of Manukau City(Maori Women’s Welfare League appointee)• Lauren Godsiff– Auckland City Mission appointee• Maureen Little– Presbyterian Support Services appointee<strong>Watercare</strong> Harbour Clean-Up Trust24,015,910Total estimated individualpieces of litter collected fromAuckland waterways sincethe Harbour Clean-Up Trust’sinception in December 2002,based on an average of8 individual pieces of trashper litre.3,001,989 litresVolume of litter collected sincethe inception of the HarbourClean-Up Trust across theAuckland region.2,076,320Total estimated individualpieces of litter collected fromAuckland waterways in the yearJuly 2011 – June 2012, basedon an average of 8 individualpieces of trash per litre.2923.5 hoursTime worked by the <strong>Watercare</strong>Harbour Clean-Up Trust duringthe year July 2011 – June 2012.16,342.5 hoursTotal number of volunteer hourswhich assisted the <strong>Watercare</strong>Harbour Clean-Up Trust duringthe year July 2011 – June 2012.<strong>Watercare</strong> is the principal sponsorof the <strong>Watercare</strong> Harbour Clean-Up Trust, which works to removelitter from Waitemata Harbourand the gulf islands. Central to theTrust’s activities is ‘The Phil Warren’boat, pictured here alongside theAuckland Ferry Terminal.Return to contents pagesafe and reliable water PAGE 29
<strong>Watercare</strong> Services Limited2012 ANNUAL REPORT2 HealthyWaterwaysManagement of wastewater discharges to maintainor improve the health of the environment.Maintaining the health of Auckland’s valuable harbours,estuaries, beaches and islands remains a fundamental partof <strong>Watercare</strong>’s role in the community. The company’s 20wastewater treatment plants and network of wastewaterpipes continue to treat the majority of Auckland’swastewater to a very high standard, helping to protect thehealth of Auckland’s waterways.<strong>Watercare</strong> closely monitors all wastewater discharges,dry-weather sewer overflows, unplanned sewerinterruptions, and rates for responding to urgentwastewater blockages.In 2011/12 <strong>Watercare</strong> performed at an extremely highlevel against the company’s performance targets andconsent conditions.PAGE 30 healthy waterwaysReturn to contents page
<strong>Watercare</strong> Services Limited2012 ANNUAL REPORTInfrastructure ProjectsManager Dave Shepherd onsite during construction atThe Concourse, <strong>Watercare</strong>’snew 13-million-litrewastewater overflowfacility in Henderson.77FoCuSFoCuS66FoCuSFoCuS88FoCuSFoCuSFoCuSFoCuS55percentagepercentage100100959590908585808075757070656560605555505045454040353530302525202015151010FoCuSFoCuS44FoCuS 1FoCuS 1FoCuS 3FoCuS 2FoCuS 3FoCuS 2Overall scorefor focus arEA99 %See page 5Return to contents pagehealthy waterways PAGE 31
<strong>Watercare</strong> Services Limited2012 ANNUAL REPORTKEY2healthywaterwaysSupporting InformationFig. 14 Resource consent complianceFig. 15 Wastewater treatment plant dischargeFig. 16 Treated wastewater standardsFig. 17 Overflows from wastewater systemsFig. 18 Wastewater network interruptionsFig. 19 Wastewater network restoration performanceTarget metTarget not metGood performancebut could do betterPresentation of rulerupdated from 20112a. Percentage of wastewater discharged compliant <strong>with</strong> consent conditions (excluding minor or non-technical).Target: 100%.TARGET 100%10 20 30 40 50 60 70 80 90 1002012 SCORE97%<strong>Watercare</strong> achieved a 97% level of overall compliance <strong>with</strong> consent requirements at its wastewater treatment plants on avolumetric basis, excluding minor and technical breaches. Compliance <strong>with</strong> consents at the major urban wastewater treatmentplants was 99% against a target of 100%. The non-compliance reported this year was due to illegal trade waste discharge and anoff-site power failure, circumstances beyond <strong>Watercare</strong>’s control. There were several transient periods of technical or minor noncompliance1 at the Mangere Wastewater Treatment Plant during the year. An upgrade programme has been implementedto address this situation.The remaining non-compliance levels were influenced by the poor performance of some of the rural wastewater treatment plantstransferred to <strong>Watercare</strong> by legacy councils upon integration. These plants performed at 64% against a target of 65% by 2015,and a target of 100% compliance by 2020. The company has developed a longer-term strategy and more immediate measures,forecast to cost $50 million, to reduce the impacts of these plants on the environment.201197%2b. Percentage performance against Statement of Corporate Intent target: dry-weather sewer overflows.Target: less than or equal to 15 per 100km of pipe length.TARGET 100%10 20 30 40 50 60 70 80 90 1002012 SCORE100%<strong>Watercare</strong> reports on the number of wastewater overflows from its retail network during dry weather as a measure of the abilityof the network to manage current demand. The result for the 2011/12 year was 2.3 overflows per 100km of wastewater pipe,well <strong>with</strong>in the target.2011100%2c. Percentage performance against Statement of Corporate Intent target: unplanned sewer interruptions.Target: less than 10 per 1,000 properties.TARGET 100%10 20 30 40 50 60 70 80 90 1002012 SCORE100%The number of unplanned wastewater network interruptions as a result of breaks and chokes is a measure of the integrity of thesystem. The result for the 2011/12 year was 6.4 incidences, which was <strong>with</strong>in the target.2011100%2d. Percentage performance against Statement of Corporate Intent target: response rate for urgentwastewater blockages. Target: <strong>with</strong>in agreed contracted standards.TARGET 100%10 20 30 40 50 60 70 80 90 1002012 SCORE100%The 2011/12 SCI required <strong>Watercare</strong> to respond to all urgent wastewater blockages <strong>with</strong>in the standard agreed <strong>with</strong>contractors, 98% of the time. The target was achieved 99% of the time.201194%1For instance, a technical non-compliance might be late completion of documentation; minor non-compliance might be a single reading above a target, theimpact of which is total load based where there is no <strong>material</strong> impact on the environment. In each case, the regulator Auckland Council, is fully informed.PAGE 32 healthy waterwaysReturn to contents page
<strong>Watercare</strong> Services Limited2012 ANNUAL REPORT<strong>Watercare</strong> at work<strong>Watercare</strong> project to support urban growthin South Auckland passes major milestoneA $31.5 million project by <strong>Watercare</strong> tosupport urban growth in the suburbs ofManurewa, Takanini, Wattle Downs andPapakura has passed a major milestone,<strong>with</strong> a newly-constructed wastewater pumpstation and pipe extension going live.<strong>Watercare</strong>’s new high-capacity pumpstation has been built alongside the existingManurewa Pump Station in Wattle FarmReserve. Senior Engineer Paul Gowans saysthe old pump station, which was demolishedin June, was reaching the end of its servicelife. “The new pump station, which is thelargest of its kind in South Auckland, housesfour heavy-duty pumps,” explains Paul. “Italso provides 1.5 million litres of storagecapacity and will provide <strong>Watercare</strong> <strong>with</strong>improved operational flexibility forthe region.”Paul says the construction of the pumpstation was a major undertaking and wascarried out over a 19-month period betweenAugust 2010 and March 2012. “If you wereto look at the pump station from the outside,you would have no idea of its true scale.Inside, there is a major shaft that drops 14metres underground. At the bottom are thepumps, separated from the storage well by athick, reinforced concrete wall.”The pump station pushes wastewaterinto two major wastewater pipes: theSouthern Interceptor and the SouthwesternInterceptor. As part of the project-theSouthwestern Interceptor has been extendedby 4.2 kilometres from the pump stationto Roscommon Road. Paul says extendingthe Southwestern Interceptor has providedadditional wastewater network capacity forthe growth forecast in South Auckland, andprovides <strong>Watercare</strong> <strong>with</strong> greater flexibility forfuture maintenance work.The company adopted best-practiceconstruction methods throughout the projectto minimise the impact on the surroundingcommunity. For example, <strong>Watercare</strong> used atrenchless method to install the section ofpipe that runs beneath Mahia Road. By nothaving to excavate a deep trench, a two-wayflow of traffic and access to properties wasmaintained during the work.A tunnel-boring machine was used to installthe section of pipe beneath RoscommonRoad, again minimising the impact on thelocal community. One of the first custommademachines to be made in New Zealand,it worked from February to November2011, installing up to 15 metres of pipeper 12‐hour shift. The machine’s head cutthrough the earth, and soil was removedusing an underground conveyor belt andsmall locomotive.With the pump station and pipe extensionconstructed and demolition of the oldManurewa Pump Station complete, projectwork will now focus on reinstating the siteand planting vegetation at Wattle FarmReserve.This project is part of a programme of work<strong>Watercare</strong> has planned in support of urbangrowth in the area. Other work includesdiverting the Manurewa Branch Sewer andextending the Mahia Branch Sewer in Takanini.Southwestern Interceptor – project timeline:January 2009 toMarch 2010Project planningand designAugust 2010 toNovember 2011Constructionof gravitywastewater pipeAugust 2010 toNovember 2011Constructionof pressurewastewater pipeAugust 2010 toNovember 2011Constructionof pump stationDecember 2011 toMarch 2012Commissioning ofpump station andnew wastewaterpipesMay – July 2012Decommissioningand demolition of theold Manurewa PumpStationReturn to contents pagehealthy waterways PAGE 33
<strong>Watercare</strong> Services Limited2012 ANNUAL REPORT3Health,safety andwell-beingTo be an industry-best workplace.PAGE 34 health, safety and well-beingReturn to contents page
<strong>Watercare</strong> Services Limited2012 ANNUAL REPORTWater network contractorsreplace a water meter ata <strong>Watercare</strong> customer’sresidential property inEast Auckland.77FoCuSFoCuS66FoCuSFoCuS88FoCuSFoCuSpercentagepercentage10095 10090 9585 9080 8575 8070 7565 7060 6555 6050 5545 5040 4535 4030 3525 3020 2515 2010 1510FoCuS FoCuS 11FoCuSFoCuS33FoCuSFoCuS22Overall scorefor focus arEA98 %See page 5FoCuS FoCuS55FoCuSFoCuS44<strong>Watercare</strong> remains focused on recruiting, developingand retaining highly skilled people in all aspects of thecompany’s activities. The company maintains a long-termcommitment to industry-best health and safety practices,and to providing ongoing training and developmentopportunities to employees.<strong>Watercare</strong> employs a highly diverse and skilled workforcefrom a range of nationalities, ethnicities and backgrounds.In addition, all water and wastewater operational staffare actively encouraged to pursue formal qualifications.The company continues to provide a comprehensiveoccupational health service to all staff, including:medical consultation, influenza immunisation, mandatoryvaccinations for working in certain environments, skinchecks and rehabilitation programmes.Return to contents pagehealth, safety and well-being PAGE 35
<strong>Watercare</strong> Services Limited2012 ANNUAL REPORT<strong>Watercare</strong> at work<strong>Watercare</strong> monitoring shows continuingimprovements in Manukau Harbour’s water qualityMajor improvements in Manukau Harbour’swater quality have been achieved as a resultof substantial long-term investment at theMangere Wastewater Treatment Plant.<strong>Watercare</strong> completed a $450 millionupgrade of the Mangere WastewaterTreatment Plant between 1997 and2003, which included the largest harbourrestoration project ever undertaken inNew Zealand.The company’s Wastewater OperationsManager, Mark Bourne, says <strong>Watercare</strong>maintains a Manukau Harbour-specificwater quality monitoring programme,while Auckland Council monitors waterquality readings Auckland-wide throughits own monitoring programme. “There isnow more than 20 years of water qualitymonitoring data available which <strong>Watercare</strong>has analysed. We’ve been able to compareharbour water quality data before theMangere plant upgrade <strong>with</strong> test resultscollected since the completion of theupgrade.”Mark says <strong>Watercare</strong>’s monitoring oftreated wastewater concentrations atMangere has shown large reductions incontaminants in the 10 years since theupgrade was completed. These decreaseshave included:• A greater than 90% reduction inbiochemical oxygen demand, <strong>with</strong>improved levels of dissolved oxygen• A greater than 80% reduction insuspended solids• A greater than 75% reduction in totalnitrogen levels• A greater than 95% reduction inammoniacal nitrogen• A greater than 10,000 times reduction inenteric human virus numbers through theupgraded plant under most conditions,<strong>with</strong> a mean reduction of more than100,000 times• Reduced peak chlorophyll Aconcentrations and associated risk ofalgal blooms.In addition, concentrations of metalsin harbour sediments have decreasedsubstantially compared <strong>with</strong> levels foundwhen the old oxidation ponds were firstdecommissioned, and now meet guidelinevalues in the majority of cases. Residualorganic oxidation pond sludges havelargely stabilised or disappeared.Since the completion of the upgrade,<strong>Watercare</strong>’s observations of the harbourhave included:• No recorded toxic algal blooms (nonewere recorded before the upgradeeither, even when total nitrogen loads“Extensive upgrades have transformed the old Mangere plantinto a totally new-generation, multi-stage treatment facility”discharged were four times higher thanthey are now)• No recorded nuisance blooms• An approximate reduction of 55% inthe area of the harbour covered by themacroalga Gracillaria.The extensive upgrade transformed the oldMangere plant into a totally new-generation,multi-stage treatment facility. The plantitself no longer uses oxidation ponds totreat wastewater, instead using land-basedtreatment technology including reactorclarifiers and ultraviolet filtration. Themulti‐million-dollar plant upgrade included:• An intensive public consultation andconsent process• The removal of 500 hectares of oxidationponds, reuniting the original foreshore<strong>with</strong> the sea• The restoration of Oruarangi Creek andMangere Lagoon• The reinstatement of 13 kilometresof Manukau Harbour shoreline,reinstating native vegetation andnatural wildlife habitats.<strong>Watercare</strong>’s Coastal Walkway providesrecreational access to the culturallysignificant Mangere Ihumatao foreshore,and stretches seven kilometres fromAmbury Park to the Otuataua Stonefields.Substantial restoration of the ManukauHarbour bed has also now been completed,and further enhancements underwayinclude the rehabilitation of the formerquarry on Puketutu Island.Mark says <strong>Watercare</strong> remains stronglycommitted to continuing to protect theManukau Harbour, and in particular tocontinuing to maintaining the same levelsof public health protection for Aucklanders.In addition, <strong>Watercare</strong> will upholdcompliance <strong>with</strong> the limits on nitrogenload stipulated in the conditions appliedat the time discharge permits for theMangere plant upgrade were granted.These conditions, along <strong>with</strong> the removal ofthe old oxidation ponds, were put in placeto ensure that outcomes agreed <strong>with</strong> thecommunity would be met, specifically:• To ensure that the treated wastewatermeets appropriate standards forrecreational use and the taking ofshellfish (outside an agreed zone ofnon‐compliance)• To ensure that the proliferation ofundesirable biological growth as a resultof the discharge of nitrogen is avoided• To restore as much as possible of theformer harbour bed to its natural marineestuary condition.<strong>Watercare</strong> has committed to continue tomonitor and publicly report on ManukauHarbour’s water quality, to make sure thattreatment capacity is suitably expandedin response to the growing demandsof Auckland. The Mangere WastewaterTreatment Plant continues to meetappropriate environmentalperformance targets.PAGE 38 health, safety and well-beingReturn to contents page
<strong>Watercare</strong> Services Limited2012 ANNUAL REPORTMangere Wastewater Treatment Plant and PuketutuIsland. <strong>Watercare</strong> completed a $450 million upgradeof the Mangere Wastewater Treatment Plant between1997 and 2003, and water quality monitoring hassince shown continuing improvements in ManukauHarbour’s water quality.Return to contents pagehealth, safety and well-being PAGE 39
<strong>Watercare</strong> Services Limited2012 ANNUAL REPORT4 CustomersatisfactionProviding customers <strong>with</strong> great service and great value.<strong>Watercare</strong>’s customers interact <strong>with</strong> the company in avariety of ways, and <strong>Watercare</strong>’s customer service teamscontinue to play an essential role in the company’s deliveryof outstanding and affordable water services to Aucklanders.During the past 12 months, <strong>Watercare</strong> has achieved improvedoperational stability in the company’s customer servicefunctions, and has been building on achievements from 2011.The contact centre at East Tamaki is often a customer’s firstpoint of contact <strong>with</strong> <strong>Watercare</strong>, and continues to respond toup to 2,000 phone calls, letters and e-mails from customersevery day. Customers can now choose to use onlineself-service facilities and electronic billing options. Theseinitiatives are still being refined but have already generatedpositive feedback from those who prefer to interact <strong>with</strong><strong>Watercare</strong> in this way.PAGE 40 customer satisfactionReturn to contents page
<strong>Watercare</strong> Services Limited2012 ANNUAL REPORTpercentage77FoCuSFoCuS88FoCuSFoCuS100951009095859080857580707565706065556050554550404535403035253020251520101510percentageFoCuSFoCuS11FoCuSFoCuS22Overall scorefor focus arEA100 %<strong>Watercare</strong>’s East TamakiCustomer ContactCentre in action.6 6FoCuS FoCuSFoCuSFoCuS55FoCuSFoCuS44FoCuSFoCuS33See page 5Return to contents pagecustomer satisfaction PAGE 41
<strong>Watercare</strong> Services Limited2012 ANNUAL REPORT4 CustomersatisfactionSupporting InformationFig. 29 Customer satisfactionFig. 30 Grade of serviceFig. 31 Complaint types and response ratesFig. 32 Household affordabilityKEYTarget metTarget not metGood performancebut could do betterPresentation of rulerupdated from 20114a. Percentage performance against Statement of Corporate Intent target: customer satisfaction <strong>with</strong> waterand wastewater services. SCI target: 80% customer satisfaction.TARGET 100%10 20 30 40 50 60 70 80 90 1002012 SCORE100%<strong>Watercare</strong> achieved an 82.2% performance against the customer service target of 80%. Of the customers who contacted thecompany to report faults and were surveyed by independent researchers, 82.2% were satisfied – this being an overall score ofat least 7 out of a possible 9. In 2011, <strong>Watercare</strong> met its customer service target but this was not clearly evident in the reportedresults. <strong>Watercare</strong> has exceeded the customer service target in 2012, thereby achieving a performance score of 100%.201190%4b. Percentage performance against Statement of Corporate Intent target: grade of service.SCI target: 80% of calls answered <strong>with</strong>in 20 seconds.TARGET 100%10 20 30 40 50 60 70 80 90 1002012 SCORE100%Grade of service is an industry best-practice performance measure, aimed at ensuring 80% of calls are answered <strong>with</strong>in20 seconds. During the 2011/12 year, the grade of service target was met. Overall performance was 81.8%. First Contact(after-hours) calls were not included in the grade of service SCI. First Contact performance was 81.6%. For 2012, <strong>Watercare</strong>’sperformance is illustrated as a percentage of the target achieved. This differs from 2011, where our performance was illustratedagainst the Statement of Corporate Intent grade of service target. This year the company exceeded its target, thereby achievinga performance score of 100%.201187%4c. Percentage performance against Statement of Corporate Intent target: ‘closed’ complaints andenquiries. SCI target: 95% of complaints and enquiries ‘closed’ <strong>with</strong>in 10 days.TARGET100%10 20 30 40 50 60 70 80 90 1002012 SCORE100%The SCI target of ‘closed’ complaints and enquiries measures the time taken for an issue to be resolved and feedback given to thecustomer. A 10-day target is considered industry best practice. Performance was 99.7% for the 2011/12 period, against an SCItarget of 95%. Complaints performed at 96.4% and enquiries at 99.8%. Complaints (1355) made up 5.1% of the total enquiries(26,762). For 2012, <strong>Watercare</strong>’s performance is illustrated as a percentage of the target achieved. This differs from 2011, whereour performance was illustrated against the Statement of Corporate Intent target. This year the company exceeded its target,thereby achieving a performance score of 100%.201190%4d. Percentage performance against Statement of Corporate Intent target: household affordability.SCI target: water bill is less than 1.5% of the average Auckland household income.TARGET 100%10 20 30 40 50 60 70 80 90 1002012 SCORE100%The average monthly household water and wastewater bill from <strong>Watercare</strong> was $52.30 for the period 1 July 2011 to 30 June2012. Based on Statistics NZ’s average monthly household income in Auckland of $7,219, the bill represents 0.72% of theaverage household income.2010 2011100% 100%PAGE 42 customer satisfactionReturn to contents page
<strong>Watercare</strong> Services Limited2012 ANNUAL REPORT<strong>Watercare</strong> at workServices evolving to meet customers’ needs<strong>Watercare</strong> Networks EngineerMonique Furniss (right) talks<strong>with</strong> customer Verity Ricklanabout the water meter onVerity’s Oteha property.<strong>Watercare</strong>’s Customer Service ManagerPenelope Webster says the company isfocused on responding quickly and efficientlyto customers’ requirements, improvingconsistency of services and continuingto evolve to meet customers’ serviceexpectations. “By better understanding ourcustomers’ changing needs and experience ofour services we can focus on improvementsthat will make it easier for customers to deal<strong>with</strong> us, and help us to be proactive as wellas responsive.”The company’s customer-facing teams haveaccess to a range of intranet-based toolsdesigned to help them achieve this objective,including H2Know, a new information andknowledge resource which was successfullyintroduced during 2012. “H2Know has beena vital tool in our service delivery this year aswe responded to customers’ queries aboutthe new Auckland-wide water and wastewatertariffs and streamlining of invoicing cycles tomonthly billing,” Penelope says.As well as organisation-wide invoicing,financial management and customerdatabase management tools, <strong>Watercare</strong>staff utilise an Auckland-specific GeographicInformation System (GIS) <strong>with</strong> the ability tomap water and wastewater pipe networks,faults and meter locations in relation tocustomers’ Auckland property locations.<strong>Watercare</strong>’s Chief Services Officer TrishLangridge says the company has beenstriving to provide customers <strong>with</strong> moreself-service options. “This year we introducede-billing and website self-service optionsfor customers who prefer to interact <strong>with</strong>us online. Our customers have the choice toreceive their invoices electronically and makepayments, update their details or ask forassistance through our website.”Trish says <strong>Watercare</strong> has also taken stepsto introduce efficiencies in the collectionand storage of data, improve residentialand commercial customer invoicing, andsatisfactorily resolve greater numbers ofcustomer enquiries <strong>with</strong>out escalation.“We’ve also been supporting our contactcentre teams in expanding their ownknowledge and experience of <strong>Watercare</strong>’sactivities, and our role as a service providerto Aucklanders. All of this has contributedto a significant reduction in the number ofcustomer complaints being received by ourcustomer contact centre.”Return to contents pagecustomer satisfaction PAGE 43
<strong>Watercare</strong> Services Limited2012 ANNUAL REPORT5stakeholderrelationsTo be responsive to stakeholder requirements.PAGE 44 stakeholder relationsReturn to contents page
<strong>Watercare</strong> Services Limited2012 ANNUAL REPORTpercentage<strong>Watercare</strong> has beensupporting Auckland’s Roundthe Bays fun run since 1993.The company’s staff providerunners <strong>with</strong> fresh drinkingwater at water stations alongthe 8.4 kilometre route.7 7FoCuSFoCuS66FoCuSFoCuS88FoCuSFoCuSFoCuS 5FoCuS 5100951009095859080857580707565706065556050554550404535403035253020251520101510percentageFoCuSFoCuS44FoCuSFoCuS11FoCuSFoCuS3 3FoCuSFoCuS22Overall scorefor focus arEA95 %See page 5<strong>Watercare</strong> continues to work collaboratively <strong>with</strong> a widevariety of key stakeholders, including: our shareholderAuckland Council; Auckland Local Boards and communitygroups; residents and businesses; schools and educationalinstitutions; iwi and mana whenua groups; and other parties<strong>with</strong> interests in the company’s activities.As a major infrastructure business, <strong>Watercare</strong> has $1.4 billionof works underway across the Auckland region upgradingand developing new infrastructure. In 2011/12, notableengagements have included the Helensville communityduring the process of seeking resource consent for thelocal wastewater plant; the Kumeu, Huapai and Riverheadcommunity on the installation of new wastewater services;and five public open days held on the Central Interceptorwastewater tunnel project.Return to contents pagestakeholder relations PAGE 45
<strong>Watercare</strong> Services Limited2012 ANNUAL REPORTKEY5StakeholderRelationsSupporting InformationFig. 33 Community impact of operationsFig. 34 Public policy participationFig. 35 Rain Forest Express passengers and tripsFig. 36 Adopt A StreamTarget metTarget not metGood performancebut could do betterPresentation of rulerupdated from 20115a. Percentage performance against target: engaged shareholder.Target: 100% of shareholder engagement outcomes achieved.TARGET 100%2012 SCOREInvolvementin AucklandCouncilLong-TermPlanningprocessesincluding theLong TermPlan (LTP),AucklandPlan and theUnitary PlanConsultation<strong>with</strong> theshareholderand LocalBoardsduringdevelopmentof the regionalAssetManagementPlan (AMP)Consultation<strong>with</strong> theShareholderduring developmentofthe FundingPlanConsultation<strong>with</strong> theShareholder,and throughthem, Maori,and LocalBoards duringdevelopmentof theStatementof CorporateIntent (SCI)Quarterlyperformanceand progressreports sentto CouncilBriefingspresented toCouncil ona quarterlybasis or asrequestedCo-operation<strong>with</strong> CCOsmaintainede.g. jointinitiativesundertakento minimisepublicdisruptionLocal Board,ratepayer associationandcommunitymeetingsattendedLocal Boardplansreviewed andengagementplandeveloped,agreed andimplementedIwi StatutoryBoard andcouncil advisorygroupsengagedon relevantprojects201185%95%<strong>Watercare</strong> has worked closely <strong>with</strong> its shareholder Auckland Council todevelop key planning documents including the Auckland Plan, the plan todeliver Auckland’s vision of becoming the world’s most liveable city andthe Long Term Plan (LTP). The LTP is the shareholder’s, strategic planningdocument that represents the following 10 years’ investment to deliverthe outcomes of the Auckland Plan.<strong>Watercare</strong> supports the delivery of the shareholder’s outcomes throughthe development of a Statement of Corporate Intent (SCI), a documentthat sets out the governance arrangements between the company and theshareholder and by aligning investment through its Financial Plans andAsset Management Plan (AMP).Local Board relationships continued to develop significantly <strong>with</strong> theintroduction of an agreed engagement plan as <strong>Watercare</strong> strengthenedits working relationships <strong>with</strong> the Local Boards, keeping them informed ofprojects and decisions that affect their communities.<strong>Watercare</strong> is working <strong>with</strong> iwi authorities throughout Auckland toestablish the Mana Whenua Forum. The emergence of the forum resultedfrom a collective desire to engage <strong>with</strong> Maori proactively to buildrelationships and to enhance business efficiencies. The primary purposeof the forum is to develop creative, innovative solutions for water andwastewater strategies and projects throughout Auckland to ensure<strong>Watercare</strong> operates in a manner that enhances environmental, social, andeconomic values, whilst maintaining cultural integrity.The company also continues to be an active participant in thedevelopment of relevant legislation and policy initiatives and has madesubmissions on the following:• Tamaki Collective Claim on Volcanic Cones• Code of Practice for Utilities Access in the Transport Corridors• Building Act Amendment Bill• Proposed Waikato Regional Policy Statement.<strong>Watercare</strong> has continued also an active member of the Land andWater Forum.5b. Percentage performance against target: engaged communities.Target: 100% of communities’ engagement outcomes achieved.TARGET 100%2012 SCOREProjectrelatedpublic communicationundertakenProject liaisongroupsestablishedand communicationsupdated<strong>Watercare</strong>advisorygroupmeetingsundertakenAccess to<strong>Watercare</strong>facilities –Rain ForestExpressEducationinitiativesundertaken- Adopt AStreamPublicmeetingsheld to hearShareholderfeedback onthe SCI andto report onperformance<strong>Watercare</strong>Boardagendasand minutespublished onthe websiteWater-wiseadvertisementsandwater savingmessagespublishedTangatawhenuaengaged and,whereappropriate,relationshipagreementsdevelopedPublic GoodSponsorshipof the <strong>Watercare</strong>HarbourClean-UpTrust201195%95%As a major infrastructure company, <strong>Watercare</strong> has $1.4 billion of worksunderway across the Auckland region upgrading and developing newinfrastructure. The company has carried out a wide variety of engagement<strong>with</strong> residents, businesses, Local Boards, Auckland Council and other affectedparties. Notable engagements have included: the Helensville communityduring the process of seeking resource consent for the local wastewaterplant; the Kumeu, Huapai and Riverhead community on the installation ofnew wastewater services; and, most recently, the five public open days heldon the Central Interceptor wastewater tunnel project.<strong>Watercare</strong> runs an education programme – Adopt A Stream – offering primaryand intermediate school children lessons about water quality, the water cycle,conservation and the environment. In 2011/12, demand for lessons remainedhigh <strong>with</strong> 6,988 pupils participating. The Rain Forest Express, a narrow-gaugerailway built to service the Upper Nihotupu Dam around 1912, continues tobe a very popular attraction for tourists and locals.In addition, in 2011 the company became the principal sponsor of the<strong>Watercare</strong> Harbour Clean-Up Trust which has removed over 2.5 million litresof litter from Auckland’s harbours and waterways since it was establishedin 2002.PAGE 46 stakeholder relationsReturn to contents page
<strong>Watercare</strong> Services Limited2012 ANNUAL REPORT<strong>Watercare</strong> at workHelensville plant upgrade requiresa consultative approachPictured below: <strong>Watercare</strong> contractors installingmechanical aerators into oxidation ponds as partof upgrade works at the Helensville WastewaterTreatment Plant. Four new cage aerators werelowered into the wastewater treatment pond bycrane. The aerators will be fitted out and movedinto separate locations alongside the existing singleaerator inside the pond, to provide oxygen transferfor beneficial bacteria which treat the wastewaterand remove pollutants.<strong>Watercare</strong> has worked closely <strong>with</strong> AucklandCouncil and the Helensville local communityto achieve compliance <strong>with</strong> required effluentquality levels, and to resolve historicalresource consent issues <strong>with</strong> the Helensvillewastewater treatment plant inherited froma legacy local authority. The companyhas also begun the first in a series ofstaged upgrades at the plant to ensure thedischarge continues to meet environmentalstandards and projected increases in thelocal area population.<strong>Watercare</strong>’s Wastewater PlanningManager, Phil Jaggard, says <strong>Watercare</strong>commenced work to improve theperformance of the plant by de-sludgingit’s oxidation ponds in January 2011,and the installation of new mechanicalaerators which is now complete. “We’reanticipating the full completion ofdesign, upgrade works and complianceat Helensville by early 2014.” <strong>Watercare</strong>has worked closely <strong>with</strong> AucklandCouncil, Local Board members and thelocal community to obtain new resourceconsents for the plant, and facilityperformance levels are continuing toimprove. Phil says: “Now that the firstupgrades are in place, we will continueto monitor the performance of theplant, and in early 2013 we’ll reviewthe situation <strong>with</strong> regard to allowancefor new connections. It’s been pleasingto be able to work constructively andcollaboratively <strong>with</strong> Council for thebenefit of Helensville residents.”5c. Percentage performance: legal compliance.Target: 100% of shareholder engagement outcomes achieved.TARGET 100%2012 SCORECompliancerisk assessmentCompliancemonitoringCompliancecomparativeperformanceCompliancemanagementplanComplianceassuranceNo successfulprosecutionsagainst<strong>Watercare</strong>All potentiallegal issuesidentifiedAll legalissueseffectivelymanagedAll legalissuesmanaged andresolvedNo knownpending legalissues95%2011100%<strong>Watercare</strong> has many statutory obligations under a number of Acts andinvests a considerable amount of resources in complying <strong>with</strong> andmonitoring statutory requirements. Technical non-compliance <strong>with</strong>resource consents relating to the inherited non-metropolitan wastewatertreatment plants are reported under Ruler 2a on page 32.Following careful consideration, <strong>Watercare</strong> decided to defend healthand safety charges brought by the Department of Labour relating to theOnehunga explosion of June 2011. The matter is currently before the courts.In every other respect, the company achieved compliance <strong>with</strong> allstatutory obligations specified in the relevant Acts during the past year.Return to contents pagestakeholder relations PAGE 47
<strong>Watercare</strong> Services Limited2012 ANNUAL REPORT6sustainableenvironmentTo minimise and/or mitigate the adverse impact ofthe company’s operations on the environment.PAGE 48 sustainable environmentReturn to contents page
<strong>Watercare</strong> Services Limited2012 ANNUAL REPORTPictured below: <strong>Watercare</strong>Operations staff Dave Hodgsonand John Pattenwise trappingeels at Lower NihotupuReservoir. <strong>Watercare</strong> traps eelsin the company’s reservoirs andtransfers them downstream ofdams to reduce any impacts ontheir natural breeding lifecycle.77FoCuSFoCuS66FoCuSFoCuS88FoCuSFoCuSFoCuSFoCuS55percentagepercentage100959085807570656055504540353025201510100959085807570656055504540353025201510FoCuSFoCuS 4 4FoCuS 1FoCuS 1FoCuS 3FoCuS 2FoCuS 3FoCuS 2Overall scorefor focus arEA90 %See page 5<strong>Watercare</strong> is committed to providing water and wastewater servicesto Auckland using methods that are environmentally sustainable.The company seeks to maintain an environmentally acceptableapproach in all of its activities, including reducing greenhouse gasemissions, sourcing energy from internal sources, decreasing theamount of general waste ending up in landfills and promoting azero waste policy in recycling. <strong>Watercare</strong> is actively involved in thelong-term restoration and rehabilitation of Auckland’s harbours,beaches and islands, as well as community tree-planting days,wildlife protection programmes and sponsorship of not-for-profitcommunity groups such as the <strong>Watercare</strong> Harbour Clean-Up Trust.<strong>Watercare</strong>’s new Sustainability Manager, Roseline Klein, started<strong>with</strong> the company in February. Roseline’s role involves leading<strong>Watercare</strong>’s internal sustainability programme, as well asimplementing sustainability across the company’s activities andengaging <strong>with</strong> internal and external stakeholders.Roseline is closely involved in monitoring <strong>Watercare</strong>’s demandmanagement; mapping the company’s sustainability impact; andbuilding new projects to address these effects.Return to contents pagesustainable environment PAGE 49
<strong>Watercare</strong> Services Limited2012 ANNUAL REPORT6sustainableenvironment6a. Percentage performance against target: atmospheric CO 2emissions. Target: greater than 50% reduction,based on 1990 levels, by 2050.TARGET 100%10 20 30 40 50 60 70 80 90 1002012 SCORE100%<strong>Watercare</strong> calculates its greenhouse gas emissions including carbon dioxide (CO 2), methane and nitrous oxide which are largelygenerated from the treatment of wastewater. This year, the company maintained emitted greenhouse gas levels equivalentto 78% lower than in 1990. 75% is the company’s historic benchmark for performance in this area. This long-term targethas already been achieved. In previous years, <strong>Watercare</strong> exceeded its emissions target but this was not clearly evident in thereported results. <strong>Watercare</strong> again exceeded the emissions target in 2012, thereby achieving a performance score of 100%.2008 2009 2010 201185% 85% 85% 75%6b. Percentage performance against target: internally sourced energy. Target: 100%.TARGET 100%10 20 30 40 50 60 70 80 90 100<strong>Watercare</strong> aims to source 35% of all its energy requirements from internal sources, principally from generators burning biogasat its two largest wastewater plants, Mangere and Rosedale, and from five hydro-electric generators <strong>with</strong>in the water supplysystem. This year the company sourced 31% of its energy, achieving 89% of its target.201191%2012 SCORE89%6c. Percentage performance: recycling. Elimination of recyclable and compostable <strong>material</strong> in the generalwaste stream. Target: 100%.TARGET100%10 20 30 40 50 60 70 80 90 1002012 SCORE66%The zero-waste recycling programme aims to eliminate all general waste going to landfill. The immediate objective is toensure that all <strong>material</strong> that can be either recycled or composted is diverted from entering the general waste stream andending up in a landfill. In 2012 <strong>Watercare</strong> achieved 66% of its target. <strong>Watercare</strong> operates a three-bin system for general waste,recycling and organic <strong>material</strong>, which is used to feed the worm farms at each of our main facilities. The company has createda new Sustainability Manager role to champion Demand Management and Zero Waste and other programmes to help advance<strong>Watercare</strong>’s sustainable approach.2008 2009 2010 201175% 75% 70% 70%6d. Percentage performance against target: waste management.Treatment plant solid waste diverted from commercial landfills. Target: 95%.TARGET 95%10 20 30 40 50 60 70 80 90 1002012 SCORE84%<strong>Watercare</strong> aims to minimise the volume of <strong>material</strong> being sent to commercial landfills from its water and wastewater treatmentplants. To do this, the company is successfully using biosolids to rehabilitate a small part of the old oxidation ponds at theMangere Wastewater Treatment Plant, achieving 84% disposal this year. A key part of the future of this programme is thePuketutu Island project which gained regulatory approval this year and is a significant step towards achieving the target of 95%.201180%6e. Percentage performance against target: species preservation.Target: 100% of species preservation outcomes achieved.TARGET 100%2012 SCOREBird roostmanagementplanBirdpopulationsmonitoredAdequatebird roostcapacityMacroinvertebratemonitoringTroutmanagementplanFlushingflow release- southerndamsFish trap andhaul - southerndamsFish trap andhaul - westerndamsFish passagesover weirssoutherndamsFlushingflow release- westerndams100%2008 2009 2010 201180% 90% 100% 100%PAGE 50 sustainable environmentReturn to contents page
<strong>Watercare</strong> Services Limited2012 ANNUAL REPORT<strong>Watercare</strong> at workPuketutuIsland<strong>Watercare</strong>’s rehabilitation of a 40 hectare former quarry on Puketutu Islandis well underway. The 35-year rehabilitation is using clean fill and treatedbio-solids to restore the existing natural volcanic cone on the island in asustainable, socially and culturally responsible, and economically favourable way.Puketutu Island holds important historicaland cultural value for the Greater Aucklandregion, and in particular for iwi. Successfulnegotiations between Waikato-Tainui, localiwi, <strong>Watercare</strong> and the Kelliher CharitableTrust have resulted in an agreement todevelop Puketutu Island as a public openspace. The proposal has been approved bythe Environment Court.For <strong>Watercare</strong>, there is also a commercialreward. Without the availability of PuketutuIsland, the company would need to transportbio-solids produced at the MangereWastewater Treatment Plant to landfills aconsiderable distance from the plant, whichwould result in higher operating costs,potential safety issues and inconvenienceto neighbours. While the $23.9 millionpurchase price for the island lease – plusthe $2.00-per-tonne levy – is a considerableinvestment, there will be a saving of up to$22 million in real terms over the 35-year lifeof the project. This saving will be reflected infuture wastewater charges to customers.There is also a huge benefit for localresidents in Mangere, who will not haveto tolerate up to 30 trucks a day travellingthrough their neighbourhood <strong>with</strong> associatednuisances of noise, dust and road damage.In order to ensure benefits to all parties,the ownership agreement is quite complex.<strong>Watercare</strong> will lease the island for 55years and the Kelliher Charitable Trustwill transfer the freehold title to an islandtrust comprising three to nine membersrepresenting Waikato-Tainui, Makaurau andTe Kawerau. A marae and associated culturalfacilities will be constructed on an areaspecially designated for that purpose, andthe marae precinct will be freely accessible tothe people of Auckland and other visitors tothe island. Visitors will also be shown placesof historical and cultural significance.A governance trust comprising membersrepresenting the island trust, <strong>Watercare</strong>and Auckland Council (proposed), will:allocate funding for the marae construction,development of the island, scholarshipsfor education or training and employmentopportunities; as well as provide a forum toconsider issues relating to the island. Underthe agreement it is proposed that AucklandCouncil will take up a concurrent renewablelease <strong>with</strong> 999- year terms to guarantee thatPuketutu Island remains available to thepeople of Auckland in perpetuity.Under <strong>Watercare</strong>’s rehabilitation plan,stormwater on the island will be collectedand treated, and liners will be used to collectany leachate so that this can be returned tothe Mangere Wastewater Treatment Plantfor treatment.<strong>Watercare</strong> is committed to the long-termvision of making Puketutu Island accessibleto the people of Auckland as part of theregion’s enhanced recreational parksnetwork. The new regional park on PuketutuIsland will comprise 197 hectares, which islarger than Cornwall Park at 172 hectares.PAGE 52 sustainable environmentReturn to contents page
<strong>Watercare</strong> Services Limited2012 ANNUAL REPORT<strong>Watercare</strong> at workKawakawa Bay wastewater treatmentscheme providing environmental benefitsThe Kawakawa Bay Wastewater TreatmentScheme has now been successfully servingKawakawa Bay residents for over 12 months.Officially opened by Mayor of Auckland LenBrown and members of the Franklin LocalBoard in September 2011, the completionof the Kawakawa Bay scheme has been theresult of long-term co-operation between:residents; the former Manukau City Counciland Manukau Water Limited; iwi Ngati Paoaand Ngai Tai; contractor Fulton Hogan;<strong>Watercare</strong>; and Auckland Council.<strong>Watercare</strong>’s Southern Area WastewaterOperations Manager, Allan Twinch, says thecompletion of the scheme in Kawakawa Bayis an impressive achievement. “KawakawaBay now has: an extensive network ofunderground pipes and pits which conveythe wastewater from residents’ properties tothe treatment facility; an efficient and quietpump station; a sophisticated biologicaltreatment plant; and a 9000-cubic-metreseasonal lagoon that you barely notice evenwhen you’re standing next to it.”Allan says the wastewater treatment plant atKawakawa Bay, which uses a vacuum system,is working well and the the decommissioningof residents’ failing septic tanks is nowcomplete. With the volume of flow throughthe plant steadily increasing, <strong>Watercare</strong> hasbegun to make use of treated effluent asfertiliser into local forests via spray irrigation.Wastewater treatment and disposal inKawakawa Bay had historically been bythe use of private septic tanks. However, inthe early 2000s failing septic tanks wereconfirmed as a major source of stormwatercontamination. A number of factorscontributed to this situation, including: highgroundwater levels; the negligible capacityof shell and sand soils near the foreshoreto treat wastewater; the very poor soakagecharacteristics of the soil further inland;the lack of sufficient land area for effluentdisposal; and difficult terrain (a large, flatresidential area surrounded by steep, ruggedhill country).When monitoring revealed the scale of thepollution and the environmental and publichealth impacts in 2003, the former ManukauCity Council moved to address the problem.The Council initiated a wastewater schemePictured at the opening of the Kawakawa Bay Wastewater Treatment Plant are (clockwise from top):Andrew Baker, Chair, Franklin Local Board; Bill Cashmore, Franklin Local Board member; Jan Sinclair,Deputy Chair Franklin Local Board; Lynn Chatterton, Kawakawa Bay Community Association.“It’s encouraging to see the new Kawakawa Bay wastewaterscheme operating successfully, serving the local communityand helping to protect public health and the environment.”which aimed to overcome the complexengineering challenges involved, preventfurther beach and water contamination inKawakawa Bay, and allow the environment torecover and beach water quality to improve.Throughout the community consultationprocess, there was widespread support for alocal treatment plant <strong>with</strong> land disposal. Thescheme designed by the company which wasawarded the contract (Fulton Hogan) included:• Treatment plant and irrigation sites locatedat a reasonable distance from the mainsettlements• A ‘watertight’ vacuum system which preventsinflow and infiltration• A high level of treatment to ensure thatthe effects on the receiving environmentare minor• Treatment which includes pathogen removalto minimise any risks to public health• Insect control and odour and noise controlincorporated into the design.- Andrew Baker, Chair, Franklin Local BoardThe scheme was specifically designedto prevent further stream, beach and seacontamination, and allow the environment torecover naturally and water quality in the bayto gradually improve.Having taken over the development ofthe Kawakawa Bay scheme from theformer Manukau Water, <strong>Watercare</strong> is nowresponsible for overseeing the operation ofthe new facility and has been working closely<strong>with</strong> Fulton Hogan to resolve any issuesinvolved in making the system ‘go live’.Usage of the scheme began at 258Kawakawa Bay households – comprising1500 permanent residents andholidaymakers – and there are now around280 households connected to the scheme.The facility has the potential to serve3000 residents.Return to contents pagesustainable environment PAGE 53
<strong>Watercare</strong> Services Limited2012 ANNUAL REPORT7effectiveassetmanagementManaging assets to ensure the use of existing assets is maximisedwhile optimising the scope, timing and cost of new investments.PAGE 54 effective asset managementReturn to contents page
<strong>Watercare</strong> Services Limited2012 ANNUAL REPORT<strong>Watercare</strong> engineers ChrisAspinall and Axel Dumontoverlooking one of thenew water clarifiers at thecompany’s Waikato WaterTreatment Plant near Tuakau.77FoCuSFoCuS66FoCuSFoCuS88FoCuSFoCuSFoCuSFoCuS 5 5percentagepercentage100100959590908585808075757070656560605555505045454040353530302525202015151010FoCuSFoCuS44FoCuSFoCuS11FoCuS 3FoCuS 2FoCuS 3FoCuS 2Overall scorefor focus arEA95 %See page 5<strong>Watercare</strong> is on target to complete a three-year, $48 millionexpansion of the Waikato Water Treatment Plant by early 2013. Thecompany’s principal engineer for the project, David Ward, says theexpanded plant will help support the Auckland region’s continuedlong-term growth and increasing demand for high-quality treateddrinking water. “The expansion project significantly increases thecapacity of the Waikato plant by 50 million litres of treated drinkingwater per day, <strong>with</strong> provision to expand further by an additional25 million litres per day when the future demand is there. By utilisingworld-leading technology at the Waikato plant we’re able to stage theexpansion of the plant’s capacity as demand increases, all <strong>with</strong>outdisrupting the supply of drinking water to Auckland. The choiceof technology used at the plant also ensures that the expansionworks are contained <strong>with</strong>in the boundaries of the existing site, thusminimising impacts on the environment and respecting the culturalheritage of the local area.”Return to contents pageeffective asset management PAGE 55
<strong>Watercare</strong> Services Limited2012 ANNUAL REPORT7EffectiveAssetManagementSupporting InformationFig. 53 Capital expenditure programmeFig. 54 Infrastructure provided for public benefitKEYTarget metTarget not metGood performancebut could do betterPresentation of rulerupdated from 20117a. Percentage performance against Statement of Corporate Intent target: capital expenditure.Target: <strong>with</strong>in 20% of budget.TARGET 80%10 20 30 40 50 60 70 80 90 1002012 SCORE100%A significant focus for <strong>Watercare</strong> is to ensure an efficient delivery of planned capital work across the business. To achieve this,the company set a target that capital expenditure should be <strong>with</strong>in 20% of the approved financial budget. For 2011/12, theactual capital expenditure was 96.5%, <strong>with</strong>in 3.5% of budget and meeting the target fully.2011100%7b. Percentage performance against target: demand managment.Target: 100% of demand management outcomes achieved.TARGET 100%2012 SCOREImplementdemandmanagementin everydaybusiness at<strong>Watercare</strong>Progresstowards regionalwaterdemandmanagementtargetDevelopcost-benefitanalysis toolfor demandmanagementFuture supplyplanning balancescostbeneficialefficiencyoptionsWater lossstrategies andmanagementapproachesdevelopedUnderstandcustomerwater usepatternsPromotewaterefficientdevices andcommunicatewaterefficientmessagesWork <strong>with</strong>large waterusers toreducedemandWork <strong>with</strong>AucklandCouncil toreduce waterconsumptionUndertaketrials andpilot studiesto improvewaterefficiency201175%78%Future asset requirements are largely driven by demand for water. By developing and implementing demand managementprogrammes, <strong>Watercare</strong> aims to reduce or delay future capital expenditure. Implementation of the Regional Water DemandManagement Plan, developed last year has started. Progress towards the 15% reduction in per capita demand by 2025 has beenmade. Further projects will be developed in 2012/13 to carry on implementing the plan and engaging <strong>with</strong> stakeholders.7c. Percentage performance against target: maintenance management systems.Target: 100% (wholesale business management systems only).TARGET 100%2012 SCOREAll assetsrecorded inasset registerAssetsregister computerisedand availableto staffAssetfinancialinformationrecordedKey assetshaveassignedmaintenanceprogrammesMaintenanceprogrammesrecorded inasset registerMaintenanceprogrammebased oncriticalityMaintenanceundertakenaccording toplanMaintenancehistoryrecorded forkey assetsConsistentmaintenancepracticescompanywideMaintenanceprogrammeprioritisedusing RCM100%2008 2009 2010 201195% 100% 100% 100%Maintenance management systems have been enhanced <strong>with</strong> the implementation of enterprise asset management software (SAP).All wholesale asset information now resides <strong>with</strong>in this repository, facilitating the decision-making-process to determine whetherto repair/replace/rehabilitate an asset based on condition, cost, health and safety, the environment and operational impact.7d. Percentage performance against target: maintenance optimisation development.Target: 100% (wholesale business optimisation development only).TARGET 100%2012 SCOREDevelopmaintenancephilosophyDevelopaction planDevelopmaintenancevision andstrategyImplementmaintenancevision andstrategyEstablishworkflowmanagementEvaluateeffectiveness<strong>with</strong> keyperformanceindicators50% of RCMstrategyimplemented100% ofRCM strategyimplementedImplementworkflowmanagementComputerisedmaintenancemanagementsystem100%2008 2009 2010 201185% 90% 90% 95%Reliability-Centred Maintenance (RCM) is the framework for the wholesale business maintenance programme which forms afundamental part of the asset management programme. Implementation of the enterprise asset management software (SAP)has increased opportunities for optimisation following its seamless integration <strong>with</strong> RCM.PAGE 56 effective asset managementReturn to contents page
<strong>Watercare</strong> Services Limited2012 ANNUAL REPORT<strong>Watercare</strong> at workMajor Mangere plantimprovements now completePictured on site at <strong>Watercare</strong>’s MangereWastewater Treatment Plant are (left to right):Projects Manager John Heywood; SeniorProcess Engineer Sanjay Kumarasingham;Project Engineer Alan Brooks; and ProcessEngineer Jonathan Piggot.<strong>Watercare</strong> recently completed a major fiveyearoperational upgrade project on thesludge dewatering and conveying systemsat Mangere Wastewater Treatment Plantin response to forecasted growth in solidwaste levels from an increasing Aucklandpopulation. The project was initiated toresolve a number of operational obstacles,including breakdowns in existing plant.The upgrade involved the overhaul offour existing centrifuges on site and theinstallation of two new, large centrifugesin lieu of two of the old ones, to providean 80% increase in the plant’s capacity toprocess sludge. A new conveying system<strong>with</strong> a lime blender was constructed to addthe lime <strong>Watercare</strong> uses in the process ofconverting dewatered digested sludge intoenvironmentally sustainable bio-solids. Airextraction improvements on the enclosedscrew conveyors and lime mixer providebetter working environments for staff, andimproved odour control for local residents.For Aucklanders, the outcome of<strong>Watercare</strong>’s $6.14 million investment atMangere is a wastewater treatment servicethat’s now even more capable of meetingthe needs of a growing city.Return to contents pageeffective asset management PAGE 57
<strong>Watercare</strong> Services Limited2012 ANNUAL REPORTpercentageTreasury Manager Jason Isherwoodfinalises <strong>Watercare</strong>’s financial dataprior to reporting the company’smonth-end performance to theBoard of Directors.77FoCuSFoCuS6 6FoCuSFoCuS88FoCuSFoCuSFoCuSFoCuS551009590 10085 9580 9075 8570 8065 7560 7055 6550 6045 5540 5035 4530 4025 3520 3015 2510 201510percentageFoCuS 4FoCuS 4FoCuSFoCuS11FoCuSFoCuS33FoCuSFoCuS22Overall scorefor focus arEA97 %See page 5<strong>Watercare</strong> is required by regulation to manage its operationsefficiently <strong>with</strong> a view to keeping overall costs to customers(collectively) at minimum levels, while maintaining the longterm integrity of its assets. By law it cannot pay a dividend toits shareholder, Auckland Council. Sound financial management<strong>with</strong>in this context requires <strong>Watercare</strong> to procure its inputsand resources efficiently, control operating expendituresand maintain debt at prudent levels that optimise the cost ofcapital. In this way costs to customers can be held at minimumlevels. While financial management targets for the year wereeither fully met or were very close to being met, the financialmanagement challenge extends well beyond the last year.<strong>Watercare</strong> forward financial projections are incorporated intothe Auckland Council 2012-2022 Long Term Plan.Return to contents pagesound financial management PAGE 59
<strong>Watercare</strong> Services Limited2012 ANNUAL REPORTSupporting InformationKEY8 soundfinancialmanagementFig. 55 Major suppliers and contractorsFig. 56 Suppliers by spend and industryFig. 57 Interest rate performanceFig. 58 Ethics and business integrityFig. 59 Product information disclosureFig. 60 Product life cycle, health and safety impact assessmentFig. 61 Financial implications of climate changeTarget metTarget not metGood performancebut could do betterPresentation of rulerupdated from 20118a. Performance against Statement of Corporate Intent target: Funds from operations (FFO), ratio.Funds generated from operations as a ratio of interest cost. Target: higher than or equal to 2.5.TARGET 100%10 20 30 40 50 60 70 80 90 1002012 SCORE100%The funds from operations (FFO) to interest cover ratio for the year ending 30 June 2012 was 3.22, higher than the budgetfigure of 2.94 and the required target at a minimum of 2.50. Cost savings achieved during the year led to lower than budgetedoperating expenses and more than offset the reduced revenues arising from lower than projected water volumes. Interestexpense was also significantly below budget, due to a combination of lower than budgeted new borrowings and a lower thanprojected cost of funds.2008 2009 2010 201140% 100% 100% 100%8b. Percentage performance against target: savings through efficient procurement.Target: achieve efficiency savings outcomes.TARGET 100%2012 SCOREEstablishspendcategoriesfor benchmarkingandreportingDevelop andimplementa categoryreview planDevelopprocurementsystemsfor marketreviewImplementprocess forreviewingand monitoringpreferredsuppliersAchieve savingsof 0.5%of operatingexpenditureAdopt aprocurementpolicy for useof preferredsuppliersAchieve savingsof 1%of operatingexpenditureAchieve savingsof 1.5%of operatingexpenditureAchieve savingsof 2%of operatingexpenditureImplementprocurementplanningprocess98%2008 2009 2010 201165% 90% 95% 95%In total, savings of $3.5 million were achieved in 2011/12 exceeding the target of $3 million. All of Government Agreementsdelivered significant savings in IT, office consumables and fleet purchases. All of Government Agreements are centralisedcontracts for the supply of selected common goods and services purchased across government agencies. Other significantsavings were achieved in the chemical category, bio-solids disposal and meter reading services. All other targets were achieved<strong>with</strong> the exception of implementing a procurement planning process which will be formalised in 2012.8c. Percentage performance against target: interest rate percentage.Target: Treasury benchmark of 5.52%.TARGET 100%10 20 30 40 50 60 70 80 90 1002012 SCORE99%<strong>Watercare</strong> locks-in long-term interest rate cover to provide certainty over future funding costs. This makes it difficult to achieveperformance against a short term benchmark. Despite this, the company’s actual weighted average interest rate excludingcredit margins and fees at 5.57 per cent was only marginally above the 5.52 per cent benchmark.2008 2009 2010 2011100% 90% 50% 100%8d. Percentage performance against target: actual operating expense.Percentage performance against budget. Target: 5% below budget.TARGET 100%10 20 30 40 50 60 70 80 90 1002012 SCORE90%<strong>Watercare</strong> is required to minimise operating costs and seeks to achieve actual operating expenses of at least 5% below budget.For 2011/12, the company achieved an actual operating expense that was 4% below budget as a result of labour cost savings,lower asset operating costs and reduced other costs including professional fees and general overheads.2008 2009 2010 201175% 75% 95% 100%PAGE 60 sound financial managementReturn to contents page
<strong>Watercare</strong> Services Limited2012 ANNUAL REPORT<strong>Watercare</strong> at workLaboratory team anticipatingstrong future growth<strong>Watercare</strong>’s LaboratoryServices team comprisesover 80 people and ispoised for further growth.<strong>Watercare</strong>’s Laboratory Services businesshas recently completed a significantexpansion programme and is poisedfor further growth during the next fiveyears. The company operates a stateof-the-artlaboratory facility in Mangerewhich specialises in providing water andenvironmental testing services – as wellas air quality monitoring expertise – bothinternally to <strong>Watercare</strong> operational teams,and externally to corporate clients whichinclude industrial companies, regulatoryauthorities and government agencies.<strong>Watercare</strong> recently completed a majorexpansion of the laboratory operation’sorganic chemistry department, and has alsointroduced new Labware software whichprovides a platform for future growth andwill allow the laboratory team to bettermeet clients’ needs. The laboratory employsmore than 80 people and is made up ofsix analytical departments: microbiology;inorganic chemistry; organic chemistry;general chemistry; air quality; andsampling logistics.<strong>Watercare</strong>’s Commercial Services ManagerIan Shand says the Laboratory Services teamcarries out 870,000 analyses on over102,000 samples each year, as well ascontinuously monitoring air quality forclients at a number of sites throughoutNew Zealand. “Recently we’ve been doing aconsiderable amount of work <strong>with</strong> clients toprovide specialised testing services in theareas of National Environmental Standards(NES) monitoring, odour and wastewateranalysis, large roading projects andindustrial discharge monitoring”. Ian addsthat the Auckland laboratory currentlytests drinking water for over one third ofNew Zealand’s population, and is one of thefew laboratories in the country that isaccredited for water sampling services.“We’re proud of what we’ve achievedalready, and we’re preparing for furthersignificant growth in the future.”Ian says that the Mangere laboratoryoperates 365 days per year, and thatbusiness continuity is of utmost importanceto the laboratory operation’s clients.<strong>Watercare</strong> has invested in emergencyback-up facilities which include a powergenerator, a water reservoir and off-siteemergency laboratories.Return to contents pagesound financial management PAGE 61
<strong>Watercare</strong> Services Limited2012 ANNUAL REPORTEnvironmentalResourcesManagementERM Independent Assurance Report to <strong>Watercare</strong> Services LimitedERM New Zealand Limited (ERM) was engaged by <strong>Watercare</strong> Services Limited (<strong>Watercare</strong>) to provide independent assurance of selected non-financial data contained<strong>with</strong>in <strong>Watercare</strong>’s 2012 Annual Report, to the scope of work outlined below.Our BriefWe were asked to provide external independent assurance as to whether the <strong>material</strong> data and disclosures contained <strong>with</strong>in the following sections of the<strong>Watercare</strong> 2012 Annual Report were appropriately reported:• Performance Rulers relating to: Safe & Reliable Water Supply; Healthy Waterways; Health, Safety and Wellbeing; Customer Satisfaction; Stakeholder Relations;Sustainable Development; and Effective Asset Management.• Data contained <strong>with</strong>in the ‘Sustainability Impacts of Company Activity’ section.• Global Reporting Initiative (GRI) G3 Application Level A+ requirements.The scope excluded data and statements relating to financial information as well as data that had been assured in 2011 and not changed for the 2012 Annual Report.Data reported <strong>with</strong>in the 2012 Statement of Service Performance and duplicated <strong>with</strong>in the 2012 Performance Rulers detailed above have been assured by<strong>Watercare</strong>’s financial auditors and have consequently also been excluded from the scope of ERM’s assurance.Our ApproachWe delivered our work in accordance <strong>with</strong> ERM’s assurance methodology, which is based on the following international assurance and audit standards: ISAE 3000,ISO14064-3, and ISO 19011.We planned and performed our work to obtain all the relevant information and explanations that we believe were necessary to gather sufficient evidence to providea basis for our assurance conclusions as to whether the reported information and data set out in the ‘Our Brief’ were appropriately reported i.e. that nothing has cometo our attention through the course of our work that the data are <strong>material</strong>ly mis-reported (limited assurance).Our assurance activities included:• Face-to-face interviews at corporate level to understand and test the processes in place for reporting non-financial data and underlying data management system.This was followed up <strong>with</strong> a review of relevant documentation;• Review of the presentation of information relevant to the scope of our work in the report to ensure consistency <strong>with</strong> our findings.Respective Responsibilities and ERM’s Independence<strong>Watercare</strong> was responsible for preparing the 2012 Annual Report, including the collection and presentation of data and statements <strong>with</strong>in it. The ERM team, led byTracey Ryan, Managing Partner, ERM New Zealand, was responsible for expressing assurance conclusions in line <strong>with</strong> the scope of work agreed <strong>with</strong> <strong>Watercare</strong>.During 2011/12, ERM did not work <strong>with</strong> <strong>Watercare</strong> on other consulting engagements.Our ConclusionOn the basis of its scope of work, and in consideration of the assurance engagement brief and approach presented above, ERM concludes that in all<strong>material</strong> respects, the above selected sustainability performance data for 2011-12 are appropriately presented in the report. The report also adheresto the GRI G3 Application Level A+.Key FindingsBased on the scope of work, and <strong>with</strong>out affecting our assurance conclusion, ERM identified the following key findings:• The recruitment of a dedicated Sustainability Manager during the reporting year demonstrates <strong>Watercare</strong>’s on-going commitment to corporate sustainability as wellas to addressing the key operational issue of user demand management.• A large portion of the mechanisms used to gather data used <strong>with</strong>in the Annual Report are integrated electronic systems that help to minimise the potential fordata inaccuracies and calculation/transposition errors. While we are satisfied <strong>with</strong> the final data presentations, we have discussed <strong>with</strong> management potentialimprovements to the process for compiling data tables in the annual report.ERM congratulates <strong>Watercare</strong> on its 2012 Annual Report.ERM New Zealand Ltd,20 August 2012,Auckland, New ZealandERM New Zealand Limited (ERM) is an independent global provider of environmental, social and corporate responsibility consulting and assurance services. ERM has prepared this statement for<strong>Watercare</strong> Services Limited in accordance <strong>with</strong> ERM’s standard terms and the standard practised by members of the environmental consulting profession performing this type of service at the sametime. No other warranty, express or implied, is given by ERM as a result of the provision of this statement. To the extent permitted by law, this statement is provided for informational purposesonly, <strong>with</strong>out the right to rely, and ERM will not be liable for any reliance which may be placed on this statement by a third party. This statement may not be used by any third party <strong>with</strong>out ERM’sexpress written permission.PAGE 62 vErification reportReturn to contents page
<strong>Watercare</strong> Services Limited2012 ANNUAL REPORTFinancialreport2012Contents<strong>Watercare</strong>’s Rain ForestExpress railway continuesto be a hugely popularattraction for both touristsand Auckland families.Historical financial summaryand key statistics 64Financial commentary 66Responsibility for the financial statementsand statement of service performance 71Report of the Auditor-General 72Financial statementsStatement of Comprehensive Income 74Statement of Financial Position 75Statement of Cash Flows 76Statement of Changes in Equity 77Statement of Comprehensive Incomeby business unit 78Statement of Financial Positionby business unit 79Statement of Cash Flows by business unit 79Statement of Accounting Policies 80Notes to the financial statements1. Revenue 852. Price adjustment 853. Operating expenses 864. Depreciation and amortisation 865. Finance costs 866. Revaluation of derivativefinancial instruments 877. Operating cash flows 878. Income tax expense 889. Deferred tax liability 8910. Issued capital 8911. Subsidiaries and Integrationof retail business 9012. Revaluation reserves 9213. Property, plant and equipment 9414. Intangible assets 9715. Inventories 9916. Trade and other receivables 9917. Prepaid expenses 9918. Trade and other payables 9919. Accrued expenses 10020. Provisions 10021. Borrowings 10122. Financial assets and liabilities 10323. Related parties 10924. Commitments 11025. Contingencies 11126. Retirement benefit plans 11127. Remuneration 11128. Events occurring after balance date 111Statutory informationEmployees’ remuneration range 1122011 Statement of Service PerformanceEnvironmental care 113Health, safety and well-being 113Stakeholder relationships 113Customer service commitment 114Asset management 114Economic performance 114Customer services performance 115G3 cross-reference table 116Index 120Glossary 120Return to contents page2012 financial report PAGE 63
<strong>Watercare</strong> Services Limited2012 ANNUAL REPORTHistorical financial summary and key statisticsAS AT 30 June 20122003 2004 2005* 2006 2007 2008 2009 2010 2011 2012$000 $000 $000 $000 $000 $000 $000 $000 $000 $000FINANCIAL PERFORMANCEOperating revenue 163,627 165,240 166,628 167,899 168,983 167,345 184,629 198,116 373,107 441,950Price adjustment – (15,711) (10,000) – – – – – – –Operating expenses 137,628 133,470 137,713 144,070 159,196 165,763 170,427 189,002 361,273 436,998Operating surplus before: 25,999 16,059 18,915 23,829 9,787 1,582 14,202 9,114 11,834 4,952Loss on disposal and provisionfor redundant property,plant and equipment andother restructuring costs (3,287) (3,102) (3,254) (1,026) (7,719) (4,793) (11,589) (6,140) (6,162) (8,517)Contributions towards costof constructing property,plant and equipment ** – – – 610 3,790 1,428 259 1,111 – –Revaluation of derivativefinancial instruments – – (2,673) 2,561 3,021 (3,222) (16,599) (20,483) (13,567) (60,618)Decommissioning ofoxidation ponds (2,770) – – – – – – – – –Operating surplus/(deficit)before tax 19,942 12,957 12,988 25,974 8,879 (5,005) (13,727) (16,398) (7,895) (64,183)Current tax 1,611 2,478 (25) 2,079 (28) – – – – –Deferred tax 10,516 8,508 4,303 7,909 3,639 (2,208) (3,363) 11,311 4,438 (18,878)Net surplus/(deficit) after tax 7,815 1,971 8,710 15,986 5,268 (2,797) (10,364) (27,709) (12,333) (45,305)FINANCIAL POSITIONNon-current assetsProperty, plant and equipment 1,569,273 1,571,546 1,585,453 1,959,687 1,977,280 2,025,034 2,357,369 2,413,113 7,688,196 7,730,309Intangibles *** – – – 13,539 18,429 18,844 16,375 14,374 30,229 39,554Investments 14,425 15,714 17,456 – – – – – – –Derivative financial instruments – – – – – 5,579 12,220 5,284 12,285 23,609Inventories 2,022 1,921 1,821 2,378 2,797 2,640 2,599 3,237 3,040 2,637Prepaid expenses – – – – – – – – – 24,0331,585,720 1,589,181 1,604,730 1,975,604 1,998,506 2,052,097 2,388,563 2,436,008 7,733,750 7,820,142Current assets 18,823 19,823 18,121 33,535 35,491 19,414 114,101 34,782 87,586 78,744Total assets 1,604,543 1,609,004 1,622,851 2,009,139 2,033,997 2,071,511 2,502,664 2,470,790 7,821,336 7,898,886Non-current liabilitiesBorrowings 229,000 129,000 200,000 200,000 200,000 200,000 350,000 416,500 987,604 1,063,910Deferred tax liability 31,167 39,675 256,090 377,656 347,502 342,348 420,666 402,049 848,828 829,950Derivative financial instruments – – – – – 4,460 27,725 40,298 59,110 133,336Payables, provisions and accruals 10,864 9,420 972 926 1,194 880 966 1,053 10,492 10,304271,031 178,095 457,062 578,582 548,696 547,688 799,357 859,900 1,906,034 2,037,500Current liabilitiesBank overdraft – 458 44 148 132 111 – 446 558 –Borrowings 130,293 241,954 175,713 161,505 174,174 207,349 204,560 109,225 241,295 232,156Payables, provisions,accruals and derivativefinancial instruments 29,590 25,835 29,760 23,149 26,179 41,219 47,796 48,606 92,054 92,921159,883 268,247 205,517 184,802 200,485 248,679 252,356 158,277 333,907 325,077Total liabilities 430,914 446,342 662,579 763,384 749,181 796,367 1,051,713 1,018,177 2,239,941 2,362,577PAGE 64 2012 financial reportReturn to contents page
<strong>Watercare</strong> Services Limited2012 ANNUAL REPORTHistorical financial summary and key statistics (continued)AS AT 30 June 20122003 2004 2005* 2006 2007 2008 2009 2010 2011 2012$000 $000 $000 $000 $000 $000 $000 $000 $000 $000EquityIssued capital 260,693 260,693 260,693 260,693 260,693 260,693 260,693 260,693 260,693 260,693Revaluation reserves 863,754 848,488 575,826 843,712 873,086 862,745 1,043,205 1,071,655 1,429,619 1,424,231Retained earnings 49,182 53,481 123,753 141,350 151,037 151,706 147,053 120,265 111,972 72,274Capital reserve – – – – – – – – 3,779,111 3,779,111Total equity 1,173,629 1,162,662 960,272 1,245,755 1,284,816 1,275,144 1,450,951 1,452,613 5,581,395 5,536,309Total funds employed 1,604,543 1,609,004 1,622,851 2,009,139 2,033,997 2,071,511 2,502,664 2,470,790 7,821,336 7,898,886CASH FLOW SUMMARYNet cash flows – operating 60,131 54,669 65,627 66,777 70,370 59,208 81,297 74,624 176,035 163,394Net cash flows – investing (46,349) (66,854) (69,972) (52,673) (83,023) (92,362) (138,387) (126,245) (192,231) (229,173)Net cash flows – financing (13,601) 11,661 4,759 (14,208) 12,669 33,175 57,411 50,965 16,116 67,167Net change in cash flows 181 (524) 414 (104) 16 21 321 (656) (80) 1,388Bank/(overdraft) at start of year (115) 66 (458) (44) (148) (132) (111) 210 (446) (526)Bank/(overdraft) at end of year 66 (458) (44) (148) (132) (111) 210 (446) (526) 862KEY STATISTICSDebt to capitalisation (book value) 23% 23% 27% 22% 23% 24% 28% 27% 18% 19%Debt to capitalisation (historical cost) 53% 53% 48% 47% 48% 50% 58% 58% 23% 24%Funds flow from operationsto interest ratio 3.9 3.6 3.5 3.7 3.6 2.9 2.9 2.9 3.3 3.2EBITDA total interest ratio 4.0 3.7 3.5 3.7 3.6 2.9 2.9 2.9 3.3 3.2EBITDA interest expense ratio 4.2 3.9 3.8 3.8 3.7 3.4 3.9 3.5 3.5 3.5Total liabilities to total assets 27% 28% 41% 38% 37% 38% 42% 41% 29% 30%Secured liabilities to total assets 2% 2% 2% 0% 0% 0% 0% 0% 0% 0%Return on average equity 0.8% 0.2% 0.8% 1.5% 0.4% (0.2%) (0.8%) (2.0%) (0.4%) (0.8%)Economic value added/(deducted) ($000) (75,237) (109,876) (93,980) (99,499) (123,577) (130,737) (128,769) (134,659) (278,348) (412,816)Capital expenditure ($000) 42,810 66,209 70,651 64,489 86,416 120,174 129,860 123,324 (191,943) (234,670)Number of employees 352 335 329 343 363 363 381 387 611 645* The company adopted NZ IFRS <strong>with</strong> effect from 1 July 2005 and has restated the comparative information for the year ended 30 June 2005 in accordance<strong>with</strong> NZ IFRS.** Contributions towards cost of constructing property, plant and equipment is included in operating revenue from 2011 financial year.*** Intangibles have been disclosed separately from the June 2006 financial year onwards.Return to contents page2012 financial report PAGE 65
<strong>Watercare</strong> Services Limited2012 ANNUAL REPORTFINANCIAL COMMENTARYThe financial result for the year was highlighted by an operating surplus from trading operations of $5.0 million compared <strong>with</strong> a budgetedoperating deficit of $4.4 million.The reported operating surplus was prior to the adjustment for the unfavourable revaluation of derivative instruments of $60.6 million and theloss on disposal of fixed assets and other restructuring costs of $8.5 million. The resulting net deficit after tax of $45.3 million was compared <strong>with</strong>a budgeted net deficit of $3.2 million. (2011 – Net deficit after tax of $12.3 million).KEY POINTS• Revenue was 2.6% below budget primarily due to the effect of lower water volumes and lower infrastructure growth charges.• Total expenses including operating expenses, depreciation and interest expense were 4.6% lower than budget for the financial year.• Under NZ IFRS, the company revalues its interest rate swaps and forward foreign exchange contracts to fair value. This revaluation resultedin a decrease in current year operating surplus from trading operations by $60.6 million (2011 – decrease in operating surplus from tradingoperations by $13.6 million).• The company recorded a loss disposal of fixed assets of $8.4 million being primarily the write-down of assets that were replaced duringthe year and some residual cleanup of assets inherited through integration. Other restructuring costs of $0.1 million contribute to the totalunbudgeted costs of $8.5 million.• On 19 September 2011, Standard & Poor’s upgraded its corporate credit ratings on <strong>Watercare</strong> Services Limited. The long-term rating wasraised to ‘AA-’ from ‘A’ and the short-term rating was raised to ‘A-1+’ from ‘A-1’. As at 30 June 2012, the outlook on these ratings was stable.The credit ratings on <strong>Watercare</strong> debt guaranteed by Auckland Council remained unchanged at ‘AA’ long-term and ‘A-1+’ short-term.• A $125 million medium-term note issue was completed in two tranches, of $75 million in October 2011 and $50 million in December 2011.The notes carry a coupon interest rate of 5.685% and are due to mature on 26 October 2018. The proceeds were used to refinance existingdebt and fund capital expenditure requirements over the remainder of 2011/12.• No price adjustment was paid in the 2012 year (2011 – $nil).• On 1 November 2010 the company acquired the water and wastewater businesses conducted by Metrowater Limited, Manukau WaterLimited, North Shore City Council, Waitakere City Council, Rodney District Council and Franklin District Council in accordance <strong>with</strong> the LocalGovernment (Tamaki Makaurau Reorganisation) Act 2009, the Local Government (Auckland Council) Act 2009 and the Local Government(Auckland Transitional Provisions) Act 2010. The company has provided total water and wastewater services to the Auckland region since1 November 2010.• This financial commentary includes the budget for the 2012 year and notes on significant variances. Comparisons are also provided to lastyear being a period where <strong>Watercare</strong> provided retail water and wastewater services for eight months in the financial year, the period sinceintegration on 1 November 2010. As a result, revenue and costs were higher in the 30 June 2012 financial year as <strong>Watercare</strong> has providedretail water and wastewater services for the full 12 months.STATEMENT OF COMPREHENSIVE INCOMEFor the year ended 30 June 2012Total Comprehensive income2012 2012 2011 2013Actual Budget Actual Budget$000 $000 $000 $000Operating surplus (deficit) from trading operations 4,952 (4,415) 11,834 357Loss on disposal and provision for redundant property,plant and equipment and other restructuring costs (8,517) – (6,162) –Loss on revaluation of derivative financial instruments (60,618) – (13,567) –Operating (deficit) surplus before tax (64,183) (4,415) (7,895) 357Deferred tax 18,878 1,236 (4,438) (100)Net (deficit) after tax (45,305) (3,179) (12,333) 257Asset revaluation, net of tax – – 361,873 –Total comprehensive income for the year, net of tax (45,305) (3,179) 349,540 257The operating surplus from trading of $5.0 million was favourable compared <strong>with</strong> the budgeted operating deficit of $4.4 million primarily due tofavourable variances in interest expense, depreciation and operating expenses. These were partially offset by the unfavourable variancein revenue.Total comprehensive income (deficit) for the year of ($45.3 million) after tax, compared <strong>with</strong> budgeted comprehensive income (deficit) of($3.2 million) after tax, represents an unfavourable variance of $42.1 million. This primarily reflects the negative revaluation of financialinstruments of $60.6 million and the loss on disposal of assets and other restructuring costs of $8.5 million.PAGE 66 2012 financial reportReturn to contents page
<strong>Watercare</strong> Services Limited2012 ANNUAL REPORTFINANCIAL COMMENTARY (continued)Revenue2012 2012 2012 2011 2013Actual Budget Variance toActualBudget$000 $000Budget$000 $000Water 129,543 137,676 (5.9%) 131,438 137,930Wastewater 263,624 262,360 0.5% 203,773 271,540Trade waste 12,462 12,510 (0.4%) 14,038 13,318Other 36,321 41,206 (11.9%) 23,858 36,774Operating revenue 441,950 453,752 (2.6%) 373,107 459,563Water revenue was $129.6 million for the year, 5.9% lower than the budget of $137.7 million due to lower than expected water sales volumes asa result of the wet summer.Wastewater revenue was $263.6 million for the year, 0.5% higher than the budget of $262.4 million.Trade waste revenue was $12.5 million for the year and was less than the budget by 0.4%.Other revenue was $36.3 million for the year and was 11.9% below budget primarily due to lower infrastructure growth charges as a result ofless developer activity.Price adjustment2012 2012 2012 2011 2013Actual Budget Variance toActualBudget$000 $000Budget$000 $000Water – – – – –Wastewater – – – – –Trade waste – – – – –– – – – –Price adjustments are unbudgeted discretionary payments. The Directors determine the amount, and the distribution between customer groups,after having regard to the financial position of the company and future expenditure requirements. The Directors decided that no price adjustmentwould be made for 2012 (2011 – $Nil).Operating expenses2012 2012 2012 2011 2013Actual Budget Variance toActualBudget$000 $000Budget$000 $000Water 71,542 75,441 5.2% 63,529 72,526Wastewater 113,048 116,912 3.3% 93,011 123,862Total expenses 184,590 192,353 4.0% 156,540 196,387Operating expenses were $7.8 million or 4.0% lower than budget for the year primarily due to savings in net labour, asset operating costs,professional services and general overheads. These favourable variances were partially offset by higher than budgeted expenditure inmaintenance costs.Operating expenses in the water business unit were $3.9 million or 5.2% lower than budget. The savings were primarily due to lower chemicalsand energy costs as a result of lower demand. Labour costs were lower than budget due to vacancies and reduced over time and callouts acrossthe region. Additionally savings were achieved in professional services and overheads including lower travel and training costs. The saving werepartially offset by higher than budgeted maintenance costs, in particular, reactive jobs in the retail network.Operating expenses in the wastewater business unit were $3.8 million or 3.3% lower than budget. The savings were primarily due to lower assetoperating costs as a result of lower treatment costs of biosolids and savings on services at the Mangere Treatment Plant. Labour costs were lowerthan budget due primarily to vacancies and lower overtime. Additionally savings were achieved in professional services due to the reschedulingof planning studies. Savings in overheads included lower training, travel and subscriptions costs. The savings were partially offset by higher thanbudgeted maintenance costs including repairs to the reactor blowers and engines at the Mangere Treatment Plant.Return to contents page2012 financial report PAGE 67
<strong>Watercare</strong> Services Limited2012 ANNUAL REPORTFINANCIAL COMMENTARY (continued)Statement of Financial PositionAs at 30 June 2012The company was in a strong financial position <strong>with</strong> net equity of $5.5 billion at year-end. The net equity decreased by $45.1 million from30 June 2011 due mainly to the reported net deficit after tax for the year.Property, plant and equipment2012 2012 2012 2011 2013Actual Budget Variance toActualBudget$000 $000Budget$000 $000Water 3,259,783 3,234,411 0.8% 3,188,117 3,533,469Wastewater 4,470,526 4,519,687 (1.1%) 4,500,079 4,743,7007,730,309 7,754,098 (0.3%) 7,688,196 8,277,169The analysis by business group for the movements in property, plant and equipment for 2012 is:Water Wastewater Total$000 $000 $000Net additions, integration and other movements 149,222 65,410 214,632Asset revaluation (impairment) (before tax) (1,625) (1,182) (2,807)Depreciation (75,931) (93,781) (169,712)71,666 (29,553) 42,113The increase for property, plant and equipment was a result of planned spend on capital projects during the financial year. Significant capitalexpenditure projects in the year included work on the new Hunua Number 4 trunk watermain, expansion of the Waikato Treatment Plant and theNorthern Waitakere wastewater servicing project.Intangible assets2012 2012 2012 2011 2013Actual Budget Variance toActualBudget$000 $000Budget$000 $000Water 14,150 9,166 54.4% 14,207 13,060Wastewater 25,404 16,457 54.4% 16,022 23,44639,554 25,623 54.4% 30,229 36,506The increase in intangible assets during the year reflects the completion of the new information systems including the implementation of SAP.Borrowings2012 2012 2012 2011 2013Actual Budget Variance toActualBudget$000 $000Budget$000 $0001,296,066 1,295,314 (0.1%) 1,228,899 1,385,704Borrowings at year-end were 0.1% or $0.7 million higher than budget. Borrowings include commercial paper of $129.1 million, $13.5 milliondrawn under a revolving credit facility, related party loans of $476.8 million, medium term notes of $526.6 million and a bank loan of$150 million.Deferred tax liability2012 2012 2012 2011 2013Actual Budget Variance toActualBudget$000 $000Budget$000 $000829,950 849,704 (2.3%) 848,828 960,521The deferred tax liability primarily comprises temporary differences between the revalued property, plant and equipment and the valuesrecognised for tax purposes plus differences in the company’s depreciation rates and those permitted by the Inland Revenue Department.At 30 June 2012, deferred taxation was lower than budget, principally due to the deferred tax effect of the revaluation of derivative financialinstruments during the year.Return to contents page2012 financial report PAGE 69
<strong>Watercare</strong> Services Limited2012 ANNUAL REPORTFINANCIAL COMMENTARY (continued)STATEMENT OF CASH FLOWSFor the year ended 30 June 2012No price adjustment was paid to customers during the financial year to 30 June 2012. As such, all of the company’s cash flow from operationswas available for either capital expenditure or debt repayment. Borrowings increased as a result of the shortfall between operating cash flowsand capital expenditure.Net cash flows from operating activities2012 2012 2012 2011 2013Actual Budget Variance toActualBudget$000 $000Budget$000 $000163,394 182,237 (10.3%) 176,035 197,213Net operating cash flows at $163.4 million were 10.3% lower than budget for 2012. This was due to operating cashflows including the paymentof $23.9 million for the lease of land on Puketutu Island. This payment was budgeted for in the 2011 financial year capital expenditure budget.The lease has however, been classified as an operating lease under NZ IAS 17 and the $23.9 million as a prepayment of an operating expense.Net cash flows from investing activities2012 2012 2012 2011 2013Actual Budget Variance toActualBudget$000 $000Budget$000 $000(229,173) (240,907) 4.9% (192,231) (292,766)The net cash flow from investing activities was 4.9% lower than budget due to minor delays in some wastewater and operations capitalexpenditure projects.Net cash flows from financing activities2012 2012 2012 2011 2013Actual Budget Variance toActualBudget$000 $000Budget$000 $00067,167 58,670 14.5% 16,116 95,554The net cash flow from financing activities shows a net increase in borrowing in 2012 from the prior year. The increase in debt resulted from thehigher level of capital expenditure relative to the operating cash flows.The audited financial statements are set out on pages 74 to 111.PAGE 70 2012 financial reportReturn to contents page
<strong>Watercare</strong> Services Limited2012 ANNUAL REPORTRESPONSIBILITY FOR THE FINANCIAL STATEMENTSAND STATEMENT OF service PERFORMANCEFinancial StatementsWe have ensured that the financial statements fairly reflect the financial position of the company as at 30 June 2012 and its financialperformance and cash flows for the year ended on that date.We have ensured that the accounting policies used by the company accord <strong>with</strong> New Zealand Equivalents to International FinancialReporting Standards. This includes the early adoption of accounting standards issued by the New Zealand Institute of CharteredAccountants, to the extent that they do not conflict <strong>with</strong> an existing accounting standard and the information is available.We believe proper accounting records have been kept, enabling the financial position of the company to be determined and that thefinancial statements fully comply <strong>with</strong> the Financial Reporting Act 1993.We consider adequate steps have been taken to safeguard the assets of the company and to prevent and detect fraud andother irregularities.Statement of Service PerformanceWe are responsible for establishing a Statement of Corporate Intent, which sets targets and other measures by which the company’sperformance can be judged in relation to its objectives.We consider the results reported in the statement of service performance fairly reflect the achievements for the year ended 30 June 2012.We have pleasure in presenting the financial statements and the statement of service performance for <strong>Watercare</strong> Services Limited for theyear ended 30 June 2012, which were approved and authorised for release on 23 August 2012.For and on behalf of management:K M FordChief Executiveb T Monkchief Financial OfficerFor the Board:R B KeenanChairmand J Clarkedeputy ChairmanM N Allen p S Drummond c J HarlandDirector Director DirectorS M Huria a G Lanigan J G ToddDirector Director DirectorReturn to contents page2012 financial report PAGE 71
<strong>Watercare</strong> Services Limited2012 ANNUAL REPORTINDEPENDENT Auditor’S REPORTTO THE READERS OF WATERCARE SERVICES LIMITED AND GROUP’S FINANCIAL STATEMENTSAND STATEMENT OF SERVICE PERFORMANCE FOR THE YEAR ENDED 30 JUNE 2012The Auditor-General is the auditor of <strong>Watercare</strong> Services Limited (the company) and group. The Auditor-General has appointed me, JamieSchmidt, using the staff and resources of Deloitte, to carry out the audit of the financial statements and statement of service performance of thecompany and group on her behalf.We have audited:• the financial statements of the company and group on pages 74 to 111, that comprise the statements of financial position as at 30 June 2012,the statements of comprehensive income, statements of changes in equity and statements of cash flows for the year ended on that date andthe notes to the financial statements that include accounting policies and other explanatory information; and• the statement of service performance of the company and group on pages 113 to 115.Opinion on the financial statements and the statement of service performanceIn our opinion,• the financial statements of the company and group on pages 74 to 111:– comply <strong>with</strong> generally accepted accounting practice in New Zealand;– give a true and fair view of the company and group’s:- financial position as at 30 June 2012; and- financial performance and cash flows for the year ended on that date; and• the statement of service performance of the company and group on pages 113 to 115:– complies <strong>with</strong> generally accepted accounting practice in New Zealand; and– gives a true and fair view of the company’s service performance achievements measured against the performance targets adoptedfor the year ended 30 June 2012.Opinion on other legal requirementsIn accordance <strong>with</strong> the Financial Reporting Act 1993 we report that, in our opinion, proper accounting records have been kept by the companyand group as far as appears from an examination of those records.Our audit was completed on 23 August 2012. This is the date at which our opinion is expressed.The basis of our opinion is explained below. In addition, we outline the responsibilities of the Board of Directors and our responsibilities, andexplain our independence.Basis of opinionWe carried out our audit in accordance <strong>with</strong> the Auditor-General’s Auditing Standards, which incorporate the International Standards on Auditing(New Zealand). Those standards require that we comply <strong>with</strong> ethical requirements and plan and carry out our audit to obtain reasonableassurance about whether the financial statements and statement of service performance are free from <strong>material</strong> misstatement.Material misstatements are differences or omissions of amounts and disclosures that would affect a reader’s overall understanding of thefinancial statements and statement of service performance. If we had found <strong>material</strong> misstatements that were not corrected, we would havereferred to them in our opinion.An audit involves carrying out procedures to obtain audit evidence about the amounts and disclosures in the financial statements and statementof service performance. The procedures selected depend on our judgement, including our assessment of risks of <strong>material</strong> misstatement of thefinancial statements and statement of service performance whether due to fraud or error.In making those risk assessments, we consider internal control relevant to the preparation of the company and group’s financial statements andstatement of service performance that give a true and fair view of the matters to which they relate.We consider internal control in order to design audit procedures that are appropriate in the circumstances but not for the purpose of expressingan opinion on the effectiveness of the company and group’s internal control.An audit also involves evaluating:• the appropriateness of accounting policies used and whether they have been consistently applied;• the reasonableness of the significant accounting estimates and judgements made by the Board of Directors;• the adequacy of all disclosures in the financial statements and statement of service performance; and• the overall presentation of the financial statements and statement of service performance.We did not examine every transaction, nor do we guarantee complete accuracy of the financial statements and statement of service performance.In accordance <strong>with</strong> the Financial Reporting Act 1993, we report that we have obtained all the information and explanations we have required. Webelieve we have obtained sufficient and appropriate audit evidence to provide a basis for our audit opinion.PAGE 72 2012 financial reportReturn to contents page
<strong>Watercare</strong> Services Limited2012 ANNUAL REPORTResponsibilities of the Board of DirectorsThe Board of Directors is responsible for preparing financial statements and a statement of service performance that:• comply <strong>with</strong> generally accepted accounting practice in New Zealand;• give a true and fair view of the company and group’s financial position, financial performance and cash flows; and• give a true and fair view of the company and group’s service performance.The Board of Directors is also responsible for such internal control as it determines is necessary to enable the preparation of financial statementsand a statement of service performance that are free from <strong>material</strong> misstatement, whether due to fraud or error.The Board of Directors’ responsibilities arise from the Local Government (Auckland Transitional Provisions) Act 2010 and theFinancial Reporting Act 1993.Responsibilities of the AuditorWe are responsible for expressing an independent opinion on the financial statements and statement of service performance and reporting thatopinion to you based on our audit. Our responsibility arises from section 15 of the Public Audit Act 2001 and section 22 of the Local Government(Auckland Transitional Provisions) Act 2010.IndependenceWhen carrying out the audit, we followed the independence requirements of the Auditor-General, which incorporate the independencerequirements of the New Zealand Institute of Chartered Accountants.Other than the audit and the provision of tax services and review of financial information systems, which are compatible <strong>with</strong> thoseindependence requirements, we have no relationship <strong>with</strong> or interests in the company or any of its subsidiaries.Jamie SchmidtDeloitteOn behalf of the Auditor-GeneralAuckland, New ZealandMatters relating to the electronic presentation of the audited financial statements and statement of service performanceThis audit report relates to the financial statements and statement of service performance of <strong>Watercare</strong> Services Limited (“<strong>Watercare</strong>”) for the year ended 30 June2012 included on the <strong>Watercare</strong> website. <strong>Watercare</strong>’s Board of Directors is responsible for the maintenance and integrity of <strong>Watercare</strong>’s website. We have not beenengaged to report on the integrity of <strong>Watercare</strong>’s website. We accept no responsibility for any changes that may have occurred to the financial statements andstatement of service performance since they were initially presented on the website.The audit report refers only to the financial statements and statement of service performance named above. It does not provide an opinion on any other informationwhich may have been hyperlinked to or from the financial statements and statement of service performance. If readers of this report are concerned <strong>with</strong> theinherent risks arising from electronic data communication they should refer to the published hard copy of the audited financial statements and statement of serviceperformance and the related audit report dated 23 August 2012 to confirm the information included in the audited financial statements and statement of serviceperformance presented on this website.Legislation in New Zealand governing the preparation and dissemination of financial information may differ from legislation in other jurisdictions.Return to contents page2012 financial report PAGE 73
<strong>Watercare</strong> Services Limited2012 ANNUAL REPORTStatement of Comprehensive Incomefor the year ended 30 June 20122012 2011Group and Company Group and CompanyNotes $000 $000Revenue note 1, page 85 441,950 373,107Total revenue 441,950 373,107Operating expensesAsset operating costs (73,523) (56,070)Maintenance costs (38,143) (39,012)Employee benefit expenses (38,948) (27,659)Other expenses (33,976) (33,799)Total operating expenses note 3, page 86 (184,590) (156,540)Depreciation and amortisation note 4, page 86 (179,822) (143,626)Finance costs note 5, page 86 (72,586) (61,107)Total expenses (436,998) (361,273)Operating surplus from trading operations 4,952 11,834Loss on disposal and provision for redundant property,plant and equipment and other restructuring costs (8,517) (6,162)Loss on revaluation of derivative financial instruments N note 6, page 87 (60,618) (13,567)Operating deficit before tax (64,183) (7,895)Income tax benefit/(expense)Deferred tax note 8, page 88 18,878 (4,438)Income tax benefit/(expense) 18,878 (4,438)Net deficit for the year (45,305) (12,333)Other comprehensive income net of taxGain on revaluation of property, plant and equipment and adjustments note 12, page 92 – 361,873Other comprehensive income for the year, net of tax – 361,873Total comprehensive income for the year, net of tax (45,305) 349,540The financial statements should be read in conjunction <strong>with</strong> the accounting policies and notes on pages 80 to 111.PAGE 74 2012 financial reportReturn to contents page
<strong>Watercare</strong> Services Limited2012 ANNUAL REPORTStatement of FINANCIAL PositionAS AT 30 June 20122012 2011Group and Company Group and CompanyNotes $000 $000ASSETSCurrentcash and cash equivalents 862 32Trade and other receivables note 16, page 99 71,590 79,508Prepaid expenses note 17, page 99 3,473 3,401Inventories note 15, page 99 2,793 4,092Derivative financial instruments N note 22, page 103 26 553total current assets 78,744 87,586Non-currentPrepaid expenses note 17, page 99 24,033 –Inventories note 15, page 99 2,637 3,040Derivative financial instruments N note 22, page 103 23,609 12,285Intangible assets note 14, page 97 39,554 30,229Property, plant and equipment N note 13, page 95 7,730,309 7,688,196Total non-current assets 7,820,142 7,733,750Total assets 7,898,886 7,821,336EQUITY & LIABILITIESCurrentBank overdraft – 558Trade and other payables note 18, page 99 24,484 16,157Accrued expenses note 19, page 100 61,834 67,927Provisions note 20, page 100 6,241 4,796Borrowings note 21, page 101 232,156 241,295Derivative financial instruments N note 22, page 103 362 3,174total current liabilities 325,077 333,907Non-currentAccrued expenses note 19, page 100 8,840 9,100Provisions note 20, page 100 1,464 1,392Borrowings note 21, page 101 1,063,910 987,604Derivative financial instruments N note 22, page 103 133,336 59,110Deferred tax liability note 9, page 89 829,950 848,828total non-current liabilities 2,037,500 1,906,034Total liabilities 2,362,577 2,239,941EQUITY ATTRIBUTABLE TO OWNERS OF THE PARENTretained earnings 72,274 111,972Revaluation reserves note 12, page 92 1,424,231 1,429,619Capital reserve note 11, page 91 3,779,111 3,779,111Issued capital note 10, page 89 260,693 260,693Total equity 5,536,309 5,581,395Total equity and liabilities 7,898,886 7,821,336The financial statements should be read in conjunction <strong>with</strong> the accounting policies and notes on pages 80 to 111.Return to contents page2012 financial report PAGE 75
<strong>Watercare</strong> Services Limited2012 ANNUAL REPORTStatement of Cash flowsfor the year ended 30 June 20122012 2011Group and Company Group and CompanyNotes $000 $000OPERATING ACTIVITIESCash was provided from:Receipts from customers 445,197 384,722Dividends received 91 34Interest received 753 1,041Cash was applied to:446,041 385,797Employees and suppliers (208,941) (153,203)Finance costs paid (73,706) (56,559)(282,647) (209,762)Net cash flows – operating activities N note 7, page 87 163,394 176,035INVESTING ACTIVITIESCash was provided from:Cash acquired from Manukau Water Limited N note 11, page 91 – 11,953Cash acquired from <strong>Watercare</strong> Harbour Clean-Up Trust N note 11, page 90 220 –Sale of property, plant and equipment and intangibles 86 70Cash was applied to:306 12,023Purchase and construction of property, plant and equipment and intangibles (222,860) (193,935)Interest capitalised on construction of property, plant and equipmentand intangibles note 5, page 86 (6,619) (4,714)Bank overdraft acquired from Metrowater Limited note 11, page 91 – (5,605)(229,479) (204,254)Net cash flows – investing activities (229,173) (192,231)FINANCING ACTIVITIESCash was provided from:Short-term deposits – 15,000Proceeds from medium-term notes issue (net) 76,649 150,000Proceeds from bank term loan facility 50,000 –Commercial paper issued (net) 4,976 24,916Revolving credit facility (net) 2,000 –Cash was applied to:133,625 189,916Revolving credit facility (net) – (5,000)Repay loan from Auckland Council – related party note 23, page 109 (66,458) (168,800)(66,458) (173,800)Net cash flows – financing activities 67,167 16,116Net change in cash flows 1,388 (80)Cash and cash equivalents at the beginning of year (526) (446)Cash and cash equivalents at the end of year 862 (526)Cash and cash equivalents comprises:Bank balances 577 32Short term deposits maturing <strong>with</strong>in three months 285 –Bank overdraft – (558)862 (526)The financial statements should be read in conjunction <strong>with</strong> the accounting policies and notes on pages 80 to 111.PAGE 76 2012 financial reportReturn to contents page
<strong>Watercare</strong> Services Limited2012 ANNUAL REPORTStatement of Changes in equityfor the year ended 30 June 2012IssuedcapitalRevaluationreserves2012Group and CompanyRetainedearningsCapitalreserveNotes $000 $000 $000 $000 $000TotalBalance at 1 July 2011 260,693 1,429,619 111,972 3,779,111 5,581,395Comprehensive incomeNet deficit for the year – – (45,305) – (45,305)Other comprehensive incomeTransfer to retained earnings on disposalof property, plant and equipment note 12, page 92 – (5,388) 5,388 – –Total comprehensive incomefor the year, net of tax – (5,388) (39,917) – (45,305)Transactions <strong>with</strong> owners<strong>Watercare</strong> Harbour Clean-up Trust acquiredcontrol at the beginning of year note 11, page 90 – – 219 – 219Total transactions <strong>with</strong> owners – – 219 – 219Balance at 30 June 2012 260,693 1,424,231 72,274 3,779,111 5,536,309IssuedcapitalRevaluationreserves2011Group and CompanyRetainedearningsCapitalreserveNotes $000 $000 $000 $000 $000TotalBalance at 1 July 2010 260,693 1,071,655 120,265 – 1,452,613Comprehensive incomeNet deficit for the year – – (12,333) – (12,333)Other comprehensive incomeGain on revaluation of property,plant and equipment note 12, page 92 – 361,873 – – 361,873Transfer to retained earnings on disposalof property, plant and equipment note 12, page 92 – (3,909) 3,909 – –Total comprehensive incomefor the year, net of tax – 357,964 (8,424) – 349,540Transactions <strong>with</strong> ownersCapital reserve on business integration – – – 3,779,111 3,779,111Metrowater Community Trustacquired on integration – – 131 – 131Total transactions <strong>with</strong> owners note 11, page 92 – – 131 3,779,111 3,779,242Balance at 30 June 2011 260,693 1,429,619 111,972 3,779,111 5,581,395The financial statements should be read in conjunction <strong>with</strong> the accounting policies and notes on pages 80 to 111.Return to contents page2012 financial report PAGE 77
<strong>Watercare</strong> Services Limited2012 ANNUAL REPORTSTATEMENT OF COMPrehensive incoME BY Business unitfor the year ended 30 June 20122012 2012 2012 2011 2011 2011Group and CompanyGroup and CompanyWater Wastewater Total Water Wastewater Total$000 $000 $000 $000 $000 $000RevenueWater and wastewater 129,543 263,624 393,167 131,438 203,773 335,211Trade waste – 12,462 12,462 – 14,038 14,038Other revenue 20,348 15,973 36,321 9,066 14,792 23,858Total revenue 149,891 292,059 441,950 140,504 232,603 373,107Operating expensesAsset operating costs (26,534) (46,989) (73,523) (19,577) (36,493) (56,070)Maintenance costs (19,485) (18,658) (38,143) (18,361) (20,651) (39,012)Employee benefit expenses (13,708) (25,240) (38,948) (12,386) (15,273) (27,659)Other expenses (11,815) (22,161) (33,976) (13,205) (20,594) (33,799)Total operating expenses (71,542) (113,048) (184,590) (63,529) (93,011) (156,540)Depreciation and amortisation (80,070) (99,752) (179,822) (71,106) (72,520) (143,626)Finance costs (628) (71,958) (72,586) (25,901) (35,206) (61,107)Total expenses (152,240) (284,758) (436,998) (160,536) (200,737) (361,273)Operating (deficit)/surplusfrom trading operations (2,349) 7,301 4,952 (20,032) 31,866 11,834Loss on disposal and provision for redundantproperty, plant and equipment and otherrestructuring costs (4,808) (3,709) (8,517) (3,215) (2,947) (6,162)Loss on revaluation of derivativefinancial instruments (2,070) (58,548) (60,618) (5,191) (8,376) (13,567)Operating (deficit)/surplus before tax (9,227) (54,956) (64,183) (28,438) 20,543 (7,895)Income tax benefit/(expense)Deferred tax 2,714 16,164 18,878 (1,686) (2,752) (4,438)Income tax benefit/(expense) 2,714 16,164 18,878 (1,686) (2,752) (4,438)Net (deficit)/surplus for the year (6,513) (38,792) (45,305) (30,124) 17,791 (12,333)Other comprehensive income net of taxGain on revaluation and impairment of property,plant and equipment and adjustments – – – 137,512 224,361 361,873Other comprehensive income for the year, net of tax – – – 137,512 224,361 361,873Total comprehensive income for the year, net of tax (6,513) (38,792) (45,305) 107,388 242,152 349,540The financial statements should be read in conjunction <strong>with</strong> the accounting policies and notes on pages 80 to 111.PAGE 78 2012 financial reportReturn to contents page
<strong>Watercare</strong> Services Limited2012 ANNUAL REPORTSTATEMENT OF FINANCIAL Position BY Business unitAS AT 30 June 20122012 2012 2012 2011 2011 2011Group and CompanyGroup and CompanyWater Wastewater Total Water Wastewater Total$000 $000 $000 $000 $000 $000ASSETSCurrentCurrent assets 38,517 40,227 78,744 40,722 46,864 87,586Total current assets 38,517 40,227 78,744 40,722 46,864 87,586Non-currentPrepaid expenses 25 24,008 24,033 – – –Inventories 133 2,504 2,637 635 2,405 3,040Derivative financial instruments 1,079 22,530 23,609 5,429 6,856 12,285Intangibles 14,150 25,404 39,554 14,207 16,022 30,229Property, plant and equipment 3,259,783 4,470,526 7,730,309 3,188,117 4,500,079 7,688,196Total non-current assets 3,275,170 4,544,972 7,820,142 3,208,388 4,525,362 7,733,750Total assets 3,313,687 4,585,199 7,898,886 3,249,110 4,572,226 7,821,336LIABILITIESCurrentCurrent liabilities 47,927 277,150 325,077 143,791 190,116 333,907Total current liabilities 47,927 277,150 325,077 143,791 190,116 333,907Non-currentAccrued expenses 4,226 4,614 8,840 4,368 4,732 9,100Provisions 482 982 1,464 524 868 1,392Borrowings 48,602 1,015,308 1,063,910 436,205 551,399 987,604Derivative financial instruments 6,091 127,245 133,336 26,126 32,984 59,110Deferred tax liability 273,457 556,493 829,950 319,452 529,376 848,828Total non-current liabilities 332,858 1,704,642 2,037,500 786,675 1,119,359 1,906,034Total liabilities 380,785 1,981,792 2,362,577 930,466 1,309,475 2,239,941Equity attributable to owners of the parent 2,932,902 2,603,407 5,536,309 2,318,644 3,262,751 5,581,395Total equity and liabilities 3,313,687 4,585,199 7,898,886 3,249,110 4,572,226 7,821,336STATEMENT OF CASH FLOWS BY Business unitFOR THE YEAR ENDED 30 June 20122012 2012 2012 2011 2011 2011Group and CompanyGroup and CompanyWater Wastewater Total Water Wastewater Total$000 $000 $000 $000 $000 $000Net cash flows – operating activities 74,540 88,854 163,394 59,305 116,730 176,035Net cash flows – investing activities (120,501) (108,672) (229,173) (79,978) (112,253) (192,231)Net cash flows – financing activities 27,108 40,059 67,167 7,118 8,998 16,116Net change in cash flows (18,853) 20,241 1,388 (13,555) 13,475 (80)The financial statements should be read in conjunction <strong>with</strong> the accounting policies and notes on pages 80 to 111.Return to contents page2012 financial report PAGE 79
<strong>Watercare</strong> Services Limited2012 ANNUAL REPORTSTATEMENT OF AccountinG PoliciesFOR THE YEAR ENDED 30 JUNE 2012REPORTING ENTITYThe financial statements are for <strong>Watercare</strong> Services Limited, a council organisation wholly owned by Auckland Council, as defined in the Local Government Act2002 incorporated and domiciled in New Zealand. The consolidated financial statements of the group are for the economic entity of <strong>Watercare</strong> Services Limitedand its subsidiaries. Separate financial statements of the parent are not presented in these financial statements as the subsidiary financial statements areim<strong>material</strong> to the consolidated group, as detailed in Note 11, page 90.During the prior year, on 1 November 2010, as the result of the Auckland Council reorganisation, <strong>Watercare</strong> Services Limited integrated the water andwastewater businesses of Metrowater Limited, Manukau Water Limited, North Shore City Council, Waitakere City Council, Rodney District Council, PapakuraDistrict Council and Franklin District Council, in accordance <strong>with</strong> the Local Government (Tamaki Makaurau Reorganisation) Act 2009, the Local Government(Auckland Council) Act 2009 and the Local Government (Auckland Transitional Provisions) Act 2010. Consequently, <strong>Watercare</strong> Services Limited provides totalwater and wastewater services to the Auckland region (except Papakura).The group’s registered office and principal place of business is at 2 Nuffield Street, Newmarket, Auckland 1023.STATEMENT OF COMPLIANCE<strong>Watercare</strong> Services Limited is a public benefit entity (PBE) as defined under the New Zealand Equivalents to International Financial Reporting Standards (NZ IFRS).The financial statements and accounting policies comply <strong>with</strong> the specific recognition, measurement and disclosure requirements of NZ IFRS in relation to PBEsand New Zealand Generally Accepted Accounting Practice (NZGAAP).STATUTORY BASE<strong>Watercare</strong> Services Limited is a group registered under the Companies Act 1993 and is a reporting entity as defined by the Financial Reporting Act 1993. Thefinancial statements have been prepared in accordance <strong>with</strong> the requirements of the Financial Reporting Act 1993, the Local Government Acts 1974 and 2002,Local Government (Auckland Transitional Provisions) Act 2010 and the Companies Act 1993.MEASUREMENT BASEThe financial statements have been prepared on the historical cost basis, modified by the revaluation of land and buildings, certain infrastructural assets andderivative instruments as described in specific accounting policies below.FUNCTIONAL AND PRESENTATION CURRENCYThe financial statements are prepared in New Zealand dollars and all values are rounded to the nearest thousand, unless otherwise stated.KEY MANAGEMENT DECISIONSThe key areas where management has exercised its judgement in the preparation of these financial statements are as explained below:There are a number of assumptions and estimates used when performing depreciated replacement cost valuations of infrastructure assets. For example,estimates are made determining the remaining useful life over which an asset will be depreciated, replacement costs for assets and capitalised interest. Inrespect of estimated useful lives, if the estimated useful lives are not accurate this would lead to the annual depreciation charge being either higher or lowerin the statement of comprehensive income. To minimise the estimation risk of asset useful lives the group continually assesses the condition of infrastructuralassets and their remaining useful lives. Physical inspections and condition assessments are used by the group to ensure that the condition of major assets isunderstood and the carrying value of an asset reflects its actual condition. See Note 13, page 94 for additional information.SIGNIFICANT ACCOUNTING POLICIESThe following specific accounting policies that <strong>material</strong>ly affect the measurement of comprehensive income, financial position and cash flows have been appliedconsistently to all periods presented in these financial statements.1. BUSINESS UNIT REPORTINGBusiness unit comprehensive income, financial position and cash flows are presented in the financial statements for water and wastewater services,reflecting the group’s legislative requirements. Revenues and expenses are apportioned to each unit on a direct basis plus an allocation of non-specific andoverhead costs proportional to each unit’s actual revenues at year end. During the year, debt was reallocated between the business units to better reflectthe returns expected from each unit and the incremental cost of capital. This rebalancing had resulted in an increase as at 1 July 2011 of $100.3 million incurrent borrowings, an increase of $410.4 million in non-current borrowings and a decrease of $510.7 million in equity for the Wastewater activity <strong>with</strong> anequal and opposite impact for the Water activity. Accordingly, costs directly attributable to debt such as finance costs and loss on revaluation of derivativeinstruments have been allocated in proportion to the debt as at balance date in Wastewater and Water activities.All operations are carried out <strong>with</strong>in New Zealand. There are no <strong>material</strong> transactions between the two business units.2. BASIS OF CONSOLIDATIONThe purchase method is used to prepare the consolidated financial statements, which involves adding together like items of assets, liabilities, equity,income and expenses on a line-by-line basis. All significant intragroup balances, transactions, revenues and expenses are eliminated on consolidation.3. INTEGRATION OF RETAIL BUSINESSThe group has adopted the public benefit entity exemption from NZ IFRS 3 available for local authority reorganisations where no consideration has beentransferred. The group therefore, is not required to measure assets and liabilities at their fair value at acquisition date and no consideration was paid forthe net assets acquired. During the prior year, the net assets acquired were recorded at the accounting book value of the previous local network operators(deemed cost) in the company’s financial statements and where necessary, adjustments were made to the carrying value of the assets and liabilities beingrecognised in the company’s opening balance sheet to achieve consistency in the accounting policies. The contribution value of the net assets has beenrecorded separately in the capital reserve. See Note 11, page 91 for additional information.4. GOODS AND SERVICES TAX (GST)The statement of comprehensive income and the statement of financial position are stated excluding GST, <strong>with</strong> the exception of receivables and payables,which include GST. The net amount of GST recoverable from or payable to the Inland Revenue Department is included as part of receivables or payables inthe statement of financial position.PAGE 80 2012 financial reportReturn to contents page
<strong>Watercare</strong> Services Limited2012 ANNUAL REPORTSTATEMENT OF AccountinG Policies (continued)FOR THE YEAR ENDED 30 JUNE 2012SIGNIFICANT ACCOUNTING POLICIES (continued)5. OPERATING REVENUEThe group measures revenue at the fair value of the amounts received or receivable, net of returns, trade allowances, duties and taxes paid. It accounts forrevenue for the major activities as follows:Water and wastewater revenueWater revenue comprises the amounts received and receivable, including estimated amounts of unread meters at balance date for water supplied tocustomers in the ordinary course of business. Wastewater revenue is a combination of fixed charge and a percentage of water used. Both are shown net ofprompt payment discounts and leak remissions.Provision of servicesSales of services are recognised at fair value of the amounts received or receivable as the services are rendered, or to reflect the percentage completion ofthe related services where rendered over time.Interest incomeInterest income is recognised using the effective interest method.Dividend incomeDividend income is recognised on the date when the group’s right to receive payment is established.Development contributions, financial contributions and infrastructure growth chargeDevelopment contributions, financial contributions and infrastructure growth charges received towards the construction of property, plant and equipmentare recognised at the time an application is approved.Vested assets revenueVested assets revenue is recognised when control over the assets is obtained.6. GRANT EXPENDITUREThe company provides funding to its subsidiaries in the form of grants, which is treated as expenditure in the company’s books and as income in thesubsidiaries books. On consolidation this expenditure is offset by the income in the subsidiaries books whilst the actual expenditure is recognised in thegroup accounts when the subsidiaries incur the expenditure.7. FINANCE COSTSFinance costs directly attributable to the acquisition, construction or production of a qualifying asset that necessarily takes a substantial period of time toget ready for its intended use or sale are capitalised as part of the cost of that asset. All other finance costs are expensed in the period they occur. Financecosts consist of interest and other costs that are incurred in connection <strong>with</strong> the borrowing of funds.8. BUSINESS INTEGRATION COSTSCosts associated <strong>with</strong> planning the integration of the water and the wastewater businesses in the Auckland region were expensed in the period in whichthey were incurred, except for related capital projects.9. LEASESThe group leases certain property, plant and equipment where the lessor effectively retains substantially all the risks and benefits of ownership. Amountspayable under the terms of these leases are recognised as an expense spread evenly over the term of the lease.10. RESEARCH AND DEVELOPMENTResearch costs are expensed as incurred. Development expenditure on individual projects is capitalised and recognised as an asset when it meets thedefinition and criteria for capitalisation as an asset and it is probable that the group will receive future economic benefits from the asset. Assets which havefinite lives are stated at cost less accumulated amortisation and are amortised on a straight-line basis over their useful lives.11. PROPERTY, PLANT AND EQUIPMENTClasses of assetsProperty, plant and equipment is allocated to classes, being:– Land (including improvements)– Buildings– Pipelines– Tanks, tunnels, roads and reservoirs– Dams– Machinery– Motor vehicles– Office equipment– Work in progressInitial recognitionThe cost of purchased property, plant and equipment is the initial purchase price plus directly attributable costs of bringing the assets to the location andcondition necessary for their intended use.Constructed assets are initially recorded as work in progress at the cost of construction (including <strong>material</strong>s and direct labour), finance costs and otherdirect costs until the asset is ready for productive use. Finance costs incurred during the course of construction that are attributable to a project arecapitalised, using the finance rate applicable to the funding. When the asset is ready for productive use the on-going operating and finance costs arerecorded as expenses.Return to contents page2012 financial report PAGE 81
<strong>Watercare</strong> Services Limited2012 ANNUAL REPORTSTATEMENT OF AccountinG Policies (continued)FOR THE YEAR ENDED 30 JUNE 2012SIGNIFICANT ACCOUNTING POLICIES (continued)11. PROPERTY, PLANT AND EQUIPMENT (continued)Subsequent recognitionLand and buildings are carried at fair values that reflect current market values, which is the amount that would be expected from an orderly sale,determined by an independent registered valuer at least every three years.Pipelines, tanks, tunnels, roads, reservoirs, dams and machinery are also carried at fair value, which is deemed to be depreciated replacement cost becausethe assets are of a specialised nature. The depreciated replacement costs are determined on the basis of an independent valuation prepared by externalvaluers at least every three years.The revaluation process involves assessing the current replacement cost and remaining useful lives of the specialised property, plant and equipment.Any property, plant and equipment that has been acquired after the most recent valuation is carried at cost less accumulated depreciation and impairmentuntil the next revaluation.Motor vehicles and office equipment are carried at cost less accumulated depreciation. Work in progress is carried at cost.The changes in the value of each class of property, plant and equipment as a result of the revaluations are recorded in other comprehensive income andaccumulated in a revaluation reserve. The group maintains a revaluation reserve for each class of assets. Where cumulative decreases exceed cumulativeincreases in the value of a class of assets, the net amount is recognised as an expense in determining the surplus or deficit for the year. Any revaluationincrease is credited to the asset class revaluation reserve, except to the extent that it reverses a revaluation decrease for the same asset previously chargedas an expense in determining the surplus or deficit for the year. Any accumulated depreciation at the date of the revaluation is transferred to the grosscarrying amount of the asset and the asset cost is restated to the revalued amount.ImpairmentAsset carrying values are reviewed for impairment whenever events or changes in circumstances indicate the carrying amount may not be recoverable.An impairment loss is recognised if the estimated recoverable amount of an asset is less than its carrying amount. The recoverable amount is the higher ofan asset’s fair value less costs to sell and value in use. For revalued assets, value in use is the depreciated replacement cost for an asset, where the futureeconomic benefits of the asset are not primarily dependent on the asset’s ability to generate net cash inflows, and where the entity would, if deprived ofthe asset, replace its remaining future economic benefits. The value in use for cash-generating assets is the present value of expected future cash flows. Ifan asset’s carrying amount exceeds its recoverable amount, the asset is impaired and the carrying amount is written down to the recoverable amount.For revalued assets, the impairment loss is recognised in other comprehensive income to the extent that the impairment loss does not exceed the amountin the revaluation surplus for that same class of asset. The reversal of an impairment loss on a revalued asset is credited to the revaluation reserve.However, to the extent that an impairment loss on the same class of asset was previously recognised <strong>with</strong>in surplus or deficit, a reversal of that impairmentloss is also recognised <strong>with</strong>in surplus or deficit. For assets not carried at a revalued amount the total impairment loss and the reversal of an impairment loss(for assets other than goodwill) is recognised in the surplus or deficit.DepreciationDepreciation is provided on a straight-line basis on all property, plant and equipment, other than freehold land, at rates calculated to allocate their cost orrevalued amounts over their estimated useful lives. Assets are depreciated to a nil residual value.for 2012 2012 2011Asset class Range of useful lives in years Average useful life in yearsBuildings 10 to 109 62 65Pipelines 2 to 399 109 113tanks, tunnels, roads and reservoirs 3 to 200 79 79dams 3 to 200 185 189machinery 1 to 200 49 44motor vehicles 1 to 8 6 4office equipment 1 to 20 7 512. INTANGIBLE ASSETSComputer software assets and network models are recorded at cost less accumulated amortisation and accumulated impairment losses. Amortisation ischarged on a straight-line basis over their estimated useful lives.Easements are recognised at cost, being the costs directly attributable in bringing the asset to its intended use. Easements have an indefinite useful life andare not amortised, but are instead tested for impairment annually.Resource Management Act consents are recorded at cost less accumulated amortisation and accumulated impairment losses. Amortisation is charged on astraight-line basis, over the term of the consent.Intangible assets’ carrying values are reviewed at the end of each year to determine whether there is any indication that those assets have suffered animpairment loss. If any impairment loss has occurred, the carrying value of the asset is adjusted and the loss recognised in determining the surplus ordeficit for the year.for 2012 2012 2011Asset class Range of useful lives in years Average useful life in yearsnetwork models 1 to 4 4 4computer software 1 to 10 5 7Resource consents 1 to 39 30 33PAGE 82 2012 financial reportReturn to contents page
<strong>Watercare</strong> Services Limited2012 ANNUAL REPORTSTATEMENT OF AccountinG Policies (continued)FOR THE YEAR ENDED 30 JUNE 2012SIGNIFICANT ACCOUNTING POLICIES (continued)13. INCOMECurrent taxCurrent tax is calculated by reference to the amount of income taxes payable or recoverable in respect of the taxable profit or loss for the year. Current taxfor current and prior years is recognised as a liability (or asset) to the extent it is unpaid (or refundable).Deferred taxDeferred tax is accounted for using the comprehensive balance sheet liability method in respect of temporary differences arising from differences betweenthe carrying amounts of assets and liabilities in the financial statements and the corresponding tax base of those items.In principle, deferred tax liabilities are recognised for all temporary differences. Deferred tax assets are recognised to the extent that it is probable thatsufficient taxable amounts will be available against which deductible temporary differences or unused tax losses and tax offsets can be utilised.Current and deferred tax assets and liabilities are measured at the tax rates that are expected to apply to year(s) when the asset and liability giving rise tothem are realised or settled, based on tax rates (and tax laws) that have been enacted or substantively enacted by the reporting date.14. INVENTORIESInventories comprise consumables, spare parts and treated water.Consumables are recorded at the lower of cost (determined on a weighted average basis) and net realisable value.Spare parts are recorded at cost less an adjustment for the reduction in economic benefits due to obsolescence. The cost of spare parts is recordedas an expense when used for repairs and maintenance on existing plant and equipment, or recorded as part of the cost of the new asset if used in theconstruction of new property, plant and equipment.Treated water in the network and reservoirs is recorded at the lower of cost and net realisable value.15. PROVISIONSThe group provides for the cost of employees’ entitlements to annual leave, sick leave and gratuities under the terms of their employment contracts. Theseamounts are expected to be settled <strong>with</strong>in one year and are therefore recorded in current provisions.The group provides for the liability for employees’ long service leave under the terms of their employment contracts. The liability is calculated as thepresent value of the expected future payments after allowing for wage and salary increases, the rate of staff turnover and term of service <strong>with</strong> the group.Long service leave is recorded in current and non-current provisions. The amount recorded in non-current provisions represents the portion which is duefor payment beyond one year from the reporting date.Other provisions are recognised when the group has a present obligation as a result of a past event and it is probable that there is a future outflow ofresources and the amount of the provision can be reliably measured.The amount recorded as a provision is the best estimate of the consideration required to settle the obligation at the end of each year.16. CONTRACT RETENTIONSCertain construction contracts entitle the group to retain specified amounts to ensure the performance of contract obligations. These retentions arerecorded as a liability, and either used to remedy contract performance or paid to the contractor at the end of the retention period.17. FOREIGN CURRENCIESThe cost of assets purchased <strong>with</strong> foreign currencies is calculated using the exchange rate on the date of purchase. Any difference between this cost andthe amount later required to settle the transaction is recognised as a foreign exchange gain or loss.Operating expenses in foreign currencies are converted at the rate of exchange on the date of the transaction.18. FINANCIAL INSTRUMENTSA financial instrument is any contract that gives rise to a financial asset of one entity and a financial liability or equity instrument in another. As such, thegroup recognises all its financial instruments as soon as it becomes a party to the contractual provisions of the financial instrument.At each reporting date the group includes in its statement of financial position a range of financial assets that include cash and short-term deposits, tradeand other receivables, and derivative instruments. Similarly it also reflects in its statement of financial position a number of financial liabilities that includebank overdrafts, trade and other payables, borrowings and derivative instruments.A derivative is a financial instrument or other contract that satisfies all of the following characteristics: its value changes in response to the change in aspecified variable such as an interest rate, financial instrument price, commodity price, foreign exchange rate, index of prices or rates, credit rating or creditindex; it requires no initial investment or an initial investment that is smaller than would be required for other types of similar contracts and it will besettled at some future date.Sourcing fair valuesFor financial instruments that are traded in active markets, quoted market prices are used as a measure of fair value. Where quoted market prices do notexist, fair values are estimated using present value or other market-accepted valuation techniques, using methods and assumptions that are based onmarket conditions and risks existing at balance date.Recognition and measurement of financial assetsFinancial assets are initially measured at fair value and for the purpose of subsequent measurement, the group has categorised financial assets into thefollowing categories. Each category determines the process of subsequent measurement and how the resulting surplus or deficit should be reflected in thestatement of comprehensive income. The group does not currently have financial assets in the held-to-maturity and available-for-sale categories.Loans and receivablesThe group’s cash and cash equivalents and trade and other receivables fall into this category of financial instruments. These are initially recorded at theirfair value plus transaction costs because they have fixed or determinable payments that are not quoted in an active market. Fair value is estimated as thepresent value of future cash flows.Return to contents page2012 financial report PAGE 83
<strong>Watercare</strong> Services Limited2012 ANNUAL REPORTSTATEMENT OF AccountinG Policies (continued)FOR THE YEAR ENDED 30 JUNE 2012SIGNIFICANT ACCOUNTING POLICIES (continued)18. FINANCIAL INSTRUMENTS (continued)Loans and receivables (continued)After initial recognition, they are recorded at amortised cost using the effective interest method, less provision for impairment. The amount of impairmentloss is the difference between the assets’ carrying amount and the present value of estimated future cash flows, discounted at the original effective interestrate. The amount of the impairment loss is recognised in determining the surplus or deficit for the year.The collection of trade receivables is reviewed on an on-going basis and debts known to be uncollectible are written off. When there is objective evidencethat the group will not be able to collect all amounts due according to the original terms of the receivables, a provision is made for doubtful receivables torecognise impairment in the carrying value of receivables at balance date. This amount provided is recorded in determining surplus or deficit.Financial assets at fair value through profit or lossAll derivative financial instruments fall into this category, except for those designated as, and effective as, hedging instruments, for which the hedgeaccounting requirements apply. The group does not apply hedge accounting.Financial assets carried at fair value through profit or loss are initially recorded at fair value.Financial assets can be classified as at fair value through profit or loss only if they are either classified as held for trading or upon initial recognition they aredesignated as at fair value through profit and loss. The group does not currently have any financial assets in the categories of held for trading or designatedupon initial recognition as at fair value through profit or loss.Recognition and measurement of financial liabilitiesFinancial liabilities are initially recorded at their fair value plus transaction costs.Financial liabilities are recorded subsequently at amortised cost using the effective interest method, except for financial liabilities held for trading ordesignated at fair value through profit or loss. Those liabilities are recorded subsequently at fair value <strong>with</strong> gains or losses recognised in surplus or deficit.Trade and other payables represent liabilities for goods and services provided to the group prior to the end of the financial year which are unpaid. Theamounts are unsecured and are usually paid <strong>with</strong>in 30 days of recognition.The group does not currently have any financial liabilities in the categories of held for trading or designated at fair value through profit or loss.Borrowings are recorded at fair value, net of transaction costs.Borrowings are subsequently measured at amortised cost using the effective interest method, <strong>with</strong> interest expense recognised on an effective interestbasis. Fees and expenses for establishing new borrowings are amortised over the term of those borrowings using the effective interest method. Accruedinterest is presented separately <strong>with</strong>in accruals.Borrowings are classified as current liabilities unless the group has an unconditional right to defer settlement of the liability for at least 12 months after thereporting date.Derivative financial instrumentsDerivative instruments are used by the group to manage its exposures to interest rate and foreign currency risks.Derivative financial instruments are recorded at fair value in the statement of financial position and fair value changes are accounted for through surplusor deficit.Derecognition of financial instrumentsFinancial assets are derecognised only when the contractual rights to the cash flows from the financial asset have expired, or when the financial asset andall substantial risks and rewards associated <strong>with</strong> it have been transferred.Financial liabilities are derecognised when they have either been extinguished, discharged, cancelled or have expired.19. STATEMENT OF CASH FLOWSFor the purpose of the statement of cash flows, cash and cash equivalents include cash on hand net of outstanding bank overdrafts. The following termsare used in the statement of cash flows:– “Operating activities” are amounts received for the supply of services by the group, and payments made to employees and suppliers necessary tosupport those services, including finance costs. Operating activities also include any transactions or events that are not investing or financing activities;– “Investing activities” are amounts paid or received for the acquisition and disposal of property, plant and equipment and other investments notincluded in cash equivalents; and– “Financing activities” are the receipt and repayment of the principal on borrowings, and contributions from, and distributions to, shareholders.20. INSURANCEAny uninsured loss is recorded in determining the surplus or deficit for the year in which the loss is incurred. Insurance recoveries are recorded only whenthere is virtual certainty of receipt.21. ACCOUNTING STANDARDS AND INTERPRETATIONsThe External Reporting Board (XRB) is currently in the process of establishing a new Accounting Standards Framework based on a multi-sector, reportingtiers approach. The new accounting standards framework will consist of two sets of accounting standards, one to be applied by entities <strong>with</strong> a for-profitobjective and the other to be applied by public benefit entities. In the interim, all new New Zealand equivalents to International Financial ReportingStandards (NZ IFRSs) and amendments to existing NZ IFRSs approved in and subsequent to, June 2011 would be applicable to profit-oriented entities only.This means that the financial reporting requirements for public benefit entities (PBEs) are frozen for the short-term. Consequently, new or amended NZ IFRSreleased during the year are not applicable to public benefit entities and hence no disclosure has been made.CHANGES IN ACCOUNTING POLICIESThere have been no changes in accounting policies during the year.PAGE 84 2012 financial reportReturn to contents page
<strong>Watercare</strong> Services Limited2012 ANNUAL REPORTNOTES TO THE FINANCIAL STATEMENTSFOR THE YEAR ENDED 30 JUNE 20121. REVENUEThe water and wastewater revenue represents the amounts invoiced to customers and the accrual of unbilled water and wastewater revenue. This revenueexcludes any price adjustment (refer Note 2).2012 2011Group and CompanyGroup and Company$000 $000Revenue from sale of goodsRetail and bulk water 129,543 131,438Revenue from rendering of servicesWastewater revenue 263,624 203,773Trade waste revenue 12,462 14,038Total water and wastewater revenue 405,629 349,249Water and wastewater revenue is shown net of leak remissions and prompt payment discount (PPD).Below is a breakdown of leak remission and PPD:Water and wastewater revenue 398,060 346,358Leak remission – water (1,968) (689)Leak remission – wastewater (2,396) (994)Prompt payment discount – water (356) (4,031)Prompt payment discount – wastewater (173) (5,433)Water and wastewater revenue net of remissions and PPD 393,167 335,211Trade waste revenue 12,462 14,038Total water and wastewater revenue 405,629 349,249Other revenueInfrastructure growth charge 14,012 7,374Developer and financial contributions 3,389 3,945New meters and service connections 4,667 2,690Vested assets revenue 816 –Other revenue 12,587 9,011Dividend income 97 34Interest income 753 804Total other revenue 36,321 23,858Total revenue 441,950 373,1072. PRICE ADJUSTMENTSection 57(1)(a) of the Local Government (Auckland Council) Act 2009 states that the company must manage its operations efficiently <strong>with</strong> a view tokeeping the overall costs of water supply and wastewater services to its customers (collectively) at the minimum levels consistent <strong>with</strong> the effectiveconduct of its undertakings and the maintenance of the long-term integrity of its assets.Further, Section 18(j) of the Local Government (Auckland Transitional Provisions) Act 2010 stipulates that until the year ended 30 June 2012, the companymust promptly decide, for any year in which a surplus arises, whether or not to return the surplus to its customers; and if it is to return the surplus, decideon and implement the method by which the surplus may be returned (for example, by way of rebate, discount, or adjustment of charges calculated byreference to prior or future charges to its customers).Pursuant to this section the group decided that no price adjustment would be paid for the year ended 30 June 2012 (2011: nil).Return to contents page2012 financial report PAGE 85
<strong>Watercare</strong> Services Limited2012 ANNUAL REPORTNOTES TO THE FINANCIAL STATEMENTS (continued)FOR THE YEAR ENDED 30 JUNE 20123. OPERATING EXPENSES2012 2011Group and Company Group and CompanyNotes $000 $000Operating expenses include:Auditors’ remuneration – annual audit of the financial statements 508 470– audit fee relating to integration of retail business – 140– other services provided 19 208Directors’ fees note 27, page 111 484 560Environmentally significant costs – chemicals 10,360 9,329– energy 16,556 13,544Cost of consumables and spare parts consumed 3,209 3,184(Decrease)/increase in provision for obsolescence of inventory (234) 251Operating leases and rent 4,245 3,010Increase in provision for doubtful debts 77 1,313Bad debts written off 612 30Salaries and wages – paid to employees 53,763 46,480– capitalised on construction of property, plant and equipmentor recorded <strong>with</strong>in asset operating costs and maintenance costs (16,748) (20,598)– included in employee benefit expenses 37,015 25,882Auditors’ remuneration for other assurance services included the review of financial information systems and assistance on taxation matters. Prior yearother services included the review of financial and information systems.4. DEPRECIATION AND AMORTISATION2012 2011Group and Company Group and Company$000 $000Buildings 3,621 2,720pipelines 109,326 85,941Tanks, tunnels, roads and reservoirs 10,334 12,984dams 1,823 1,910machinery 42,717 31,740motor vehicles 341 334Office equipment 1,550 1,447network models 1,252 1,109computer software 8,080 4,693resource consents 778 748Total depreciation and amortisation 179,822 143,6265. FINANCE COSTS2012 2011Group and Company Group and Company$000 $000Interest on bank overdraft and borrowings, paid and payable 79,206 65,821Capitalised interest on construction of property, plant and equipment (2012: 6.60% , 2011: 6.79%) (6,619) (4,714)Net finance costs 72,586 61,107PAGE 86 2012 financial reportReturn to contents page
<strong>Watercare</strong> Services Limited2012 ANNUAL REPORTNOTES TO THE FINANCIAL STATEMENTS (continued)FOR THE YEAR ENDED 30 JUNE 20126. REVALUATION OF DERIVATIVE FINANCIAL INSTRUMENTS2012 2011Group and Company Group and Company$000 $000Interest rate swaps contracts loss 61,434 12,593Forward foreign exchange contracts (gain)/loss (816) 974Net revaluation loss 60,618 13,5677. OPERATING CASH FLOWS2012 2011Group and Company Group and Company$000 $000Reconciliation of net deficit after tax to net cash flows from operating activitiesNet deficit for the year (45,305) (12,333)Non-cash and non-operating items:depreciation and amortisation 179,822 143,626Redundant assets written off and gain or loss on disposal 8,465 2,556vested assets revenue (816) –Contributions towards cost of constructing property, plant and equipment (3,389) (3,945)Deferred tax (18,878) 4,438Movements in working capital:(Increase)/decrease in assets:inventories 1,703 (1,556)trade and other receivables 7,918 16,060Derivative financial instruments – asset (10,797) (7,393)Prepaid expenses (24,105) 258Increase/(decrease) in liabilities:Trade and other payables and accruals (3,779) 15,860Derivative financial instruments – liability 71,414 20,960Payables relating to investing activities – 574provisions 1,141 (3,070)Net cash flows from operating activities 163,394 176,035Return to contents page2012 financial report PAGE 87
<strong>Watercare</strong> Services Limited2012 ANNUAL REPORTNOTES TO THE FINANCIAL STATEMENTS (continued)FOR THE YEAR ENDED 30 JUNE 20128. INCOME TAX2012 2011Group and Company Group and Company$000 $000Operating deficit before tax (64,183) (7,895)Income tax calculated at current rate of 28% (2011: 30%) (17,971) (2,368)Dividend and other income exempt from taxation (242) (2)Non deductible expenses 99 377Imputation credits on dividends received (38) (14)Prior year and other adjustments (726) (551)Tax effect of non-deductible items and prior period adjustments (907) (190)Tax depreciation on buildings acquired on integration being non-deductible from 1 July 2011 – 6,064Deferred tax as a result of reducing the corporate tax rate from 30% to 28% from 1 July 2011 – 932Tax effect of non-recurring items – 6,996Income tax (benefit)/expense (18,878) 4,438Represented by:Deferred tax (18,878) 4,438Income tax (benefit)/expense (18,878) 4,4382012 2011Group and Company Group and CompanyImputation credits $000 $000Total imputation credits 30,134 30,096The imputation credit account is a memorandum account and does not form part of the statement of financial position.PAGE 88 2012 financial reportReturn to contents page
<strong>Watercare</strong> Services Limited2012 ANNUAL REPORTNOTES TO THE FINANCIAL STATEMENTS (continued)FOR THE YEAR ENDED 30 JUNE 20129. DEFERRED TAX LIABILITY2012 2011Group and Company Group and Company$000 $000Balance at I July 2011 848,828 402,049Deferred tax arising on integration recorded in capital reserve – 301,613Deferred tax recognised in other comprehensive income –resulting from the revaluation of property, plant and equipment – 140,728Deferred tax recognised in other comprehensive income, resulting fromtransfer to retained earnings relating to disposal of property, plant and equipment 2,095 1,520Deferred tax recognised in other comprehensive income, resulting from transfer fromrevaluation reserve relating to disposal of property, plant and equipment (2,095) (1,520)Deferred tax recognised in the deficit for the year (18,878) (2,558)Tax depreciation on buildings acquired on integration being non-deductible from1 July 2011 – 6,064Deferred tax on tax losses and property, plant and equipment as a result of thereduction of the corporate tax rate from 30% to 28% from 1 July 2011recognised in the deficit for the year – 932Balance at 30 June 2012 829,950 848,828The balance relates to:Depreciation temporary differences 1,002,921 967,457Provisions and accrued expenses temporary differences (31,515) (15,652)Tax losses (141,456) (102,977)Total deferred tax liability 829,950 848,828The group’s subsidiary <strong>Watercare</strong> Harbour Clean-Up Trust was exempt from tax and the group’s other subsidiaries Auckland City Water Limited and Te MotuA Hiaroa (Puketutu Island) Park Trust were both non-trading entities. Metrowater Community Trust, a subsidiary of <strong>Watercare</strong> was also exempt from tax andit was wound up during December 2011.The depreciation temporary differences for property, plant and equipment arose because the carrying value of property, plant and equipment was higherfor accounting purposes than for taxation purposes, for example due to:– The revaluation of certain assets; and– The group’s depreciation rates being lower than those permitted by tax legislation.The provisions and accrued expenses temporary differences principally related to the mark-to-market revaluation of financial instruments. These expenseswere recognised for accounting purposes but cannot be deducted for tax purposes until the amounts become payable.During the prior year, under Section 83 of the Local Government (Auckland Transitional Provisions) Act 2010 the company integrated the closing taxposition of Metrowater Limited and Manukau Water Limited. Additionally, the closing accounting book value for all assets inherited from the Councils waslegislated to be the opening tax book value of the company at 1 November 2010.10. ISSUED CAPITALThe total number of authorised and issued shares at balance date was 260,693,164 (2011: 260,693,164) ordinary shares of $1 each. All ordinary issuedshares were fully paid and carry equal voting rights to:– one vote on a poll at a meeting of the company on any resolution; and– an equal share in the distribution of the surplus assets of the company.Under Section 57(1)(b) of the Local Government (Auckland Council) Act 2009 the company must not pay any dividend or distribute any surplus in any way,directly or indirectly to its shareholder. The capital management policy of the group is detailed in Note 22, page 109.Return to contents page2012 financial report PAGE 89
<strong>Watercare</strong> Services Limited2012 ANNUAL REPORTNOTES TO THE FINANCIAL STATEMENTS (continued)FOR THE YEAR ENDED 30 JUNE 201211. SUBSIDIARIES AND INTEGRATION OF RETAIL BUSINESSSUBSIDIARIESThe group disclosures in these financial statements represent the consolidated numbers of <strong>Watercare</strong> Services Limited (company) and its subsidiaries. Thenet assets at balance date of each of the company’s subsidiaries are im<strong>material</strong> to the consolidated financial position of the group. As at the balance date,the details of the company’s subsidiaries, net assets, revenue and net surplus or deficit for each subsidiary after inter-entity eliminations are as follows:Water Utility Consumer Assistance TrustThe Water Utility Consumer Assistance Trust was formed in October 2011 and is a charitable trust. Its principal activity is to assist eligible residentialcustomers of the company who are unable to pay their water and wastewater charges by approving a payment arrangement which may includerecommending to <strong>Watercare</strong> a write-off of part or the entire amount owed. <strong>Watercare</strong> has the power to appoint two out of five of the Trustees on theTrust board. The Trust is fully funded by <strong>Watercare</strong>. The net assets of Water Utility Consumer Assistance Trust at balance date comprise a cash and cashequivalent balance of $9,712 (2011: $nil) and accrued expenses of $5,179 (2011: $nil). The Trust recorded revenue of $145 and a net surplus of $4,533for the year (2011: $nil).<strong>Watercare</strong> Harbour Clean-Up TrustThe <strong>Watercare</strong> Harbour Clean-Up Trust was set up during December 2002 by several local authorities as The Waitemata Harbour Clean-Up Trust and isa charitable trust. Its principal activity is to promote and monitor the cleaning up of Auckland’s Waitemata harbour <strong>with</strong> a view to preserving its naturalbeauty for the benefit and enjoyment of the public. During 2010/ 2011, <strong>Watercare</strong> became the primary funder of this Trust and at 30 June 2012 twoof the four Trustees on the board were current <strong>Watercare</strong> employees. The name of the Trust was changed to <strong>Watercare</strong> Harbour Clean-Up Trust duringDecember 2011. The net assets acquired from the Trust as at 1 July 2011 comprise cash and cash equivalents of $219,572 and payables of $727.The net assets of the Trust at balance date comprise a cash and cash equivalents balance of $295,992 (2011: $nil) and accrued expenses of $25,730(2011: $nil). The Trust recorded revenue of $48,205 and a net surplus of $51,418 for the year (2011: $nil).Metrowater Community TrustThe Metrowater Community Trust was formed in February 2001 to assist low income families and individuals who cannot afford to pay their water andwastewater bills and individuals who have special needs in relation to water use. The Metrowater Community Trust was wound up during December2011 and all liabilities were settled and assets were distributed to the Water Utility Consumer Assistance Trust. At the date of winding up the net assetsof Metrowater Community Trust were $nil (2011: cash balance of $32,084 and accrued expenses of $15,206). The Metrowater Community Trust recordedrevenue of $143 and a net deficit of $16,900 for the year (2011: revenue of $nil and a net deficit of $114,643).Auckland City Water LimitedAuckland City Water Limited is 100% owned by <strong>Watercare</strong> and it is non-trading company. The net assets of Auckland City Water Limited at balance datecomprise $nil (2011: $nil).Te Motu A Hiaroa (Puketutu Island) Park TrustThe objective of the Te Motu A Hiaroa (Puketutu Island) Park Trust is to make Puketutu Island available as a public park, thereby providing a significantaddition to the open space, amenity and recreational assets for Auckland’s population. The Trust is a 100% subsidiary of <strong>Watercare</strong> and was non-tradingduring the year.The total net assets of all the above subsidiaries included in the consolidated financial position of the group are $274,795 (2011: $16,878), comprisingcash and cash equivalents balance of $305,704 (2011: $32,084) and accrued expenses of $30,909 (2011: $15,206).INTEGRATION OF RETAIL BUSINESSDuring the prior year, as at 1 November 2010, the retail water and wastewater businesses in the Auckland region were integrated as below into thecompany as part of the Auckland local body reorganisation:Business integratedMetrowater LimitedManukau Water LimitedNorth Shore City CouncilWaitakere City CouncilRodney District CouncilFranklin District CouncilPapakura District CouncilAuckland City CouncilSubsidiaries acquiredMetrowater Community TrustAuckland City Water Limitedprincipal activityretail water and wastewater servicesretail water and wastewater servicesretail water and wastewater servicesretail water and wastewater servicesretail water and wastewater servicesretail water and wastewater servicesretail water and wastewater servicesretail water and wastewater servicesprincipal activityassists water users (low income or special water usage needs)non-trading companyPAGE 90 2012 financial reportReturn to contents page
<strong>Watercare</strong> Services Limited2012 ANNUAL REPORTNOTES TO THE FINANCIAL STATEMENTS (continued)FOR THE YEAR ENDED 30 JUNE 201211. SUBSIDIARIES AND INTEGRATION OF RETAIL BUSINESS (continued)INTEGRATION OF RETAIL BUSINESS (continued)BUSINESSESINTEGRATEDMetroWaterLimitedManukauWaterLimitedNorthShoreCityCouncilWaitakereCityCouncilRodneyDistrictCouncilFranklinDistrictCouncilAucklandCityCouncilPapakuraDistrictCouncilAucklandRegionalCouncil Adjustments Total$000 $000 $000 $000 $000 $000 $000 $000 $000 $000 $000Current assetsCash andbank balances – 11,953 – – – – – – – – 11,953Trade and otherreceivables 32,604 32,946 9,485 9,409 7,251 729 – – – – 92,424Inventories – – 72 – – – – – – – 72Non-currentassetsProperty, plantand equipment 1,386,590 1,019,143 1,204,462 482,515 323,940 154,985 70,418 84,111 – 8,799 4,734,963Intangible assets 4,541 2,368 459 – – – – – – – 7,368Current liabilitiesBank overdraft (5,605) – – – – – – – – – (5,605)Trade andother payables (17,636) (11,869) (1,293) (1,382) (305) (61) – (9,534) – – (42,080)Retentions (660) (495) (2,494) (213) (247) (263) – – – – (4,372)Employee benefitliabilities (776) (351) (524) (208) (64) (18) – – – – (1,941)Non-currentliabilitiesBorrowings (215,000) (134,368) (95,489) (145,428) (63,015) (21,977) (22,436) (8,297) (6,048) – (712,058)Deferred taxliability (279,537) (19,612) – – – – – – – (2,464) (301,613)Net assetsintegrated 904,521 899,715 1,114,678 344,693 267,560 133,395 47,982 66,280 (6,048) 6,335 3,779,111Capital reserve (904,521) (899,715) (1,114,678) (344,693) (267,560) (133,395) (47,982) (66,280) 6,048 (6,335) (3,779,111)Adjustments for accounting policy differences:– The net assets of the integrated companies were transferred into the financial statements of the company at net book value and subsequently adjustedfor differences in accounting policies as explained below. See accounting policy 3 on integration of retail business.– The company’s policy is to capitalise finance costs incurred during the course of construction that are attributable to a project using the finance rateapplicable to the funding. To achieve consistency between the company’s policy and the integrated businesses, finance costs attributable to theintegrated property, plant and equipment were estimated using the depreciated replacement cost method and capitalised as at 1 November 2010. Thisresulted in an increase of $8.8 million to property, plant and equipment <strong>with</strong> an increase to deferred tax liability of $2.5 million and a net increase of$6.3 million to capital reserve as shown under adjustments above.There were no other adjustments made to achieve consistency in accounting policies.Return to contents page2012 financial report PAGE 91
<strong>Watercare</strong> Services Limited2012 ANNUAL REPORTNOTES TO THE FINANCIAL STATEMENTS (continued)FOR THE YEAR ENDED 30 JUNE 201211. SUBSIDIARIES AND INTEGRATION OF RETAIL BUSINESS (continued)INTEGRATION OF RETAIL BUSINESS (continued)Summary of assets and liabilities acquiredThe group acquired two subsidiaries, Metrowater Community Trust and Auckland City Water Limited (non-trading company) as part of the Auckland localbody reorganisation. The net assets acquired from the subsidiaries as at 1 November 2010 were as shown below:MetrowaterCommunity TrustAuckland City WaterLimitedTotalSUBSIDIARIES ACQUIRED $000 $000 $000Current assetsCash and bank balances 51 – 51Trade and other receivables 90 – 90Current liabilitiesTrade and other payables (10) – (10)Net assets acquired 131 – 13112. REVALUATION RESERVES2012 2011Group and CompanyGroup and Company$000 $000Balances at beginning of year 1,429,619 1,071,655Revaluation – net of deferred tax – 361,873Transferred to retained earnings on disposal of property, plant and equipment – net of tax (5,388) (3,909)Total revaluation reserves 1,424,231 1,429,619Comprising:land 48,517 48,517Buildings 31,953 31,953pipelines 837,391 844,715Tanks, tunnels, roads and reservoirs 281,782 281,705dams 79,171 79,171machinery 145,417 143,558Total revaluation reserves 1,424,231 1,429,619Analysis:LandBalances at beginning of year 48,517 47,163revaluation – 1,354Total land revaluation reserves 48,517 48,517BuildingsBalances at beginning of year 31,953 33,319revaluation – (1,080)Transferred to retained earnings on disposal of property, plant and equipment – net of tax – (286)Total buildings revaluation reserves 31,953 31,953PAGE 92 2012 financial reportReturn to contents page
<strong>Watercare</strong> Services Limited2012 ANNUAL REPORTNOTES TO THE FINANCIAL STATEMENTS (continued)FOR THE YEAR ENDED 30 JUNE 201212. REVALUATION RESERVES (continued)2012 2011Group and Company Group and Company$000 $000PipelinesBalances at beginning of year 844,715 569,176revaluation – 277,625Transferred to retained earnings on disposal of property, plant and equipment – net of tax (7,324) (2,086)Total pipelines revaluation reserves 837,391 844,715Tanks, tunnels, roads and reservoirsBalances at beginning of year 281,705 266,364revaluation – 13,556Transferred to retained earnings on disposal of property, plant and equipment – net of tax 77 1,785Total tanks, tunnels, roads and reservoirs revaluation reserves 281,782 281,705DamsBalances at beginning of year 79,171 69,940revaluation – 9,235Transferred to retained earnings on disposal of property, plant and equipment – net of tax – (4)Total dams revaluation reserves 79,171 79,171MachineryBalances at beginning of year 143,558 85,693revaluation – 61,183Transferred to retained earnings on disposal of property, plant and equipment – net of tax 1,859 (3,318)Total machinery revaluation reserves 145,417 143,558The revaluation reserve arises on the revaluation of property, plant and equipment. Where revalued property, plant and equipment was sold, the portion ofthe revaluation reserve that relates to that asset was effectively realised and transferred directly to retained earnings.Return to contents page2012 financial report PAGE 93
<strong>Watercare</strong> Services Limited2012 ANNUAL REPORTNOTES TO THE FINANCIAL STATEMENTS (continued)FOR THE YEAR ENDED 30 JUNE 201213. PROPERTY, PLANT AND EQUIPMENTProperty, plant and equipment – movement in gross carrying value2011 2012Group and CompanyOpening value Additions Disposals Depreciation Impairment Reclassification Closing value$000 $000 $000 $000 $000 $000 $000Land 119,339 4,879 – – – 29 124,247Buildings 113,352 2,905 – – – 301 116,558Pipelines 5,477,954 104,430 (3,841) – (2,871) 4,256 5,579,928Tanks, tunnels, roads and reservoirs 680,072 1,397 (16) – – (27,777) 653,676Dams 210,475 546 – – – (5,189) 205,832Machinery 795,384 61,602 (2,507) – (16) 28,010 882,473Motor vehicles 4,182 737 (20) – – – 4,899Office equipment 13,004 72 – – – 241 13,3177,413,762 176,568 (6,384) – (2,887) (129) 7,580,930Work in progress 288,288 43,942 – – – – 332,230Gross carrying value 7,702,050 220,510 (6,384) – (2,887) (129) 7,913,160Property, plant and equipment – movement in accumulated depreciation2011 2012Group and CompanyOpening value Additions Disposals Depreciation Impairment Reclassification Closing value$000 $000 $000 $000 $000 $000 $000Buildings (99) – – (3,621) – – (3,720)Pipelines (2,716) – 505 (109,326) 79 (9) (111,467)Tanks, tunnels, roads and reservoirs (56) – 1 (10,334) – – (10,389)Dams (71) – – (1,823) – – (1,894)Machinery (535) – 116 (42,717) – (14) (43,150)Motor vehicles (3,414) – 14 (341) – – (3,741)Office equipment (6,963) – – (1,550) – 23 (8,490)Accumulated depreciation (13,854) – 636 (169,712) 79 – (182,851)PAGE 94 2012 financial reportReturn to contents page
<strong>Watercare</strong> Services Limited2012 ANNUAL REPORTNOTES TO THE FINANCIAL STATEMENTS (continued)FOR THE YEAR ENDED 30 JUNE 201213. PROPERTY, PLANT AND EQUIPMENT (continued)Property, plant and equipment – movement in net book values including revaluation2011 2012Group and CompanyOpening value Additions Disposals Depreciation Impairment Reclassification Closing value$000 $000 $000 $000 $000 $000 $000Land 119,339 4,879 – – – 29 124,247Buildings 113,253 2,905 – (3,621) – 301 112,838Pipelines 5,475,238 104,430 (3,336) (109,326) (2,792) 4,247 5,468,461Tanks, tunnels, roads and reservoirs 680,016 1,397 (15) (10,334) – (27,777) 643,287Dams 210,404 546 – (1,823) – (5,189) 203,938Machinery 794,849 61,602 (2,391) (42,717) (16) 27,996 839,323Motor vehicles 768 737 (6) (341) – – 1,158Office equipment 6,041 72 – (1,550) – 264 4,8277,399,908 176,568 (5,748) (169,712) (2,808) (129) 7,398,079Work in progress 288,288 43,942 – – – – 332,230Net book value 7,688,196 220,510 (5,748) (169,712) (2,808) (129) 7,730,309The reclassification of assets between categories results from the on-going project to improve asset data quality. The predominant reason forreclassification was to split broadly categorised assets into their component assets. It was not practical to reclassify the prior year comparatives, due to thesize of the asset register.PROPERTY, PLANT AND EQUIPMENT – ComparAtivesProperty, plant and equipment – movement in gross carrying value2010 2010 2011Company 1 November Group and CompanyOpening value Integrated Additions Disposals Depreciation Revaluation Reclassification Closing value$000 $000 $000 $000 $000 $000 $000 $000Land 75,162 41,133 83 (288) – 1,880 1,369 119,339Buildings 99,367 17,145 3,016 (71) – (6,396) 291 113,352Pipelines 887,353 4,253,327 61,123 (2,889) – 279,026 14 5,477,954Tanks, tunnels,roads and reservoirs 625,932 48,359 9,266 (1,189) – (3,760) 1,464 680,072Dams 190,850 1,880 8,505 – – 9,240 – 210,475Machinery 439,819 307,895 26,936 (1,485) – 23,853 (1,634) 795,384Motor vehicles 4,358 272 45 (493) – – – 4,182Office equipment 9,965 1,519 3,365 (313) – – (1,532) 13,0042,332,806 4,671,530 112,339 (6,728) – 303,843 (28) 7,413,762Work in progress 160,441 63,432 64,415 – – – – 288,288Gross carrying value 2,493,247 4,734,962 176,754 (6,728) – 303,843 (28) 7,702,050Return to contents page2012 financial report PAGE 95
<strong>Watercare</strong> Services Limited2012 ANNUAL REPORTNOTES TO THE FINANCIAL STATEMENTS (continued)FOR THE YEAR ENDED 30 JUNE 201213. PROPERTY, PLANT AND EQUIPMENT (continued)PROPERTY, PLANT AND EQUIPMENT – ComparAtives (continued)Property, plant and equipment – movement in accumulated depreciation2010 2010 2011Company 1 November Group and CompanyOpening value Integrated Additions Disposals Depreciation Revaluation Reclassification Closing value$000 $000 $000 $000 $000 $000 $000 $000Buildings (2,303) – – 71 (2,720) 4,896 (43) (99)Pipelines (24,955) – – 1,614 (85,941) 106,563 3 (2,716)Tanks, tunnels,roads and reservoirs (10,779) – – 1,189 (12,984) 22,585 (67) (56)Dams (1,749) – – – (1,910) 3,588 – (71)Machinery (29,762) – – 921 (31,740) 61,125 (1,079) (535)Motor vehicles (3,572) – – 492 (334) – – (3,414)Office equipment (7,014) – – 312 (1,447) – 1,186 (6,963)Accumulated depreciation (80,134) – – 4,599 (137,076) 198,757 – (13,854)Property, plant and equipment – movement in net book values including revaluation2010 2010 2011Company 1 November Group and CompanyOpening value Integrated Additions Disposals Depreciation Revaluation Reclassification Closing value$000 $000 $000 $000 $000 $000 $000 $000Land 75,162 41,133 83 (288) – 1,880 1,369 119,339Buildings 97,064 17,145 3,016 – (2,720) (1,500) 248 113,253Pipelines 862,398 4,253,327 61,123 (1,275) (85,941) 385,589 17 5,475,238Tanks, tunnels,roads and reservoirs 615,153 48,359 9,266 – (12,984) 18,825 1,397 680,016Dams 189,101 1,880 8,505 – (1,910) 12,828 – 210,404Machinery 410,057 307,895 26,936 (564) (31,740) 84,978 (2,713) 794,849Motor vehicles 786 272 45 (1) (334) – – 768Office equipment 2,951 1,519 3,365 (1) (1,447) – (346) 6,0412,252,672 4,671,530 112,339 (2,129) (137,076) 502,600 (28) 7,399,908Work in progress 160,441 63,432 64,415 – – – – 288,288Net book value 2,413,113 4,734,962 176,754 (2,129) (137,076) 502,600 (28) 7,688,196All assets subject to valuation are independently valued at least every three years. The most recent valuation was completed at 30 June 2011. ANAGroup completed the valuation in association <strong>with</strong> Beca Valuations Limited (Beca) who completed a peer review of the work. The assumptions used indetermining the depreciated replacement cost of pipelines, tanks, roads, tunnels, reservoirs, dams and machinery were that:– construction costs based on recent contract-based construction work and the unit rates reflect the costs of replacing assets;– the useful lives of assets are calculated as the lesser of their physical life or the point where the asset is to be replaced for economic reasons;– the capital price goods index (CPGI) was used where indexation is appropriate. At the time of valuation the CPGI was available to the March 2011quarter; and– capitalised interest was applied to qualifying asset types in accordance <strong>with</strong> the estimated construction period and applicable cost of debt.Beca completed the valuation of land and buildings. The land valuation was based on relevant market prices and buildings were valued using thedepreciated replacement cost.The Local Government Acts 1974 and 2002 restrict the business activities of the group and effectively prevent selling of key assets. Many of the assetsare specialised in nature, reflecting the activities of the group. As there is no active market for such assets and the income from them is not determined bythe market, property, plant and equipment, other than land, buildings, motor vehicles and office equipment, are revalued to depreciated replacement cost,which reflects their deemed fair values.Each year, other than in the years in which the assets are revalued, the group assesses whether there was any <strong>material</strong> change in the value of property,plant and equipment. The movement in asset values between June 2011 and June 2012 was assessed using indices deemed suitable by the registeredvaluer ANA Group and Beca. The increase in asset value of 1.5% was not considered <strong>material</strong> by management and accordingly the assets were not revaluedat 30 June 2012.PAGE 96 2012 financial reportReturn to contents page
<strong>Watercare</strong> Services Limited2012 ANNUAL REPORTNOTES TO THE FINANCIAL STATEMENTS (continued)FOR THE YEAR ENDED 30 JUNE 201214. INTANGIBLE ASSETS (continued)INTANGIBLE ASSETS – ComparativesIntangibles – movement in gross carrying value2010 2010 2011Company 1 November Group and CompanyOpening value Integration Additions Disposals Amortisation Reclassifications Closing value$000 $000 $000 $000 $000 $000 $000Network models 3,301 3,346 – (673) – – 5,974Computer software 13,960 258 14,994 (784) – 28 28,456Resource consents 14,619 3,764 17 – – – 18,400Easements 484 – – – – – 484Gross carrying value 32,364 7,368 15,011 (1,457) – 28 53,314Intangibles – movement in accumulated amortisation2010 2010 2011Company 1 November Group and CompanyOpening value Integration Additions Disposals Amortisation Reclassifications Closing value$000 $000 $000 $000 $000 $000 $000Network models (2,137) – – 885 (1,109) – (2,361)Computer software (11,761) – – 570 (4,693) – (15,884)Resource consents (4,092) – – – (748) – (4,840)Accumulated amortisation (17,990) – – 1,455 (6,550) – (23,085)Intangibles – movement in net book values2010 2010 2011Company 1 November Group and CompanyOpening value Integration Additions Disposals Amortisation Reclassifications Closing value$000 $000 $000 $000 $000 $000 $000Network models 1,164 3,346 – 212 (1,109) – 3,613Computer software 2,199 258 14,994 (214) (4,693) 28 12,572Resource consents 10,527 3,764 17 – (748) – 13,560Easements 484 – – – – – 484Net book value 14,374 7,368 15,011 (2) (6,550) 28 30,229PAGE 98 2012 financial reportReturn to contents page
<strong>Watercare</strong> Services Limited2012 ANNUAL REPORTNOTES TO THE FINANCIAL STATEMENTS (continued)FOR THE YEAR ENDED 30 JUNE 201215. INVENTORIES2012 2011Group and Company Group and Company$000 $000Spare parts at cost 3,768 4,530consumables at cost 2,503 2,011treated water at cost 679 710Work in progress – 838project stock 248 1,045provision for obsolescence (1,768) (2,002)Total inventory 5,430 7,132Represented as:current inventory 2,793 4,092non-current inventory 2,637 3,040Total inventory 5,430 7,13216. TRADE AND OTHER RECEIVABLES2012 2011Group and Company Group and Company$000 $000CurrentTrade receivables – related parties 1,445 2,985Trade receivables – other 33,698 38,124Provision for doubtful debts (3,205) (3,128)31,938 37,981Other receivables 2,780 1,380Unbilled revenue accrual 36,872 40,147Total trade and other receivables 71,590 79,50817. PREPAID EXPENSESDuring the year, an amount of $23.9 million was paid to Kelliher Charitable Trust towards lease of land at Puketutu Island for disposal of biosolids by <strong>Watercare</strong>.The lease is for a period of 55 years <strong>with</strong> one right of renewal of 15 years. At balance date, the unamortised amount was $23.5 million of which $0.4 million wasincluded <strong>with</strong>in current prepaid expenses and $23.1 million <strong>with</strong>in non-current prepaid expenses.18. TRADE AND OTHER PAYABLES2012 2011Group and Company Group and Company$000 $000Currentcontract retentions 8,707 11,045Trade creditors – other 15,161 3,794Trade creditors – related parties 327 1,201other payables 289 117Total trade and other payables 24,484 16,157Return to contents page2012 financial report PAGE 99
<strong>Watercare</strong> Services Limited2012 ANNUAL REPORTNOTES TO THE FINANCIAL STATEMENTS (continued)FOR THE YEAR ENDED 30 JUNE 201219. accrued expenses2012 2011Group and Company Group and Company$000 $000CurrentCapital work in progress accruals 29,235 21,146interest payable 11,497 11,013Income received in advance 5,916 4,896operating costs accruals 15,186 30,872Total current accrued expenses 61,834 67,927Non-currentincome received in advance 8,840 9,100Total non-current accrued expenses 8,840 9,100Total accrued expenses 70,674 77,027Income received in advance includes $9.1 million (2011: $9.4 million) relating to the amount received in accordance <strong>with</strong> the franchise fee agreementbetween the network operator United Water International Pty Limited (United Water) and Papakura District Council (integrated into the company on1 November 2010). The franchise agreement grants the operator, the right to use the fixed utility systems owned by the group for the provision ofwater and wastewater services <strong>with</strong>in the Papakura district. Under the franchise agreement United Water is responsible for upgrading and maintainingthe network so that at the end of the contract period, the network shall be in a better overall condition than the condition at the time the contract wascommenced. The $13m fee received at the commencement of the agreement covers the right to use the assets for a 50-year period and is recognised asrevenue evenly over the term of the agreement.20. provisionS2012 2011Group and Company Group and Company$000 $000Currentemployee entitlements 5,019 3,790decommissioning costs 1,222 847other provisions – 159Total current provisions 6,241 4,796Non-currentemployee entitlements 1,464 1,392Total non-current provisions 1,464 1,392Total provisions 7,705 6,188EmployeeentitlementsDecommissioningcostsOtherprovisionsTotal$000 $000 $000 $000Balance at 1 July 2011 5,182 847 159 6,188Additions during the year 5,556 1,912 – 7,468Reductions resulting from payments (4,255) (1,537) (159) (5,951)Balance at 30 June 2012 6,483 1,222 – 7,705PAGE 100 2012 financial reportReturn to contents page
<strong>Watercare</strong> Services Limited2012 ANNUAL REPORTNOTES TO THE FINANCIAL STATEMENTS (continued)FOR THE YEAR ENDED 30 JUNE 201221. BORROWINGS2012 2011Group and Company Group and Company$000 $000CurrentRelated party term loan (unsecured) 89,312 67,154medium-term notes (unsecured) 227 50,000commercial paper (unsecured) 129,117 124,141Bank loan (unsecured) 13,500 –Total current borrowings 232,156 241,295Non-currentRelated party term loan (unsecured) 387,488 476,104medium-term notes (unsecured) 526,422 400,000term loan (unsecured) 150,000 100,000Bank loan (unsecured) – 11,500Total non-current borrowings 1,063,910 987,604Repayment schedule:Related party term loan (unsecured)less than one year 89,312 67,154one to two years 78,754 89,798Two to three years 136,394 79,128Three to four years 18,918 136,275Beyond four years 153,422 170,903Medium-term notesLess than one year 227 50,000one to two years 220,239 –Two to three years 150,251 220,000Three to four years 30,264 150,000Beyond four years 125,668 30,000Term loanBeyond four years 150,000 100,000Bank loanless than one year 13,500 –one to two years – 11,500Commercial papercurrent 129,117 124,141Total borrowings 1,296,066 1,228,899Return to contents page2012 financial report PAGE 101
<strong>Watercare</strong> Services Limited2012 ANNUAL REPORTNOTES TO THE FINANCIAL STATEMENTS (continued)FOR THE YEAR ENDED 30 JUNE 201221. BORROWINGS (continued)2012 2011Group and Company Group and CompanyInterest rates at balance date: % %Related party term loanaverage 6.24 5.13Average including interest rate swaps 6.80 5.78Medium-term notesaverage 5.99 6.23Average including interest rate swaps 5.59 5.98Term loanaverage 4.07 3.51Average including interest rate swaps 7.10 6.85Bank loanaverage 3.55 3.61Average including interest rate swaps 3.55 3.61Commercial paperaverage 2.80 2.76Average including interest rate swaps 5.02 6.08Total debtaverage 5.52 5.15Average including interest rate swaps 6.13 5.95Lenders under the bank loans and holders of medium-term notes and short-term commercial paper, receive the benefit of the negative pledge undertakingfrom the group. This undertaking limits the extent to which the group can give security to lenders and requires the group to ensure that the followingfinancial ratios are achieved at all times;– Total liabilities do not exceed 60 per cent of total tangible assets;– Total liabilities plus total contingent liabilities do not exceed 65 per cent of total tangible assets;– Shareholders’ funds are not less than $500 million;– Earnings before interest, tax, depreciation and amortisation is greater than 1.75 times interest expense;– Total tangible assets of the group are to be greater than 90 per cent of total tangible assets of the borrowing group.The group complied <strong>with</strong> these financial covenant ratios during the years ended 30 June 2012 and 30 June 2011.The group has an agreement <strong>with</strong> Auckland Council under which Auckland Council guarantees repayment of certain of the group’s borrowings andobligations under interest rate swap agreements.The group has the following undrawn committed facilities available:2012 2011Group and Company Group and Company$000 $000Bank overdraft facilities, expires on cancellation 5,100 4,542Term loan facility, expires October 2016 – 50,000Revolving advances, expires May 2013 (2011: expires May 2013) 61,500 63,500Commercial paper standby facility expires July 2012 (2011: expires July 2012) 200,000 200,000Total undrawn committed facilities 266,600 318,042Commercial paper held by the group is represented by multiple issues that spread interest rate and maturity risk. As each issue matures the group replacesit <strong>with</strong> a new issue, if required. The provider of the commercial paper standby facility acts as a lender of last resort, should the group be unable to issue newcommercial paper when it matures. The group’s treasury risk management policy requires standby facilities to be maintained to meet 50% of outstandingcommercial paper and other uncommitted short-term debt repayable <strong>with</strong>in 60 days. The group complied <strong>with</strong> its treasury risk management policy duringthe years ended 30 June 2012 and 30 June 2011.<strong>Watercare</strong>’s treasury policy requires that facilities due to expire are replaced six months prior to the maturity date of the existing facilities. In accordance<strong>with</strong> the treasury policy, <strong>Watercare</strong> established, effective 1 July 2012 a replacement commercial paper standby facility of $200 million <strong>with</strong> $100 millionmaturing in July 2015 and the other $100 million maturing in July 2017.PAGE 102 2012 financial reportReturn to contents page
<strong>Watercare</strong> Services Limited2012 ANNUAL REPORTNOTES TO THE FINANCIAL STATEMENTS (continued)FOR THE YEAR ENDED 30 JUNE 201222. FINANCIAL ASSETS AND LIABILITIESCategories of financial assets and liabilitiesThe carrying amounts presented in the statement of financial position relate to the following categories of assets and liabilities:2012 2011Group and CompanyGroup and CompanyCarrying amount Fair value Carrying amount Fair value$000 $000 $000 $000FINANCIAL ASSETS – CURRENTLoans and receivablesCash and cash equivalents 862 862 32 32Trade and other receivables 71,590 71,590 79,508 79,508Fair value through profit or lossDerivative financial instruments 26 26 553 553FINANCIAL ASSETS – NON CURRENTFair value through profit or lossDerivative financial instruments 23,609 23,609 12,285 12,28596,087 96,087 92,378 92,378FINANCIAL LIABILITIES – CURRENTAmortised costTrade and other payables 24,484 24,484 16,157 16,157Accrued expenses* 55,918 55,918 63,031 63,031Bank overdraft (unsecured) – – 558 558Medium-term notes (unsecured) 227 227 50,000 51,244Related party term loan (unsecured) 89,312 90,223 67,154 67,770Commercial paper (unsecured) 129,117 129,555 124,141 124,450Bank loan (unsecured) 13,500 13,507 – –Fair value through profit or lossDerivative financial instruments 362 362 3,174 3,174FINANCIAL LIABILITIES – NON CURRENTAmortised costMedium-term notes (unsecured) 526,422 559,654 400,000 423,156Term loan (unsecured) 150,000 150,777 100,000 100,369Bank loan (unsecured) – – 11,500 11,500Related party term loan (unsecured) 387,488 391,579 476,104 481,084Fair value through profit or lossDerivative financial instruments 133,336 133,336 59,110 59,1101,510,166 1,549,622 1,370,929 1,401,603* Excludes current and non-current income received in advance of $14.8 million (2011: $14 million) as it was not categorised as a financial liability, referNote 19 page 100.The calculation of fair values for each category of financial assets and financial liabilities is explained below. The methods and valuation techniques usedfor the purpose of measuring fair value are unchanged compared to the previous reporting period. No reclassification of financial assets was made duringthe years ended 30 June 2012 or 30 June 2011.Return to contents page2012 financial report PAGE 103
<strong>Watercare</strong> Services Limited2012 ANNUAL REPORTNOTES TO THE FINANCIAL STATEMENTS (continued)FOR THE YEAR ENDED 30 JUNE 201222. FINANCIAL ASSETS AND LIABILITIES (continued)Loans and receivablesDue to their relatively short-term nature, the carrying amount of trade receivables was considered a reasonable approximation of fair value.Amortised costDue to their relatively short-term nature, the carrying amount of trade payables was considered a reasonable approximation of fair value.The fair value of loans and borrowings was calculated based on the present value of contractual principal and interest cash flows, discounted at the marketrate of interest in the reporting period.Fair value through profit and lossInterest rate swaps were measured at the present value of future cash flows estimated and discounted based on the applicable yield curves derived fromquoted interest rates. Forward foreign exchange contracts were measured using observable market forward exchange rates.Fair value hierarchyThe fair value hierarchy groups financial assets and liabilities into three levels as explained below based on the significance of inputs used in measuringthe fair value of the financial assets and liabilities.Level 1: Quoted prices (unadjusted) in active markets for identical assets or liabilities;Level 2: Inputs other than quoted prices included <strong>with</strong>in level 1 that are observable for the asset or liability, either directly (i.e. as prices) or indirectly(i.e. derived from prices); andLevel 3: Inputs for the asset or liability that are not based on observable market data (unobservable inputs).The level in which the financial asset or liability was classified was determined based on the lowest level of significant input to the fair value measurement.The only financial assets and financial liabilities that were measured at fair value in the statement of financial position were derivative financialinstruments. The valuation for derivative financial instruments was based on level 2 fair value hierarchy. The derivative financial instruments that the groupheld at balance date comprised interest rate swaps and forward foreign exchange contracts.Fair values at balance date were assessed using a range of market interest rates between 2.69% and 4.04% (2011: 2.68% and 5.35 %), derived from theinterest rate swap curve.There were no transfers between levels 1, 2 and 3 during the year ended 30 June 2012.Financial instrument risksRisk management objectives and policiesThe group’s management monitors and manages the financial risks relating to the operations of the group through internal risk reports which analyseexposures by degree and magnitude of risks. The main types of risks are market risk, credit risk and liquidity risk.The group seeks to manage the effects of these risks by using derivative financial instruments to minimise these risk exposures. The use of financialderivatives was governed by the group’s policies approved by the Board of Directors, which provide written principles on interest rate risk, credit risk,the use of derivative and non-derivative financial instruments, and the investment of excess liquidity. Compliance <strong>with</strong> policies and exposure limits wasreviewed by the Board of Directors on a regular basis.Market riskThe group was exposed to market risk through its use of financial instruments and specifically to interest rate, foreign currency and certain other price risks.The group managed its market risk by regularly assessing the impact of changes in the market interest rates and foreign currency rates on thegroup’s portfolio.Interest rate riskInterest rate risk is the risk that the fair value or future cash flows of a financial instrument will fluctuate because of changes in market interest rates.The group is exposed to interest rate risk when it borrows funds at floating interest rates. The risk was managed by the group through monitoring marketinterest rates and reviewing the impact of these on interest rate exposure.The group’s borrowings comprise of both fixed rates and floating rates of interest. It is group policy to ensure that a proportion of interest rate exposure ismaintained on a fixed-rate basis. To achieve this, the group enters into contracts that allow some of its floating interest rate exposure to be swapped fromfloating to fixed, and vice versa. The contracts are called interest rate swaps and interest rate options.The group’s exposure to market interest rates relates primarily to the group’s debt obligations which are disclosed in Note 21, page 102.The group regularly analyses its interest rate exposure. Within this analysis, consideration is given to potential renewals of existing positions, alternativefinancing, alternative protective positions and the mix of fixed and variable interest rates.PAGE 104 2012 financial reportReturn to contents page
<strong>Watercare</strong> Services Limited2012 ANNUAL REPORTNOTES TO THE FINANCIAL STATEMENTS (continued)FOR THE YEAR ENDED 30 JUNE 201222. FINANCIAL ASSETS AND LIABILITIES (continued)The notional principal, contract amounts of agreements and fixed interest rates in place, at balance date, to manage interest rate risk were as follows:2012 2011Group and CompanyGroup and CompanyFixed interest rate Notional amount Fixed interest rate Notional amountInterest rate swaps % $000 % $000Receivable maturities (fixed to floating):Within one year – – 6.86% 50,000one to two years 5.26% 170,000 – –two to three years 5.74% 150,000 5.26% 170,000three to four years 5.10% 30,000 5.74% 150,000Four to five years – – 5.10% 30,000Beyond five years 5.69% 125,000 – –Payable maturities (floating to fixed):Within one year 6.84% 45,000 5.48% 125,000one to two years 2.85% 20,000 – –two to three years 6.25% 15,000 – –three to four years 4.51% 100,000 6.25% 15,000Four to five years 4.95% 80,000 5.17% 110,000Beyond five years 5.92% 870,000 6.30% 720,000As interest rates change, these derivative financial instruments are revalued to fair value and the change in fair value is recorded in surplus or deficit.Interest rate sensitivityThe following sensitivity analysis is based on the interest rate risk exposures in existence at balance date.At balance date, if interest rates had moved, as illustrated in the table below, <strong>with</strong> all other variables held constant, post-tax deficit and equity would havebeen affected as follows:Post-tax deficit(Higher)/lower2012 2011Group and CompanyEquityHigher/(lower)Post-tax deficit(Higher)/lowerGroup and CompanyEquityHigher/(lower)Judgments of reasonably possible movements: $000 $000 $000 $000Interest paid1% (100 basis points) higher for the year (2,725) (2,725) (1,656) (1,656)1% (100 basis points) lower for the year 2,725 2,725 1,656 1,656Revaluation of derivative financial instruments1% (100 basis points) higher at year-end 37,744 37,744 21,548 21,5481% (100 basis points) lower at year-end (43,012) (43,012) (23,596) (23,596)Foreign currency riskForeign currency risk is the risk that the fair value of future cash flows of a financial instrument will fluctuate because of changes in foreign exchange rates.Most of the group’s transactions are carried out in New Zealand dollars.From time to time the group is exposed to foreign currency risk on transactions denominated in foreign currencies. This was predominantly for thepurchase of equipment, parts and chemicals in foreign currency. Where amounts exceed $100,000 the group manages this risk <strong>with</strong> forward foreignexchange contracts or options.Return to contents page2012 financial report PAGE 105
<strong>Watercare</strong> Services Limited2012 ANNUAL REPORTNOTES TO THE FINANCIAL STATEMENTS (continued)FOR THE YEAR ENDED 30 JUNE 201222. FINANCIAL ASSETS AND LIABILITIES (continued)The group has forward foreign exchange contracts at balance date as follows:2012Group and CompanyAverage exchange Foreign exchange Contract valueCarrying amountand fair valueRATE FC 000 NZ$000 NZ$000USD3 months and beyond 0.767 1,473 1,920 (42)AUDLess than 3 months – – – –3 months and beyond 0.776 397 512 (6)Total forward foreign exchange contracts 2,432 (48)2011Group and CompanyAverage exchange Foreign exchange Contract valueCarrying amountand fair valueRATE FC 000 NZ$000 NZ$000USDLess than 3 months 0.737 274 372 (41)3 months and beyond 0.721 3,575 4,961 (542)EUR3 months and beyond 0.515 150 292 (19)GBPLess than 3 months 0.452 88 194 (23)AUDLess than 3 months 0.734 3,113 4,241 (216)3 months and beyond 0.758 420 554 (23)Total forward foreign exchange contracts 10,614 (864)PAGE 106 2012 financial reportReturn to contents page
<strong>Watercare</strong> Services Limited2012 ANNUAL REPORTNOTES TO THE FINANCIAL STATEMENTS (continued)FOR THE YEAR ENDED 30 JUNE 201222. FINANCIAL ASSETS AND LIABILITIES (continued)Foreign currency sensitivityThe following sensitivity analysis is based on the foreign currency risk exposures in existence at year-end. At balance date, had the New Zealand dollarexchange rate changed, as illustrated in the table below, <strong>with</strong> all other variables held constant, post-tax deficit and equity would have been affectedas follows:Post-tax deficit(Higher)/lower2012 2011Group and CompanyEquityHigher/(lower)Post-tax deficit(Higher)/lowerGroup and CompanyEquityHigher/(lower)Sensitivity to reasonable movements $000 $000 $000 $000Change in United States dollar exchange rate10% increase (123) (123) (309) (309)10% decrease 150 150 380 380Change in Euro Monetary Union euro exchange rate10% increase – – (18) (18)10% decrease – – 22 22Change in United Kingdom pound exchange rate10% increase – – (11) (11)10% decrease – – 13 13Change in Australian dollar exchange rate10% increase (33) (33) (289) (289)10% decrease 40 40 353 353Credit riskCredit risk is the risk that a counterparty will default on its contractual obligations resulting in financial loss to the group. Financial instruments whichpotentially subject the group to credit risk principally consist of cash and cash equivalents, derivative assets held for risk management, and trade andother receivables.The group’s cash and cash equivalents are placed <strong>with</strong> major trading banks <strong>with</strong> a minimum AA- credit rating assigned by international credit-ratingagencies. Debtors and other receivables arise from the group’s statutory functions. Therefore, there are no procedures in place to monitor the credit qualityof debtors and other receivables <strong>with</strong> reference to credit evaluations or external credit rating. However, there was no concentration of credit risk <strong>with</strong>respect to receivables as the company has a large number of customers. The ageing of the trade receivables at balance date was as follows:Carryingamount2012 2011Group and CompanyProvision fordoubtful debtsNet carryingamountCarryingamountGroup and CompanyProvision fordoubtful debtsCarryingamount$000 $000 $000 $000 $000 $000Not past due 22,395 (75) 22,320 18,415 – 18,415Past due one to thirty days 2,466 (198) 2,268 7,229 (302) 6,927Past due thirty to sixty days 1,624 (156) 1,468 3,337 (124) 3,213Past due more than sixty days 8,658 (2,776) 5,882 12,128 (2,702) 9,426Total 35,143 (3,205) 31,938 41,109 (3,128) 37,9812012 2011Group and Company Group and CompanyMovement in the provision for doubtful debts $000 $000Balance at 1 July 2011 3,128 –Acquisition through integration on 1 November 2010 – 1,845additions during the year 689 1,313Bad debts written off (612) (30)Balance at 30 June 2012 3,205 3,128Return to contents page2012 financial report PAGE 107
<strong>Watercare</strong> Services Limited2012 ANNUAL REPORTNOTES TO THE FINANCIAL STATEMENTS (continued)FOR THE YEAR ENDED 30 JUNE 201222. FINANCIAL ASSETS AND LIABILITIES (continued)Liquidity riskLiquidity risk is the risk arising from the group not being able to meet its financial obligations.Ultimate responsibility for liquidity risk management rests <strong>with</strong> the board of directors, which has an appropriate liquidity risk management frameworkfor the management of the group’s short, medium and long-term funding and liquidity management requirements. The group manages liquidity risk bymaintaining adequate reserves and banking facilities, monitoring forecast and actual cash flows and by matching this <strong>with</strong> the maturity profiles offinancial liabilities.The group’s objective is to maintain a balance between continuity of funding and flexibility through the use of medium-term notes, term loans, overdraft,revolving credit facility and commercial paper. The liquidity risk associated <strong>with</strong> the short-term commercial paper debt is mitigated by a standby facility of$200 million.The following tables detail the gross undiscounted cash flows of the financial liabilities on the basis of their earliest possible contractual maturity (includinginterest payments where applicable). Cash flows for financial liabilities <strong>with</strong>out fixed amount or timing restrictions are based on the conditions existing atbalance date.Gross contractual maturity analysisCURRENTNON-CURRENTGroup and Company0-6 months 7-12 months 1-2 years 2-3 years Over 3 yearsGross nominalcash outflow2012 $000 $000 $000 $000 $000 $000 $000CarryingamountFinancial liabilitiesTrade and other payables 24,484 – – – – 24,484 24,484Accrued expenses* 55,918 – – – – 55,918 55,918Forward exchange contracts 6 68 – – – 74 74Interest rate swaps 9,805 10,941 20,067 14,554 110,036 165,403 133,624Borrowings 221,813 72,759 356,466 321,740 533,890 1,506,668 1,296,066Total 312,026 83,768 376,533 336,294 643,926 1,752,547 1,510,166CURRENTNON-CURRENTGroup and Company0-6 months 7-12 months 1-2 years 2-3 years Over 3 yearsGross nominalcash outflow2011 $000 $000 $000 $000 $000 $000 $000CarryingamountFinancial liabilitiesBank overdraft 558 – – – – 558 558Trade and other payables 16,157 – – – – 16,157 16,157Accrued expenses* 63,031 – – – – 63,031 63,031Forward exchange contracts 494 212 158 – – 864 864Interest rate swaps 10,009 7,948 10,550 9,379 29,347 67,233 61,420Borrowings 246,618 53,542 157,902 351,628 649,018 1,458,708 1,228,899Total 336,867 61,702 168,610 361,007 678,365 1,606,551 1,370,929* Excludes current and non-current income received in advance of $14.8 million (2011: $14 million) as it was not categorised as a financial liability, referNote 19, page 100.The group monitors rolling forecasts of liquidity reserves on the basis of expected cash flow. At balance date the group had $267 million of unused creditfacilities (commercial paper, overdraft facility and revolving credit facility) available for its immediate use (2011: $318 million).PAGE 108 2012 financial reportReturn to contents page
<strong>Watercare</strong> Services Limited2012 ANNUAL REPORTNOTES TO THE FINANCIAL STATEMENTS (continued)FOR THE YEAR ENDED 30 JUNE 201222. FINANCIAL ASSETS AND LIABILITIES (continued)Capital managementThe capital structure of the group consists of equity attributable to the owners of the parent, comprising issued capital, reserves and retained earnings asdisclosed on page 77 and debt including borrowings and covenants compliance as disclosed in Note 21 on page 102.The group’s policy is to maintain a strong capital base so as to maintain investor, creditor and market confidence and to sustain future development ofthe business. The objective of the group is to maintain an optimal capital structure to reduce the cost of capital. In ensuring that the group has sufficientsolvency to satisfy all its operational needs, it closely monitors the ratio between the funds that it receives from operation and its finance costs.The group continues to focus on the maintenance of the long-term integrity of its assets whilst keeping the overall costs to its customers at minimum levelsand there has been no change in the group’s overall strategy for capital management during the years ended 30 June 2012 and 30 June 2011.23. RELATED PARTIES2012 2011Shareholder % Shares % SharesAuckland Council 100% 260,693,164 100% 260,693,164Other related partiesDuring the prior year, Metrowater Limited and Manukau Water Limited (subsidiaries of Auckland City Council and Manukau City Council respectively) wererelated parties until integration <strong>with</strong> the company on 1 November 2010. Metrowater Community Trust (formerly a Metrowater Limited subsidiary) andAuckland City Water Limited (dormant company) were related parties until 1 November 2010 after which they became subsidiaries of the company.Details of the integration of retail business are disclosed in Note 11, page 91. The group’s subsidiaries are set out in Note 11, page 90.Transactions <strong>with</strong> related parties<strong>Watercare</strong> entered into borrowing arrangements <strong>with</strong> Auckland Council on the terms set out in Note 21, page 102. <strong>Watercare</strong> also entered into interestrate swap arrangements <strong>with</strong> Auckland Council (<strong>with</strong> a notional value of $130 million, 2011: $155 million) <strong>with</strong> a fair value of $3.7 million(2011: $5.1 million) as at balance date. The balances outstanding and transactions relating to the borrowings from Auckland Council during the yearwere as follows:2012 2011Group and Company Group and Company$000 $000Loans from Auckland Council 476,800 543,258Interest payable on loans from Auckland Council 5,434 6,036Interest paid on loans from Auckland Council 22,702 15,688Loans repaid to Auckland Council 66,458 168,800Interest receivable on interest rate swaps <strong>with</strong> Auckland Council 316 305Interest paid on swaps (net) <strong>with</strong> Auckland Council 3,367 –During the year the group provided funding to its subsidiaries listed in Note 11, page 90. Also in the normal course of business, <strong>Watercare</strong> received moniesand incurred expenses on behalf of Te Motu A Hiaroa (Puketutu Island) Governance Trust and at balance date $236,427 was payable to the Trustby the group.The group provides retail water and wastewater services to its parent, Auckland Council and its controlled, jointly controlled and significantly influencedentities as well as to key management personnel of the company and its parent. These sales take place in the normal course of business. The groupalso entered into sales and purchases transactions <strong>with</strong> related parties in the normal course of business such as the payment of rates. These were notcollectively significant. During the prior year, until integration on 1 November 2010 the group supplied bulk water and wastewater services predominantlyto related parties in the Auckland region.2012 2011Group and Company Group and Company$000 $000Sales to related parties 94,783 136,058Trade receivables – related parties 1,445 2,985Purchases from related parties 4,247 2,915Trade payables – related parties 327 1,201receivable accruals 1,531 –payables accruals 7,240 7,894Return to contents page2012 financial report PAGE 109
<strong>Watercare</strong> Services Limited2012 ANNUAL REPORTNOTES TO THE FINANCIAL STATEMENTS (continued)FOR THE YEAR ENDED 30 JUNE 201224. COMMITMENTS2012 2011Group and Company Group and Company$000 $000Capital expenditureThe capital expenditure committed to, but not recognised in these financial statements, at balance date was:Buildings 174 488pipelines 251,376 63,463Tanks, tunnels, roads and reservoirs 1,000 4,295intangibles 556 –other 20,290 35,018Total capital expenditure commitments 273,396 103,264Anticipated payment schedule:Less than one year 90,608 79,636one to two years 11,547 22,713Two to five years 171,241 915Total capital expenditure commitments 273,396 103,264The commitments relate to the following projects:Wastewater treatment plant 8,197 4,109Water treatment plants 3,838 10,253Bulk supply meters 6,793 6,797Expansion of the Waikato water treatment plant 7,136 11,156south Western interceptor 418 13,019Stage 1 Northern Waitakere wastewater 5,182 6,985Hunua No 4 Trunk Water Main 192,663 1,743other projects 49,169 49,202Total capital expenditure commitments 273,396 103,264Operating leasesAnticipated payments under non-cancellable operating leases:Less than one year 3,229 3,159one to two years 2,942 3,003Two to five years 4,584 6,361Beyond five years 49,312 49,288Total lease commitments 60,067 61,811The major lease commitments relate to long-term leases of the land forming the water catchments areas, which expires in July 2092. The annual rental of$510,000 (2011: $510,000) was included in these commitments at face value. Other leases include Newmarket office, East Tamaki office, parks, reservoirsand office equipment.PAGE 110 2012 financial reportReturn to contents page
<strong>Watercare</strong> Services Limited2012 ANNUAL REPORTNOTES TO THE FINANCIAL STATEMENTS (continued)FOR THE YEAR ENDED 30 JUNE 201225. CONTINGENCIESIn November 2011, the Department of Labour commenced proceedings against <strong>Watercare</strong> Services Limited for three charges laid in relation to theOnehunga gas explosion incident. In the event that <strong>Watercare</strong> Services Limited is proven to be liable, the maximum liability for each charge is estimated tobe approximately $250,000.In the normal course of its business the group was exposed to claims, legal proceedings and arbitrations that may in some cases result in costs to the group.The directors believe that these were adequately provided for by the group <strong>with</strong>in Note 20, page 100 of these financial statements and no additional<strong>material</strong> contingent liabilities requiring disclosure have been identified.26. RETIREMENT BENEFIT PLANSThe employees of the group can elect to join the KiwiSaver scheme. KiwiSaver is a work-based savings scheme run through a selection of private providers.The obligation of the group is to contribute a specified percentage of payroll costs to the KiwiSaver scheme in line <strong>with</strong> employee contributions and theonly obligation of the group to the KiwiSaver scheme was to make the specified contributions.The total defined contribution expense recognised in the surplus or deficit for 2012 was $798,338 (2011: $566,483).27. REMUNERATIONThe directors and key management personnel are included in this compensation.2012 2011Group and Company Group and CompanyCompensation of directors and key management personnel $000 $000Employees’ salaries and wages and directors’ fees 3,489 4,046Post-employment benefits 60 67Other long-term employee benefits – 8Termination benefits – 45Total compensation for directors and key executives 3,549 4,1662012 2011Group and Company Group and CompanyDirectors’ remuneration Appointed $000 $000Graeme Hawkins (retired December 2010) december 2002 – 96David Clarke (Deputy Chairman) July 2008 66 72peter Drummond march 2010 50 65Susan Huria July 2008 53 66Ross Keenan (Chairman) march 2010 96 100Patrick Snedden (resigned December 2011) december 2002 26 66Jeff Todd may 2007 60 77tony Lanigan may 2011 53 9catherine Harland may 2011 53 9mike Allen december 2011 27 0total 484 560Directors’ fees paid during the 2011 financial year included additional fees of $165,451 paid to directors as a result of the increased workload andcommitment leading up to the integration. Of this amount, $94,312 was a back payment relating to the year ended 30 June 2010.28. EVENTS OCCURRING AFTER BALANCE DATENo significant events have occurred since balance date requiring disclosure in these financial statements.Return to contents page2012 financial report PAGE 111
<strong>Watercare</strong> Services Limited2012 ANNUAL REPORTSTATUTORY INFORMATIONFOR THE YEAR ENDED 30 JUNE 2012EMPLOYEES REMUNERATION RANGEThe table below shows the number of employees and former employees of the group, who in their capacity as employees, received remuneration and otherbenefits during the year of at least $100,000.2012Group and CompanyNumber of employeesEmployee remuneration rangeRemunerationRemuneration includingredundancy & restructuring *Total$100,000 – $110,000 43 43$110,001 – $120,000 22 22$120,001 – $130,000 22 1 23$130,001 – $140,000 18 18$140,001 – $150,000 5 5$150,001 – $160,000 3 3$160,001 – $170,000 2 2$170,001 – $180,000 2 2$180,001 – $190,000 2 2$190,001 – $200,000 1 1$200,001 – $210,000 5 5$210,001 – $220,000 4 4$220,001 – $230,000 1 1$230,001 – $240,000 ** 1 1$240,001 – $250,000 2 2$270,001 – $280,000 1 1$300,001 – $310,000 1 1$330,001 – $340,000 2 2$370,001 – $380,000 ** 1 1$710,001 – $720,000 1 1* Includes $60,296 in redundancy and outstanding annual leave entitlements.** Includes outstanding leave entitlements paid out on termination.PAGE 112 2012 financial reportReturn to contents page
<strong>Watercare</strong> Services Limited2012 ANNUAL REPORT2012 STATEMENT OF service PERFORMANCE(non-financial performance measures)Environmental Care(a)To promote conservation of the region’s water resources.(i) To maintain regional unaccounted for water losses at less than 17.7 million m 3 .a proportion of the water supplied by <strong>Watercare</strong> is not invoiced (non-revenue water) because it is used as part of the production process (such asflushing), for fire fighting, is meter inaccuracy or unauthorised usage. Some of these volumes are calculated based on the best information availableand other industry accepted parameters. The balance of non-revenue water is unaccounted for water losses and was estimated at 15.2 million m 3against a target of 17.7 million m 3 for 2011/12.(b)To ensure the impact of the company’s activities on the environment is controlled.(i) Compliance <strong>with</strong> treatment plant discharge consents (excludes minor or technical non-compliance).compliance <strong>with</strong> consents at the major urban wastewater treatment plants was 99% against a target of 100%. The non-compliance reported this yearwas due to illegal trade waste discharge and an off-site power failure, circumstances beyond <strong>Watercare</strong>’s control. There were several transient periodsof technical or minor non-compliance 1 at the Mangere Wastewater Treatment Plant during the year. An upgrade programme has been implemented toaddress these.the remaining non-compliance levels were influenced by the poor performance of some of the rural wastewater treatment plants transferred to<strong>Watercare</strong> by councils upon integration. These plants performed at 64% against a target of 65%, by 2015, and a target of 100% compliance by 2020.<strong>Watercare</strong> has developed a longer-term strategy and more immediate measures, forecast to cost $50 million, to reduce the impacts of these plants onthe environment.(ii) No successful Resource Management Act prosecutions against <strong>Watercare</strong>.there were no Resource Management Act prosecutions.Health, Safety and Wellbeing(a)To promote staff productivity and wellbeing.(i) To attain a lost-time injury frequency rate (LTIFR) of less than or equal to 5 hours per million hours worked.watercare staff achieved a LTIFR rate of 1.39 which was <strong>with</strong>in the target range.(ii) To target an unplanned absenteeism rate of less than 2.5%.watercare achieved an unplanned absenteeism rate of 1.81% which achieved the target.(iii) To target annual staff turnover in the target range 10-12%.Voluntary staff turnover at 11.81% was <strong>with</strong>in the target of 10 to 12% which is generally recognised as a healthy staffing refreshment rate.(b)To provide comprehensive development programmes.(i) To target a ratio of less than 1.6:1 of external to internal appointments.the ratio of new hires (excluding entry positions) to promotions is monitored and a more challenging target was set for this year of 1.6:1 comparedto 2.25:1 last year. During the period <strong>Watercare</strong> achieved a ratio of 1 promotion to every 1.71 new hires, due to the nature of the candidate pool.(c)To provide employees <strong>with</strong> safe working conditions.(i) To maintain the tertiary level ACC workplace management practices accreditation.A CCc tertiary level accreditation was maintained following an audit in December 2011.Stakeholder Relationships(a) To maintain sound governance and contribute to the development of a productive working relationship <strong>with</strong> the Shareholder.(i) To hold briefings <strong>with</strong> the Shareholder at least quarterly and to undertake Council briefings as requested.watercare briefed the Auckland Council formerly through quarterly reports and quarterly briefings through the year. The <strong>Watercare</strong> Board of Directorshosted the Auckland Council Councillors for a combined strategy session in May in preparation for the development of a new Water Strategy.1For instance, a technical non-compliance might be late completion of documentation, minor non-compliance might be a single reading above a target the impactof which is total load based where there is no <strong>material</strong> impact on the environment. In each case, the regulator, Auckland Council, our related party, is fully informed.Return to contents page2012 financial report PAGE 113
<strong>Watercare</strong> Services Limited2012 ANNUAL REPORT2012 STATEMENT OF service PERFORMANCE (continued)(non-financial performance measures)Customer Service Commitment(a)To supply high quality and reliable drinking water.(i) To maintain 100% compliance <strong>with</strong> the Ministry of Health’s drinking water standards at graded plants.<strong>Watercare</strong> fully met the target in respect of the achievement of the Ministry of Health’s Drinking Water Standards for New Zealand (DWSNZ) atMinistry of Health-graded water treatment plants which supply the bulk of the drinking water to the Auckland Region. The DWSNZ standards are basedon a quality assurance approach, underpinned by the requirement to develop public health risk-management plans.this is verified through a sampling programme at the water treatment plants and in the reticulation network, where approximately 80 sites are sampledper day. Compliance <strong>with</strong> the DWSNZ is reported in the Water Information for New Zealand (WINZ) database, and is assessed by the Drinking WaterAssessor on an annual basis. The next assessment of grading for qualifying water treatment plants will take place in the final quarter of the 2012calendar year.(ii) To maintain the public health grading of water treatment plants and networks of ‘Aa’.Water quality has been maintained based on the 2010 grading assessment carried out by the Auckland District Health Board on behalf of theMinistry of Health 2 . All the metropolitan water treatment plants that supply the bulk of drinking water to the people in the Auckland Region meet the‘A’ grade standard.of the smaller non-metropolitan plants transferred to <strong>Watercare</strong> on 1 November 2010, nine remain ungraded. <strong>Watercare</strong> is continuing <strong>with</strong> aprogramme of work to ensure all plants meet the ‘A’ grade standard by 2020, at a capital cost of $100 million for both water treatment plants and thedistribution network.the same risk-based assessment used for water treatment plants also applies to the pipes and pump stations that make up the water distributionnetworks. The metropolitan network is graded ‘a’ under the Ministry of Health’s standards and supplies the bulk of the drinking water to the peoplein the Auckland Region. Of the 15 non-metropolitan networks (inherited on 1 November 2010), three are ‘a’ graded, three are ‘b’ graded and 9 areungraded. <strong>Watercare</strong> has set in place a programme to ensure that all the networks meet the ‘a’ grade standard by 2020.(b)To provide for the safe transportation, treatment and disposal of bulk wastewater.(i) To target no more than fifteen dry-weather sewer overflows per 100km of wastewater pipe length per annum.watercare reports on the number of wastewater overflows from its retail network during dry weather as a measure of the ability of the network tomanage current demand. The result for 2011/12 was 2.3 overflows per 100km of waste water pipe.Asset Management(a)To develop and implement effective and efficient capital investment and maintenance programmes.(i) To ensure that capital projects have robust business cases.all <strong>Watercare</strong> capital projects are supported by robust business cases and are managed to ensure delivery to plan in a timely and cost effective manner.Performance of the project portfolio is reported on a monthly basis to the Board and quarterly to the shareholder, Auckland Council.Economic Performance(a)To ensure that financial strategies are consistent <strong>with</strong> achieving economic efficiency, intergenerational equity and an optimal costof capital.(i) To meet the requirements of the Auckland City Council guarantee of <strong>Watercare</strong>’s debt.all requirements of the guarantee were met.(ii) To achieve a minimum funds flow from operations (FFO) to interest cover of 2.5 times before any price adjustments.the funds from operations (FFO) to interest cover ratio for the year ending 30 June 2012 was 3.23, higher than the budget figure of 2.94 and therequired target a minimum of 2.50. Cost savings achieved during the year lead to lower than budgeted operating expenses and more than offsetthe reduced revenues arising from lower than projected water volumes.(b)To ensure that the regime for the pricing of water and wastewater services is enduring, transparent and reliable.(i) Annual (2011/12) average increase in total price of water services per property consistent <strong>with</strong> the current capital programme.a legacy of disparate volumetric and fixed water tariffs from the former councils in the Auckland region was replaced <strong>with</strong> a uniform water tariff of$1.30 (including GST) per cubic metre <strong>with</strong> effect from 1 July 2011, representing a decrease of 15% in budgeted water revenue. The uniform tariff wasset to deliver water revenue consistent <strong>with</strong> the 2011/12 Funding Plan, which in turn was based on the current capital programme.(ii) Annual (2011/12) average increase in total price of wastewater services per property consistent <strong>with</strong> the current capital programme.all retail wastewater tariffs were increased uniformly by 4.5% <strong>with</strong> effect from 1 July 2011 in order to deliver wastewater revenue consistent <strong>with</strong> the2011/12 Funding Plan, which in turn was based on the current capital programme.(c)To ensure efficiency in capital expenditure is maintained.(i) To report capital expenditure relative to budget for water and wastewater.watercare’s target is that capital expenditure should be <strong>with</strong>in 20% of the approved financial budget. For 2011/12 the actual capital expenditure was96.5%, which was <strong>with</strong>in 3.5% of budget.2The next grading assessment is due in the last calendar quarter of 2012.PAGE 114 2012 financial reportReturn to contents page
<strong>Watercare</strong> Services Limited2012 ANNUAL REPORT2012 STATEMENT OF service PERFORMANCE (continued)(non-financial performance measures)Customer Services Performance(a)To maintain delivery of cost-effective services.(i) To maintain the average household bill at less than 1.5% of the average household income.the average monthly household water and wastewater bill from <strong>Watercare</strong> was $52.30 for the period 1 July 2011 to 30 Jun 2012. Based onStatistics NZ average monthly household income in Auckland of $7,219, the bill represents 0.72% of the average household income.(b)To maintain delivery of high quality water and wastewater services.(i) 80% of customers surveyed satisfied <strong>with</strong> overall water and wastewater services.of the customers who contacted <strong>Watercare</strong> to report faults and were surveyed by independent researchers, 82.2% were satisfied, this being anoverall score of at least 7 out of a possible 9.(ii) To achieve less than five water quality complaints per 1,000 connections.<strong>Watercare</strong> monitors the number and type of water quality complaints received from customers. The result of 4.1 complaints per 1000 connectionscovering taste, odour and appearance per 1,000 connections was lower than the target of five per year.(c)To maintain good customer relationships.(i) To ensure 95% of all complaints and enquiries are “closed” <strong>with</strong>in 10 working days.the target of ‘closed’ complaints and enquiries measures the time taken for an issue to be resolved and feedback given to the customer. A 10-daytarget is considered industry best practice. Performance was 99.7% for the 2011/12 period. Complaints performed at 96.4% and enquiries at 99.8%.Complaints (1,355) made up 5.1% of the total enquiries (26,762).(ii) To achieve an average call centre operator connect time of
<strong>Watercare</strong> Services Limited2012 ANNUAL REPORTG3 cross-reference tabLeKEY:Fully reportedPartially reportedNot reported<strong>Watercare</strong>’s Annual Report 2012 has been prepared in accordance <strong>with</strong> the G3 framework of the Global ReportingInitiative (GRI) Sustainability Reporting Guidelines. This framework exists to assist organisations to report theireconomic, environmental and social performance in a consistent and comparable manner. The following pages showhow <strong>Watercare</strong> reports its performance against the G3 indicators. Against each indicator, <strong>Watercare</strong> has fully reported,partially reported or not reported. The key (left) explains the symbols used. The GRI disclosures for strategy andanalysis, organisational profile, report parameters in governance and management approach (parts I and II)are excluded from the G3 cross-reference table but are covered in pages 1 to 62 of this report.The GRI aims, objectives and guidelines can be found on their website www.globalreporting.org.ECONOMIC INDICATORSASPECT: ECONOMIC PERFORMANCE REFERENCE RULEREC1Direct economic value generated and distributed, including revenues, operating costs, employee compensation,donations and other community investments, retained earnings, and payments to capital providers and governments.Page 63-116EC2 Financial implications and other risks and opportunities for the organisation’s activities due to climate change. Figure 61EC3 Coverage of the organisation’s defined benefit plan obligations. Figure 24 3EEC4 Significant financial assistance received from government. Self fundedASPECT: MARKET PRESENCE REFERENCE RULEREC5 Range of ratios of standard entry level wage compared to local minimum wage at significant locations of operation. Figure 24 3EEC6 Policy, practices, and proportion of spending on locally-based suppliers at significant locations of operation. Figure 55; 56EC7Procedures for local hiring and proportion of senior management hired from the local community at significant locationsof operation.Merit basedASPECT: indirect economic impacts REFERENCE RULEREC8Development and impact of infrastructure investments and services provided primarily for public benefit throughcommercial, in-kind, or pro bono engagement.Figure 54EC9 Understanding and describing significant indirect economic impacts, including the extent of impacts. Page 46 5AENVIRONMENTAL INDICATORSASPECT: MATERIALS REFERENCE RULEREN1 Materials used by weight or volume. Figure 52EN2 Percentage of <strong>material</strong>s used that are recycled input <strong>material</strong>s. Figure 52ASPECT: ENERGY REFERENCE RULEREN3 Direct energy consumption by primary energy source. Figure 42EN4 Indirect energy consumption by primary source. Being revisedEN5 Energy saved due to conservation and efficiency improvements. Being revisedEN6Initiatives to provide energy-efficient or renewable energy based products and services, and reductions in energyrequirements as a result of these initiatives.Figure 426BEN7 Initiatives to reduce indirect energy consumption and reductions achieved. 6BASPECT: WATER REFERENCE RULEREN8 Total water <strong>with</strong>drawal by source. Figure 1EN9 Water sources significantly affected by <strong>with</strong>drawal of water. Pages 24-28; 54-56EN10 Percentage and total volume of water recycled and reused. Figure 1ASPECT: BIODIVERSITY REFERENCE RULEREN11Location and size of land owned, leased, managed in, or adjacent to, protected areas and areas of high biodiversity valueoutside protected areas.Figure 466FEN12Description of significant impacts of activities, products, and services on biodiversity in protected areas and areas ofhigh biodiversity value outside protected areas.Figure 476EEN13 Habitats protected or restored. Figure 46 6FEN14 Strategies, current actions and future plans for managing impacts on biodiversity. Figure 46 6FEN15Number of IUCN Red List species and national conservation list species <strong>with</strong> habitats in areas affected by operations,by level of extinction risk.Under reviewPAGE 116 2012 financial reportReturn to contents page
<strong>Watercare</strong> Services Limited2012 ANNUAL REPORTG3 cross-reference tabLe (continued)ENVIRONMENTAL INDICATORS (CONTINUED)ASPECT: emissions, effluents and waste REFERENCE RULEREN16 Total direct and indirect greenhouse gas emissions by weight. Figure 37 6AEN17 Other relevant indirect greenhouse gas emissions by weight. Figure 37 6AEN18 Initiatives to reduce greenhouse gas emissions and reductions achieved. Figure 38 6AEN19 Emissions of ozone-depleting substances by weight. Figure 37EN20 NOx, SOx, and other significant air emissions by type and weight. Figure 38 6AEN21 Total water discharge by quality and destination. Figure 15 2CEN22 Total weight of waste by type and disposal method. Figure 42-45 6C; 6DEN23 Total number and volume of significant spills. Figure 17 2BEN24EN25Weight of transported, imported, exported, or treated waste deemed hazardous under the terms of the Basel ConventionAnnex I, II, III, and VIII, and percentage of transported waste shipped internationally.Identity, size, protected status, and biodiversity value of water bodies and related habitats significantly affected by thereporting organisation’s discharges of water and runoff.No internationaltransportPages 50-51;44-47Figure 15; 46; 47ASPECT: products and services REFERENCE RULEREN26 Initiatives to mitigate environmental impacts of products and services, and extent of impact mitigation. Pages 6-7EN27 Percentage of products sold and their packaging <strong>material</strong>s that are reclaimed by category. Not applicableASPECT: compliance REFERENCE RULEREN28Monetary value of significant fines and total number of non-monetary sanctions for non-compliance <strong>with</strong> environmentallaws and regulations.Table 145CASPECT: TRANSPORT REFERENCE RULEREN29Significant environmental impacts of transporting products and other goods and <strong>material</strong>s used for the organisation’soperations, and transporting members of the workforce.Not significantASPECT: OVERALL REFERENCE RULEREN30 Total environmental protection expenditures and investments by type. Pages 63-116Figure 7; 61LABOUR PRACTICES AND DECENT WORK INDICATORSASPECT: emPLOYMENT REFERENCE RULERLA1 Total workforce by employment type, employment contract, and region. Figure 28LA2 Total number and rate of employee turnover by age group, gender and region. Figure 23; 25 3D; 3FLA3 Benefits provided to full-time employees that are not provided to temporary or part-time employees, by major operations. Figure 28ASPECT: LABOUR/MANAGEMENT RELATIONS REFERENCE RULERLA4 Percentage of employees covered by collective bargaining agreements. Figure 28LA5Minimum notice period(s) regarding significant operational changes, including whether it is specified in collectiveagreements.Figure 28ASPECT: occupational HEALTH AND SAFETY REFERENCE RULERLA6Percentage of total workforce represented in formal joint management-worker health and safety committees that helpmonitor and advise on occupational health and safety programmes.Figure 21LA7 Rates of injury, occupational diseases, lost days, and absenteeism, and number of work-related fatalities by region. Figure 20; 22 3A; 3B; 3CLA8Education, training, counselling, prevention, and risk-control programmes in place to assist workforce members, theirfamilies, or community members regarding serious diseases.Figure 213ELA9 Health and safety topics covered in formal agreements <strong>with</strong> trade unions. Figure 21Return to contents page2012 financial report PAGE 117
<strong>Watercare</strong> Services Limited2012 ANNUAL REPORTG3 cross-reference tabLe (continued)PRODUCT RESPONSIBILITY PERFORMANCE INDICATORSASPECT: CUSTOMER HEALTH AND SAFETY REFERENCE RULERPR1Life cycle stages in which health and safety impacts of products and services are assessed for improvement,and percentage of significant products and services categories subject to such procedures.Fundamental toorganisationPR2Total number of incidents of non-compliance <strong>with</strong> regulations and voluntary codes concerning health and safety impactsof products and services during their life cycle, by type of outcomes.Figure 141A-1CASPECT: PRODUCT AND SERVICE LABELLING REFERENCE RULERPR3Type of product and service information required by procedures, and percentage of significant products and servicessubject to such information requirements.Figure 591A-1CPR4Total number of incidents of non-compliance <strong>with</strong> regulations and voluntary codes concerning product and serviceinformation and labelling, by type of outcomes.Figure 141A-1D; 6IPR5 Practices related to customer satisfaction, including results of surveys measuring customer satisfaction. Figure 26-31 4A-4CASPECT: MARKETING COMMUNICATIONS REFERENCE RULERPR6Programmes for adherence to laws, standards, and voluntary codes related to marketing communications, includingadvertising, promotion, and sponsorship.Page 475CPR7Total number of incidents of non-compliance <strong>with</strong> regulations and voluntary codes concerning marketing communications,including advertising, promotion, and sponsorship by type of outcomes.None reportedASPECT: CUSTOMER PRIVACY REFERENCE RULERPR8 Total number of substantiated complaints regarding breaches of customer privacy and losses of customer data. Figure 14ASPECT: COMPLIANCE REFERENCE RULERPR9Monetary value of significant fines for non-compliance <strong>with</strong> laws and regulations concerning the provision and useof products and services.Figure 14Report Application LevelsUnder the G3 framework, annual reports are graded at three different levels(C, B and A) according to the extent to which the framework has been applied.<strong>Watercare</strong>’s report has been self-declared and third-party checked.C C+ B B+ A A+MANDATORY Self-declared OPTIONALThird-party checkedGRI checkedReturn to contents page2012 financial report PAGE 119
<strong>Watercare</strong> Services Limited2012 ANNUAL REPORTIndexAdopt A Stream 7, 14, 46, 51Asset management 18-19, 46, 54-57Audit and Risk Committee 10, 19-20Central Interceptor 8, 21Customer satisfaction 40-43Drinking Water Standards for New Zealand 26Emissions 6, 49-50Employment equity and diversity 37Environmental Advisory Group (EAG) 20, 22Graduate Engineering Programme 7, 37Governance 17-20Hunua No. 4 Watermain 7-8, 13-14, 16, 23Health, safety and well-being 34-37Healthy waterways 30-33Helensville Water Treatment Plant 47Kawakawa Bay wastewater treatment scheme 53Local boards 3, 21Local Government Acts 17Mangere Wastewater Treatment Plant 38-39, 57Midges 7, 51Networks map 3Odour 7, 27, 51, 53, 57, 61Overflows 7, 8, 22, 25, 30, 32Procurement 6, 13, 60Pukekohe water supply improvements 21, 28Puketutu Island 6, 14, 38-39, 50-52Rain Forest Express 7, 46, 63Safe and reliable water 24-29SAP Enterprise Asset Management Solution 6, 56Sound Financial Management 58-61Species preservation 50-51Staff training, staff turnover 37Stakeholder relations 44-47Statement of Intent (SOI) 19Statement of Service Performance 113-115Southwestern Interceptor 11-12, 33Sustainability 6-7, 14, 48-53Tangata Whenua 18, 23, 46Trade waste 2, 22, 32, 51Trees for Survival 6, 51Waikato Water Treatment Plant 54-55<strong>Watercare</strong> Coastal Walkway 6, 38<strong>Watercare</strong> Harbour Clean-Up Trust 6, 14, 29, 46, 49, 51Water quality 26-28, 38-39, 46, 51, 53Water Utility Consumer Assistance Trust 14, 29Zero Waste programme and recycling 14, 49-50glossaryAdopt A StreamAsset Management Plan(AMP)BiogasBiosolidsERPG3Greenhouse gasesHansenIwiMana whenuaRegional DemandManagement PlanReliability-CentredMaintenance (RCM)SAPStatement of Intent (SOI)Statement of ServicePerformance (SSP)Tāmaki MakaurauTangata whenuaTrade WasteUnaccounted-forwater lossWastewaterZero Waste<strong>Watercare</strong>’s free, student-centred science programme.A document that defines <strong>Watercare</strong>’s best engineering judgement of the revenue and capital investment required to maintain theintegrity of its asset base over a 20-year period.A by-product of the wastewater treatment process that is comprised of approximately 65 per cent methane.A treated solid by-product of the wastewater treatment process.Enterprise resource planning (ERP) is a company-wide information system which consolidates information from various functions/departments. See SAP below.Version three of the Global Reporting initiative guidelines for sustainability reporting.Gases that trap heat in the atmosphere. Examples of greenhouse gases are methane, perfluorocarbons and nitrous oxide.A technology and information platform on which <strong>Watercare</strong> runs its customer business.Tribal group/s (origin: Maori).Territorial rights; tribal connection to a geographic region; associated <strong>with</strong> possession and occupation (origin: Maori).A plan that outlines how <strong>Watercare</strong> intends to achieve a 15% reduction in gross per capita water consumption by 2025.A framework which identifies the optimum time to maintain or replace assets based on operational performance, cost, health andsafety and the environment.Systems, Applications and Products (SAP) is a company which offers enterprise resource planning solutions to companies tointegrate information from various functions of that company under one system. See ERP above.The SOI represents <strong>Watercare</strong>’s public and legislative expression of accountability to its shareholder and establishes the agreementbetween the board and its shareholder.The SSP is a retrospective record of the performance of the company against the measures in its SOI.The Auckland isthmus region (origin: Maori).Indigenous people of the land (origin: Maori).Any discharge into a sewer in the course of an industry or trade process.Water that is lost before it reaches the customer. Losses can be real losses (through leaks) or apparent losses (for example, throughtheft or metering inaccuracies).Liquid or solid matter discharged into the sewer network from domestic, commercial or industrial locations.<strong>Watercare</strong>’s project to minimise or eliminate wastewater throughout the company.PAGE 120 2012 financial reportReturn to contents page
<strong>Watercare</strong> Services Limited2012 ANNUAL REPORTSUPPLEMENTARYMATERIAL2012ContentsPuketutu Island, Mangere.Fig Ppage1 Water and wastewater facts 22 Financial overview 33 Taxation 34 Population and water sales 36 Organisational structure 47 Sustainability accounting analysis 58 Grading of water treatment plantsand networks 69 Drinking water quality 710 Typical analysis of Auckland’sdrinking water 811 Water interruption frequency 812 Water supply restoration 913 Water quality complaints 914 Resource consent compliance 1015 Wastewater treatment plant discharge 1216 Wastewater treatment plant performance– Mangere 13– Beachlands 14– Waiheke 15– Kingseat 16– Clarks Beach 17– Waiuku 18– Pukekohe 19– Rosedale 20– Army Bay 21– Warkworth 22– Wellsford 23– Omaha 24– Dennehurst 25– Matakana 25– Waiwera 26– Huapai 27– Helensville 28– Snells/Algies 29Fig Ppage17 Overflows from wastewater system 2918 Wastewater network interruptions 3019 Wastewater network restorationperformance 3020 Lost-time injury frequency rate 3121 Health and safety notes 3222 Staff wellness and absenteeism 3323 Staff voluntary turnover 3324 Investment in staff 3425 Staff service profile 3426 Staff demographics 3527 Average staff numbers 3628 Workforce by employment type,contract, and region 3629 Customer satisfaction <strong>with</strong>the contact centre 3730 Grade of service 3731 Complaint types and response rates 3832 Household affordability 3933 Community impact of operations 3934 Public policy participation 4035 Rain Forest Express passengersand trips 4136 Adopt A Stream pupil numbers 4137 <strong>Watercare</strong>’s greenhouse gasemissions 4238 Typical analysis of Auckland’sdrinking water 4339 Sources of emissions 4340 <strong>Watercare</strong>’s ecological footprint 4441 Internal energy usage 4442 Recycling in general waste 4543 WWTP biosolids levels– Mangere 46– Rosedale 49– Army Bay 52– Warkworth 55Fig Ppage44 Solids disposal 5845 Weight of hazardous substancesin waste 5846 Protected areas of highecological value 5947 Significant biodiversity impacts 6048 Midge and odour complaints 6049 Trade waste customers 6150 Trade waste sampling programme 6151 Key trade waste substances 6252 Materials and chemicals 6353 Capital expenditure programmes 6454 Infrastructure investmentsprovided for public benefit 6555 Major suppliers and contractors 6656 Suppliers spend by industryand sector 6757 Interest rate performance 6758 Ethics and business integrity 6859 Product information disclosure 6860 Product life cycle , health andsafety impact assessment 6861 Financial implications ofclimate change 69Return to contents page2012 <strong>supplementary</strong> <strong>material</strong> PAGE 1
<strong>Watercare</strong> Services Limited2012 ANNUAL REPORTFigure 1Water and wastewater factsUnder the G3 reporting framework, <strong>Watercare</strong> is required to provide additional information onG3 environment indicators EN8, EN9, EN10 relating to water.WaterWater supply dams 12River sources 3Groundwater sources 14Supply dam catchment area (ha) 16,056Groundwater catchment area (ha) 2,395Length of raw water mains (km) 92‘A’ grade water treatment plants 11 1Other water treatment plants 10Length of treated water mains (km) 8,829Service reservoirs 84Pump stations 90Annual volume produced (Ex Plant m 3 ) 140,706,179Annual volume sold (m 3 ) 134,229,925 2WastewaterLength of sewers km 7,757Pump stations 539Trade waste customers 1,654Treatment Plants Metropolitan 4Treatment Plants Rural 15 3Volume treated annually m 3 163,988,716Biosolids produced (wet) annually (tonnes) 119,747Effluent re-used annually (m 3 ) 21,272,529 4Volume abstracted by source m 3 2011/12 total %Waitakere Dam 2,447,989 1.7Upper Huia Dam 6,049,346 4.2Upper Nihotupu Dam 6,269,675 4.4Lower Huia Dam 16,501,033 11.5Lower Nihotupu Dam 882,057 0.6Cosseys Dam 13,825,051 9.7Upper Mangatawhiri Dam 24,341,609 17.0Wairoa Dam 10,589,963 7.4Mangatangi Dam 41,803,834 29.2Waikato River 11,976,425 8.4Onehunga Aquifer 3,349,933 2.3Rural North 1,410,605 1.0Rural South 3,492,813 2.4TOTAL 142,940,334 100.0 5Dam storage 30 Jun 12 30 Jun 11Total storage volume (m 3 ) 80,927,569 95,551,956% full 84.78% 99.99%Notes:1. Papakura is currently not in service.2. Figure lower than last year. Includes retail and wholesale volume from metropolitan and rural plants.3. Kawakawa Bay included, transferred to <strong>Watercare</strong> 30/6/11.4. Re-use figures for Mangere only. Not measured for Rosedale or other plants.5. Meters are accurate to +/- 2%.PAGE 2 2012 financial reportReturn to contents page
<strong>Watercare</strong> Services Limited2012 ANNUAL REPORTFigure 2Financial overviewAnnual turnoverAsset value$000 $000Water 149,891 3,313,687Wastewater 292,059 4,585,199Total 441,950 7,898,886Figure 3Taxation2004/05 2005/06 2006/07 2007/08 2008/09 2009/10 2010/11 2011/12$000 $000 $000 $000 $000 $000 $000 $000Income tax paid 3,350 - - - - - -GST collected 19,448 20,857 21,119 20,913 23,207 24,727 53,751 65,958Accident compensation levies 316 200 230 287 369 380 474 548Local and Regional Council rates 1,441 1,732 2,809 2,107 2,106 2,417 6,494 1,20821,205 26,139 24,158 23,307 25,682 27,524 60,719 67,714Figure 4Population and water sales30 Jun Connected population Bulk supply volume (m 3 ) Litres per person per day2002 1,080,000 119,720,000 3042003 1,145,000 124,514,000 2982004 1,174,500 127,089,000 2962005 1,193,500 131,052,000 3012006 1,213,000 134,699,000 3042007 1,232,000 136,220,334 3032008 1,258,000 136,559,180 2972009 1,298,144 131,111,976 2772010 1,318,367 134,637,738 2802011 1,335,510 135,119,845 2772012 1,354,401 134,229,925 272Return to contents page2012 financial report PAGE 3
<strong>Watercare</strong> Services Limited2012 ANNUAL REPORTFigure 6Organisational structureChief ExecutiveMark FordActing CorporateStrategy &CommunicationsOwen CookGeneral CounselRob FisherCorporate AffairsManagerRisk and AssuranceManagerDavid Hawkins David Sellars Chief Operating Chief Infrastructure Chief FinancialOfficerOfficerOfficerDavid WorsnopGraham WoodBrian MonkPrincipal AdvisorLocal BoardsBrent EvansManager StatutoryPlanningGarry MaskillOperations ManagerWater TreatmentShayne CunisPlanning ManagerDavid BlowFinancial ControllerRichard O’ConnorOperations ManagerWastewater TreatmentMark BourneNew DevelopmentsManagerGeof StewartTreasury ManagerJason IsherwoodNumber of employeesand contract staffStaffing Levels June 2012Employees 665.5Operations ManagerNetworksAnin NamaPerformance &Compliance ManagerMyles LindEnergy & ControlSystems ManagerDominic HollewandProjects & ProgrammesManagerTim MunroCommercial ServicesManagerIan ShandFinancial Planning &Revenue ManagerMarlon BridgeContract Staff (as FTE) 2.85Total 668.35Budgeted FTE (11/12) 690.5MaintenancesServices ManagerChris KinleyStrategic PlanningManagerSimon WarrenChief ServicesOfficerTrish LangridgeChief InformationOfficerJim SwansonHuman ResourcesManagerPeter GaskinCustomer ServicesManagerPenelope WebsterProperty ManagerHoward CaraSustainabilityManagerRoseline KleinPAGE 4 2012 financial reportReturn to contents page
<strong>Watercare</strong> Services Limited2012 ANNUAL REPORTFigure 7Sustainability accounting analysis2005/06 2006/07 2007/08 2008/09 2009/10 2010/11 2011/12$million $million $million $million $million $million $millionTotal expenditure including that necessary to meet thestatutory and legal obligations142.1 157.7 164.0 168.9 187.4 359.2 431.9Additional expenditure to meet the standards expected of <strong>Watercare</strong>1. Wastewater treatment plant midge control 0.3 0.6 0.6 0.5 0.5 0.6 0.42. Odour control 0.7 0.1 0.1 0.1 0.1 0.2 0.53. Wastewater overflow clean-up 0.1 0.1 0.1 0.1 0.1 0.2 0.74. Wastewater pump station ‘failsafe’ maintenance 0.9 0.7 0.9 0.9 0.9 1.1 3.5Subtotal 2.0 1.5 1.7 1.6 1.6 2.1 5.1Costs forming the basis of water and wastewater charges – peraudited financial statements144.1 159.2 165.7 170.5 189.0 361.3 437.0Annualised cost of the additional activities that could improve the environmental standards5. CO 2emission reduction 0.7 0.7 0.7 0.3 0.4 0.5 0.16. Compensation flows below water supply dams 17.7 17.9 18.2 19.2 19.5 21.0 22.97. Odour emission elimination 3.2 3.3 3.4 3.9 4.0 5.6 6.08. Wastewater overflow minimisation 58.4 58.6 62.4 85.1 88.2 165.0 175.09. Visual enhancement 3.7 3.9 4.6 5.0 5.2 9.7 9.910. Biosolids re-use 15.4 15.4 16.3 16.8 16.9 19.0 21.511. Partial (30Ml/d) wastewater reuse for industry, forestry andagriculture12. Partial (100Ml/d) wastewater recharge to catchments usedfor water extraction5.3 5.4 5.6 6.0 6.2 7.7 7.863.4 63.5 65.9 77.2 78.5 78.0 83.813. Partial ( 170Ml/d) wastewater reuse to potable water 90.1 90.2 93.0 90.4 91.6 133.0 134.4Subtotal 257.9 258.9 270.1 303.9 310.5 439.5 461.4Cost base required to deliver sustainable performance 402.0 418.1 435.8 474.4 499.5 800.8 898.7Notes:1. Wastewater treatment plant midge controlThe treated effluent at Mangere and Rosedale ispotentially a fertile breeding ground for midges, aconsiderable social nuisance. In 2011/12 sprayingand decanting were used to control the midgehabitat, at a cost of $400,000.2. Odour controlIn the past year, the operating and maintenancecosts of facilities to minimise odours in thereticulation network and at the wastewatertreatment plants were approximately $500,000.3. Wastewater overflow clean-upThe wastewater reticulation network overflows inheavy storms or as the result of system failure orthird party damage. <strong>Watercare</strong> employees clean anddisinfect overflow sites which costs approximately$700,000 per year.4. Wastewater pump station ‘failsafe’ maintenance<strong>Watercare</strong> spends a considerable amount of itsmaintenance budget on planned maintenance,which is necessary to minimise the occurrenceof pump station failures and consequentialenvironmental damage. This safeguard costapproximately $3.5 million.5. CO 2emissions<strong>Watercare</strong>’s total greenhouse gas emissions were16771 tonnes for the year. If this is ‘charged’ at $8per tonne it equates to $134,168.6. Compensation flows from water supply damsThe water supply dams cut off most of the flowsfrom the streams below the dams. To promotethe stream ecosystems, <strong>Watercare</strong> could releaselarger compensation flows. This would reduce theyield of the water supply system and require theconstruction of a new water source at $180 millionand operation and maintenance costs of $11 millionper year. The total annual cost, including operationand maintenance costs and interest on capital butexcluding depreciation, would be $22.9 million.7. Odour emission eliminationReducing the system’s odours to minimal levelsat all site boundaries, primarily by constructingnew biofilters, would involve $80 million in capitalcost and $750,000 per year in operating andmaintenance costs. The total annual cost, includingoperation and maintenance costs and interest oncapital but excluding depreciation, would be$6.0 million.8. Wastewater overflow minimisation<strong>Watercare</strong> has estimated that eliminating all wetweather overflows except in extreme storms couldbe achieved through installing storage tunnelsand tanks in the network. The estimated capitalcost of this is $2,500 million (which includes afurther wastewater treatment plant upgrade) <strong>with</strong>a $10 million annual operating and maintenancecost. The total annual cost, including operationand maintenance costs and interest on capital butexcluding depreciation, would be $175 million.9. Visual enhancement<strong>Watercare</strong> estimates that the cost of camouflaging,removing or replacing ‘unattractive’ assets would beapproximately $120 million and $2 million a year inoperating and maintenance costs. The total annualcost, including operation and maintenance costs andinterest on capital but excluding depreciation, wouldbe $9.9 million.10. Biosolids re-use<strong>Watercare</strong> estimates that the cost of developing along-term use for biosolids would be approximately$250 million and $5 million a year in operating andmaintenance costs. The total annual cost, includingoperation and maintenance costs and interest oncapital but excluding depreciation, would be$21.5 million.11. Partial wastewater reuse for industry, forestry andagriculturePart (30Ml/d) of the treated wastewater, after furthertreatment, could be distributed to industry for reuse.This is estimated to cost $80 million and $2.5 milliona year in operation and maintenance costs. Theannual cost, including operation and maintenancecosts and interest on capital but excludingdepreciation, would be $7.8 million12. Partial wastewater recharge to catchments used forwater extractionPart (100Ml/d) of the treated wastewater could befurther treated and piped to recharge catchmentswhich have had the water extracted from them. Thisis estimated to cost $740 million and $35 million ayear in operation and maintenance costs. The annualcost, including operation and maintenance costs andinterest on capital but excluding depreciation, wouldbe $83.8 million13. Partial wastewater reuse direct to potable waterPart (up to 170Ml/d) of the treated wastewater couldbe further treated and injected into the potablewater supply. This is estimated to cost $900 millionand $75 million a year to operate. The annual costincluding operation and maintenance costs andinterest on capital but excluding depreciation, wouldbe $134 million.Sustainability accountingSustainability accounting puts a value on a company’senvironmental and social initiatives. The abovefigure shows <strong>Watercare</strong>’s operational expenditurein 2011/12 was $437.3 million. That sum includesthe cost of meeting the company’s statutory andregulatory obligations for its water and wastewateroperations. In addition to this, <strong>Watercare</strong> spent $5.1million on activities to reduce its environmentalimpact. A further $461.4 million would be requiredto sustainably mitigate the effects of the company’soperations on the environment. Sustainabilityaccounting allows organisations to quantify thetrade-offs between price and services, and social andenvironmental impacts. For example, the capital costfor making any significant investment in improvingthe wastewater system would initially be met byincreasing <strong>Watercare</strong>’s borrowings, and prices wouldneed to rise to meet those debt servicing costs.However, customers may not be willing to acceptsignificant price rises. Instead, they may prefer toaccept the current number of overflows in return forrelatively lower prices.Return to contents page2012 financial report PAGE 5
<strong>Watercare</strong> Services Limited2012 ANNUAL REPORTFigure 8Grading of water treatment plants and networksWTPPercent of 2011–12annual production (%) WTP Grade Zone Zone GradeMetropolitan WTPs 88.4 A Metropolitan zones aMuriwai 0.1 A Muriwai aWarkworth 0.9 A Warkworth bSnells/Algies 0.7 A Snells/Algies aHelensville 0.8 A Helensville bWellsford 0.5 A Wellsford/Te Hana bBombay WTP 0.1 U Bombay uBuckland WTPs 0.2 U Buckland uClarks Beach WTP 0.2 U Clarks and Waiau uWaiau Beach WTP 0.1 U Clarks and Waiau uDouglas WTP 0.0 U Douglas Road uGlenbrook Beach 0.0 U Glenbrook Beach uPatumahoe WTP 0.1 U Patumahoe uWaiuku WTPs 2.1 U Waiuku uPukekohe WTP 5.7 U Anzac/Hilltop Kitchener uTotal 100.0Note:‘U’ and ‘u’ indicates ungraded plants and networks.PAGE 6 2012 financial reportReturn to contents page
<strong>Watercare</strong> Services Limited2012 ANNUAL REPORTFigure 9Drinking water qualityTreatment plantsTurbidity is ameasure offiltrationeffectiveness anda surrogatemeasure forthe presence ofprotozoa such asCryptosporidiumDeterminandsTurbidityStandard and allowableexceedences Year Ardmore Huia Waitakere Onehunga Huia Village Waikato5% > 0.5 NTU0.00% 0.04% 0.02% 0.00%2008/09none > 1 NTU 0 0 0 05% > 0.5 NTU0.00% 0.00% 0.01% 0.00%2009/10none > 1 NTU 0 0 0 05% > 0.5 NTU0.00% 0.00% 0.00% 0.00%2010/11none > 1 NTU 0 0 0 05% > 0.5 NTU0.00% 0.00% 0.00% 0.00%2011/12none > 1 NTU 0 0 0 0HelensvilleWarkworthWellsfordPukekohe MuriwaiBombay GlenbrookWaikato and Huia Villagecompliance are based onmembrane integrity notturbidity Compliance is basedon UV performancenot turbidityProtozoa removalbased on log creditrequirements ofthe WTPPerformanceof protozoaremovaltechnologyRequired log credits3 3 3 3 3 32011/12% Compliance periods* 100% 100% 100% 100% 100% 100%E. col is anindicator ofpotentialwaterbornedisease carryingorganismsFluoride is addedto treated waterat the request of<strong>Watercare</strong>’scustomersE. col is anindicatorof potentialwaterbornedisease carryingorganismsE. coliwatertreatmentplantsFluorideE. colibulkdistributionsystem10 samples > nil/100ml0 0 1 0 0 02008/092 samples > nil/100ml n/a n/a n/a n/a 0 010 samples > nil/100ml0 0 0 0 0 02009/102 samples > nil/100ml n/a n/a n/a n/a 0 010 samples > nil/100ml0 0 0 0 0 02010/112 samples > nil/100ml n/a n/a n/a n/a 0 010 samples > nil/100ml0 0 0 0 0 02011/122 samples > nil/100ml n/a n/a n/a n/a 0 0 nil/100ml 2011/12 0 0 0 0 0 010 samples > 1.5 mg/l 2008/09 0 0 0010 samples > 1.5 mg/l 2009/10 0 0 0 010 samples > 1.5 mg/l 2010/11 0 0 0 n/a n/a0Complianceis based oncontact time 1.5 mg/l 2011/12 0 0 0 0 n/a100 samples > nil/100ml 2008/09 0100 samples > nil/100ml 2009/10 0100 samples > nil/100ml 2010/11 01/100ml ** 2011/12 0No bulkreticulationNo bulkreticulationTestingincorporated<strong>with</strong>in theArdmore, Huia,Waitakere bulkreticulation zone0 (except forMuriwai wherecompliance is basedon contact time)0 (only Pukekohedoses fluoride)Note:* Log credit compliance monitoring period is one month.** Data in this period refers to transmission and network data. Previous years refer only to transmission data.Dark squares are where information was not available at the time of creating the report.Waiuku ClarksBeach WaiauBeach Snells/Algies PatumahoeBucklandThese WTPsare suppliedfrom secure orinterim securegroundwater boresand thereforemeet the DWSNZ.0n/aReturn to contents page2012 financial report PAGE 7
<strong>Watercare</strong> Services Limited2012 ANNUAL REPORTFigure 10Typical analysis of Auckland’s drinking waterArdmore Huia Waitakere Onehunga WaikatoDeterminands Raw Treated Raw Treated Raw Treated Raw Treated Raw TreatedTurbidity (NTU) 2.89 0.18 6.96 0.22 3.53 0.24 0.26 0.21 13.03 0.57E. coli (Number per 100ml) 4 N/D 24 N/D 10 N/D 324 N/D 92 N/DAluminium (mg/L) 0.28 0.03 0.85 0.05 0.65 0.03 0.01 0.03 0.66 0.11Iron (mg/L) 0.33 0.01 0.79 0.09 0.78 0.02 0.01 0.00 0.98 0.03Manganese (mg/L) 0.03 N/D 0.03 ND 0.03 ND N/D N/D 0.06 N/DpH Value 7.4 8.0 7.6 7.9 7.1 7.8 7.3 7.9 7.6 8.0Total hardness (mg/L CaCO 3) 12.4 23.3 21.8 34.3 16.1 34.3 54.2 53.2 30.7 55.6Note:This covers the 12 month period for water supplied from the metropolitan water treatment plants from 1 July 2011 to 30 June 2012.N/D: Non DetectableFigure 11Water interruption frequency500 20Total number of interruptions400 108.6 8.5 8.2 8.1 7.6 7.1 6.7 6.5 6.3 6.2 5.9 5.8300 0240253200217195198205180187 183168173154-10100 -20No. per 1000 connections (YTD annualised)Annual targetCumulativeannualised resultNumber of interruptionsNote:0 -30Jul 11 Aug 11 Sep 11 Oct 11 Nov 11 Dec 11 Jan 12 Feb 12 Mar 12 Apr 12 May 12 Jun 12The annual target is to maintain water supply interruption frequency to less than 10 per 1,000 connections.PAGE 8 2012 financial reportReturn to contents page
<strong>Watercare</strong> Services Limited2012 ANNUAL REPORTFigure 12Unplanned water shutdowns restored <strong>with</strong>in 5 hours500 100%99% 100% 100% 99% 98% 100% 99% 98% 98% 99%96%98%40080%Total number of shutdowns300 60%234226192200 17817818319318340%168 174152151100 20%% restored<strong>Watercare</strong>’s annualtarget 90%Unplanned watershutdown responses% RestoredTotal number ofunplanned watershutdowns0 0Jul 11 Aug 11 Sep 11 Oct 11 Nov 11 Dec 11 Jan 12 Feb 12 Mar 12 Apr 12 May 12 Jun 12Note:The annual target is to ensure that 90% of unplanned water shutdowns are restored <strong>with</strong>in five hours.Figure 13Water quality complaintsNo. of water quality complaints500 85.95.6 5.5 5.364.9400 Target less than 5 per4.7 4.51000 customers per year4.4 4.2 4.144.1 4.123000-2200177160159151-4131 136123134120114101100 89-60 -10Jul 11 Aug 11 Sep 11 Oct 11 Nov 11 Dec 11 Jan 12 Feb 12 Mar 12 Apr 12 May 12 Jun 12-8Complaints per 1,000 customers (YTD annualised)Target(per 1,000 customers)Complaints per 1,000customers per month(annualised)Number of complaintsReturn to contents page2012 financial report PAGE 9
<strong>Watercare</strong> Services Limited2012 ANNUAL REPORTFigure 14Resource consent complianceLocation Nature of non-compliance MonthPotential oractual impactMitigation action and commentsWaterArdmore WaterTreatment PlantClarks BeachWater SupplyHuia WaterTreatment PlantExceedance of aluminium limit inthe stormwater discharge.Exceedance of daily extraction limitof bore.Exceedance of aluminium limit inthe stormwater discharge.Aug & SepAug, Sep,Nov, Dec,Jan & MayOct, Dec,Jan, Mar,May & JunNo adverse effectsanticipated in thereceiving environment.The over abstractionwas on isolateddays following busyweekends or caused bywatermain bursts. No ongoing adverse impact isexpected.Discharge limitexceeded due toheavy rain on sludgestorage area. No effectsobserved in stream.Mangakura Dam Exceeded authorised take volume. Ongoing No adverse effectsanticipated in thereceiving environment.Onehunga WaterTreatment PlantWaikato WaterTreatment PlantWaitakere WaterTreatment PlantNot maintaining environmentalmitigation flows to downstreamwetland.No flow measurement equipmentin place to ensure compliance <strong>with</strong>maximum discharge rate back tothe river.Exceedance of aluminium limit inthe stormwater discharge.Dec,Jan & FebOngoingJul, Aug,Sep & MarNo adverse effectsanticipated in thereceiving environment.No adverse effectsanticipated in thereceiving environment.Discharge limitexceeded due to heavyrain on sludge storageareas. No effectsobserved in stream.Exceedance caused by dredging ofdetention ponds to increase capacityon ponds.A new watermain will be laid to supplyClarks Beach from the Waikato Watermainand the bore will be decommissioned.The watermain is expected to becompleted in 2014.Sludge processing plant due to beupgraded in 2016.Exceedance necessary to meet waterdemands of Helensville. New applicationlodged which would increase theauthorised limit of this old water rightpermit. Consent application now on hold(<strong>with</strong> approval from Auckland Council)whilst <strong>Watercare</strong> evaluates futurerequirements.Review of plant operation underwayto ensure environmental flows aremaintained.Consent variation is to be lodged <strong>with</strong>Waikato Regional Council to change thewording of the relevant consent condition.Options being reviewed by the PlanningDepartment to ensure compliance <strong>with</strong>consent requirements.Note:No sanctions or fines related to accounting fraud, workplace discrimination or corruption have been brought against <strong>Watercare</strong>.No administrative or judicial sanctions were levied against <strong>Watercare</strong> for failure to comply <strong>with</strong> laws or regulations concerning the provision and use of productsand services.No legal actions for anti-competitive behaviour, anti-trust, or monopoly practices have been brought against <strong>Watercare</strong>.There have been no complaints regarding breaches of customer privacy or losses of customer data.PAGE 10 2012 financial reportReturn to contents page
<strong>Watercare</strong> Services Limited2012 ANNUAL REPORTFigure 14 (continued)Resource consent compliance (continued)Location Nature of non-compliance MonthPotential oractual impactMitigation action and commentsWastewaterClarks BeachWastewaterTreatment PlantExceedance of various dischargequality limits and peak flow limit.OngoingNo adverse effectsanticipated in thereceiving environment.<strong>Watercare</strong> took over operation of this plantin Nov 2010. A new consent is required tobe lodged in late 2012 and the plant willbe upgraded once this is granted.HelensvilleWastewaterTreatment PlantExceedance of various dischargequality limits and peak flow limit.All yearNo adverse effectsanticipated in thereceiving environment.Memorandum ofUnderstanding agreed<strong>with</strong> Auckland Councilregarding the discharge.New consent was granted in June 2012that includes achievable performancestandards that will allow the plant tobecome compliant.KingseatWastewaterTreatment PlantMinor exceedance of various qualitylimits.Jul, Sep, Oct,Nov, Dec,Feb, Mar, Apr,May & JunNo adverse effectsanticipated in thereceiving environment.<strong>Watercare</strong> took over operation of this plantin Nov 2010. This plant will be upgradedonce a new consent, which is currentlybeing processed by Auckland Council, isgranted.MangereWastewaterTreatment PlantFailed monthly 99% average UVdoseOctNo adverse effectsanticipated in thereceiving environmentas 98.95% doseachieved.Poor UV transmittance due to prolongedwet weather flow.MangereWastewaterTreatment PlantExceedance of monthly totalnitrogen discharge limit.Jan & FebNo adverse effectsanticipated in thereceiving environment.Result of low incoming flows duringholiday period. Options to enhancenitrogen removal over summer beinginvestigated.MangereWastewaterTreatment PlantExceedance of ammonia dischargelimit on a single day.SepNo adverse effectsanticipated in thereceiving environment.Blower maintenance reviewed to minimiserisk of reoccurrence.MatakanaWastewaterTreatment PlantExceedance of various dischargequality limits and peak flow limit.OngoingSome minor localeffects are anticipatedin the Matakana River.Plant to be decommissioned in late 2012as <strong>Watercare</strong> has installed a pipelineto pump the wastewater to the OmahaWastewater Treatment Plant.OwhanakeWastewaterTreatment PlantExceedance of various dischargequality limits and peak flow limit.Jan, Feb, Mar,Apr & MayNo adverse effectsanticipated in thereceiving environment.<strong>Watercare</strong> is considering methods tomodify the operation of plant to preventthe exceedance of the conditions.PukekoheWastewaterTreatment PlantExceedance of various dischargequality limits and peak flow limit.Jul, Aug, Nov,Dec & JunNo adverse effectsanticipated in thereceiving environment.<strong>Watercare</strong> has changed how this plant hasrun to try and reduce non-compliances.Waiuku WastewaterTreatment PlantExceedance of various dischargequality limits and peak flow limit.OngoingNo adverse effectsanticipated in thereceiving environment.<strong>Watercare</strong> took over operation of this plantin Nov 2010. Auckland Council is currentlyprocessing a consent application for thisplant and the plant will be upgraded oncethis has been granted.WellsfordWastewaterTreatment PlantExceedance of various dischargequality limits and peak flow limit.OngoingNo adverse effectsanticipated in thereceiving environment.<strong>Watercare</strong> took over operation of this plantin Nov 2010. Auckland Council is currentlyprocessing a consent application for thisplant and the plant will be upgraded oncethis has been granted.Note:Technical and minor non-compliances, such as a report being submitted late, are not included in the list above.Under the G3 reporting framework, <strong>Watercare</strong> is required to provide information on environment indicator EN28, society indicators SO7 and SO8 and productresponsibility indicators PR2, PR4, PR7, PR8 and PR9, relating to compliance, anti-competitive behaviour, product and service labelling and customer privacy. Extrainformation has been added to this table from previous years to meet G3 reporting requirements.Return to contents page2012 financial report PAGE 11
<strong>Watercare</strong> Services Limited2012 ANNUAL REPORTFigure 15Wastewater treatment plant discharge 2011/2012WastewaterTreatment PlantDischargeVolumem 3 /yearDischargeVolume ConsentCompliance*Other volumeDischarged Non-Compliant **BiosolidsQuantitytonnesScreeningsQuantitytonnesGritQuantitytonnesMetroNon-MetroMangere 117,204,866 Yes 8,861,903*** 106,798 1,377 1,985Rosedale 28,985,822 Yes 0 14,784 247 190Army Bay 3,639,510 Yes 0 4,372Sub Total – Metro WWTPs 149,830,198 686,932 125,923 1,622 2,126Pukekohe 2,467,653 Yes 511,659 0 20 24Warkworth 378,921 Yes 0 354 7.9 10Omaha 144,851 Yes 0 – – –Helensville 553,722 No 553,722 – – –Wellsford 275,778 No 275,778 – – –Snells/Algies 267,079 Yes 0 – – –Waiwera 84,018 Yes 0 – – –Huapai/Kumeu 27,183 No 27,183 – – –Matakana 39,009 No 39,009 – – –Denehurst Drive 5,641 No 5,641 – – –Beachlands 393,567 Yes 30,254 300 13.0 0Owhanake 7,804 Yes 3,425 0 – –Clarks Beach 182,478 No 148,589 0 – –Waiuku 812,035 No 812,035 0 – –Kingseat 10,206 No 3,067 0 – –Bombay 1080 Yes 0 0 – –Sub Total – Non Metro WWTPs 5,651,023 2,410,361 622 44 34Note:* Annual Average and Maximum volume.** Excludes minor or technical non-compliance.***Consent limits for Total Nitrogen (36 days), Ammonia (5 days) and UV dose (2 days) were not met for each during the year.PAGE 12 2012 financial reportReturn to contents page
<strong>Watercare</strong> Services Limited2012 ANNUAL REPORTFigure 16Wastewater treatment plant performance – MangereJul2011Aug2011Sep2011Oct2011Nov2011Dec2011Jan2012Feb2012Mar2012Apr2012May2012Jun2012No 30083ConsentLimitsPlant loadMonthly meanBOD (g/m 3 ) 2.9 2.4 3.3 3.6 2.0 2.6 1.9 1.9 2.8 1.6 2.0 2.5
<strong>Watercare</strong> Services Limited2012 ANNUAL REPORTFigure 16 (continued)Wastewater treatment plant performance – BeachlandsJul2011Aug2011Sep2011Oct2011Nov2011Dec2011Jan2012Feb2012Mar2012Apr2012May2012Jun2012No 26875ConsentLimitsPlant load90 percentile on 10 consecutive samples tested to current monthBOD (g/m 3 ) 2.5 2.5 3.6 3.6 2.0 2.0 2.5 1.6 7.1 2.1 1.1 1.1
<strong>Watercare</strong> Services Limited2012 ANNUAL REPORTFigure 16 (continued)Wastewater treatment plant performance – WaihekeJul2011Aug2011Sep2011Oct2011Nov2011Dec2011Jan2012Feb2012Mar2012Apr2012May2012Jun2012No 26771ConsentLimitsPlant loadMaximum of monthly sample testedBOD (g/m 3 ) 2.0 2.0 2.0 2.0 2.0 2.0 0.5 1.0 0.5 0.5 0.5 0.5
<strong>Watercare</strong> Services Limited2012 ANNUAL REPORTFigure 16 (continued)Wastewater treatment plant performance – KingseatJul2011Aug2011Sep2011Oct2011Nov2011Dec2011Jan2012Feb2012Mar2012Apr2012May2012Jun2012No 907365ConsentLimitsPlant load95% of samples tested in any 12 month period to current monthBOD 100% 100% 100% 100% 100% 100% 100% 100% 100% 100% 100% 100%
<strong>Watercare</strong> Services Limited2012 ANNUAL REPORTFigure 16 (continued)Wastewater treatment plant performance – Clarks BeachJul2011Aug2011Sep2011Oct2011Nov2011Dec2011Jan2012Feb2012Mar2012Apr2012May2012Jun2012No 12998ConsentLimitsPlant loadMedian on 20 consecutive samples tested to current monthBOD (g/m 3 ) 7.8 7.8 9.2 9.8 12.5 15.0 15.5 13.5 13.5 13.5 11.0 11.0
<strong>Watercare</strong> Services Limited2012 ANNUAL REPORTFigure 16 (continued)Wastewater treatment plant performance – WaiukuJul2011Aug2011Sep2011Oct2011Nov2011Dec2011Jan2012Feb2012Mar2012Apr2012May2012Jun2012No 907443ConsentLimitsPlant load95% of samples tested over any consecutive 12 month period to current monthBOD (% of samples) 76% 77% 76% 77% 76% 73% 73% 77% 80% 80% 81% 81%
<strong>Watercare</strong> Services Limited2012 ANNUAL REPORTFigure 16 (continued)Wastewater treatment plant performance – PukekoheJul2011Aug2011Sep2011Oct2011Nov2011Dec2011Jan2012Feb2012Mar2012Apr2012May2012Jun2012No 940331ConsentLimitsPlant load10% of 26 fortnightly samples tested to current monthBOD (% of samples) 0% 0% 0% 0% 4% 4% 4% 8% 8% 8% 8% 8% >12 g/m 3NFR (% of samples) 4% 4% 4% 8% 8% 15% 15% 15% 15% 15% 19% 23% >18 g/m 3Maximum of 26 fortnightly samples tested to current monthBOD (g/m 3 ) 5.4 5.4 5.4 11.0 30.0 30.0 30.0 24.0 24.0 24.0 24.0 24.0 10 g/m 3Maximum of 26 fortnightly samples tested to current monthTotal phosphorus (g/m 3 ) 7.1 7.1 8.1 8.1 11.0 11.0 11.0 11.0 11.0 11.0 11.0 11.0
<strong>Watercare</strong> Services Limited2012 ANNUAL REPORTFigure 16 (continued)Treated wastewater standards – RosedaleStandardJul2011Aug2011Sep2011Oct2011Nov2011Dec2011Jan2012Feb2012Mar2012Apr2012May2012Jun2012AnnualMedianPollutant loadMonthly medianMedianBOD (g/m 3 )
<strong>Watercare</strong> Services Limited2012 ANNUAL REPORTFigure 16 (continued)Treated wastewater standards – Army BayStandardJul2011Aug2011Sep2011Oct2011Nov2011Dec2011Jan2012Feb2012Mar2012Apr2012May2012Jun2012AnnualMedianPollutant loadMonthly medianMedianBOD (g/m 3 )
<strong>Watercare</strong> Services Limited2012 ANNUAL REPORTFigure 16 (continued)Treated wastewater standards – WarkworthStandardJul2011Aug2011Sep2011Oct2011Nov2011Dec2011Jan2012Feb2012Mar2012Apr2012May2012Jun2012Annual92ndPercentilePollutant loadMonthly 92 Percentile92ndPercentileNFR (g/m 3 )
<strong>Watercare</strong> Services Limited2012 ANNUAL REPORTFigure 16 (continued)Treated wastewater standards – WellsfordStandardJul2011Aug2011Sep2011Oct2011Nov2011Dec2011Jan2012Feb2012Mar2012Apr2012May2012Jun2012Annual95thPercentilePollutant loadMonthly 95 Percentile95thPercentileBOD (g/m 3 )
<strong>Watercare</strong> Services Limited2012 ANNUAL REPORTFigure 16 (continued)Treated wastewater standards – OmahaStandardJul2011Aug2011Sep2011Oct2011Nov2011Dec2011Jan2012Feb2012Mar2012Apr2012May2012Jun2012Annual95thPercentilePollutant loadMonthly 95 Percentile95thPercentileBOD (g/m 3 )
<strong>Watercare</strong> Services Limited2012 ANNUAL REPORTFigure 16 (continued)Treated wastewater standards – DennehurstStandardJul2011Aug2011Sep2011Oct2011Nov2011Dec2011Jan2012Feb2012Mar2012Apr2012May2012Jun2012AnnualMaximumPlant loadMonthly maximumMaximumBOD (g/m 3 ) –6 monthly
<strong>Watercare</strong> Services Limited2012 ANNUAL REPORTFigure 16 (continued)Treated wastewater standards – WaiweraStandardJul2011Aug2011Sep2011Oct2011Nov2011Dec2011Jan2012Feb2012Mar2012Apr2012May2012Jun2012Annual95thPercentilePlant loadMonthly 95 PercentileBOD (g/m 3 )
<strong>Watercare</strong> Services Limited2012 ANNUAL REPORTFigure 16 (continued)Treated wastewater standards – HuapaiStandardJul2011Aug2011Sep2011Oct2011Nov2011Dec2011Jan2012Feb2012Mar2012Apr2012May2012Jun2012Annual95thPercentilePollutant loadMonthly medianMedianBOD (g/m 3 )
<strong>Watercare</strong> Services Limited2012 ANNUAL REPORTFigure 16 (continued)Treated wastewater standards – HelensvilleStandardJul2011Aug2011Sep2011Oct2011Nov2011Dec2011Jan2012Feb2012Mar2012Apr2012May2012Jun2012Annual95thPercentilePollutant loadMonthly 95 Percentile95thPercentileBOD (g/m 3 )
<strong>Watercare</strong> Services Limited2012 ANNUAL REPORTFigure 16 (continued)Treated wastewater standards – Snells/AlgiesStandardJul2011Aug2011Sep2011Oct2011Nov2011Dec2011Jan2012Feb2012Mar2012Apr2012May2012Jun2012AnnualMedianBacteriologicalMonthly medianFaecal Coliforms(#/100ml)Pollutant loadMonthly 92 PercentileMedian
<strong>Watercare</strong> Services Limited2012 ANNUAL REPORTFigure 18Sewer breaks and chokes interruption frequency600 10Maximum less than 10 per 1,000 properties per yearNumber of sewer breaks and chokes4002007.22467.2 7.2 7.1 7.0 6.7 6.7 6.7 6.6 6.7 6.5 6.4271254238248232214190 1991941931720-10Number per 1000 properties (YTD annualised)Annual targetFrequency per1,000 propertiesNumber of breaksand chokes0 -20Jul 11 Aug 11 Sep 11 Oct 11 Nov 11 Dec 11 Jan 12 Feb 12 Mar 12 Apr 12 May 12 Jun 12Note:The annual target is to maintain the frequency of sewer breaks and chokes to less than 10 interruptions per 1,000 properties.Figure 19Response to wastewater blockages <strong>with</strong>in one hour600Target 98% passing99% 100% 100% 100% 99% 99% 100% 100% 99% 99% 97% 99%100%Number of wastewater blockages400200331343376392286192283 286271260 261352% ResponseTarget 98% passing% response <strong>with</strong>in1 hourNumber of wastewaterblockages0 0Jul 11 Aug 11 Sep 11 Oct 11 Nov 11 Dec 11 Jan 12 Feb 12 Mar 12 Apr 12 May 12 Jun 12Note:The annual target is to ensure that at least 98% of wastewater blockages are responded to <strong>with</strong>in contract requirements.PAGE 30 2012 financial reportReturn to contents page
<strong>Watercare</strong> Services Limited2012 ANNUAL REPORTFigure 20Lost-time injury frequency rate14Number of accidents per million hours worked1210864212.1 12.1 12.110.99.37.25.81.35.02.53.52.61.4Annual targetNote:098/99 99/00 00/01 01/02 02/03 03/04 04/05 05/06 06/07 07/08 08/09 09/10 10/11 11/12The annual target for staff lost-time injury frequency rate is less than five per million hours worked.0.0The lost time injury frequency rate for 2011/2012 is 1.4 and well below the target of 5.Under the G3 reporting framework <strong>Watercare</strong> is required to provide information on G3 labour practices and decent work indicator LA7, relating to occupational healthand safety. This additional information has been included to meet G3 criteria.Return to contents page2012 financial report PAGE 31
<strong>Watercare</strong> Services Limited2012 ANNUAL REPORTFigure 21Health and safety notesPercentage of total workforce represented in formal joint management-worker health and safety committees that help monitor and advise on occupationalhealth and safety programs. (G3-LA6)A formal Health and Safety Committee structure exists <strong>with</strong>in <strong>Watercare</strong>.A total of eleven health and safety committees operate <strong>with</strong>in <strong>Watercare</strong>, meeting on a monthly basis to cover health and safety requirements, accidentsand other issues. There is a total of 65 committee members.A total of 648 permanent staff / 65 committee members = 9.97%.Formal committee meeting minutes are kept.Rates of injury, occupational diseases, lost days, and absenteeism, and total number of work-related fatalities by region. (G3-LA7)Formal reporting requirements include – near miss, first aid injury, medical treatment injury, lost time injury, all injury and total injury expressed as arolling 12 months. A company-wide Occupational Safety and Health Manual is maintained on the intranet to provide health and safety guidance policyand reporting processes.All injury metrics are reported in accordance to the AS 1885.1 Workplace injury and disease recording standard.<strong>Watercare</strong> complies <strong>with</strong> the Health and Safety in Employment Act 1992.<strong>Watercare</strong> complies <strong>with</strong> the ACC Workplace Safety Management Practice Requirements (Tertiary Level)<strong>Watercare</strong> is registered <strong>with</strong> Telarc SAI Limited – Compliance <strong>with</strong> AS/NZS 4801:2001Education, training, counselling, prevention, and risk-control programmes in place to assist workforce members, their families, or community membersregarding serious diseases. (G3-LA8)The company has engaged medical professionals Primary Corporate Health (PCH) to overview and provide medical expertise regarding work relatedhealth issues.All employees in key or high risk roles undergo annual medical assessments.<strong>Watercare</strong> operates a comprehensive Employee Assistance Programme providing all employees <strong>with</strong> access to a wide range of confidential counsellingservices. The service is also used in any incident requiring crisis intervention.All employees required to work in a wastewater environment are immunised against hepatitis A and B, polio, tetanus and typhoid at company cost.All employees are offered free influenza immunisation on an annual basis.All new employees and contractors receive an initial site specific and generic safety induction onto <strong>Watercare</strong> sites and are then required to attendregular refresher training.Employees receive Health and Safety training appropriate to their role. Training includes: first aid, confined space, working at heights, working on theroad, fork hoist, and chemical handling.The company sets a target of 440 safety inspections each year. An inspections report is completed each month.<strong>Watercare</strong> works closely <strong>with</strong> ACC providing comprehensive rehabilitation and return to work programme for work and non-work related injuries.Health and safety topics covered in formal agreements <strong>with</strong> trade unions. (G3-LA9)Union representatives and members participate in Health and Safety Committees and are involved in selection and trials of personal protective equipment.Collective Agreements have a commitment to the health and safety of employees.Union representatives and members are involved in selection and trials of personal protective equipment.The right to refuse unsafe work is recognised as part of the Health and Safety Management System and is a legal requirement.Complaints are noted by means of a hazard reporting process.Note:Under the G3 reporting framework <strong>Watercare</strong> is required to provide information on G3 labour practices and decent work indicators LA6, LA7, LA8 and LA9, relatingto occupational health and safety. This additional information has been included to meet G3 criteria.PAGE 32 2012 financial reportReturn to contents page
<strong>Watercare</strong> Services Limited2012 ANNUAL REPORTFigure 22Staff wellness and absenteeism3.53.23.0Percentage of available work hours2.52.01.51.02.52.1 2.12.22.0 2.01.71.9 1.91.71.82.01.8Annual target0.5098/99 99/00 00/01 01/02 02/03 03/04 04/05 05/06 06/07 07/08 08/09 09/10 10/11 11/12Note:As a measure of staff wellness <strong>Watercare</strong> monitors and report the percentage of staff hours lost through illness. During 2011/2012 the number of work hours lostthrough illness decreased to 1.8% of available hours, this is <strong>with</strong>in the target of 2.5%.Note:Under the G3 reporting framework <strong>Watercare</strong> is required to provide information on G3 labour practices and decent work indicator LA7, relating to occupationalhealth and safety. This additional information has been included to meet G3 criteria.Figure 23Staff voluntary turnover2018161617 17Percentage of staff1412108613 131013111312105.410.511.8Target range42098/99 99/00 00/01 01/02 02/03 03/04 04/05 05/06 06/07 07/08 08/09 09/10 10/11 11/12Note:Voluntary staff turnover for the year July 2011 to June 2012 was 11.81%, which is <strong>with</strong>in the target range of 10 - 12%.Return to contents page2012 financial report PAGE 33
<strong>Watercare</strong> Services Limited2012 ANNUAL REPORTFigure 24Investment in staff2005/06 2006/07 2007/08 2008/09 2009/10 2010/11 2011/12$000 $000 $000 $000 $000 $000 $000Total remuneration 24,954 27,292 29,185 31,739 29,713 46,480 55,575Expenditure on training 428 519 598 664 538 501 604Health care expenditure 94 90 91 143 111 189 137Life and disability insurance 173 199 227 227 300 417 543Note:25,649 28,100 30,101 32,773 30,662 47,587 56,859Under the G3 reporting framework <strong>Watercare</strong> is required to provide information on G3 economic indicator EC5 and human rights indicator HR3, relating to marketpresence and investment and procurement practices. Expenditure on external training for 2011/12 increased by 20% over the 2010/11 period. In addition therewas significant levels of internal training given for systems upgrades and projects. No specific training on human rights is given. However, the company has humanresources policies in place to ensure the welfare and consistent treatment of all employees, in line <strong>with</strong> New Zealand government legislation. <strong>Watercare</strong> appliesa total remuneration policy which is inclusive of company-funded life and disability insurances. No <strong>Watercare</strong> permanent employee is paid less than 28% abovethe legal minimum wage.Lowest paid permanent employee – Trainee Water Treatment Operator – $17.31 per hour1/4/2012 Minimum Wage $13.50Figure 25Staff service profile200150Number of employees10050200620072008200920102011201202 2>3 3>4 4>5 5>10 10>15 15>20 20>25 25>30 30>35 35>40 40>45 45>50Note:The graph shows the levels of staff service. With the amalgamation of <strong>Watercare</strong> and the Local Network Operators (LNOs) in November 2010 there has beensignificant change in some areas of service profiles, <strong>with</strong> 76% of staff now having less than 10 years service. It should be noted that staff joining from LNO andCouncils as part of the amalgamation retained their service <strong>with</strong> those organisations and this is reflected in the data.Under the G3 reporting framework <strong>Watercare</strong> is required to provide information on G3 labour practices and decent work indicators LA2, relating to employment.This additional information has been included to meet G3 criteria.PAGE 34 2012 financial reportReturn to contents page
<strong>Watercare</strong> Services Limited2012 ANNUAL REPORTFigure 26Staff demographicsEmployee age profile10080Number of employees60402020062007200820092010201120120
<strong>Watercare</strong> Services Limited2012 ANNUAL REPORTFigure 27Average staff numbers700600533618Permanent staff numbers500400300200359 359 352 343332 332348369 374388100098/99 99/00 02/03 03/04 04/05 05/06 06/07 07/08 08/09 09/10 10/11 11/12Note:The data includes all permanent <strong>Watercare</strong> staff members but does not include staff on fixed term contracts, contractors, casual staff or students onwork experience.Under the G3 reporting framework <strong>Watercare</strong> is required to provide information on economic indicator EC7 relating to market presence. This additionalinformation has been included to meet G3 criteria.Figure 28Workforce by employment type, contract, and regionHeadcount2004/05 2005/06 2006/07 2007/08 2008/09 2009/10 2010/11 2011/12Individual Employment Agreements (IEA) 232 252 275 278 295 306 512 541Collective Employment Agreements (CEA) 82 81 81 82 82 80 96 104WSL apprentices 3 2 3 2 2 1 0 0Part-time FTEs 4 2 2 1 1 1 3 2.5Subtotal 321 337 361 363 380 388 611 648F/Term Individual Agreements (IEA) >1yr 3 2 2 4 6 7 5 4F/Term Individual Agreements (IEA)
<strong>Watercare</strong> Services Limited2012 ANNUAL REPORTFigure 29Customer satisfaction <strong>with</strong> the contact centre9876TNS Score543210Jul 11Aug 11Sep 11Oct 11Nov 11Dec 11Jan 12Feb 12Mar 12Apt 12May 12Jun 12 7.6Jul 11Aug 11Sep 11Oct 11Nov 11Dec 11Jan 12Feb 12Mar 12Apt 12May 12Jun 12 7.9Jul 11Aug 11Sep 11Oct 11Nov 11Dec 11Jan 12Feb 12Mar 12Apt 12May 12Jun 12 7.5Jul 11Aug 11Sep 11Oct 11Nov 11Dec 11Jan 12Feb 12Mar 12Apt 12May 12Jun 12 7.6Don’t waste my time Communicate <strong>with</strong> me Deliver to me OverallYTD averageNote:A sample of customers receiving maintenance work are surveyed by TNS on their contact centre work experience.Overall the Contact Centre satisfaction was 7.7.All scores are out of a maximum score of 9.To obtain an overall score an average of the Contact Centre surveys scores was taken and scaled up to a percentage.Figure 30Grade of serviceMin DateYear MonthOfferedCallsAbandonedCallsAnsweredCallsGOSAbandonedCalls SL1AnsweredCalls
<strong>Watercare</strong> Services Limited2012 ANNUAL REPORTFigure 30 (continued)Grade of service and call volume40,000 100%37,50095%35,00090%Call volume32,50030,00027,50085%80%Grade of service %GOS targetGOS actual25,0001375%Call volume22,50070%20,000Jul Aug Sep Oct Nov Dec Jan Feb Mar Apr May Jun65%Figure 31Complaint types and response ratesMonthReceivedNumberReceivedComplaints Correspondence CombinedResolvedin SLA%<strong>with</strong>in SCISCITargetNumberReceivedResolvedin SLA%<strong>with</strong>in SCISCITargetNumberreceivedResolvedin SLA%<strong>with</strong>in SCIJul 11 241 238 98.8% 95% 1,902 1,902 100.0% 95% 2,143 2,140 99.9% 95%Aug 11 192 190 99.0% 95% 1,824 1,823 99.9% 95% 2,016 2,013 99.9% 95%Sep 11 188 183 97.3% 95% 1,843 1,843 100.0% 95% 2,031 2,026 99.8% 95%Oct 11 126 113 89.7% 95% 1,866 1,865 99.9% 95% 1,992 1,978 99.3% 95%Nov 11 114 106 93.0% 95% 2,294 2,294 100.0% 95% 2,408 2,400 99.7% 95%Dec 11 67 65 97.0% 95% 2,072 2,072 100.0% 95% 2,139 2,137 99.9% 95%Jan 12 58 55 94.8% 95% 1,458 1,456 99.9% 95% 1,516 1,511 99.7% 95%Feb 12 66 64 97.0% 95% 2,201 2,200 100.0% 95% 2,267 2,264 99.9% 95%Mar 12 70 68 97.1% 95% 2,359 2,357 99.9% 95% 2,429 2,425 99.8% 95%Apr 12 84 80 95.2% 95% 2,063 2,059 99.8% 95% 2,147 2,139 99.6% 95%May 12 72 68 94.4% 95% 2,572 2,562 99.6% 95% 2,644 2,630 99.5% 95%Jun 12 77 76 98.7% 95% 2,953 2,933 99.3% 95% 3,030 3,009 99.3% 95%YTD 1,355 1,306 96.4% 95% 25,407 25,366 99.8% 95% 26,762 26,672 99.7% 95%SCITargetNote:The service level agreement (SLA) for resolution is 10 working days.PAGE 38 2012 financial reportReturn to contents page
<strong>Watercare</strong> Services Limited2012 ANNUAL REPORTFigure 32Household affordabilityAverage weekly billed value as percentage of weekly household income.2.500%2.00%1.50%1.00%0.50%FranklinManukau WaterMetro WaterNorth ShoreRodneyWaitakereTotalSLA target0.00%Jul 11 Aug 11 Sept 11 Oct 11 Nov 11 Dec 11 Jan 12 Feb 12 Mar 12 Apr 12 May 12 Jun 12Figure 33Community impact of operationsUnder the G3 reporting framework, <strong>Watercare</strong> is required to provide information on G3 society indicator SO1, relating to community.<strong>Watercare</strong> actively maintains positive relationships <strong>with</strong> communities affected by its business. <strong>Watercare</strong>’s Statement of Corporate Intent laysout the activities to be undertaken by <strong>Watercare</strong> and sets specific economic, social and environmental objectives for the company. This processinherently includes consideration of the impacts <strong>Watercare</strong>’s business will have on the wider community.At a local level, <strong>Watercare</strong> fosters active relationships <strong>with</strong> affected communities through forums and individual relationships, as well as carryingout impact assessments as part of the process of applying for resource consent approvals for all major projects. These principles of communityconsideration apply through all stages of <strong>Watercare</strong>’s business, from the start of a new project or operation through to its conclusion.Project teams identify potential effects on communities and assess options to avoid, remedy or mitigate adverse effects. Information is gatheredusing a number of sources, including stakeholders identified through relevant legislation or by local authorities; general stakeholders; iwi; andlocal knowledge and advisory groups.This approach has been highly effective in mitigating negative and maximising positive impacts. For example, Project Manukau – the $450 millionupgrade of the Mangere Wastewater Treatment Plant – involved extensive consultation <strong>with</strong> the local community, culminating in the return ofthe harbour for community use and the removal of the plant oxidation ponds. <strong>Watercare</strong> maintains working relationships <strong>with</strong> a wide range ofstakeholders including the Environmental Advisory Group and local community groups around various projects.Following the 1 November 2010 integration of the Auckland water authorities, <strong>Watercare</strong>’s interactions <strong>with</strong> the community increased as thecompany gained responsibility for local water and wastewater networks spread over a greater geographical area. Accordingly, <strong>Watercare</strong> hasdeveloped and maintained strong linkages <strong>with</strong> a wider range of communities and their representatives, including Auckland’s newly-createdLocal Boards. In May 2011, the company appointed a dedicated executive to directly manage relationships <strong>with</strong> Local Boards.More recently, wide ranging consultation has taken place on the Hunua No. 4 water transmission pipeline and the Central Interceptor wastewaterproject. Public consultation <strong>with</strong> iwi, community groups and Auckland Council Local Boards has been effective and is ongoing.Note: Under the G3 reporting framework <strong>Watercare</strong> is required to provide information on the society indictor SO1 relating to the community.This additional information has been included to meet G3 criteria.Return to contents page2012 financial report PAGE 39
<strong>Watercare</strong> Services Limited2012 ANNUAL REPORTFigure 34Public policy participationUnder the G3 reporting framework <strong>Watercare</strong> is required to provide information on G3 society indicators SO5 and SO6, relating to public policy.<strong>Watercare</strong> is an active participant in the development of relevant legislation and policy initiatives.Significant issues and core positionNew Zealand Coastal Policy Statement 2010.The Government released and adopted the revised New Zealand Coastal Policy Statement in 2010. This sets the policy direction for managingthe coastal environment, including discharges to the coastal marine area. Regional and local governments are now required to give effect to theCoastal Policy Statement through their regional plans.National Policy Statement for Freshwater Management 2011.The Government has now adopted the National Policy Statement for Freshwater Management. Regional and local governments are now requiredto give effect to the NPS in their regional plans.Land and Water Forum.<strong>Watercare</strong> is a plenary member of the Land and Water Forum. The Forum consists of representatives from various organisations <strong>with</strong> an interest infresh water. Its task, through a stakeholder led process, is to recommend outcomes, goals and long-term strategies for fresh water in New Zealand.Initially, the Forum reported to the Minister for the Environment and the Minister of Agriculture in August 2010. Currently, the Forum is preparinga series of reports on a range of other subjects including Water Allocation and Governance.The Auckland Regional Council (ARC) Air, Land & Water Plan.<strong>Watercare</strong> made a series of submissions related to policies and rules related to water supply and wastewater activities. <strong>Watercare</strong> has beenactively working <strong>with</strong> Auckland Council to resolve the outstanding appeals. All but a few final matters have now been resolved.Environment Waikato Water Allocation Variation to Regional Plan.<strong>Watercare</strong> was supportive of proposed changes which aim to protect domestic and community water supplies and to ensure that sufficient wateris retained for in-stream requirements during periods of water shortage. <strong>Watercare</strong> worked in collaboration <strong>with</strong> other municipal water supplyauthorities in the region to present a united front on these issues. The Environment Court decision was issued in November 2011. The outcomewas favourable to <strong>Watercare</strong> and the other municipal water supplier insofar as it provides for priority for municipal water supply through its finalpolicies, objectives, and rules.New Zealand Standard Ecological Flows and Water Levels.<strong>Watercare</strong> lodged a submission to this standard to ensure appropriate standards are established <strong>with</strong> respect to its storage and takes of surfaceand aquifer water supply. The submission process has been completed. The Ministry has put this work on hold pending the outcomes from thework being done by the Land and Water Forum. The Land and Water Forum report on limits has been released to the Government but as yet nofinal position has been adopted.Auckland Plan.The Auckland Council was required by legislation to prepare a spatial plan (called the Auckland Plan) to set the strategic direction of the growthand development of the Auckland Region for the next 30 years. <strong>Watercare</strong> made a comprehensive written and oral submission the Plan, andworked <strong>with</strong> Council to address issues related to the provision of water supply and wastewater infrastructure in Auckland. The Plan was formallylaunched in March 2012.Auckland Council Unitary Plan.The Auckland Council is currently preparing a new Unitary Plan that will replace the existing Regional Policy Statement, four regional plans, andseven district plans. Council is planning to publicly notify this plan at the end of 2013. <strong>Watercare</strong> has been actively working <strong>with</strong> and providingfeedback on the development of objectives, policies and rules across the wide range of issues that affect <strong>Watercare</strong>’s core activities.PAGE 40 2012 financial reportReturn to contents page
<strong>Watercare</strong> Services Limited2012 ANNUAL REPORTFigure 35Rain Forest Express passengers and tripsYear ending 30 June 2002 2003 2005 2006 2007 2008 2009 2010 2011 2012Total passengers 17,497 9,515 10,850 9,244 14,623 13,037 11,435 12,318 19,287 14,372School trips 76 36 25 21 49 47 40 38 67 24Charter trips 124 61 92 68 84 81 80 79 90 79Scheduled trips 179 104 170 129 178 158 161 185 286 242Total trips 379 201 287 218 311 286 281 302 440 345Note:The Rain Forest Express runs on a six-kilometre tram line in the Waitakere Ranges. It is still used for the maintenance of the Upper Nihotupu Dam. It is a communityasset offering the public an opportunity to see a supply dam, tunnels, glow worms, cave weta and natural flora. The Rain Forest Express is available for schoolgroups and community use.Figure 36Adopt A Stream pupil numbers8,0007,0006,000Number of pupils5,0004,0003,000School term 2School term 1School term 42,0001,000School term 302007/08 2008/09 2009/10 2010/11 2011/12Note:Adopt A Stream is a practical environmental education resource to help students learn about water and the health of their local stream. It is free for schools in theAuckland Council region. The annual information covers the period from 1 July to 30 June, i.e. from term 3 to term 2.Return to contents page2012 financial report PAGE 41
<strong>Watercare</strong> Services Limited2012 ANNUAL REPORTFigure 37<strong>Watercare</strong>’s greenhouse gas emissionsYear ending 30 June 1990 2005 2006 2007 2008 2009 2010 2011 2012Scope 1: Emissions from fossil fuels, nitrogen compounds and methane releases: (non-renewable)Methane and nitrous oxide gas emissions from wastewater networks and treatment plantsMangere 105,790 12,590 12,317 11,278 11,690 12,843 14,382 14,166 12,199Rosedale 24,465 2,418 2,467 2,518 2,569 2,622 2,675 2,730 673Army Bay 678 683 696 711 725 740 755 771 779Orewa 588 0 0 0 0 0 0 0 0Waiwera 19 23 23 24 24 25 25 26 26Wellsford/Te Hana 131 157 160 164 167 170 174 177 177Warkworth 172 115 117 119 122 124 127 129 119Snells/Algies 171 206 210 214 219 223 228 232 232Omaha 35 42 43 44 45 46 47 48 82Matakana 26 31 31 32 33 33 34 35 35Helensville 180 217 221 225 230 235 240 244 245Huapai 10 12 12 13 13 13 14 14 19Denehurst 0 0 0 0 13 13 14 14 14Owhanake 0 1 1 1 1 1 1 1 3Kawakawa bay 20Beachlands 120 88 89 91 93 95 97 99 110Kingseat 6 5 5 5 5 5 6 6 6Clarks Beach 80 96 98 100 102 104 106 108 112Waiuku 376 452 461 471 480 490 500 510 454Pukekohe/Tuakau 751 901 920 939 958 977 997 1,018 892Bombay 4 4 4 4 4 4 4 4 3Motor vehicles owned by <strong>Watercare</strong> (6) 300 120 120 120 120 565 580 630 591Total for Scope 1 133,903 18,159 17,997 17,072 17,613 13,450 14,961 20,961 16,791Scope 2: Greenhouse gas from energy imports and exportsFrom hydro-generators (8)From generators at wastewatertreatment plant (8)Energy imports (7)Water 2,000 6,150 6,230 197 81 4,067 3,446Wastewater 3,000 9,270 9,140 487 171 9,583 9,534Business premises 400 460 450 324 304Total for Scope 2 5,400 15,880 15,820 560 580 684 253 13,974 13,284Total for Scope 1 and 2 139,303 34,038 33,817 17,631 18,193 14,133 15,214 34,935 30,075Scope 3: Greenhouse gas from business travel, suppliers and construction <strong>material</strong>sAir travel 50 100 90 70 80 61 51 24 28Motor vehicles used by <strong>Watercare</strong> but not 10 40 70 90 100 100 68 40 41owned by <strong>Watercare</strong>Waste 13 13 10 11 12 12 12 12Transmission and distribution linelosses for purchased electricityTotal for Scope 3 60 153 173 170 191 173 131 76 81Net total for Scope 1, 2 and 3 (8) 139,363 34,191 33,990 17,802 18,384 14,306 15,344 35,012 30,156Notes:1. <strong>Watercare</strong> has undergone a rigorous assessment of its greenhouse gas measurements, analysis and assumptions. It has recalculated its historical and currentemissions more conservatively and comprehensively. This has resulted in additional emissions sources being identified and some of the 1990 numbersbeing reduced.2. Oxidisation pond emissions have been recalculated using IPCC recommendations.3. Biosolids are used in land rehabilitation. It is assumed that the remaining organic compounds decompose over 30 years and that only a fraction of thepotential methane is emitted due to bacterial and chemical processes <strong>with</strong>in the landfill. The number is reported from field measurements.4. Nitrous oxide contribution is estimated using 50 per cent of the IPCC 2006 recommendations.5. New engines run on natural gas/biogas instead of diesel.6. Motor vehicles owned by <strong>Watercare</strong> excludes staff travelling on company business in their own vehicles (see Scope 3).7. Electricity use has been assumed to produce 0.23 kilograms of carbon dioxide per kilowatt hour except for 2003/04 when 0.18 was used.8. <strong>Watercare</strong> has not counted a credit for the 62,000 tonnes of carbon sink from the 14,600ha of native bush and exotic forests <strong>with</strong>in the Hunua and Waitakereranges water supply catchments area (mostly owned by Auckland Council).PAGE 42 2012 financial reportReturn to contents page
<strong>Watercare</strong> Services Limited2012 ANNUAL REPORTFigure 38Initiatives to reduce greenhouse gas emissionsInitiativeCO 2equivalent per annum (tonnes)Estimated reductionthat has beenachieved from 1990Decommissioning of oxidation ponds 34,049Further reductionthat couldbe achievedConstruction of further hydro generators 600 200Use of hybrid cars in vehicle fleet 100 100Reduction of nitrogen discharged at wastewater treatment plant 3,016 500Minimisation of biosolids to rehabilitation site 21,237Removal of sludge lagoons 59,791Maximising methane collection at wastewater treatment plant 720Minimise fugitive emissions at wastewater treatment plant 8,300Total for <strong>Watercare</strong> 118,793 9,820Note:Under the G3 reporting framework <strong>Watercare</strong> is required to provide information on G3 environment indicator EN18, relating to emissions, effluents and waste.This additional information has been included to meet G3 criteria.Figure 39Sources of emissions0.3%44.1%55.7%Gases from wastewater processesEnergyTravelNote:This table summarises the source of <strong>Watercare</strong>’s greenhouse gas emissions.Return to contents page2012 financial report PAGE 43
<strong>Watercare</strong> Services Limited2012 ANNUAL REPORTFigure 40<strong>Watercare</strong>’s ecological footprint403534.830Hectares (‘000s)252015108.5 8.58.77.554.4 4.53.5 3.801990 2005 2006 2007 2008 2009 2010 2011 2012Note:An ecological footprint helps gauge progress towards sustainability. It calculates the equivalent land area coverage in hectares required to absorb thegreenhouse gas emissions for the year from Scope 1 and 2 emissions. The reduction from 1990 was due to decommissioning the oxidation ponds at thewastewater treatment plants.1990 is the baseline year referenced by the Kyoto agreement.The 1990 and 2012 figures include estimated emissions for all facilities now controlled by <strong>Watercare</strong>.The 2011 figure was relatively high due to <strong>Watercare</strong> taking on legacy council assets and emissions at integration.Figure 41Internal energy usageEnergy Summary for 2010/11 MWh %Produced by water supply (hydro) 5,976 4.1Produced by wastewater treatment (biogas) – Mangere 32,178 22.3Produced by wastewater treatment (biogas) – Rosedale 6,138 4.3Internally sourced energy 44,292 30.7Total Energy Consumed 144,291 100.0Energy produced internally as % of total energy consumed 31%Note:1MWh = 1,000kWh which is a measure of energy used.PAGE 44 2012 financial reportReturn to contents page
<strong>Watercare</strong> Services Limited2012 ANNUAL REPORTFigure 42Recycling in general waste7060Percentage504030Recyclable andcompostable <strong>material</strong>in waste streamPotentiallysubstitutable <strong>material</strong>in waste stream20Residual wasteto landfill1001 2 3 4 5 6 7 8 9 10 11 12 13 14 15 16 17Audit numberNote:As part of our Zero Waste commitment, <strong>Watercare</strong> aims to divert all waste streams away from disposal to landfills. The initial target is to remove all Recyclable andCompostable <strong>material</strong> from the waste stream. When this program started in 2003, these accounted for 62% of <strong>Watercare</strong>s waste, but are now 30% of our waste.The above are the results of audits designed to identify <strong>material</strong>s that can be diverted from landfill through the establishment of recovery systems and thesubstitution of <strong>material</strong>s.The audits were begun in 2003 and have been undertaken every six months or so.Return to contents page2012 financial report PAGE 45
<strong>Watercare</strong> Services Limited2012 ANNUAL REPORTFigure 43Mangere WWTP biosolids arsenic levels3530mg/kg (dry weight of biosolids)25201510Grade B maximumconcentrationGrade A maximumconcentrationDoH limitArsenic concentration5007/07/1107/07/1007/07/0907/07/0807/07/0707/07/0607/07/0507/07/0407/07/0307/07/0207/07/0107/07/0007/07/99Mangere WWTP biosolids chromium levels1,6001,400mg/kg (dry weight of biosolids)1,2001,000800600400Grade B maximumconcentrationGrade A maximumconcentrationDoH limitChromium concentration200011/03/1211/03/1111/03/1011/03/0911/03/0811/03/0711/03/0611/03/0511/03/0411/03/0311/03/0211/03/0111/03/0011/03/9911/03/98Mangere WWTP biosolids lead levels700600mg/kg (dry weight of biosolids)500400300200Grade A and B maximumconcentrationDoH limitLead concentration100007/07/1107/07/1007/07/0907/07/0807/07/0707/07/0607/07/0507/07/0407/07/0307/07/0207/07/0107/07/0007/07/99PAGE 46 2012 financial reportReturn to contents page
<strong>Watercare</strong> Services Limited2012 ANNUAL REPORTFigure 43 (CONTINUED)Mangere WWTP biosolids cadmium levels1614mg/kg (dry weight of biosolids)1210864Grade B maximumconcentrationGrade A maximumconcentrationDoH limitCadmium concentration2007/07/1107/07/1007/07/0907/07/0807/07/0707/07/0607/07/0507/07/0407/07/0307/07/0207/07/0107/07/0007/07/99Mangere WWTP biosolids copper levels1,4001,200mg/kg (dry weight of biosolids)1,000800600400Grade B maximumconcentrationGrade A maximumconcentrationDoH limitCopper concentration2000 03/06/9803/06/1203/06/1103/06/1003/06/0903/06/0803/06/0703/06/0603/06/0503/06/0403/06/0303/06/0203/06/0103/06/0003/06/99Mangere WWTP biosolids mercury levels12.010.0mg/kg (dry weight of biosolids)8.06.04.0Grade B maximumconcentrationGrade A maximumconcentrationDoH limitMercury concentration2.0007/07/1107/07/1007/07/0907/07/0807/07/0707/07/0607/07/0507/07/0407/07/0307/07/0207/07/0107/07/0007/07/99Return to contents page2012 financial report PAGE 47
<strong>Watercare</strong> Services Limited2012 ANNUAL REPORTFigure 43 (CONTINUED)Mangere WWTP biosolids nickel levels250mg/kg (dry weight of biosolids)20015010050Grade B maximumconcentrationGrade A maximumconcentrationDoH limitNickel concentration007/07/1107/07/1007/07/0907/07/0807/07/0707/07/0607/07/0507/07/0407/07/0307/07/0207/07/0107/07/0007/07/99Mangere WWTP biosolids zinc levels3,5003,000mg/kg (dry weight of biosolids)2,5002,0001,5001,000Grade B maximumconcentrationGrade A maximumconcentrationDoH limitZinc concentration500001/07/1101/07/1001/07/0901/07/0801/07/0701/07/0601/07/0501/07/0401/07/0301/07/0201/07/0101/07/0001/07/9901/07/98Note:<strong>Watercare</strong>’s largest discharge to land is the biosolids generated as a byproduct of the wastewater treatment process. A significant proportion of metals andpathogens are removed <strong>with</strong> the solids. Approximately 107,000 tonnes of biosolids were produced at the Mangere Wastewater Treatment Plant in the 2011/12year. The graphs show the metal levels in the biosolids at the Mangere Watewater Treatment Plant. The levels have trended downward over time. Arsenic,cadmium, chromium and zinc have decreased over the last year after an increasing trend immediately prior. Arsenic, chromium, and lead has remained <strong>with</strong>in theGrade ‘a’ limit over the past year, while cadmium copper, mercury and nickel have remained mostly <strong>with</strong>in Grade ‘a’ limits for the past year. Zinc levels over thepast year have remained <strong>with</strong>in the Grade ‘b’ limit and at times <strong>with</strong>in the Grade ‘a’ limit. Zinc levels are related to contaminants in stormwater run-off to sewer asa result of the combined sewer system. In general there has been a decline in all metals over the past year compared to previous years.The Department of Health (DoH) limit is the previous DoH guideline limit for the safe beneficial use of biosolids on land. In August 2003 these were replacedby national guidelines for beneficial reuse of biosolids that grade biosolids for unrestricted use (grade ‘a’) or restricted use (grade ‘b’) depending on theircontamination loads.The limits are significant as <strong>Watercare</strong> is looking to find a beneficial use for biosolids, one option being a forest soil conditioner. The limits proposed in theAuckland Regional Council Air, Land and Water Plan, which were scheduled to come into effect from 2012, are also shown.PAGE 48 2012 financial reportReturn to contents page
<strong>Watercare</strong> Services Limited2012 ANNUAL REPORTFigure 43 (CONTINUED)Rosedale WWTP sludge arsenic levels8070mg/kg (dry weight of sludge)6050403020Grade B maximumconcentrationGrade A maximumconcentrationArsenic concentration10027/02/9827/02/9927/02/0027/02/0127/02/0227/02/0327/02/0427/02/0527/02/0627/02/0727/02/0827/02/0927/02/1027/02/1127/02/12Rosedale WWTP sludge chromium levels1,6001,400mg/kg (dry weight of sludge)1,2001,000800600400Grade B maximumconcentrationGrade A maximumconcentrationChromium concentration200027/02/1227/02/1127/02/1027/02/0927/02/0827/02/0727/02/0627/02/0527/02/0427/02/0327/02/0227/02/0127/02/0027/02/9927/02/98Rosedale WWTP sludge lead levels350300mg/kg (dry weight of sludge)250200150100Grade A and B maximumconcentrationLead concentration50027/02/1227/02/1127/02/1027/02/0927/02/0827/02/0727/02/0627/02/0527/02/0427/02/0327/02/0227/02/0127/02/0027/02/9927/02/98Return to contents page2012 financial report PAGE 49
<strong>Watercare</strong> Services Limited2012 ANNUAL REPORTFigure 43 (CONTINUED)Rosedale WWTP sludge cadmium levels1210mg/kg (dry weight of sludge)864Grade B maximumconcentrationGrade A maximumconcentrationCadmuim concentration2027/02/1227/02/1127/02/1027/02/0927/02/0827/02/0727/02/0627/02/0527/02/0427/02/0327/02/0227/02/0127/02/0027/02/9927/02/98Rosedale WWTP sludge copper levels1,4001,200mg/kg (dry weight of sludge)1,000800600400200Grade B maximumconcentrationGrade A maximumconcentrationCopper concentration027/02/1227/02/1127/02/1027/02/0927/02/0827/02/0727/02/0627/02/0527/02/0427/02/0327/02/0227/02/0127/02/0027/02/9927/02/98Rosedale WWTP sludge mercury levels98mg/kg (dry weight of sludge)765432Grade B maximumconcentrationGrade A maximumconcentrationMercury concentration1021/04/9821/04/9921/04/0021/04/0121/04/0221/04/0321/04/0421/04/0521/04/0621/04/0721/04/0821/04/0921/04/1021/04/1121/04/12PAGE 50 2012 financial reportReturn to contents page
<strong>Watercare</strong> Services Limited2012 ANNUAL REPORTFigure 43 (CONTINUED)Rosedale WWTP sludge nickel levels300250mg/kg (dry weight of sludge)200150100Grade B maximumconcentrationGrade A maximumconcentrationNickel concentration50027/02/1227/02/1127/02/1027/02/0927/02/0827/02/0727/02/0627/02/0527/02/0427/02/0327/02/0227/02/0127/02/0027/02/9927/02/98Rosedale WWTP sludge zinc levels1,8001,600mg/kg (dry weight of sludge)1,4001,2001,000800600400Grade B maximumconcentrationGrade A maximumconcentrationZinc concentration200027/02/9827/02/9927/02/0027/02/0127/02/0227/02/0327/02/0427/02/0527/02/0627/02/0727/02/0827/02/0927/02/1027/02/1127/02/12Note:Approximately 14,794 tonnes of dewatered sludge were produced at the Rosedale Wastewater Treatment Plant in the 2011/12 year. The graphs show the metallevels in the dewatered sludge at the Rosedale Wastewater Treatment Plant. Levels of all metals show a downward trend over time.National guidelines for beneficial reuse of biosolids that grade biosolids for unrestricted use (grade ‘a’) or restricted use (grade ‘b’) depending on theircontamination loads have been included.Return to contents page2012 financial report PAGE 51
<strong>Watercare</strong> Services Limited2012 ANNUAL REPORTFigure 43 (CONTINUED)Army Bay WWTP dewatered sludge arsenic levels3530mg/kg (dry weight of sludge)25201510Grade B maximumconcentrationGrade A maximumconcentrationArsenic concentration5001/05/1201/03/1201/01/1201/11/1101/09/1101/07/1101/05/1101/03/1101/01/1101/11/1001/09/1001/07/1001/05/1001/03/1001/01/10Army Bay WWTP dewatered sludge chromium levels1,6001,400mg/kg (dry weight of sludge)1,2001,000800600400Grade B maximumconcentrationGrade A maximumconcentrationChromium concentration200001/05/1201/03/1201/01/1201/11/1101/09/1101/07/1101/05/1101/03/1101/01/1101/11/1001/09/1001/07/1001/05/1001/03/1001/01/10Army Bay WWTP dewatered sludge lead levels350300mg/kg (dry weight of sludge)250200150100Grade A and B maximumconcentrationLead concentration50001/05/1201/03/1201/01/1201/11/1101/09/1101/07/1101/05/1101/03/1101/01/1101/11/1001/09/1001/07/1001/05/1001/03/1001/01/10PAGE 52 2012 financial reportReturn to contents page
<strong>Watercare</strong> Services Limited2012 ANNUAL REPORTFigure 43 (CONTINUED)Army Bay WWTP dewatered sludge cadmium levels1210mg/kg (dry weight of sludge)864Grade B maximumconcentrationGrade A maximumconcentrationCadmium concentration2001/05/1201/03/1201/01/1201/11/1101/09/1101/07/1101/05/1101/03/1101/01/1101/11/1001/09/1001/07/1001/05/1001/03/1001/01/10Army Bay WWTP dewatered sludge copper levels1,4001,2001,000mg/kg (dry weight of sludge)800600400200Grade B maximumconcentrationGrade A maximumconcentrationCopper concentration001/05/1201/03/1201/01/1201/11/1101/09/1101/07/1101/05/1101/03/1101/01/1101/11/1001/09/1001/07/1001/05/1001/03/1001/01/10Army Bay WWTP dewatered sludge mercury levels87mg/kg (dry weight of sludge)65432Grade B maximumconcentrationGrade A maximumconcentrationMercury concentration1001/01/1001/03/1001/05/1001/07/1001/09/1001/11/1001/01/1101/03/1101/05/1101/07/1101/09/1101/11/1101/01/1201/03/1201/05/12Return to contents page2012 financial report PAGE 53
<strong>Watercare</strong> Services Limited2012 ANNUAL REPORTFigure 43 (CONTINUED)Army Bay WWTP dewatered sludge nickel levels160140mg/kg (dry weight of sludge)120100806040Grade B maximumconcentrationGrade A maximumconcentrationNickel concentration20001/05/1201/03/1201/01/1201/11/1101/09/1101/07/1101/05/1101/03/1101/01/1101/11/1001/09/1001/07/1001/05/1001/03/1001/01/10Army Bay WWTP dewatered sludge zinc levels1,6001,400mg/kg (dry weight of sludge)1,2001,000800600400Grade B maximumconcentrationGrade A maximumconcentrationZinc concentration200001/01/1001/03/1001/05/1001/07/1001/09/1001/11/1001/01/1101/03/1101/05/1101/07/1101/09/1101/11/1101/01/1201/03/1201/05/12Note:Approximately 4,372 tonnes of dewatered sludge were produced at the Army Bay Wastewater Treatment Plant in the 2011/12 year. The graphs show the metallevels in the dewatered sludge at the Army Bay Wastewater Treatment Plant. All metals except zinc have remained <strong>with</strong>in the Grade ‘a’ levels over the year. A majorsource of zinc is related to contaminants in stormwater run-off to sewer. National guidelines for beneficial reuse of biosolids that grade biosolids for unrestricteduse (grade ‘a’) or restricted use (grade ‘b’) depending on their contamination loads have been included.PAGE 54 2012 financial reportReturn to contents page
<strong>Watercare</strong> Services Limited2012 ANNUAL REPORTFigure 43 (CONTINUED)Warkworth WWTP dewatered sludge arsenic levels3530mg/kg (dry weight of sludge)25201510Grade B maximumconcentrationGrade A maximumconcentrationArsenic concentration5001/01/1001/03/1001/05/1001/07/1001/09/1001/11/1001/01/1101/03/1101/05/1101/07/1101/09/1101/11/1101/01/1201/03/1201/05/12Warkworth WWTP dewatered sludge chromium levels1,6001,400mg/kg (dry weight of sludge)1,2001,000800600400Grade B maximumconcentrationGrade A maximumconcentrationChromium concentration200001/05/1201/03/1201/01/1201/11/1101/09/1101/07/1101/05/1101/03/1101/01/1101/11/1001/09/1001/07/1001/05/1001/03/1001/01/10Warkworth WWTP dewatered sludge lead levels350300mg/kg (dry weight of sludge)250200150100Grade A and B maximumconcentrationLead concentration50001/05/1201/03/1201/01/1201/11/1101/09/1101/07/1101/05/1101/03/1101/01/1101/11/1001/09/1001/07/1001/05/1001/03/1001/01/10Return to contents page2012 financial report PAGE 55
<strong>Watercare</strong> Services Limited2012 ANNUAL REPORTFigure 43 (CONTINUED)Warkworth WWTP dewatered sludge cadmium levels1210mg/kg (dry weight of sludge)864Grade B maximumconcentrationGrade A maximumconcentrationCadmium concentration2001/05/1201/03/1201/01/1201/11/1101/09/1101/07/1101/05/1101/03/1101/01/1101/11/1001/09/1001/07/1001/05/1001/03/1001/01/10Warkworth WWTP dewatered sludge copper levels1,4001,2001,000mg/kg (dry weight of sludge)800600400200Grade B maximumconcentrationGrade A maximumconcentrationCopper concentration001/05/1201/03/1201/01/1201/11/1101/09/1101/07/1101/05/1101/03/1101/01/1101/11/1001/09/1001/07/1001/05/1001/03/1001/01/10Warkworth WWTP dewatered sludge mercury levels87mg/kg (dry weight of sludge)65432Grade B maximumconcentrationGrade A maximumconcentrationMercury concentration1001/05/1201/03/1201/01/1201/11/1101/09/1101/07/1101/05/1101/03/1101/01/1101/11/1001/09/1001/07/1001/05/1001/03/1001/01/10PAGE 56 2012 financial reportReturn to contents page
<strong>Watercare</strong> Services Limited2012 ANNUAL REPORTFigure 43 (CONTINUED)Warkworth WWTP dewatered sludge nickel levels160140mg/kg (dry weight of sludge)120100806040Grade B maximumconcentrationGrade A maximumconcentrationNickel concentration20001/05/1201/03/1201/01/1201/11/1101/09/1101/07/1101/05/1101/03/1101/01/1101/11/1001/09/1001/07/1001/05/1001/03/1001/01/10Warkworth WWTP dewatered sludge zinc levels1,6001,400mg/kg (dry weight of sludge)1,2001,000800600400Grade B maximumconcentrationGrade A maximumconcentrationZinc concentration200001/05/1201/03/1201/01/1201/11/1101/09/1101/07/1101/05/1101/03/1101/01/1101/11/1001/09/1001/07/1001/05/1001/03/1001/01/10Note:Approximately 354 tonnes of dewatered sludge were produced at the Warkworth Wastewater Treatment Plant in the 2011/12 year. The graphs show the metallevels in the dewatered sludge at the Warkworth Wastewater Treatment Plant. All metals except mercury and zinc have remained <strong>with</strong>in the Grade ‘A’ levels overthe year. A major source of mercury is waste from dental practices. Dental practices in the Rodney area are required to have amalgam traps fitted and are routinelymonitored. A major source of zinc is related to contaminants in stormwater run-off to sewer. National guidelines for beneficial reuse of biosolids that gradebiosolids for unrestricted use (grade ‘a’) or restricted use (grade ‘b’) depending on their contamination loads have been included.Return to contents page2012 financial report PAGE 57
<strong>Watercare</strong> Services Limited2012 ANNUAL REPORTFigure 44Solids disposalOrigin Strategy 2006/07 2007/08 2008/09 2009/10 2010/11Water treatment sludge (m 3 )Total2011/12Ardmore Onsite 3,315 3,095 3,820 2,895 4,860 5,940Huia Parau landfill 4,160 3,430 3,495 3,960 4,150 4,710Waitakere Onsite 220 776 688 515 646 376Waikato Commercial landfill 1,938 1,130 1,537 1,840 1,575 1,196Total 9,633 8,431 9,540 9,210 11,231 12,222Wastewater treatment plant (tonnes)Mangere Biosolids* (wet) Pond 2 rehabilitation 109,363 105,993 106,944 108,329 100,001 115,628Mangere Grit (wet) Commercial landfill 1,899 2,254 2,158 2,246 2,156 2,016Mangere Screenings (wet) Commercial landfill 2,028 1,920 1,493 1,414 1,302 1,391Rosedale Biosolids (wet) Commercial landfill 15,424 14,794Rosedale Grit Commercial landfill 141 190Rosedale Screenings Commercial landfill 245 247Pukekohe Screenings and Grit Commercial landfill 100 44Army Bay Biosolids Commercial landfill 3,701 4,382Army Bay Grit Commercial landfill NA 55Army Bay Screenings Commercial landfill NA 21Beachlands Biosolids Held on site 300 300Beachlands Screenings Commercial landfill 13 13Beachlands Grit Commercial landfill 1 1Warkworth Biosolids Commercial landfill 322 354Warkworth Screenings Commercial landfill 21 8TOTAL 113,290 110,167 110,595 111,989 123,727 151,666* Assuming 28% solids contentNote:This table summarises the amount and disposal methodology of the sludge and grit recovered by <strong>Watercare</strong> at its treatment plants.The screenings includes the fat balls gathered during the cleaning of primary tanks.Figure 45Weight of hazardous substances in wasteBiosolids (dry weight) 34,102 tonnesSubstanceConcentration(mg/kg)Disposed weight(tonnes)Arsenic 5.56 0.19Cadmium 1.46 0.05Chromium 265.70 9.06Lead 39.42 1.34Mercury 0.74 0.03Note:Under the G3 reporting framework <strong>Watercare</strong> is required to provide information on G3 environment indicator EN24 relating to emissions, effluent and waste. Thesubstances outlined in the table are found in biosolids, of which 34,102 dry tonnes were produced. Trace levels of these substances are also found in dischargedeffluent however the concentrations are well below maximum values allowed for in drinking water. No other hazardous wastes as defined by the Basel Conventionare disposed of by <strong>Watercare</strong>. No waste is shipped internationally.PAGE 58 2012 financial reportReturn to contents page
<strong>Watercare</strong> Services Limited2012 ANNUAL REPORTFigure 46Protected areas of high ecological valueName Restored Location Operation Area Attributes ProtectionBycroft N/A<strong>Watercare</strong> provides a ApproximatelyWetland,constant discharge to the one hectare.Onehungawetland to maintain it.HunuaRangesWaitakereRangesMangereCoastalWalkwayN/AN/AYesIn Onehungawhere theaquifernaturallydischarges.Located southof Auckland.Locatednorth west ofAuckland.Located alongthe coastadjacent tothe MangereWastewaterTreatment Plant.Contains the water supplycatchments for five of<strong>Watercare</strong>'s dams.Contains the water supplycatchments for five of<strong>Watercare</strong>'s dams.13 km of coastal walkwayand native plantingsprovided for andmaintained by <strong>Watercare</strong>.Approximately10,500hectares, mostlyin native bush.Approximately5,000 hectaresin native bush.Approximately13 km ofwalkway andassociatedplantingbetween 10 to100 m in width.Home of rare andendangered mossspecies, indigenousvegetation andwildlife.Native bush andwildlife habitat.Native bush andwildlife habitat.Provision of publicwalkways, birdroosts and nativeand marine habitat.Protectedunder thelocal authoritydistrict plan.Predominantlyprotectedby leaseagreement <strong>with</strong>the AucklandRegionalCouncil.Protectedby leaseagreement<strong>with</strong> AucklandCouncil.Owned by<strong>Watercare</strong> andrequired as acondition forthe operation ofthe wastewatertreatment plant.Future plansand StrategiesMaintain constant flowof water from <strong>Watercare</strong>facility.Monitoring equipmentinstalled downstreamwhich allows <strong>Watercare</strong>to monitor stream levelsand release water whenrequired. Trap and haulof fish where passes arenot possible.Allow for continuouswater flow from dams tostreams. Trap and haulof fish where passes arenot possible.Maintenance of birdroosts and continuedrestoration of harbourenvironment.OruarangiCreekWaikatoRiverCareAucklandVolcanicConesPukekoheWastewaterTreatmentPlantPuketutuIslandYesN/AN/AN/ATo berestoredLocated alongthe coastadjacent tothe MangereWastewaterTreatment Plant.Along the banksof the WaikatoRiver.<strong>Watercare</strong> haswater reservoirson or in eightvolcanic conesdistributedaround theAuckland urbanarea.Adjacent toWaikato Riverat PukekoheWastewaterTreatment PlantManukauHarbouradjacent tothe MangereWastewaterTreatment Plant.Estuary previouslyclosed to the sea bythe oxidation pondsrestored to tidal influences.4 km of esplanade reservehas been planted by<strong>Watercare</strong> this last year.<strong>Watercare</strong> financialmember of a trust thatundertakes the planting.These reservoirs are anessential part of the waterdistribution system andwere built about 80 to100 years ago. In manycases their presence hasprevented the quarryingof the cones, ensuringthe preservation of thecones until protection wasgiven to them by localauthorities in more recenttimes.Is maintained by flow oftreated effluentPlan to rehabilitate the oldquarry area and establishmost of the island aspublic parklandApproximately30 hectares.120 km of riverbank <strong>with</strong> targetof planting fourkilometres perannum.Each volcaniccone is setin parkland,<strong>with</strong> thelargest beingapproximately120 hectares inarea. The conesare typically100 to 150meters abovethe adjacenturban area.Marine estuarineecosystems beingrestored.Riparian plantingof along theWaikato River toenhance river waterquality and createecological diversity.The cones are parksand heritage areasand are a definingfeature of Auckland.However many ofthe cones not usedfor reservoirs havebeen quarried awayfor aggregate.9 hectares Home of birdlife asan extension of theadjacent wetlandowned by Fish andGame110 hectares Historically used forpastoral agricultureand as basalt quarry.Owned by<strong>Watercare</strong> andrequired as acondition forthe operation ofthe wastewatertreatment plant.Plantingsprotected bycovenants andagreements<strong>with</strong>landowners.The cones areprotected bylocal authoritydistrict plansand the HistoricPlaces Trust.Owned by<strong>Watercare</strong>. Inpart protectedby WildlifeRefuge status.Wahi tapuprotection,deemed tobe of culturalsignificance.Continued restorationof the marineenvironment.<strong>Watercare</strong> iscontinuing to takean ongoing interestin the appropriatemanagement ofthe Waikato Rivercatchment.<strong>Watercare</strong> is working<strong>with</strong> stakeholdersinterested in the cones<strong>with</strong> a view to enhancethe values of the coneswhile protecting itswater supply assets.Unused ponds to berehabilitated. Lost wildlifehabitat to be provided inoperational wetland area.Former quarry onthe island will berehabilitated <strong>with</strong>biosolids and the islandwill be progressivelyconverted to parkland.Note:Under the G3 reporting framework <strong>Watercare</strong> is required to provide information on G3 environment indicators EN11, EN13 and EN14, relating to biodiversity.Return to contents page2012 financial report PAGE 59
<strong>Watercare</strong> Services Limited2012 ANNUAL REPORTFigure 47Significant biodiversity impactsLocation / Impact Nature EffectWater catchments Protected as part of the regional parks. The bush catchments are regenerating native bush andprovide an environment for native birds and other fauna.Dams and lakesEffluent discharge from MetropolitonWastewater Treatment PlantsBird roosts along the MangereCoastal WalkwayThe construction of the dams may limit fishpassage up and downstream and reduces streamflows. Minimum flows are released from somedams to maintain the downstream minimum flow.<strong>Watercare</strong> undertakes significant modelling ofdownstream environments to monitor the qualityand health of these environments.The Mangere and Rosedale plants have beenrecently upgraded which has significantlyimproved the quality of the discharge to theManukau Harbour and the Hauraki Gulf.Bird roosts have been constructed as part of theMangere Wastewater Treatment Plant upgrade.Isolated fish communities have developed behind thedams. Provision of fish passages will open these areasto normal migration of fish, although at some reservoirs<strong>Watercare</strong> is protecting established fish communities bypreventing upstream fish transfer.At Mangere <strong>with</strong> the plant upgraded – which included theremoval of 500 hectares of oxidation ponds and sludgelagoons – the harbour is restoring itself and there arenow an increasing number and biodiversity of organismsand species. The improved quality of effluent and thenew outfall at Rosedale has resulted in enhancing themarine environment adjacent to the outfall.The provision of roost habitats has encouraged theroosting of migratory and rare birds such as dotterels,godwit and wrybill.Note:Under the G3 reporting framework <strong>Watercare</strong> is required to provide information on G3 environment indicator EN12, relating to biodiversity.Figure 48Midge and odour complaintsAnnual report data – Wastewater treatment plants 2011/2012ComplaintsWastewater treatment plant Midge Odour NoiseMetroNon MetroMangere 2 2 0Rosedale 0 0 0Army Bay 0 0 0Sub total – metro WWTPs 2 2 0Pukekohe 0 0 0Warkworth 0 0 1Omaha 1 0 1Helensville 0 0 0Wellsford 0 0 0Snells/Algies 0 0 0Waiwera 0 1 0Huapai/Kumeu 0 0 0Matakana 0 0 0Denehurst Drive 0 0 0Beachlands 0 1 0Owhanake 0 0 0Clarks Beach 0 0 0Waiuku 0 0 0Kingseat 0 0 0Bombay 0 0 0Sub total – non metro WWTPs 1 2 2TOTAL 3 4 2PAGE 60 2012 financial reportReturn to contents page
<strong>Watercare</strong> Services Limited2012 ANNUAL REPORTFigure 49Trade waste customersCustomer status 2005/06 2006/07 2007/08 2008/09 2009/10 2010/11 2011/12Customers at beginning of year 635 612 605 605 601 579 1,750New customers during the year 35 38 51 47 43 1,232 81Variations issued and re-applications processedduring the year113 100 90 103 127 234 289Closures during the year 58 45 51 51 65 71 177Customers at end of year 612 605 605 601 579 1,740 1,654Note:The trade waste customer base was increased by 1,147 in 2010/2011 as a result of integration of the Rodney, North Shore and Franklin areas <strong>with</strong> <strong>Watercare</strong>’sexisting trade waste customer base. A review of customer numbers has led to an adjustment for the start of 2011/2012 from 1,740 to 1,750. Trade wastecustomer numbers have declined by 96 over the last year. The decline is the result of the closure of smaller businesses particularly in the retail food area i.e. cafesand restaurants. Substances are controlled to protect the health and safety of workers, protect the wastewater assets, ensure that treatment processes are notadversely affected and to ensure that <strong>Watercare</strong> can comply <strong>with</strong> the limits set in its consents. Customers are charged on the basis of the volume or flow theydischarge to the sewer, the waste characteristics including the biochemical oxygen demand (BOD) or chemical oxygen demand (COD), and the concentration ofsuspended solids in the discharge. The charges are designed to recover costs for collection, treatment and disposal of these trade wastes.Figure 50Trade waste sampling programme2009/10 2010/11 2011/12SamplingprogrammeNumberof testsNumber oftests out ofcompliance%Compliance*Numberof testsNumber oftests out ofcompliance%Compliance*Number oftestsNumber oftests out ofcompliance%Compliance*Compliance 10,736 221 98 9,621 252 97 8,768 232 97monitoringSelf-monitoring 3,193 70 98 2,902 81 97 2,998 121 96Catchment2 4 3investigationsWastewater1,632 1,560 1,549treatment plantinfluentTotals 15,563 291 14,087 333 13,318 353Note:* Indicates the percentage of tests undertaken which were in compliance. Following integration in 2010/2011 figures include information from the Rodney, NorthShore and Franklin areas in addition to the Auckland area. The significant rise in the number of tests recorded from 2009/10 is a result of a change in recordingpractices. Organic tests that form part of a suite of tests are now recorded on an individual basis rather than on a suite basis. The results show good levels ofcompliance have been maintained. The number of results undertaken for 2011/2012 has decreased in line <strong>with</strong> a drop in customer numbers.Return to contents page2012 financial report PAGE 61
<strong>Watercare</strong> Services Limited2012 ANNUAL REPORTFigure 51Key trade waste substances2005/06 2006/07 2007/08 2008/09 2009/10 2010/11 2011/12SubstanceTotalapprovedmass kg/dayConsentsissuedTotalapprovedmass kg/dayConsentsissuedTotalapprovedmass kg/dayConsentsissuedTotalapprovedmass kg/dayConsentsissuedTotalapprovedmass kg/dayConsentsissuedTotalapprovedmass kg/dayConsentsissuedTotalapprovedmass kg/dayConsentsissuedArsenic 1 34 1.6 36 1.6 35 1.3 38 1.0 37 1.0 35 0.7 26Boron 51.8 74 46.2 74 44.0 72 40.2 72 35.3 63 31.6 53 29.1 46Cadmium 0.2 36 1.0 40 1.1 38 1.2 42 0.5 40 0.4 36 0.2 28Chromium Total 32.4 89 29.3 83 31.9 106 21.1 57 22.9 103 21.2 91 18.3 80Chromium 6 3.5 77 4.4 70 4.1 69 2.9 43 3.9 67 4.0 62 2.5 53Cobalt 1.2 32 2.5 33 2.5 30 2.4 29 1.9 29 1.8 28 0.6 22Copper 8.4 108 12.1 105 12.4 107 11.4 106 7.9 98 7.7 95 5.5 81Lead 2.9 61 6.6 60 5.7 62 4.9 61 2.8 56 2.7 54 1.6 47Manganese 44.3 37 44.3 39 44.4 41 44.6 45 64.4 43 64.0 40 62.1 37Molybdenum 2.7 37 3.7 37 3.1 34 3.2 34 2.7 27 2.4 23 1.1 22Nickel 5.7 80 7.8 81 8.1 83 7.3 85 4.6 75 4.4 74 3.7 62Silver 1 34 2.0 31 1.9 28 1.8 23 1.7 22 1.5 23 0.3 47Zinc 15 115 18.8 115 19.0 110 17.7 111 14.3 97 17.1 93 13.7 83Total 170.1 814.0 180.3 804.0 179.7 815.0 160.0 746.0 163.9 757.0 159.8 707.0 139.4 634.0Note:<strong>Watercare</strong> controls the entry of substances which could harm the health and safety of workers, the wastewater collection system, treatment plant processes and the environment by issuing trade waste consentsthat limit the discharge of toxic substances. The table shows the amounts of metals consented for discharge from trade waste sites by mass. The table includes data from Rodney and Franklin but not North Shore ashistorically mass limits in the North Shore have been contained in the North Shore Trade Waste bylaw and not individual consents. Contribution from the Rodney and Franklin areas is very small and the number ofconsented sites discharging substances controlled by mass has decreased as has the total mass consented for discharge. It should be noted that totals are presented for indicative year on year trends only as masses ofindividual substances depends on their density and some consents issued may contain one key substance while others a number of the key substances.PAGE 62 2012 financial reportReturn to contents page
<strong>Watercare</strong> Services Limited2012 ANNUAL REPORTFigure 52Materials and chemicals (tonnes unless shown otherwise)Water treatment 2005/06 2006/07 2007/08 2008/09 2009/10 2010/11 2011/12 Purpose Fate %RecycledAlum (liquid) 5,023 4,629 3,504 3,608 4,216 5225 4956 To assist coagulation Taken up in sludge 0%Lime (powder) 1,329 1,303 999 1,416 5,750 1510 1442 To control pH Taken up in sludge 0%Fluoride (solution) 718 674 517 543 749.8 769 728 To prevent dental cavities In treated water 0%Salt (powder) 748 749 267 86 100 105 95For chlorine productionfor water disinfectionIn treated water 0%Caustic soda (solution) 156 115 90 66.5 23.53 105 100 pH buffering In treated water 0%Chlorine (gas) 36 31 79 182 184 160 175 To disinfect water In treated water 0%Poly aluminiumchloride (solution)Polyelectrolyte(powder)76 43 38 42 43.2 58 47To assist in clarificationand coagulation20 19 12.5 20 353.5 21 22To assist in clarificationand coagulationCarbon dioxide (gas) 312 399 294 384 294 228 239 To control pHCitric acid 25.3 21 22 20.1 18.3 26 29 Cleaning membranesSodium bisulphate 4.3 6.8 8.2 6.75 9.84 7 8De-chlorination of wastedwaterTaken up in sludge 0%Taken up in sludge 0%Dissolved in rawwaterNeutralised and indischarged waterIn dischargedwaterSodium hypochlorite 0.8 28 75 100.7 545.72 418 392 Disinfection In treated water 0%Activated carbon 9.9 13.5 43.4 22.4 25.5 0Wastewater treatment plantOrganics removal intreatmentTaken to landfill aspart of sludgeMethoprene 0.44 1.2 2.4 2.38 2 2.1 2.89 To control midgesBiodegrades ineffluent0%Naturalyte 5L 0 To control midgesBiodegrades ineffluent0%Agnique spray 0 0 17L 0 0 0 0 To control midgesEvaporates toatmosphere0%Insecticide 212L 200L 90L 203L 355L To control midges Biodegrades in soil 0%Liquid nitrogen 681m 3 1,900m 3 1,955m 3 1,266m 3 1,290m 3 6,300m 3 13,931m 3Weed spray (estimated) 400L 400L 400L 400L 400L 540L 500L To control weeds on sites Biodegrades in soil 0%Lime 6,060 6,551 6,308 5,714 5,857 5,560 7,017To stabilise andTo landfill <strong>with</strong> thedeodorise biosolids biosolids0%Coagulating polymer 444 425 414 409 390 449 394To promote solids To landfill <strong>with</strong> thedewateringbiosolids0%Sodium hypochlorite 267m 3 267m 3 348m 3 398m 3 398m 3 307m 3 342m 3 water for sprays and wash In effluent 0%To chlorinate recycleddowngases from pipes before To atmosphere 0%To remove explosivemaintenanceFerric chloride 1,700 1,748 1,468 1,075 1,079 1,245 1,382 To promote solids captureTo landfill <strong>with</strong> thebiosolids0%Caustic soda 0 0 0 0 0 50L 0 Assist digestion processTo landfill <strong>with</strong> thebiosolids0%Caustic Soda (solution) 184 0 For pH buffering In treated water 0%Soda ash 0 0 0 0 0 0 0 Assist digestion processTo landfill <strong>with</strong> thebiosolids0%Chlorine gas 42 31 28.5 25.7 37.7 56.84To control bacteria inreactor clarifiersIn effluent 0%Iron sponge granules 86 72 108 92 68 46To purify biogas beforeuse in enginesTo landfill 0%To strip ammonia fromSulphuric acid 70m 3 58m 3 36m 3 72m 3 75m 3 71m 3 odour scrubberIn effluent 0%Wastewater treatment plantLube oil 24m 3 32m 3 23m 3 27m 3 23m 3 To lubricate generatorsTo supplier'sreclamation plant0%Activated carbon 10 0 0 3 14To purify biogas beforeuse in enginesTo landfill 0%Alum (liquid) 46m 3 67m 3 To assist coagulationReturned to plantpond0%To assist in the biologicalMethanol 32m 3 26m 3 treatment of wastewaterNote:To landfill <strong>with</strong> thebiosolidsIncreases in sodium hypochlorite were due to the reservoir cleaning programme using divers which helps to maintain services, yet requires chlorinationbefore the reservoirs are de-isolated and returned to service. For 2010/11, the information includes all the <strong>material</strong>s and chemicals used at all plants nowintegrated into <strong>Watercare</strong>.Under the G3 reporting framework <strong>Watercare</strong> is required to provide information on G3 environment indicators EN1, EN2 and EN27 relating to <strong>material</strong>s andproducts and services. Under G3 reclaimed packaging is not reported on as it is not applicable to <strong>Watercare</strong>.0%0%0%0%0%Return to contents page2012 financial report PAGE 63
<strong>Watercare</strong> Services Limited2012 ANNUAL REPORTFigure 53Capital expenditure programmesWater2011/12 expenditure Future expenditure(next five year period)($ million) ($ million)Raw water network rehabilitation/replacement 0.96 22.62Raw water network improvement 0.33 0.62Energy and Control systems rehabilitation/replacement 0.44 11.26Energy and Control systems improvement 0.68 2.75Energy and Control systems expansion - 0.35Dam rehabilitation 3.18 27.57Water sources improvement 0.14 0.68Regulatory compliance – Water treatment plant 0.30 0.56Water treatment plant rehabilitation/replacement 8.16 22.67Water treatment plant improvement 7.90 91.78Water treatment plant expansion 26.77 32.00Regulatory compliance – Treated water - 0.35Treated water network rehabilitation/replacement 25.77 124.71Treated water network improvement 2.28 46.19Treated water network expansion 20.95 232.59Hunua no.4 water supply scheme 19.36 239.43CBD storage - 22.15Water Demolition 0.99 3.41Water total 118.21 881.69WastewaterEnergy and Control systems rehabilitation/replacement 0.12 6.97Energy and Control systems improvement -0.20 3.75Energy and Control systems expansion - 3.33Collection system replacement 13.10 63.12Collection system improvement 2.82 82.74Collection system expansion 56.21 148.52Regulatory compliance – Collection 0.97 1.67Project Hobson - 35.50Project Waitemata 5.69 27.00Trade Waste 0.04 0.70Regulatory compliance – Wastewater treatment plant - 0.62Wastewater treatment plant rehabilitation/replacement 7.20 33.94Wastewater treatment plant improvement 3.19 79.47Wastewater treatment plant expansion 2.85 128.95Wastewater Demolition 0.59 1.85Wastewater Total 92.58 618.13Shared servicesPlant & Equipment Replacements 7.68 29.11Process Improvement 1.34 32.07Laboratory 14.87 0.31Project 1 - -Shared services total 23.89 61.49Grand total (2011/12 $) 234.67 1,561.31Note:Future expenditure is in current dollars and does not allow for inflation.PAGE 64 2012 financial reportReturn to contents page
<strong>Watercare</strong> Services Limited2012 ANNUAL REPORTFigure 54Infrastructure investments provided for public benefitUnder the G3 reporting framework <strong>Watercare</strong> is required to provide information on G3 economic indicator EC8 relating to indirect economic impacts.One criteria reported under the G3 framework is the development and impact of infrastructure investments and services provided primarilyfor public benefit through commercial, in-kind, or pro-bono engagement. As water and wastewater service provider for the Auckland region, allof <strong>Watercare</strong>’s water and wastewater services are designed to fulfil community needs. These needs are determined through the interaction of<strong>Watercare</strong> both directly <strong>with</strong> the community and via the Auckland Council. Any requirements identified are fed back to <strong>Watercare</strong> and built intoindividual water and wastewater projects.<strong>Watercare</strong> has a capital programme totalling approximately $3.7 billion (in 2012 dollars) over 10 years. The positive impacts of this investmentinclude the support of economic growth in the region and the associated improvement in standards of living for local communities, themaintenance of existing levels of service through replacement of old infrastructure, the provision of security of supply to businesses and localcommunities, and the improvements in levels of service to local communities such as improved pressures and water quality.Any impacts on communities and the environment related to the construction of individual projects are largely temporary or mitigated throughcommunity engagement and project planning.Return to contents page2012 financial report PAGE 65
<strong>Watercare</strong> Services Limited2012 ANNUAL REPORTFigure 55Major suppliers and contractorsVendorServiceTotal 2011/12expenditureFletcher Construction Co Ltd Construction 26,482,920.21Thiess Services Limited Technical Services 21,011,350.22Lend Lease Infrastructure Serv Maintenance 17,345,964.70Pipeline & Civil Construction 15,177,695.64HEB Construction Limited Construction 13,536,372.44Inland Revenue Department NZ Govt Agencies 13,254,096.09Brian Perry Civil Construction 12,221,068.29Downer EDI New Zealand Ltd Construction 11,818,159.39Drill Tech (1996) Limited Construction 11,319,928.23Steelpipe Limited Construction 11,269,832.38Contact Energy (Power) Energy 10,554,481.79Orica New Zealand Ltd Chemical 10,337,814.77Pipeworks Rehabilitation Solutions Construction 10,254,853.59Auckland Council Local Authorities 9,713,297.66City Care Construction 7,699,012.68Ch2m Beca Ltd Professional Services 7,617,521.69Cassidy Construction Ltd Construction 6,705,152.85Hawkins Infrastructure Maintenance 6,200,906.84Aecom New Zealand Limited Professional Services 5,983,163.78Coast Digger Services Construction 5,899,375.90Marsh Ltd Insurance 4,972,544.25United Water International Pty Construction 4,700,197.43Canadian Pacific Construction Construction 4,219,305.50March Cato Ltd Construction 3,964,131.50GE Betz Pty Ltd Supporting Equipment 3,938,030.86NZ Transport Agency Professional Services 3,668,878.88Sinclair Knight Merz Professional Services 3,665,063.77GHD Ltd Professional Services 3,542,628.03Vector Ltd Energy 2,830,810.31Fletcher Macdow Joint Venture Construction 2,823,741.43Opus Interntl Consultants Ltd Professional Services 2,805,716.46Infor Global Solutions NZ Ltd Computer 2,757,865.07Revera Ltd Computer 2,736,269.48H2O Engineering Limited Technical Services 2,479,832.87Hynds Pipe Systems Ltd Consumables 2,443,930.79Genesis Energy Energy 2,383,832.70Universal Underground Ltd Construction 2,343,917.49Tyco Flow Control Pacific Pty Construction 2,235,481.69Tonkin & Taylor Ltd Professional Services 2,060,167.31Service Engineers Ltd Engineering Services 2,041,752.51URS New Zealand Ltd Professional Services 2,010,041.84Tunnel & Civil Ltd Construction 1,953,645.99Xylem Water Solutions NZ Limited Supporting Equipment 1,889,849.52J A Nicholson Engineering Ltd Engineering Services 1,884,647.13Fulton Hogan North Civil Construction 1,782,005.39McDonalds Lime Ltd Chemical 1,781,876.26Datacol New Zealand Ltd Consumables 1,764,759.70MWH New Zealand Ltd Professional Services 1,710,283.67Meridian Energy Ltd Energy 1,683,432.47Auckland Sandblasters Ltd Cleaning 1,620,790.34Tyco Water Manufacturing Consumables 1,607,029.70Dimension Data New Zealand Limited Computer 1,548,212.47Alliance Construction Limited Construction 1,541,743.81Hydrotech Drainage & Plumbing Construction 1,531,709.21Harrison Grierson Consult Ltd Professional Services 1,527,829.84Russell McVeagh McKenzie Bart Professional Services 1,473,578.10AWT New Zealand Ltd Professional Services 1,460,291.94Solution Dynamics Limited Professional Services 1,407,442.97Mechanical Technology Ltd Engineering Services 1,373,842.93Harker Underground Construction Construction 1,368,173.66Advanced Pipeline Services Ltd Maintenance 1,295,992.37Clarke Energy Australia P/L Engineering Services 1,285,011.68Microsoft New Zealand Limited Computer 1,260,034.80Stockman General Contractors Construction 1,168,197.13Counties Power Ltd Energy 1,166,990.20Damwatch Services Ltd Professional Services 1,081,211.83Nova Gas Ltd Energy 1,074,125.63Fulton Hogan/John Holland Construction 1,043,311.04339,313,129.09PAGE 66 2012 financial reportReturn to contents page
Dec 11<strong>Watercare</strong> Services Limited2012 ANNUAL REPORTFigure 56Suppliers spend by industry and sectorConstruction 46% NZ Govt Agencies 4%Consumables 2% Professional Services 13%Energy 5% Supporting Equipment 2%Engineering Services 2% Technical Services 7%Insurance 2% Chemical 3%Local Authorities 3% Cleaning 1%Maintenance 7% Computer 3%Note:Analysis of <strong>Watercare</strong>’s top 100 suppliers and contractors, by services or goods provided, shows the predominance of construction contracts, reflectingcontinued investment in significant new assets.Figure 57Interest rate performance6.2%6.1%6.0%5.9%5.8%5.7%5.6%5.5%BenchmarkActualForecast benchmarkForecast5.4%5.3%5.2%Jun 13May 13Apr 13Mar 13Feb 13Jan 13Dec 12Nov 12Oct 12Sep 12Aug 12Jul 12Jun 12May 12Apr 12Mar 12Feb 12Jan 12Nov 11Oct 11Sep 11Aug 11Jul 11Return to contents page2012 financial report PAGE 67
<strong>Watercare</strong> Services Limited2012 ANNUAL REPORTFigure 58Ethics and business integrityPercentage and total number of business units analysed for risks related to corruption.Percentage of employees trained in organisation’s anti-corruption policies and procedures.Actions taken in response to incidents of corruption.NilNilNot applicableNote:Under the G3 reporting framework <strong>Watercare</strong> is required to provide information on G3 society indicator SO2, SO3 and SO4 relating to corruption. This additionalinformation has been included to meet G3 criteria.Probity guidelines are in place in respect of projects undertaken by the company and the company employs an independent probity auditor.<strong>Watercare</strong> produces and promulgates a business conduct and ethics policy.A high percentage of <strong>Watercare</strong> staff are registered professionals and bound by the ethical standards required of those professions.The company also has policies that cover gifts and inducements, conflicts of interest and protected disclosures.Figure 59Product information disclosureWaterWastewaterThe sourcing of components of the product or service Yes YesContent, particularly <strong>with</strong> regard to substances that mightproduce an environmental or social impactSafe use of the product or service Yes YesDisposal of the product and environmental/social impacts Yes YesYesYesNote:Under the G3 reporting framework, <strong>Watercare</strong> provides additional information on G3 product responsibility indicator PR3, relating to product and service labelling.<strong>Watercare</strong> is governed by Ministry of Health Drinking Water Assessors and complies <strong>with</strong> the Drinking Water Standards New Zealand 2005 (revised 2008).Wastewater is governed by the final effluent standards as part of resource consent conditions.The table above reports whether product and service information is required by <strong>Watercare</strong>’s procedures for product and service information and labelling.Figure 60Product life cycle, health and safety impact assessmentStageDevelopment of product conceptResearch and designCertificationManufacturing and productionMarketing and promotionStorage distribution and supplyUse and serviceDisposal reuse or recyclingYes/NoN/AN/AN/AYesN/AYesYesYesNote:Under the G3 reporting framework, <strong>Watercare</strong> is required to provide information on G3 product responsibility indicator PR1 relating to customer health and safety.<strong>Watercare</strong> supplies water and wastewater services to the Auckland region in accordance <strong>with</strong> government guidelines and regulations. In addition the companycarries out extensive planning for future demand, through documents such as the Asset Management Plan and the Three Waters Strategic Plan.The G3 indicator table below outlines whether the health and safety impacts of products and services are assessed for improvements.PAGE 68 2012 financial reportReturn to contents page
<strong>Watercare</strong> Services Limited2012 ANNUAL REPORTFigure 61Financial implications of climate changeUnder the G3 reporting framework <strong>Watercare</strong> is required to provide information on G3 economic indicator EC2 relating to economic performanceand climate change.<strong>Watercare</strong> undertakes extensive planning for the future at a regional level, through strategic documents such as the Three Waters Strategic Plan.The document has a 100 year planning horizon and considers the future operating environment for <strong>Watercare</strong> over the Auckland region, coveringmany factors including population growth, availability of resources and climate.Climate change is considered in the plan as affects could influence sources of water for supply, drainage networks and the behaviours ofconsumers. It is acknowledged that natural variations will continue to affect the New Zealand climate in future, along <strong>with</strong> long-term climatechange trends.The plan says specific Auckland-based scenarios will be considered for the effect of extreme events, recognising that short-term climate is likelyto be a greater driver than long term events.In addition to the plan, <strong>Watercare</strong> will continue to assess future business, regulatory and operating requirements in Auckland’s changingenvironment, and has already begun making assessments using available data on any impacts of climate change on its operations.As more conclusive information on the impacts of climate change in the Auckland region is available, research and planning of asset managementoptions will be undertaken. This will include identification of economic impacts. Implications will be included in future asset management plansand other long term strategies.Return to contents page2012 financial report PAGE 69
WATERCARE SERVICES LIMITEDREGISTRATION NUMBER: AK/519049REGISTERED OFFICE:2 Nuffield Street, NewmarketAuckland, Private Bag 92 521Wellesley Street, Auckland 1141Telephone: +64 9 539 7300Facsimile: +64 9 539 7334Email: communications@water.co.nzWebsite: www.watercare.co.nzAnnualReport 2012Return to contents page