

(BAT) Reference Document for the Production of Chlor-alkali ...
(BAT) Reference Document for the Production of Chlor-alkali ...
(BAT) Reference Document for the Production of Chlor-alkali ...

Create successful ePaper yourself
Turn your PDF publications into a flip-book with our unique Google optimized e-Paper software.
Chapter 3<br />
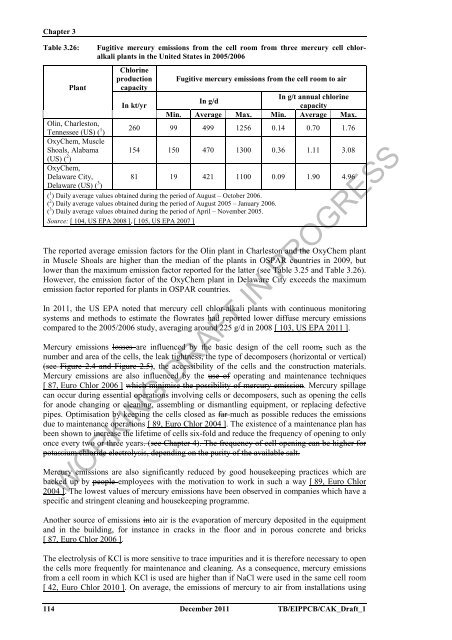
Table 3.26: Fugitive mercury emissions from <strong>the</strong> cell room from three mercury cell chlor<strong>alkali</strong><br />
plants in <strong>the</strong> United States in 2005/2006<br />
<strong>Chlor</strong>ine<br />
production Fugitive mercury emissions from <strong>the</strong> cell room to air<br />
Plant capacity<br />
In kt/yr<br />
In g/d<br />
In g/t annual chlorine<br />
capacity<br />
Min. Average Max. Min. Average Max.<br />
Olin, Charleston,<br />
Tennessee (US) ( 1 )<br />
OxyChem, Muscle<br />
260 99 499 1256 0.14 0.70 1.76<br />
Shoals, Alabama<br />
(US) ( 2 )<br />
OxyChem,<br />
154 150 470 1300 0.36 1.11 3.08<br />
Delaware City,<br />
Delaware (US) ( 3 )<br />
81 19 421 1100 0.09 1.90 4.96<br />
( 1 ) Daily average values obtained during <strong>the</strong> period <strong>of</strong> August – October 2006.<br />
( 2 ) Daily average values obtained during <strong>the</strong> period <strong>of</strong> August 2005 – January 2006.<br />
( 3 ) Daily average values obtained during <strong>the</strong> period <strong>of</strong> April – November 2005.<br />
Source: [ 104, US EPA 2008 ], [ 105, US EPA 2007 ]<br />
The reported average emission factors <strong>for</strong> <strong>the</strong> Olin plant in Charleston and <strong>the</strong> OxyChem plant<br />
in Muscle Shoals are higher than <strong>the</strong> median <strong>of</strong> <strong>the</strong> plants in OSPAR countries in 2009, but<br />
lower than <strong>the</strong> maximum emission factor reported <strong>for</strong> <strong>the</strong> latter (see Table 3.25 and Table 3.26).<br />
However, <strong>the</strong> emission factor <strong>of</strong> <strong>the</strong> OxyChem plant in Delaware City exceeds <strong>the</strong> maximum<br />
emission factor reported <strong>for</strong> plants in OSPAR countries.<br />
In 2011, <strong>the</strong> US EPA noted that mercury cell chlor-<strong>alkali</strong> plants with continuous monitoring<br />
systems and methods to estimate <strong>the</strong> flowrates had reported lower diffuse mercury emissions<br />
compared to <strong>the</strong> 2005/2006 study, averaging around 225 g/d in 2008 [ 103, US EPA 2011 ].<br />
Mercury emissions losses are influenced by <strong>the</strong> basic design <strong>of</strong> <strong>the</strong> cell room, such as <strong>the</strong><br />
number and area <strong>of</strong> <strong>the</strong> cells, <strong>the</strong> leak tightness, <strong>the</strong> type <strong>of</strong> decomposers (horizontal or vertical)<br />
(see Figure 2.4 and Figure 2.5), <strong>the</strong> accessibility <strong>of</strong> <strong>the</strong> cells and <strong>the</strong> construction materials.<br />
Mercury emissions are also influenced by <strong>the</strong> use <strong>of</strong> operating and maintenance techniques<br />
[ 87, Euro <strong>Chlor</strong> 2006 ] which minimise <strong>the</strong> possibility <strong>of</strong> mercury emission. Mercury spillage<br />
can occur during essential operations involving cells or decomposers, such as opening <strong>the</strong> cells<br />
<strong>for</strong> anode changing or cleaning, assembling or dismantling equipment, or replacing defective<br />
pipes. Optimisation by keeping <strong>the</strong> cells closed as far much as possible reduces <strong>the</strong> emissions<br />
due to maintenance operations [ 89, Euro <strong>Chlor</strong> 2004 ]. The existence <strong>of</strong> a maintenance plan has<br />
been shown to increase <strong>the</strong> lifetime <strong>of</strong> cells six-fold and reduce <strong>the</strong> frequency <strong>of</strong> opening to only<br />
once every two or three years. (see Chapter 4). The frequency <strong>of</strong> cell opening can be higher <strong>for</strong><br />
potassium chloride electrolysis, depending on <strong>the</strong> purity <strong>of</strong> <strong>the</strong> available salt.<br />
Mercury emissions are also significantly reduced by good housekeeping practices which are<br />
backed up by people employees with <strong>the</strong> motivation to work in such a way [ 89, Euro <strong>Chlor</strong><br />
2004 ]. The lowest values <strong>of</strong> mercury emissions have been observed in companies which have a<br />
specific and stringent cleaning and housekeeping programme.<br />
WORKING DRAFT IN PROGRESS<br />
Ano<strong>the</strong>r source <strong>of</strong> emissions into air is <strong>the</strong> evaporation <strong>of</strong> mercury deposited in <strong>the</strong> equipment<br />
and in <strong>the</strong> building, <strong>for</strong> instance in cracks in <strong>the</strong> floor and in porous concrete and bricks<br />
[ 87, Euro <strong>Chlor</strong> 2006 ].<br />
The electrolysis <strong>of</strong> KCl is more sensitive to trace impurities and it is <strong>the</strong>re<strong>for</strong>e necessary to open<br />
<strong>the</strong> cells more frequently <strong>for</strong> maintenance and cleaning. As a consequence, mercury emissions<br />
from a cell room in which KCl is used are higher than if NaCl were used in <strong>the</strong> same cell room<br />
[ 42, Euro <strong>Chlor</strong> 2010 ]. On average, <strong>the</strong> emissions <strong>of</strong> mercury to air from installations using<br />
114 December 2011 TB/EIPPCB/CAK_Draft_1


