chapter 4 - DRK
chapter 4 - DRK
chapter 4 - DRK

Create successful ePaper yourself
Turn your PDF publications into a flip-book with our unique Google optimized e-Paper software.
Strictly under embargo untilWednesday 22 Septemberat 00:01 GMT(02:01 Geneva time)
The International Federationof Red Cross and Red Crescent Societieswould like to express its gratitude to thefollowing for committing to andsupporting this publication:Swedish InternationalDevelopment CooperationAgencyRed Crescent Society of the United Arab Emirates
A global humanitarian organizationThe International Federation of Red Cross and Red Crescent Societies is the world’s largesthumanitarian organization, providing assistance without discrimination as to nationality, race,religious beliefs, class or political opinions. The International Federation’s mission is to improve thelives of vulnerable people by mobilizing the power of humanity.Founded in 1919, the International Federation comprises 186 member Red Cross and Red CrescentSocieties – with an additional number in formation – a secretariat in Geneva and offices strategicallylocated to support activities around the world. The Red Crescent is used in place of the Red Crossin many Islamic countries.The International Federation coordinates and directs international assistance to victims of naturaland technological disasters, to refugees and in health emergencies. It combines its relief activitieswith development work to strengthen the capacities of National Societies and through them thecapacity of individual people. The International Federation acts as the official representative of itsmember societies in the international field. It promotes cooperation between National Societies, andworks to strengthen their capacity to carry out effective disaster preparedness, health and socialprogrammes.National Red Cross and Red Crescent Societies embody the work and principles of theInternational Red Cross and Red Crescent Movement. National Societies act as auxiliaries to the publicauthorities of their own countries in the humanitarian field and provide a range of services includingdisaster relief, health and social programmes. During wartime, National Societies assist the affectedcivilian population and support the army medical services where appropriate.The unique network of National Societies – which covers almost every country in the world – is theInternational Federation’s principal strength. Cooperation between National Societies gives theInternational Federation greater potential to develop capacities and assist those most in need. At alocal level, the network enables the International Federation to reach individual communities.Together, the National Societies comprise 97 million volunteers and 300,000 employees, whoprovide assistance to some 233 million beneficiaries each year.The International Committee of the Red Cross (ICRC) is an impartial, neutral and independentorganization whose exclusively humanitarian mission is to protect the lives and dignity of victims ofwar and internal violence and to provide them with assistance. It directs and coordinates theinternational relief activities conducted by the Movement in situations of conflict. It also endeavoursto prevent suffering by promoting and strengthening humanitarian law and universal humanitarianprinciples. Established in 1863, the ICRC is at the origin of the International Red Cross and RedCrescent Movement.Together, all the components of the International Red Cross and Red Crescent Movement are guidedby the same seven Fundamental Principles: humanity, impartiality, neutrality, independence,voluntary service, unity and universality. In the same manner, all Red Cross and Red Crescentactivities have one central purpose: to help those who suffer without discrimination and thuscontribute to peace in the world.Cover photo: Storm cloud hangs over Hangzhou City before the coming of typhoon Haitang ineast China's Zhejiang province. Storm cloud hangs over Hangzhou City before the coming oftyphoon Haitang in east China's Zhejiang province July 19, 2005. Typhoon Haitang swirled towardsChina's southeast coast on Tuesday after killing up to six people in Taiwan, injuring 30 and wreakingdamage estimated at US$41 million. CHINA OUT REUTERS/China Newsphoto.
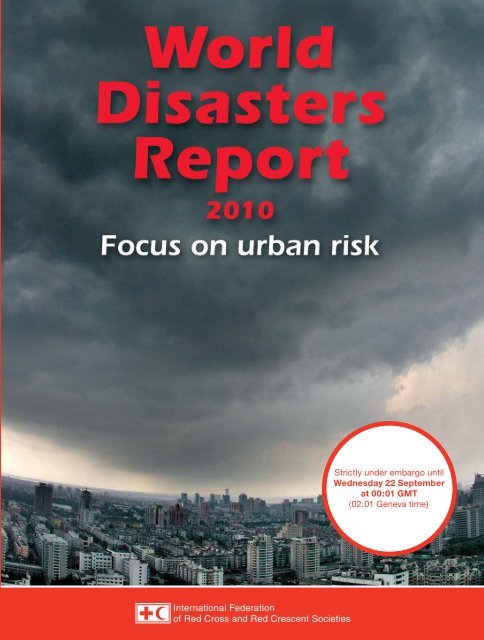
Strictly under embargo until Wednesday 22 September at 00:01 GMT (02:01 Geneva time)WorldDisastersReport2010Focus on urban risk
Strictly under embargo until Wednesday 22 September at 00:01 GMT (02:01 Geneva time)All rights reserved. Except for quotation in a review of the work, no part of this publicationmay be reproduced, stored in a retrieval system, or transmitted, in any form orby any means, electronic, mechanical, photocopying, recording or otherwise, withoutthe prior permission of the International Federation of Red Cross and Red CrescentSocieties. This publication is copyright, but may be reproduced without fee for teachingpurposes but not for resale. Formal permission is required for all such uses. Forcopying in any other circumstances, or for re-use in other publications, or for translationor adaptation, prior written permission must be obtained from the publisher.The opinions expressed in this publication do not necessarily represent the officialpolicy of the International Federation of Red Cross and Red Crescent Societies or ofindividual National Red Cross or Red Crescent Societies. The designations used donot imply the expression of any opinion on the part of the International Federation orNational Societies concerning the legal status of a territory or of its authorities.© International Federation of Red Cross and Red Crescent Societies, 2010ISBN 978-92-9139-156-1Editor: Denis McCleanMain contributors: Sean Deely, David Dodman, Jorgelina Hardoy, Cassidy Johnson,David Satterthwaite, Amy Serafin and Richard WaddingtonDesign and production team: Sébastien Calmus, Jean-Charles Chamois,Benoit Matsha-Carpentier, Sue Pfiffner and Josephine Shields RecassEditorial board: George Deikun, Arjun Katoch, Helena Molin-Valdes,Cristina Rumbaitis del Rio and Jo WellsReviewers: Yasemin Aysan, Patricia Danzi, Angela Gussing, Kamal Kishore,Mohammed Omer Mukhier and Graham SaundersWe would also like to thank David Satterthwaite who served as Chief Editor duringthe initial stages, and all those who assisted contributors during research for this issueTypesetting by Michel Schnegg, Geneva, SwitzerlandPrinted by Imprimerie Chirat, Lyons, FranceContact details:International Federation of Red Cross and Red Crescent Societies17, Chemin des Crêts, P.O. Box 372CH-1211 Geneva 19, SwitzerlandTel.: +41 22 730 4222. Fax: +41 733 0395E-mail: secretariat@ifrc.org; wdr@ifrc.orgWeb: www.ifrc.orgTo order the World Disasters Report, please contact wdr@ifrc.org.2
Strictly under embargo until Wednesday 22 September at 00:01 GMT (02:01 Geneva time)ContentsInternational Federation of Red Crossand Red Crescent Societiesinside front coverAcknowledgements 2Introduction 7Focus on urban riskChapter 1 Avoiding the urbanization of disasters 10Table 1.1Figure 1.1Growth in the world’s urban and rural population(millions of inhabitants) 12Distribution of fatalities and economic lossfrom tropical cyclones per year 13Box 1.1 Urban myths and misconceptions 19Table 1.2What different aspects of urban poverty implyfor everyday and disaster risk 21Box 1.2 Can Haiti build back better? 23Chapter 2 Urban disaster trends 30Figure 2.1 Growth in urban population globally and by region 32Figure 2.2Figure 2.3The change in the average population sizeof the world’s 100 largest cities, 1800 to 2000 33Changes in the proportion of GDP for lowandmiddle-income nations, 1950–2005 33Table 2.1 Large disaster events over the period 2000–2010impacting on cities 35Box 2.1 Tropical Storm Ketsana and urban food insecurity 38World Disasters Report 2010 – Focus on urban risk3
Strictly under embargo until Wednesday 22 September at 00:01 GMT (02:01 Geneva time)Figure 2.4Hazard risk index for large cities, as definedby Munich Re Group 39Figure 2.5 Port cities with highest exposed population in 2005to one-in-100-year, surge-induced flood events 41Table 2.2Figure 2.6Port cities with population over 1 million estimatedto have highest increased population exposureto surge-induced floods, 2005 to projected 2070 42Geographic distribution and frequency of registeredflooding events between 1950 and 1990 in Cali, Colombia 43Box 2.2 Fires and fire risks in Imizamo Yethu, Hout Bay, South Africa 44Box 2.3 The vulnerability gap in Istanbul, Turkey 45Chapter 3Box 3.1Starting over: Community rightsand post-disaster response 52The Philippines Homeless People’s Federation’s rolein community-driven disaster response 56Box 3.2 Inclusive equitable cities 59Box 3.3Housing, land and property rights and post-disastershelter programming 64Chapter 4 Urban violence 72Box 4.1 Violence and young people in urban settings 78Table 4.1 Measuring inequality 81Box 4.2 Red Cross Red Crescent action 87Chapter 5 Urban risk to health 94Box 5.1 Hunger is back with a vengeance 98Box 5.2 Hi-tech rescue in a mega-city 106Box 5.3 Safety on the urban road 1084
Strictly under embargo until Wednesday 22 September at 00:01 GMT (02:01 Geneva time)Annex 2Making cities resilient: A ten-pointchecklist for local governments 190Index 200Fundamental Principlesinside back coverWorld Disasters Report 2010 – Focus on urban risk7
Strictly under embargo until Wednesday 22 September at 00:01 GMT (02:01 Geneva time)The urban risk divide:A 21st century challengeThe signs of our vulnerability to urban risk are everywhere.An earthquake can bring hospitals, schools and homes tumbling down with unspeakablytragic consequences. A volcano can throw city airports into chaos. Flood waterscan turn well-kept streets into detritus-strewn canals. The drug trade can turn an innercity into a war zone. An epidemic can spread rapidly through a crowded slum.As the pendulum of human development swings increasingly away from the countrysideto the city, we see that rapid urbanization and population growth are combiningto create enormous new challenges for the humanitarian community and pushing usout of our comfort zone to deal with a strange new urban world.When it comes to the impact of natural disasters, well-run cities can be among thesafest places on earth. They can also be the best places to raise a family, for schooling,healthcare and employment. You can expect to live longer in a city.Cities can also be the most dangerous places on earth for those who live in an urbanenvironment where the authorities have little presence and where the will and theresources are lacking to ensure basic social services, food security, policing, runningwater, sewerage and respect for building codes.This urban risk divide is a major challenge for humankind in the 21st century if we areto ensure that the worldwide movement from the countryside to cities does not fuel agrowth in sickness and deaths from the re-creation of 19th century-like public healthhazards exacerbated by exposure to risks generated by climate change and the threatof pandemics.The stresses and strains of urban living can be compounded immeasurably for thosewho end up living on the peripheries of cities in low- and middle-income countries,barely surviving on one US dollar or less a day.Despite the heartbeat of commerce and other signs of vibrant life which pulsatethrough many informal urban settlements, slum life can be nasty, brutal and short formany inhabitants as they lose out in a Darwinian struggle for survival against disease,malnutrition, illiteracy, crime and natural disasters.It is this urban ‘underclass’ that should concern the humanitarian community most.Their numbers are almost 1 billion and they are growing at the rate of 10 million8
Strictly under embargo until Wednesday 22 September at 00:01 GMT (02:01 Geneva time)The United Nations (UN) Population Division’s projections suggest that almost allthe world’s population growth in the next few decades will be in urban areas in lowandmiddle-income nations (see Table 1.1). Much of this population growth is currentlyin informal settlements where housing conditions are generally very poor andeven the most rudimentary protective infrastructure is often lacking. A high proportionof this urban growth is in cities at risk from the increased frequency and intensityof extreme weather events and storm surges that climate change is bringing or is likelyto bring.Table 1.1 Growth in the world’s urban and rural population(millions of inhabitants)1950 1970 1990 Projected for 2010* Projected for 2030*World’s urban population 737 1,332 2,275 3,495 4,965High-income nations 427 652 818 925 1,016Low- and middle-income nations 310 680 1,456 2,570 3,949Africa 33 86 204 412 759Asia 237 485 1,015 1,770 2,669Europe 281 412 509 530 550Latin America and the Caribbean 69 164 314 471 603Northern America 110 171 214 286 351Oceania 8 14 19 25 31World’s rural population 1,798 2,367 3,020 3,412 3,426Source: United Nations (2008)* The figures for 2010 are projected because no data are available yet from the new round of censuses held in 2009and 2010 or planned for 2011. The projections for 2030 may overstate urban population growth in Africa; poor economicperformance and / or conflict have slowed urbanization there and this will have to change if the region is to urbanize rapidly.But a city can be among the safest places when a storm, flood or earthquake hits.This can be seen in the many extreme weather events or earthquakes in high-incomenations (all of which are highly urbanized) that have no, or very few, fatalities. Mostextreme weather events in high-income nations cause no fatalities. For those that do,high-quality buildings and infrastructure usually keep down deaths and injuries, andrapid, good-quality emergency responses limit the impact of injuries. Of course, wecannot measure what has been avoided – the floods that did not happen as the drainagesystem coped; the fire disasters and building collapses prevented by good-qualitybuildings and emergency response; the industrial, mining and transport disastersavoided by the application of sensible standards and safety measures. But without theinvestment in physical capital and institutions, the situation would have been muchworse (although many of the measures that avoid disasters were taken in response toprevious disasters).Part of what can be avoided can be seen in the distribution of fatalities from disasters.Figure 1.1 shows the extent to which deaths from cyclones are concentrated12
Strictly under embargo until Wednesday 22 September at 00:01 GMT (02:01 Geneva time)in low-income nations even though a high proportion of the population exposed tocyclones lives in high-income nations. In viewing the dramatic differences in fatalitiesbetween the different categories of nations, it should be remembered that low-incomenations are the countries that are the least urbanized while almost all upper-middle andall high-income nations are predominantly urban.Japan has more people exposed to tropical cyclones than the Philippines. However,if both countries were affected by a cyclone of the same magnitude, past experiencesuggests that mortality in the Philippines would be 17 times higher than in Japan.This does not mean that cities in high-income nations are always safer, as was shownby the deaths and devastation in New Orleans after Hurricane Katrina, but relativeto the intensity of the disaster, fatalities are much less common. Disasters from firesand from transport and industrial accidents are much less common in cities in highincomenations than in low- and middle-income nations (although this certainly wasnot the case historically as many of today’s wealthiest cities experienced disastrous firesor industrial accidents in the past).Figure 1.1Distribution of fatalities and economic loss from tropical cyclones per year%100908081.374.1People killedEconomic loss70605040302016.4 16.81003.1Low-incomenationsLower-middleincome nations0.95.9Upper-middleincome nations1.3High-incomenationsSource: Based on figures from UNISDR (2009)In high-income countries, Japan has the largest number of people exposed,followed by the Republic of Korea and the United States.When an earthquake hits a city, it can be a very dangerous place to be – as was seenin Port-au-Prince in January, in Bam, Iran in 2003 or in Turkey’s Marmara region in1999. But this need not be so. For instance, in July 2007, a large earthquake struck theWorld Disasters Report 2010 – Focus on urban risk13
Strictly under embargo until Wednesday 22 September at 00:01 GMT (02:01 Geneva time)part of the Niigata region in Japan. Although it was the most costly disasterin the world for that year, only 11 deaths and 100 injuries were reported. Again,this is not always the case as, even in Japan, the complex web of causal relations meansthat the general rule does not always apply, as shown by the 1995 Kobe earthquakewhich claimed 6,400 lives and injured 15,000 people.14CHAPTER 1north-westernWith more than half the world’s population now living in urban areas, this editionof the World Disasters Report looks at where cities and smaller urban areas are centresof risk for disasters and where they are not. It will also consider why this is so – andthe extent to which disaster risk can be reduced or removed in urban areas and whatmeasures contribute to this. This will be discussed within the context of a world thatis urbanizing rapidly.Why focus on urban areas?This report’s focus on urban areas does not mean that urban and rural disasters shouldbe considered separately. Most disasters impact rural and urban areas. There are toomany links between both areas which are relevant to disasters – for instance, disastersin rural areas bring disruptions to urban centres to which they supply food, fuel, wateror other goods, while disasters in urban areas disrupt the suppliers of goods and servicesthat farmers and rural populations use.But urban areas need separate consideration because their very character – the concentrationof population, homes and other buildings, transport infrastructure andindustry – presents both problems and opportunities for disaster risk reduction andhumanitarian assistance. In low-income and most middle-income nations, there is alsomore ‘government’ in urban than in rural areas, as urban populations and enterprisesare subject to more rules and regulations, and state institutions are more likely to bepresent. Of course, such government activities should reduce disaster risk but in reality,as will be discussed later, they may often exacerbate it. There are also more market pressuresin urban areas, especially in large or successful cities where low-income groupsstruggle to find accommodation and health services they can afford and are at riskfrom price rises or falling incomes. Thus, there is a need for finance if households areto protect themselves.Urban populations also need some consideration simply for their scale:By 2010, there were 2.5 billion urban dwellers in low- and middle-incomenations; this is roughly the same as the world’s total population in 1950Africa is usually considered to be predominantly rural but its urban population isnow much larger than that of North AmericaMost of the world’s largest cities are in low- and middle-income nations; thisis unprecedented historically as most large cities have been in the wealthiestnations.
Strictly under embargo until Wednesday 22 September at 00:01 GMT (02:01 Geneva time)The last few decades have also brought a very large increase in the number of urbandwellers living in poverty, mostly in low- and middle-income nations. This is mostevident in the poor-quality and overcrowded housing and the lack of provision forthe basic infrastructure and services which should protect them from environmentalhealth hazards and help prevent disasters. Although precise numbers are lacking,an overall view of UN estimates suggests that around 1 billion urban dwellers livein poor-quality, overcrowded housing in slums or informal settlements with this risingto 1.4 billion by 2020 unless governments and international agencies become farmore successful in supporting housing improvements for low-income groups. TheUN Human Settlements Programme (UN-Habitat) recently published revised figuresstating that the “absolute number” of slum dwellers in the developing world has actuallyincreased from 776.7 million in 2000 to some 827.6 million in 2010. This assessmentis accompanied by a claim that during the same decade, a total of 227 millionpeople have moved out of slum conditions, which means that the Millennium DevelopmentGoal target has been surpassed 2.2 times. However, an inquiry by the WorldDisasters Report elicited the response that this number is partly based on a redefinitionof international sanitation standards which retrospectively excluded families that haveaccess to a slab-pit latrine which in itself may have very little impact on their healthand well-being.Other UN estimates show a massive deficit in provision for water and sanitation. Estimatesfor 2000 suggested at least 680 million urban dwellers lacked adequate provisionfor water supplies and at least 850 million lacked provision for toilets or latrines to aquality that reduced health risks. Since 2000, the urban population in low- and middle-incomenations has increased by more than 500 million. As few governments haveworked successfully with their low-income urban population to improve conditions,this also means there are now hundreds of millions more urban dwellers living in povertyand lacking adequate provision for water and sanitation. Other estimates suggest alower proportion of the urban population in low- and middle-income nations are poor,but these take little or no account of housing conditions and often do not factor intothe poverty lines the full costs of non-food needs in many cities. Set a poverty line unrealisticallylow and it can suggest there is almost no poverty in cities where a high proportionof the population lives in very poor-quality housing in informal settlements.Urban poverty and disaster risk are often closely intertwined. Accidents or outbreaks ofdisease that kill or seriously injure people and / or damage or destroy property are classifiedas disasters if they exceed certain thresholds for the number killed (typically ten ormore) or seriously injured (typically 100 or more). In all urban areas, there are manyaccidents that kill or seriously injure fewer people than this, such as most road trafficaccidents and accidental fires. Urban poverty can dramatically increase prematuredeaths and serious injuries due to dangerous, overcrowded housing lacking infrastructureand services. For instance, the lack of access roads may stop fire engines from gettingto the site of an accidental fire, which has spread owing to housing clustered closeWorld Disasters Report 2010 – Focus on urban risk15
Strictly under embargo until Wednesday 22 September at 00:01 GMT (02:01 Geneva time)16CHAPTER 1together and made of flammable materials. Or the absence of drainage infrastructuremay turn heavy rainfall into a disastrous flood.The links between urban poverty and disaster risk are likely to be increased by climatechange. Tens of millions of urban dwellers face, or will soon face, life-threatening risksfrom the increased intensity of storms, flooding and heatwaves that climate change isbringing, with associated threats to their livelihoods, their asset bases (including housing),environmental quality and future prosperity. Here, it is largely those people andnations that have contributed least to global warming which face the greatest risks.Climate change is driven by greenhouse gas emissions which have brought benefits toaffluent individuals and societies yet most of the burdens fall on low-income (rural andurban) individuals and societies. Without global agreements that succeed in reducinggreenhouse gas emissions dramatically in the next few decades, the number and scaleof extreme weather events, coastal flooding and serious constraints on agriculture andwater supplies will increase and much of this will be in urban and rural areas that lackthe capacity to adapt. However, good practice in urban development and governmentcan also contribute much to disaster risk reduction and climate change adaptation. Butto focus only on the current and likely impact of climate change is to miss a very largepreventable disaster burden that has long been present in urban areas and that remainsindependent of climate change.Urbanization and disaster riskBeing vulnerable should not of itself generate disaster risk. So why is it that, in mostnations and urban centres, deaths, injuries and loss of homes from disasters are greateramong vulnerable groups? If risks are removed – for instance, the installation of decentdrains that cope with heavy rainfall – vulnerability to those risks is no longer a problem.Vulnerability is not the same as lack of income but lack of income may also mean lackof access to safe housing with good provision for water and sanitation, healthcare, educationand capacity to recover. And this, of course, is what increases risks for vulnerablegroups. In cities where a high proportion of the population lives in poverty, under-5mortality rates can be 15 to 20 times what they should be. Again, it has to be stressed thatvulnerable groups are not at risk if the hazards to which they are vulnerable are removed.Women are often the mainstays of community organization and collective action reducingdisaster risk, and the young can be resilient to disasters with proper support.In high-income nations, the concentration of people, buildings, motor vehicles andindustries (and their wastes) in cities is not generally associated with higher disasterrisks because this same concentration also means many economies of scale and proximityfor the comprehensive web of infrastructure and services that reduce disaster risksand disaster impacts. Urban populations in these nations take it for granted that theywill be protected from disasters, including extreme weather, floods, fires and technologicalaccidents.
Strictly under embargo until Wednesday 22 September at 00:01 GMT (02:01 Geneva time)But only a very small proportion of urban centres in low- and middle-income nationshave a comparable web of institutions, infrastructure, services and regulations, althoughthere are very large variations between urban areas in these nations as regards the extentof both provision and coverage. For instance, the proportion of urban populations livingin legal homes that were constructed in accordance with appropriate building regulationsvaries from 10–20 per cent to close to 100 per cent. The proportion of the populationliving in homes adequately served by sanitation, waste-water removal and stormdrains also varies enormously – most urban centres in Africa and Asia have no sewers andfor many of those that do, these serve only a very small proportion of the population. Nofamily in urban areas in high-income nations, however poor, expects to have to walk severalhundred metres to collect water from a communal standpipe shared with hundredsof others, to have no toilet in their home or to have no service to collect household waste.It is common that between one-third and one-half of the population of cities in lowandmiddle-income nations lives in informal settlements. And this is not just the casein cities with little economic success – around half the population of Mumbai andNairobi, both of which are successful economically, lives in informal settlements. It isalso common in such cities for the local authorities and utilities to refuse to extend toinformal settlements (or to be prevented from doing so by law or regulation) all theinfrastructure and services that do so much to reduce disaster risk. There are no statisticson the proportion of the urban population covered by good-quality fire services orrapid response to serious injuries or illnesses (including ambulances and hospitals ableto provide rapid treatment), but the inadequacy or complete absence of such servicesis evident in many informal settlements. Only 1 per cent of households and businessesin low-income countries and 3 per cent in middle-income countries have catastropheinsurance, compared to 30 per cent in high-income nations.Urban mythsThe discussion of urbanization is still full of myths (see Box 1.1). It is often seen as ‘theproblem’ (nations being ‘too urbanized’, cities growing ‘too fast’, ‘too many migrants’flooding the city) when it is associated with economic success. All high-income nationsare predominantly urbanized and most of their rural population are ‘urbanized’ in thatthey no longer work in agriculture and a high proportion of them commute to urbanareas. All low- and middle-income nations that have had the greatest economic successhave urbanized; most of those that have not had economic success are among theworld’s least urbanized nations. There are worries about ‘mega-cities’ with more than10 million inhabitants but there are relatively few of them (17 in 2000, the last yearfor which census data were available for most cities) and they are concentrated in theworld’s largest economies. There is an economic logic to where urbanization and largecity development is taking place – and also good evidence to show that in successfuleconomies that are urbanizing and where the competence of city governments isstrengthened, urban development decentralizes to community and urban district levels.World Disasters Report 2010 – Focus on urban risk17
Strictly under embargo until Wednesday 22 September at 00:01 GMT (02:01 Geneva time)A young boy leansover a balconyoverlooking aninformal settlementin Cape Town,South Africa.© IFRCThe crisis of urban poverty, rapidly growing informal settlements and growing numbersof urban disasters arises from the failure of governments to adapt their institutionsto urbanization. It stems also in part from the failure of aid agencies to helpthem to do so – most aid agencies have inadequate or no urban policies and havelong been reluctant to support urban development at a sufficient scale. Governmentsfail to stop urban disasters when they fail to help local government structures in citiesand metropolitan areas to provide the web of institutions, infrastructure and servicesnoted above. In so many cities, disaster risk is produced over time by the failure of citygovernments to ensure that neighbourhoods are not built with bad-quality housingand on dangerous sites without adequate infrastructure. Often this failure is linked totheir weak financial status, lack of trained staff and lack of capacity due to the refusalof central and provincial governments to provide them with resources commensuratewith their responsibilities. Perhaps the most important issue that runs through all the<strong>chapter</strong>s in this report is that city and municipal governments should be working withtheir low-income populations and other vulnerable groups to take disaster risk out ofurban development and expansion. We have enough examples to illustrate that this ispossible, despite the constraints that city governments face.If national and international databases on disasters become more precise and comprehensiveas to the impact on individual cities, it is certain that the observed trends would18
Strictly under embargo until Wednesday 22 September at 00:01 GMT (02:01 Geneva time)reinforce the view that disaster risk increases in badly governed cities and decreases inwell-governed cities. It would show that cities with rapid population growth and ensuingeconomic growth introduce measures to reduce disaster risk, while cities with slowpopulation growth or even population decline still have high disaster risk as they havefewer resources to invest in reducing disaster risk.Observed trends would also show that many city governments increase disaster risk asthey ignore the population living in informal settlements or as they bulldoze these settlements,destroying the homes, assets and livelihoods of tens of thousands of peoplebut providing no alternatives – either to those who are displaced or to low-incomegroups in general. Low-income groups do not want to live in poor-quality housing indangerous, crime-ridden settlements lacking infrastructure, law and order and otherservices. They do so because only in such areas can they find affordable accommodationwithin reach of income-earning opportunities.Box 1.1 Urban myths and misconceptions1. “Cities are parasitic, growing everywherewithout the economy to support them.” Ingeneral, the more urbanized a nation, thestronger and more productive its economy.The nations with the greatest economic successover the last few decades are generallythose that have urbanized most rapidly;most of those with the smallest increase intheir level of urbanization are those with theleast economic success.2. “Africa is the most rapidly urbanizing regionand it is urbanizing without economicgrowth.” Asia is the most rapidly urbanizingregion, driven by urbanization in itsmost successful economies. Africa’s rateof urbanization has slowed because manyAfrican nations have had little or no economicgrowth in recent years and are urbanizingslowly or may even have stoppedurbanizing.3. “Mega-cities are growing rapidly and willdominate the urban future.” There are relativelyfew mega-cities (17 in 2000, themost recent year for which census data areavailable), they concentrate less than 5 percent of the world’s population and manyhave more people moving out than in, assmaller cities within their nation attract morenew investment.4. “More than half the world’s population livesin cities.” More than half the world’s populationlives in urban centres, not cities, and alarge part of this is in small market towns orother urban centres too small to be considereda city.5. “The speed of urban change in poorer nationsis unprecedented with new cities mushroomingeverywhere.” Many high-incomenations had periods with faster increases intheir levels of urbanization than those takingplace in recent decades in most low- andmiddle-income nations. There are relativelyfew new large cities; most large cities inAsia, North Africa and Latin America (andEurope) have been important cities for centuries.Several of the world’s fastest-growinglarge cities over the last 100 years are inthe United States.World Disasters Report 2010 – Focus on urban risk19
Strictly under embargo until Wednesday 22 September at 00:01 GMT (02:01 Geneva time)6. “Urban development is opposed to ruraldevelopment.” Much of the demand thatproduces rural incomes comes from urbanpopulations and urban enterprises. Manyhigher-paying jobs in rural areas (includingoff-farm work) come from urban demand.Successful farmers depend on urban-basedfacilities and services – markets, banks,processing plants, cold-storage facilities,supply and repair of machinery and agriculturalinputs. Rural populations oftendepend on their local urban centre for accessto hospitals, secondary schools, postoffices and most consumer goods and services.Many low-income rural householdshave their incomes boosted by remittancesfrom a family member working in urbanareas.7. “Large and rapidly growing cities have theworst environmental problems.” Large citiesoften have better standards of environmentalhealth than most other urban centres intheir nation (and most rural areas). Wellgovernedcities have the world’s best qualityof life (and highest life expectancies).It is not the size and speed at which acity grows that determines environmentalproblems but the quality of its governmentand its relations with its low-income population.Disaster impacts in rural and urban areasDisasters have long had their largest impacts in rural areas in terms of deaths, seriousinjuries and impoverishment. In part, this was simply because most people lived andworked in rural areas but this is no longer the case. It was also partly because most ofthose with the least resilience to disasters lived in rural areas. This is changing withthe growth in what can be termed the ‘vulnerability gap’ in urban areas and as it does,it brings with it a need to consider why more disaster risk is in urban areas and whatthis implies for both development and disaster risk reduction. The vulnerability gap isproduced by two factors: the lack of knowledge and financial capacity (and sometimeswillingness) of urban authorities to reduce risks and vulnerabilities; and a high proportionof urban households and communities limited in their capacity to reduce riskby inadequate incomes, limited political influence, high land prices (often driven upby speculation) and corrupt practices in land-use management that combine to forcepeople to live in high-risk areas.The priorities for disaster risk reduction depend on how disaster risk is viewed. Ifdisaster risk is viewed in terms of economic impacts, the list of ‘vulnerable cities’ isdominated by wealthy cities in high-income nations. So in the index of risk to multihazardsin large cities developed by Munich Re, 17 of the 20 cities at highest risk arein high-income countries. This makes sense if gauging the risk for insurers and thusthe value of exposed assets but it makes very limited sense in terms of identifying citieswhere populations are particularly at risk from disasters.Cities in low-income nations do face very high levels of risk – not because of themonetary value of exposed assets, but due to the inadequacies in their infrastructure,the poor quality of the housing for much of the population and the weakness of city20
Strictly under embargo until Wednesday 22 September at 00:01 GMT (02:01 Geneva time)institutions. Poor people have a lot to lose when disaster strikes. Better mapping ofsmaller urban disasters would illustrate clearly the large impact they have on vulnerablehouseholds.Table 1.2 What different aspects of urban poverty imply for everyday and disaster riskAspect of urban poverty Implications for everyday risk Implications for disaster riskInadequate and often unstableincome and thus inadequateconsumption of necessities,including food and, often, safe andsufficient water. Often, problems ofindebtedness, with debt repaymentssignificantly reducing income availablefor necessities. Inability to payfor insurance.Inadequate, unstable or riskyasset base (e.g., property, skills,savings, social networks)for individuals, householdsor communities.Poor-quality and often insecure,hazardous and overcrowdedhousing (often rented) locatedon dangerous sites such as floodplains, steep slopes and soft orunstable ground.Inadequate provision of ‘public’infrastructure (piped water,sanitation, drainage, roads, footpaths,etc.), which increases the health burdenand often the work burden.Inadequate provision of basicservices – day care, schools,vocational training, healthcare,emergency services, public transport,communications, policing and goodinformation on safe building practices.Limited or no safety net to ensurebasic consumption can be maintainedwhen income falls; also to ensureaccess to housing, healthcare andother necessities when these can nolonger be paid for (or fully paid for).Lack of influence over whatgovernment does, includingwhat it does in post-disasterresponses.Limited influence over externalcivil society actors such asinternational aid agenciesduring disaster risk reductionand response.Very limited capacity to pay forhousing which in urban areasmeans living in the worst-quality andmost overcrowded homes in illegalsettlements on dangerous sites lackingprovision for infrastructure and services– so very high levels of environmentalhealth risk.Very limited capacity to cope withstresses or shocks in everyday life– including rising prices or fallingincomes, injuries and illnesses.High risk levels from physical accidents,fires, extreme weather and infectiousdiseases – with risks often increasedby overcrowding.High levels of risk from contaminatedwater, inadequate sanitation, houseflooding from lack of drainage.Unnecessarily high health burden fromdiseases and injuries because of lackof healthcare and emergency response.Very limited capacity to cope withstresses or shocks in everyday life– including rising prices or fallingincomes, injuries and diseases.Low-income survivors often notallowed to move back to their formersettlement and rebuild their homes andlivelihoods.Lack of local input can lead toinappropriate development investmentsor missed opportunities to reducerisk and to build more secure localeconomies and livelihoods.In most cities and many urban centresin low- and middle-income nations,most low-cost housing is on dangeroussites, e.g., at high risk from floodingor landslides. The lack of publicprovision for infrastructure and servicesadds to such risks, particularlyfor flooding.Very limited capacity to cope withdisaster events when they occurincluding lacking assets that are notdamaged or destroyed by the disasterand having no insurance.Housing is often of poor qualityso at risk from storms/high winds,earthquakes, landslides, floods, firesand disease transmission which maycause epidemics.Lack of protective infrastructure againstflooding. Lack of roads, footpaths anddrains inhibiting evacuation whendisaster threatens or happens.Lack of healthcare and emergencyservices that should provide rapidresponse to disaster (and should havehad a role in reducing disaster riskand in disaster preparedness).Very limited capacity to recover fromdisaster, for instance to afford foodand water, rebuild homes andlivelihoods. Lack of documentationoften means not getting post-disastersupport.Little external support for low-incomegroups and their organizations torebuild in ways that reducedisaster risk.International humanitarian actors canoverwhelm local government and civilsociety organizations alike. Lack ofpartnership inhibits good governance.World Disasters Report 2010 – Focus on urban risk21
Strictly under embargo until Wednesday 22 September at 00:01 GMT (02:01 Geneva time)The official statistics on disaster impacts suggest that the damage to, or destructionof, housing (and other assets) is far more serious in high-income nations. But this ismisleading in that damage to or destruction of housing is usually far more seriousin low- and middle-income nations in terms of the number of households affectedand how much they are affected. This does not translate into a large monetary lossbecause most of the homes destroyed or damaged were not worth much in monetaryterms or their monetary value is simply ignored because they are informal dwellings.This is so even though the house is not only the most valuable asset for thoseaffected but also their home, and they receive little or no compensation when it isdamaged or destroyed. Of course, they also have no insurance so they do not figurein any calculation of insurance payments. This is how disasters create or greatlyexacerbate poverty.Each year, millions of households have their homes damaged or destroyed by disasters.For instance, in 2007 there were extensive floods throughout South and South-EastAsia and in many nations in West and East Africa, while Hurricane Felix triggeredfloods in Nicaragua. This pattern was repeated in 2008, from the hurricane season inthe Caribbean, to cyclones in Myanmar and Bangladesh and the devastating Sichuanearthquake in China. In 2009, millions were affected by the earthquake in Sumatra,Indonesia, and the floods in India and the Philippines.Greater consideration is needed of the role that housing plays in urban areas for lowincomegroups such as the hundreds of thousands of slum dwellers rendered homelessby the January 2010 earthquake in Haiti. The value and importance of housing tosuch groups far exceeds its monetary value. What seems to outsiders to be no morethan a shack built mostly of temporary materials is actually the home with all its keyattributes for family and social life, privacy and safety, and is the primary defence forthose living there against most environmental health risks. It may also be the placeof work for some household members and is often the household’s most treasuredasset. As family members build or improve their home, they increase the value oftheir asset and its capacity to protect them from hazards. It is also the means by whichthey get access to income and services – and in urban areas, its location in relation toincome-earning opportunities and services is often more important for low-incomehouseholds than its size, quality or legality. This explains why such a high proportionof informal settlements are on flood plains or steep slopes at risk of landslides, becausethese are the only land sites within a city close to centres of employment that lowincomegroups can occupy.Urban areas present two very specific challenges for housing. The first is that in lowandmiddle-income nations, land prices for housing are usually much higher thanin rural areas. There are also often far more official rules and regulations governingthe acquisition and use of land for housing, which usually restricts land available and22CHAPTER 1Housing and urban disasters
Strictly under embargo until Wednesday 22 September at 00:01 GMT (02:01 Geneva time)Box 1.2 Can Haiti build back better?All eyes are on Haiti to see if some good cancome of the tragedy which overtook the countryon 12 January 2010 when its capital, Portau-Prince,was shaken to its foundations by anearthquake that killed 230,000 people and leftsome 1.5 million people homeless, accordingto Haitian government figures. Can the impoverishednation ‘build back better’ in the years tocome? Can it, in collaboration with the internationalhumanitarian community, restore not justits physical infrastructure but also rejuvenate itsurban governance and risk reduction capability?In a country that has a slum prevalencerate of 70 per cent, there had been previousattempts to coordinate urban planning projectsbetween the Haitian government and internationalaid agencies. But these efforts failed.According to the 2009 UN-Habitat reportStrategic Citywide Spatial Planning, “Lack ofcoordination between the implementing agencieshas been one major reason, but the lack ofpublic participation, weak accountability andtransparency, low staff capacity and the centralizedsystem have contributed to the inertia.”That inertia hopefully evaporated with the12 January cataclysm. The long-term questionnow is how the government and its internationalpartners can implement a post-quake plan comprehensiveenough to cover the needs of not justthe affected population but the entire nation inthe years to come. While short-term relief goalswere met – including the provision of temporaryshelter materials and food – the long-term shelterneeds are complicated by unresolved issuesconcerning land ownership, urban density anddebris clearance to allow families to return tothe sites of their original homes.Designed to hold 250,000 people, Portau-Princegrew to become one of the mostdensely populated cities in Latin America. Its2 million people consumed nearly all of Haiti’sresources. A mass influx to the capital beganin the early 1980s following the swine flu alertworldwide and the subsequent slaughter ofmore than 2,000 native ‘Creole’ pigs – thepeasants’ emergency cash-in-hand.There they built homes with no regulatoryoversight, creating new slum areas and furtherweakening a fragile environment. This unplannedgrowth hindered the immediate rescue effortsbecause there were no access roads betweenstreets, just a patchwork of unmarked ‘corridors’.The capital’s eight municipalities which,before the quake, shared responsibility for citymanagement with numerous central governmentbodies, were even less sure of their rolesand mandates after the quake.“It was, in effect, the collapse of whatwas already a house of cards,” said CharlesClermont, who leads the government-appointedcommission charged with housing and relocation.“We didn’t even have communication. Ontop of that, we had to figure out how to communicatewith the international community. Theyhave their own rules of the game and we hadto figure out how to understand each other.”Much of the success of the reconstructionand recovery effort depends on involvingand engaging the Haitian people themselves.Quake survivors pulled people from the rubblemoments after it happened but they need towork together now and in the years ahead forthe long-term good of their communities. Haitiis limping from emergency to temporary shelterto reconstruction, a process that could takeseveral years before all the people affected bythe quake are re-housed. Some say it will takefive years; others say 25. World Disasters Report 2010 – Focus on urban risk23
Strictly under embargo until Wednesday 22 September at 00:01 GMT (02:01 Geneva time)24CHAPTER 1further increases its price. This is why so much of the urban population in low- andmiddle-income nations lives on land that is illegally occupied or illegally subdivided(i.e., the land-use plan did not get official approval). High land prices also put pressureon local municipalities to open high-risk areas for construction. The second challengeis that housing is not only ‘the home’ but also the ‘access to income’ and ‘access toservices’, and for those with limited incomes, the house’s location in relation to whereits occupants work and children can go to school is as important, or more important,than the quality of the house and the security of the tenure.The pavement dwellers in Mumbai who construct tiny ‘houses’ on the pavement do sobecause their incomes are so low that they cannot afford the cost of commuting fromthe cheapest ‘proper housing’ they could afford. The problem is not unemployment asmost are employed. They are also not ‘recent migrants lacking knowledge of the city’as some have sought to portray them – most pavement dwellers have been in the cityfor many years. The problem is the gap between their incomes and the cost of housingin locations with good access to employment. This is compounded by their lack ofaccess to credit and the lack of incremental housing options (housing that can be builtor extended over time) that are affordable. The same is true in Dharavi, the informalcity of some 600,000 inhabitants which originally formed on the outskirts of Mumbaibut which, as the city grew, became a valuable inner-city location. Housing conditionsin Dharavi are very poor but at the same time, it provides a very good location withregard to income-earning opportunities and cheap accommodation.This point has great relevance for any post-disaster reconstruction because most ofthose whose homes are damaged or destroyed want to return to the same location dueto the access it provides both to income-earning opportunities and services, and totheir social networks with neighbours. To relocate those made homeless by a disasterto ‘safe’ places far from where they have income-earning opportunities simply compoundsstill further the disaster’s impact and most will not stay there. It also has greatrelevance for any initiative to improve housing conditions because most households inan informal settlement are far better served by in-situ upgrading than by moving themto new housing in a new – almost always worse – location. In Haiti, as this report goesto press, there is much discussion of decentralizing urban development so the highdensityinformal settlements in and around Port-au-Prince are not rebuilt. But sucha decentralization will only work if underpinned by a decentralization of livelihoodand income-earning opportunities – which is unlikely to happen. Households need achoice: some may wish to leave owing to the risks and trauma to their families, whileothers prefer to remain in, or return to, the areas where they had previously made theirhomes. And it should not be only those with proof of land and housing ownership thatget help for rebuilding.A final complication for disaster response is that the very poor quality of so muchhousing prior to the disaster, including inadequate infrastructure and the fact that it
Strictly under embargo until Wednesday 22 September at 00:01 GMT (02:01 Geneva time)was ‘illegal’, makes reconstruction very difficult. There is rarely a map of the settlementshowing plots and plot boundaries. There is often little infrastructure to repair.The sites are frequently difficult or impossible to reach with trucks or any constructionequipment as there are no paved roads and they are often built on challenging terrain(on swamps or hills). In most informal settlements, there is no register of who ownseach plot and most of the population has no formal documentation. And there is thecomplication that many are tenants and their ‘landlords’ (who may also be occupyingthe land illegally) want to retain control of any reconstruction. If the informal settlementis on land that has become valuable, a further complication is that developerswant to displace the population from it and governments often support them in evictingthe residents.External agencies also wish to obtain adequate accommodation for those whose homeshave been damaged or destroyed – but they are rarely very good at dealing with all thecomplications mentioned above. And in most instances, they will face opposition frommiddle- and upper-income groups, government agencies, landlords and often developersregarding the solutions that work best to enable low-income groups to reconstructtheir homes and settlements. We know the good principles on which housing reconstructionshould be based – the greater the control of local residents, both individuallyand as a community, the more successful the support is likely to be. The InternationalFederation of Red Cross and Red Crescent Societies has specified key principles: “It isincreasingly recognized that the meeting of shelter needs in the aftermath of disastershould be seen as a process of ‘sheltering’ undertaken by the affected household withvarying types of material, technical, financial and social assistance as appropriate ratherthan simply the provision of a pre-determined shelter ‘product’.” Even if governmentsunderstand this important principle, it does not mean they will allow it to be implementedon the ground. Governments may prefer to control the emergency shelterfinance that is being made available but their record in housing provision is poor. Topdownhousing provision tends to be expensive, often of inadequate quality, with insufficientflexibility to take on board community requirements, and in a disadvantageouslocation if resettlement is involved.What you do after a disasterTo state the obvious, disaster response should centre on the needs and priorities ofthe survivors – and others who are negatively impacted. In low- and middle-incomenations, very few home-owners will have insurance to help fund rebuilding or reconstructionand most people will have very limited savings or assets to tide them overuntil they can get back to paid work. So helping them to re-establish sources of incomeand livelihoods rapidly is a high priority. In most instances, a high proportion willwant to return to their damaged or destroyed settlements and there re-establish theirhomes and their own organizations. They need to feel supported as they do so – supportedto meet, to network, to give space for their community organizations, oftenWorld Disasters Report 2010 – Focus on urban risk25
Strictly under embargo until Wednesday 22 September at 00:01 GMT (02:01 Geneva time)26CHAPTER 1to share their grief and in their own time begin to participate in rebuilding. Theseresponses have to strengthen and support the survivors’ own organizations. They haveto keep women at the centre of these associations, even though this is often difficultas priorities and actions are dominated by more aggressive and well-connected groups.This is not easy. People have been affected in many different ways and may have differentpriorities; they may see other affected groups as competitors in seeking fundsor support from different external organizations. Good practice means involving localpeople right at the outset of any discussion of rebuilding and in managing the shiftfrom relief to reconstruction.The shift from immediate response to reconstruction in an urban environment is nevereasy. Rarely does this help those most affected with their two most pressing priorities:supporting the survivors to rebuild their homes and their livelihoods. After a disaster,the needs for medical treatment, healthcare, food and water, and often temporaryaccommodation are so obvious. But the disaster does not undo the often antagonisticrelationships between local governments and the urban poor and their informal communitiesand livelihoods. Disaster relief agencies cannot address the root causes of whyso much of a city’s population was so heavily impacted – because they lived in illegalsettlements with poor-quality homes on dangerous and disaster-prone sites to whichthe government had refused to provide infrastructure and services. Disaster relief agenciesoften fail to secure safer, well-located land sites for housing where those who losttheir homes in informal settlements can build; such sites are too valuable and thosein government and higher-income groups would not support this. All they can offerare sites far away that do not have good access to income-earning opportunities. So allthe inequalities and difficulties that faced the urban poor prior to the disaster remainto constrain post-disaster responses. As the Asian Coalition for Housing Rights hasnoted, unless disaster aid quickly learns to work with the untitled, the unregistered,the unlisted and the undocumented, it can support and even reinforce the inequalitiesthat existed prior to the disaster.Strengthening and supporting local action fordisaster risk reduction in urban areasGood development, good disaster risk reduction and good adaptation to climatechange are all intensely local with many links and complementarities between them.They need effective local institutions that are accountable to citizens including thoseliving in informal settlements. It all amounts to a difficult challenge for the internationalagencies that fund development and will be difficult for those assigned theresponsibilities of funding climate change adaptation. All such agencies are under pressureto keep down staff costs and to have exit strategies. All such funding agencies areonly as effective as the local intermediaries that they fund. The strong emphasis of thisyear’s World Disasters Report is on supporting community-level initiatives because inalmost all low-income and most middle-income nations, this is the only way to ensure
Strictly under embargo until Wednesday 22 September at 00:01 GMT (02:01 Geneva time)that the needs and priorities of those most at risk from disaster are addressed. But largedevelopment assistance agencies frequently do not know how to support communitylevelorganizations – indeed, often they never talk to them; they were set up to channellarge sums to national governments, not to support the myriad community and localgovernment initiatives that can reduce disaster risk and that need modest externalsupport.Where city and municipal governments have sufficient capacity, focus on their lowincomehouseholds and have good relations with their citizens, the possibilities fordisaster risk reduction are greatly enhanced. These cities and municipalities provideus with the evidence that an urbanizing world need not ‘urbanize’ disaster risks. Mostdisaster risk reduction is within their conventional urban management roles – forinstance, in land-use management, in strategic urban planning and in setting andenforcing regulations for land use, buildings and infrastructure. So it is the competenceand capacity of city and municipal governments to work with and support their lowincomepopulations that defines whether urbanization is associated with disaster risk.It is down to the governments of high-income nations to agree to the greenhouse gasemission reductions that are needed to avoid ‘dangerous climate change’; of course, thisdepends too on low-carbon development paths for successful low- and middle-incomenations but their governments will not agree to these unless high-income nations demonstratetheir commitments. And, again, it is down to the competence and capacity ofcity and municipal governments to work with and support their low-income populationsthat will define whether the climate change impacts that cannot be avoided doactually result in urban disasters.This report has enough examples of good practice from low- and middle-incomenations to show that urban disaster risk reduction is possible but these are still the exceptions.Good local land-use management supported by good local risk assessments cantransform urban plans into disaster reduction plans as unsafe sites are avoided or madesafe. Good upgrading programmes for informal settlements that are well informed inrisk reduction measures can dramatically reduce disaster risk. A framework of supportfrom higher levels of government and international agencies is required. Learning networksneed to be nurtured for city authorities, urban professionals and citizen groups.Overall, this needs a sea-change in the preparedness and capacity of most bilateral aidagencies to work in urban areas with urban organizations and local authorities.This <strong>chapter</strong>, including Box 1.1, was written by David Satterthwaite, Senior Fellow, InternationalInstitute for Environment and Development (IIED). Box 1.2 was written byKathie Klarreich, a freelance journalist and Haiti specialist.World Disasters Report 2010 – Focus on urban risk27
Strictly under embargo until Wednesday 22 September at 00:01 GMT (02:01 Geneva time)Asian Coalition for Housing Rights (ACHR). Tsunami: How Asia’s Precarious CoastalSettlements are Coping after the Tsunami. Housing by People in Asia 16. Bangkok:ACHR, 2005.Bapat, M. Poverty Lines and Lives of the Poor; Underestimation of Urban Poverty, thecase of India. Working paper. London: International Institute for Environment andDevelopment (IIED), 2009.Cairncross, S. and Alvarinho, M. ‘The Mozambique floods of 2000; health impactsand response’ in Few, R. and Matthies, F. (eds.), Flood Hazards and Health. London:Earthscan Publications, 2006.Centre for the Epidemiology of Disasters. EM-DAT database. Available online: www.emdat.be.Dodman, D., Hardoy, J. and Satterthwaite, D. ‘Urban Development and Intensiveand Extensive Risk’, background paper for United Nations International Strategyfor Disaster Reduction (UNISDR), Global Assessment Report on Disaster RiskReduction: Risk and Poverty in a Changing Climate, Geneva: UNISDR, 2009.Douglas, I. et al. ‘Unjust waters: climate change, flooding and the urban poor in Africa’in Environment and Urbanization, Vol. 20, No. 1, pp. 187–206, 2008.Hardoy, J.E., Mitlin, D. and Satterthwaite, D. Environmental Problems in anUrbanizing World: Finding Solutions for Cities in Africa, Asia and Latin America.London: Earthscan Publications, 2001.International Federation of Red Cross and Red Crescent Societies (IFRC). GlobalShelter Programme. Geneva: IFRC, 2009.Martinez, J. et al. ‘Trends in urban and slum indicators across developing world cities,1990–2003’ in Habitat International, Vol. 32, pp. 86–108, 2008.Munich Re Group. Natural Disasters according to Country Income Groups, 1980-2004.Munich: Munich Re NatCatSERVICE, 2005.Patel, S. ‘Reflections about disasters and the poor: Exploring possibilities to addresspreparedness and management by communities of the urban poor’, unpublishedbackground paper, 2010.Potts, D. ‘The Slowing of Sub-Saharan Africa’s Urbanization: Evidence andImplications for Urban Livelihoods’ in Environment and Urbanization, Vol. 21,No. 1, pp. 253–9, 2009.28CHAPTER 1Sources and further information
Strictly under embargo until Wednesday 22 September at 00:01 GMT (02:01 Geneva time)Ravallion, M., Chen, S. and Sangraula, P. New Evidence on the Urbanization of GlobalPoverty. Policy Research Working Paper WPS4199. Washington DC: World Bank,2007. Available online: www-wds.worldbank.org / external / default / main?pagePK=64193027&piPK=64187937&theSitePK=523679&menuPK=64187510&searchMenuPK=64187283&theSitePK=523679&entityID=000158.Roberts, D. ‘The Disaster Management Municipal Adaptation Plan in Durban’, backgroundpaper for the World Disasters Report: Focus on urban risk, 2010.Sabry, S. Poverty Lines in Greater Cairo: Under-estimating and Misrepresenting Poverty.Poverty Reduction in Urban Areas Series Working Paper 21. London: IIED, 2009.Satterthwaite, D. ‘Urban myths and the mis-use of data that underpin them’, inBeall, J., Guha-Khasnobis, B. and Kanbur, R. (eds.), Beyond the Tipping Point:Development in an Urban World. Oxford: Oxford University Press, 2010.Satterthwaite, D. The Transition to a Predominantly Urban World and its Underpinnings.Human Settlements Discussion Paper. London: IIED, 2007.Society for the Promotion of Area Resource Centres (SPARC). “We the Invisible”; aCensus of Pavement Dwellers. Mumbai: SPARC Mumbai, 1985.United Nations. World Urbanization Prospects: the 2007 Revision. CD-ROM edition,data in digital form (POP / DB / WUP / Rev.2007). New York: UN Department ofEconomic and Social Affairs, Population Division, 2008.UN Human Settlements Programme (UN-Habitat). State of the World’s Cities 2010/2011– Bridging The Urban Divide. London and Washington DC: UN-Habitat, 2010.UN-Habitat. Strategic Citywide Spatial Planning. Nairobi: UN-Habitat, 2009.UN-Habitat. Water and Sanitation in the World’s Cities; Local Action for Global Goals.London: Earthscan Publications, 2003.UNISDR. Global Assessment Report on Disaster Risk Reduction: Risk and Poverty in aChanging Climate. Geneva: UNISDR, 2009.World Disasters Report 2010 – Focus on urban risk29
Strictly under embargo until Wednesday 22 September at 00:01 GMT (02:01 Geneva time)30CHAPTER 2
Strictly under embargo until Wednesday 22 September at 00:01 GMT (02:01 Geneva time)Urban disaster trendsIt is well known that more than half the world’s population lives in urban areas. Perhapsless well known is that most of the world’s urban population and most of its largestcities are now in low- and middle-income nations where an estimated 2.6 billion urbandwellers, out of an estimated 3.5 billion worldwide, live. This is unprecedented since,for millennia, most of the urban population and most of the largest cities have been inthe wealthiest nations. With one in three of the world’s total population now living incities and towns in low- and middle-income nations, attention should focus on howwell these cities and towns protect their inhabitants and enterprises from disasters. Itshould be borne in mind that even though the United Nations Human SettlementsProgramme (UN-Habitat) claimed earlier this year that 227 million people no longermeet the limited criteria for defining slum dwellers, it still acknowledged that theirnumbers had increased from 776.7 million in 2000 to 827.6 million in 2010, andthese people are among the most vulnerable to a wide range of urban risks stemmingfrom natural hazards, disease and inadequate support services in areas such as transportand health.One of the key elements to reduce disaster risk is to better understand how urban areasare at risk and how these patterns of risk differ from rural areas. Part of this risk profilerequires a detailed knowledge of past disaster-related events in the city in question,showing the spatial distribution of losses and damages. However, this information isavailable at the urban level in only a handful of cities. A part of the capability of governmentsand people to reduce risk and vulnerability is influenced by the availabilityof accurate information about the risks to their city and, at present, there is a greatdeficiency with regard to accurate monitoring and reporting of urban disaster trends.Urban growth and its relation to disastersFigure 2.1 shows the growth in the world’s urban population from 1950 to 2010 andthen what the United Nations (UN) projects for 2030. The projections suggest that,from 2010 to 2030, almost all the growth in the world’s population will be in urbancentres in low- and middle-income nations and that Asia will undergo massive urbangrowth. For many nations, the most recent data are from censuses held around 2000,as the results from the new round of censuses that took place in or around 2010 arenot yet available. So some of the projections may prove to be too high if, for instance,urban populations grow more slowly due to rates of natural increase decreasing morerapidly than expected or if economic stagnation or decline reduces or stops rural-tourbanmigration. But even if this happens, the scale of the change in less than a centuryis phenomenal:A global urban population that grew from 737 million in 1950 to around 3.5billion today and to an expected 5 billion by 2030.Photo opposite page:Slum dwellers in thecities of low- andmiddle-income nationsare among the mostvulnerable to risksstemming from naturalhazards, disease andinadequate supportservices. Rocinha,shown here, is thelargest favela, or slum,in the Brazilian megacity,Rio de Janeiro,and is home to anestimated 250,000people.© BenoitMatsha-Carpentier/IFRCWorld Disasters Report 2010 – Focus on urban risk31
Strictly under embargo until Wednesday 22 September at 00:01 GMT (02:01 Geneva time)32CHAPTER 2A shift from most of the urban population being in high-income nations (1950)to most of the urban population being in low- and middle-income nations (2010and beyond).Africa with 4 per cent of the world’s urban population in 1950 and 15 per centby 2030.Asia with 32 per cent of the world’s urban population in 1950 and 55 per centby 2030.Figure 2.1Growth in urban population globallyand by regionPopulation (millions)5,0004,5004,0003,5003,0002,5002,0001,5001,00050001950 1970 1990 2010 2030Source: UN Population Division (2005)North AmericaLatin America andthe CaribbeanEuropeAsiaAfricaLow- andmiddle-income nationsHigh-income nationsWorldTwo aspects of the rapid growth in the world’s urban population are the increase in thenumber of large cities and the historically unprecedented size of the largest cities. Just twocenturies ago, there were only two ‘million-cities’ (cities with 1 million or more inhabitants)– London and Beijing (then called Peking). By 1950, there were 75; by 2008, 431. A largeand increasing proportion of these million-cities are in Africa, Asia and Latin America. Theaverage size of the world’s largest cities has also increased dramatically as Figure 2.2 illustrates.While there are examples of cities over the last two millennia that had populations of1 million or more inhabitants, the city or metropolitan area with several million inhabitantsis a recent phenomenon – London being the first to reach this size, in the second half of the19th century. By 2000, there were 17 ‘mega-cities’ with more than 10 million inhabitants.However, the economic transformations that underpin these statistics on rapid urbanchange are just as impressive – the six-fold increase in the size of the world economybetween 1950 and 2010 and the fact that most of this increase came from the growthin industrial production and services largely located in urban areas. There is a strongeconomic logic underpinning rapid urbanization (see Figure 2.3). Today, around 97percent of the world’s gross domestic product (GDP) is generated by industry and services,
Strictly under embargo until Wednesday 22 September at 00:01 GMT (02:01 Geneva time)about 65 per cent of the world’s economically active population works in industry andservices and a very high proportion of all industry and services are in urban areas. Mostof the world’s largest cities are in the world’s largest economies.Figure 2.2The change in the average population size of the world’s 100largest cities, 1800 to 2000Population (millions)766.305432102.000.730.18 0.281800 1850 1900 1950 2000Source: Satterthwaite (2007)Figure 2.3Changes in the proportion of GDP for low- and middle-income nations,1950–2005%10090807060504030201001950 1955 1960 1965 1970 1975 1980 1985 1990 1995 2000 2005% GDP from industryand services% labour force in industryand services% level of urbanizationSource: Satterthwaite (2007)There is a very large deficit in provision for the infrastructure and services that reducedisaster risk for much of the population in Latin America, Africa and Asia. But much ofthe reason for this is institutional failure and governance failure. Although rapid urbanWorld Disasters Report 2010 – Focus on urban risk33
Strictly under embargo until Wednesday 22 September at 00:01 GMT (02:01 Geneva time)34CHAPTER 2growthis often seen as a problem, it is generally the nations with the best economic performancethat have urbanized most in the last 50 years. All the world’s wealthiest nationsare predominantly urbanized; almost all the world’s poorest nations are predominantlyrural. In addition, there is often an association between rapid urban change and betterstandards of living. Not only is most urbanization associated with stronger economiesbut, generally, the more urbanized a nation, the higher the average life expectancy and theliteracy rate, and the stronger the democracy, especially at local level. Of course, beyondall these quantitative measures, cities are also centres of culture and of social and politicalinnovation. Mega-cities may appear chaotic but most have life expectancies and provisionfor piped water, sanitation, schools and healthcare that are well above their national average– even if the aggregate statistics for each mega-city can hide a significant proportionof their population living in very poor conditions. Some of world’s fastest-growing citiesover the last 50 years also have the best standards of living within their nation.Looking over the trends of large-scale disasters of the last decade from the Centre forResearch on the Epidemiology of Disasters (CRED) database (EM-DAT), it seems thatregions of the world that are more urbanized tend to have fewer deaths from natural disasters,but higher economic losses. This is understandable, given that urban areas concentratehigh-value assets and that well-governed cities, especially those in high-incomecountries, should enormously reduce deaths and serious injuries – even if it is often lesseasy to guard against economic losses. It is noteworthy that cyclones, floods and earthquakesproduce massive economic costs in Europe and Japan but very few deaths. BothEurope and Japan are highly urbanized, Europe has 72 per cent of the population livingin cities and Japan, 66 per cent. In 2007, 65 disasters reported in Europe accounted for1 per cent of the deaths worldwide but 27 per cent of the economic damages. In 2007,Japan had the highest reported economic damages for one single earthquake event on16 July, costing US$ 12.5 billion whereas nine people were reportedly killed. In Africa,northern Africa has 21 per cent of the continent’s population and is the only highlyurbanized region (51 per cent of its population lives in cities). In 2007, northern Africahad 12 per cent of the disasters that affected the continent, 6 per cent of affected persons,yet 45 per cent of economic damages for all of Africa. In the period from 2000 to2006, northern Africa had 13 per cent of disasters, 1 per cent of affected persons, yet75 cent of damages recorded for the continent as a whole.Identifying ‘urban’ disasters and their impactsCities, with their concentration of people, buildings, infrastructure and economic activities,are the locus of both large and small-scale disasters. A look at the major disasters overthe last ten years highlights that large-scale disasters, which affect a whole region, usuallyhave an urban component to them (see Table 2.1). Some disasters could also be called‘urban’ disasters, since the great majority of damages are concentrated in city centres. Thisis made evident by the recent earthquake in Port-au-Prince, Haiti and Hurricane Katrinain New Orleans, where urban areas sustained most of the losses and damages.
Strictly under embargo until Wednesday 22 September at 00:01 GMT (02:01 Geneva time)With the exception of the South Asian tsunami in 2004, many of the deaths and lossesfrom earthquakes have been in cities. Of all large disasters, seismic events have killedthe greatest number of people in recent years, averaging 50,184 people per year from2000 to 2008. Flood events have affected the largest numbers of people, averagingTable 2.1 Large disaster events over the period 2000–2010 impacting on citiesPopularnameHaitiearthquakeSichuanearthquakeCycloneNargisJavaearthquakeKashmirearthquakeHurricaneKatrinaMumbaifloodsSouth AsiantsunamiBamearthquakeEuropeanheatwaveDresdenfloodsGujuratearthquakeMaincountriesaffectedHaitiDate ofevent12 January2010Type ofhazardChina 12 May 2008 EarthquakeMyanmar 2 May 2008Main citiesaffectedTotalnumber ofdeathsTotalnumber ofaffectedTotaldamagesUS$Earthquake Port-au-Prince 222,570 3,400,000 n / aTropicalcycloneBeichuan,Dujiangyan,Shifang,Mianzhu,Juyuan,Jiangyou,Mianyang,Chengdu,Qionglai,Deyang87,476 45,976,596 85 billionYangon 138,366 2,420,000 4 billionIndonesia 27 May 2006 Earthquake Yogyakarta 5,778 3,177,923 3.1 billionPakistanUnited States8 October200529 August2005Earthquake Muzaffarabad 73,338 5,128,000 5.2 billionTropicalcycloneNew Orleans 1,833 500,000 125 billionIndia 26 July 2005 Flood Mumbai 1,200 20,000,055 3.3 billionIndonesia, SriLanka, India,Thailand,Malaysia,Maldives,MyanmarIranItaly, France,Spain,Germany,Portugal,SwitzerlandGermanyIndia26 December200426 December2003Earthquakeand tsunamiBanda Aceh,Chennai(somedamages)226,408 2,321,700 9.2 billionEarthquake Bam 26,796 267,628 500 millionSummer 2003 Extreme heat Various 72,210 Not reported Not reported11 August200226 January2001Flood Dresden 27 330,108 11.6 billionEarthquakeBhuj,Ahmedabad20,005 6,321,812 2.6 billionSource: EM-DAT: The OFDA / CRED International Disaster Database (www.emdat.net), Université catholique de Louvain –Brussels – Belgium. Complied by author.World Disasters Report 2010 – Focus on urban risk35
Strictly under embargo until Wednesday 22 September at 00:01 GMT (02:01 Geneva time)36CHAPTER 299million people per year between 2000 and 2008. While we do not know how manypeople affected by floods live in urban areas, we can understand that it must be a significantproportion.While it is possible to identify certain disasters as urban disasters, it becomes morecomplicated to assess what proportion of the total losses of a disaster are in urban areasand what proportion are outside the urban areas. At the global or regional scale, wehave little sense of what proportion of deaths and injuries are within urban centres.For instance, Cyclone Nargis caused an estimated 140,000 deaths in Myanmar andhad serious impacts in urban centres including Yangon, but we have little idea of whatproportion of these impacts were in urban areas.Precise information about impacts in urban areas for a disaster that affected a region isnot widely reported, yet it is important in order to understand who, and what, has beenaffected. Consider, for example, the 1988 floods in Bangladesh, which inundated 52 percent of the country. This flood also impacted Dhaka, the nation’s capital, which then hadabout 6 million residents. Flood waters covered 85 per cent of the city for several weeks.For two weeks Dhaka was completely cut off, with depths of inundation ranging from0.3 to more than 4.5 metres. Across the country, 45 million people, of a total populationof 110 million, were affected by the floods. It is estimated that between 2.2 and 4million of the affected were in Dhaka, or some 30 to 60 per cent of the city’s population.The total death toll is reported to have been around 2,379 deaths for all the affectedregions with 150 deaths in Dhaka. Ten years later, in 1998, floods again affected Dhaka,covering large portions of the city for a two-month period. An estimated 918 peopledied in the 1998 floods, but the number of deaths, if any, that occurred in the capitalwas not reported. We do know that 30 per cent of housing in the Dhaka metropolitanarea sustained damage, and that almost 32 per cent of damages were to houses of thevery poor, while 36 per cent of houses belonging to lower-middle class and poor peoplewere damaged. In one sense, distinguishing between rural and urban deaths and injuriesmight be considered inappropriate in that disaster risk reduction should seek to preventthem all. But this lack of a more spatially precise idea of where deaths and injuries occuralso hinders an understanding of where and how risk reduction should take place.Cities are affected by a wide range of disaster events, which extend beyond our conceptionof ‘natural’ hazards. In African Cities of Hope and Risk, Ben Wisner and MarkPelling used the data available from CRED to identify 166 urban disasters affecting28 African cities between 1997 and 2008. They identified natural hazards such asurban drought, earthquakes, windstorms, floods and extreme temperatures. Floodsare most represented in the data, accounting for one-third of the total 3.3 millionpeople affected by urban disasters in Africa. However, disasters in cities are also largelytechnological hazards. A review of urban disasters shows the wide range of disastersthat occur in African cities, such as aircraft crashes, fires and explosions, ferry-boatsinkings, subsidence and sink holes, illegal dumping of hazardous materials, shack
Strictly under embargo until Wednesday 22 September at 00:01 GMT (02:01 Geneva time)fires and traffic accidents. Building collapses, documented from a media review, showthat in a two-year period (from 2006 to 2008), nine building collapses killed at least100 people. Cities are also the locus of social hazards such as violent crime, riots andterrorism, as well as public health hazards such as HIV / AIDS, which has a higher incidencein cities. Epidemics are a major disaster affecting people in African cities, andit was found that 300,000 people were affected by urban epidemics over the period,linked to poor water quality, inadequate sanitation and flooding.Food insecurity is another type of disaster event that is now recognized as seriously affectingurban dwellers. Urban food insecurity may be a cumulative effect caused by otherdisaster events (see Box 2.1 on food security and Tropical Storm Ketsana) or it may becaused by international economic conditions, such as the rise in food and fuel prices thatpeaked in mid-2008. Large-scale disasters, especially flooding and droughts, may reducefood availability in cities, however urban food insecurity is, for the most part, consideredto be a food access problem, rather than a food availability problem. Generally food isavailable in cities, but the poor cannot afford to buy it, either because prices are too highor their incomes have decreased due to lack of work. UN-Habitat’s data on malnutritionin urban areas collected between 1990 and 2007 show that serious malnutrition has beenwidespread in urban slums of Africa, Asia, Latin America and the Caribbean. In 2007, inthe Democratic Republic of the Congo, 41 per cent of children from poor urban areasMore than 56 percent of the populationof the Philippines,including inhabitantsof the capital, Manila,live on the island ofLuzon. In September2009, Tropical StormKetsana broughttorrential rain to thearea, causing theworst floods in morethan 40 years.© IFRCWorld Disasters Report 2010 – Focus on urban risk37
Strictly under embargo until Wednesday 22 September at 00:01 GMT (02:01 Geneva time)were malnourished, compared with 16 per cent in non-slum urban areas. Since income inurban areas is strongly tied to the opportunity for work, disasters can quickly impact on afamily’s wages and purchasing power for food. Furthermore, since people in cities spend adisproportionate amount of their income on other expenses, such as rent, utilities, transportand education, this leaves an insufficient budget for food. Research in Bangladeshduring the recent commodities crisis shows that in March 2007, daily labourers in urbanareas were able to purchase 5 to 7 kilograms of rice for one day of work, yet one year later,the same day’s work purchased only 3.7 to 5 kg of rice, the main staple food.Box 2.1 Tropical Storm Ketsana and urban food insecurityTropical Storm Ketsana struck the Philippines on26 September 2009 with torrential rains, theheaviest in more than 40 years, causing severeflooding and massive population displacementin urban areas, but also in the surrounding countryside.The joint UN rapid needs assessmentindicated that Luzon, a highly populated islandin the north of the country, inhabited by 56 percent of the total population of the Philippines,had been the hardest hit. More than 2.2 millionpeople were reported directly affected by thetyphoon and approximately 736,000 peoplewere displaced (390,000 staying in 561 evacuationcentres and 346,581 with host families).Most households lost their assets and livelihoods.Estimates indicate that more than 36,728 hectaresof rice fields and 541 hectares of plantationsof high-value commercial crops in centralLuzon were damaged by the heavy rains andflooding caused by the storm. Tropical Storm Ketsanadestroyed about US$ 33 million worth ofroads and bridges, with Metro Manila and centralLuzon the worst hit, leading to major disruptionof food supplies and spikes in food prices. Four visions of urban riskThe definition of what constitutes a disaster, and whether small and everyday disasterevents are included, is important in portraying an accurate vision of risk in cities. Moreproblematic is trying to compare disaster risk across cities and across urban areas indifferent countries. For this, information is most readily available for large cities, andin fact large cities and mega-cities have been the subject of several efforts to understandglobal urban risk. The DesInventar database, which now includes several countries,offers some detailed information that can contribute to a better understanding of riskat the urban district level, but the approach needs to be more widely adopted in orderto provide a more sophisticated understanding of risk across cities.Vision one: Asset exposure to multi-hazardsin large citiesMunich Re Group’s NatCat database was used to prepare a natural hazard risk indexfor 50 of the world’s largest (over 2 million population) and most economically importantcities (city GDP as a percentage of a country’s GDP). The index analysed 3038
Strictly under embargo until Wednesday 22 September at 00:01 GMT (02:01 Geneva time)large cities in low- and middle-income nations and 20 large cities in high-incomenations (see Figure 2.4). This index, which was intended as the basis for discussion,was the first international index for cities to take a multi-hazard perspective includingearthquakes, windstorms, floods, volcanic eruption, bush fires and winter damage.It is composed of three variables: exposure to hazards; vulnerability of the built environment;and value of exposed property. Vulnerability is based on an estimation ofthe vulnerability of the predominant form of residential construction to hazards, thestandard of preparedness and safeguards including building regulations, urban planningin respect of specific hazards and flood protection, as well as building density.The values of exposed property are estimated using the average values per householdand the GDP for commerce and industry.Figure 2.4Hazard risk index for large cities, as defined by Munich Re GroupTokyoSan FranciscoLos AngelesOsaka, Kobe, KyotoMiamiNew YorkHong KongManila, QuezonLondonParisChicagoMexico CityWashington, BaltimoreSeoulBeijingRuhr area, GermanyShanghaiRandstad, NetherlandsMoscowFrankfurtMilanBogotaDhakaSydneyMumbaiBangkokSantiago de ChileIstanbulMedellinTeheranBangaloreCalcuttaBuenos AiresJohannesburgLimaAthensJakartaSingaporeKarachiSao PauloRio de JaneiroCairoBerlinDelhiMadridAlexandriaBagdadLagosSt PetersburgAbidjan0 100 200 300 400 500 600 700 800Total risk indexSource: Munich Re Group (2004)World Disasters Report 2010 – Focus on urban risk39
Strictly under embargo until Wednesday 22 September at 00:01 GMT (02:01 Geneva time)40CHAPTER 2Theindex is most heavily influenced first of all by values of exposed assets and theirdegree of vulnerability. Figure 2.4 shows that Tokyo is, by far, the city at highest risk,followed by San Francisco. Of the 20 highest-risk cities in the index, 17 are in highincomecountries. This makes sense given that the index is trying to gauge the risk forinsurers and thus the value of exposed assets, which is greater in high-income countriesand is an important factor in understanding the potential for economic losses in adisaster.The index shows that for large disasters, the economic costs are often much higherin high-income nations and much of this will be in urban areas, but this is notan indicator of how many people faced serious economic losses and did not haveinsurance. The index does not at all convey the reality that very large numbers oflow-income urban dwellers can lose their homes and most or all their assets fromdisasters; the total monetary value of this is small but the hardships on individualsand families are immense.Vision two: Flood exposure in port citiesAn index published by the Organisation for Economic Co-operation and Developmentranks 136 port cities of over 1 million population with high exposure to one-in-100-year, surge-induced flood events. It looks at the exposure of population and assets, in2005 and those predicted in 2070. Future predictions account for population growth,urbanization, ground subsidence and climatic changes.Population growth and investment in urban infrastructure are the most importantdrivers for increase in exposure to surge-induced floods. This is especially true in developingregions, which are expected to have large growth. Overall, without any increasein water levels, asset exposure could grow eight-fold. Climate changes, as predictedby the Fourth Assessment Report of the Intergovernmental Panel on Climate Change,including increased storm intensity and sea-level rise, also influence increased exposure.The influence of human-induced subsidence due to shallow groundwater extractionis especially important in deltaic cities that are rapidly developing.The index overwhelmingly shows that cities in Asia have the highest exposure to surgeinducedflooding now and in the future. Of the 20 cities with the highest populationexposure in 2005, half are in low- and middle-income nations in Asia. In real numbers,out of the total 38.5 million people currently exposed, 65 per cent of them live inAsian cities. Figure 2.5 shows the top 20 world port cities with exposed populationsin 2005. In the 2070s, the index predicts that 17 out of the 20 cities with the highestpopulation exposure will be in present-day low- and middle-income countries and14 out of 20 of the cities will be in Asia (four in China and two in Bangladesh). Asia’sincreasing dominance in terms of population and asset exposure is a result of increasedurbanization and economic growth during the period, compared with other regions.
Strictly under embargo until Wednesday 22 September at 00:01 GMT (02:01 Geneva time)Figure 2.5Port cities with highest exposed population in 2005 to one-in-100-year,surge-induced flood eventsRotterdam0.75mAmsterdam0.83mMumbai2.78mNew York1.54m Kolkata1.92mDhaka0.84mGuangzhou,Guangdong2.71mShanghai2.35mTianjin0.95mTokyo1.11mNew Orleans1.12mMiami2mAbidjan0.51mAlexandria1.33mBangkok0.90mShenzen0.70mHaiphong0.79mNagoya0.69mOsaka–Kobe1.37mHo Chi Minh City1.93mSource: Nicholls et al. (2008)As a result of projected growth and climatic change over the period, many smallercities will also experience very rapid increases in population exposure, for example,Mogadishu in Somalia and Conakry in Guinea are expected to see population exposureincreased by 12-fold (see Table 2.2). Of the 15 cities that will see the highestpopulation exposure increase, six of them are in sub-Saharan Africa and eight are inAsia. One needs to view these findings with caution, however, because the projectionsfor urban growth over the period may be totally distorted. Some countries, especiallythose in sub-Saharan Africa, may not have had a census for over 20 years. For example,Mogadishu is within a failed state, yet the index envisages it growing hugely.Nonetheless, while absolute exposure is low in some of these cities, a rapid increase inexposure to flooding can lead to increases in small-scale disasters. The potential for lossesat the household level in these cities is especially acute in the fast-growing and low-lyinginformal settlements lacking adequate flood protection and drainage infrastructure.Furthermore, Dhaka, Chittagong and Khulna in Bangladesh, Yangon in Myanmar andNingbo in China are all expected to experience high absolute exposure, meaning thatthese cities will also be at risk for large-scale flooding disasters, which could impact onlarge portions of the city, damaging infrastructure and economic activities.World Disasters Report 2010 – Focus on urban risk41
Strictly under embargo until Wednesday 22 September at 00:01 GMT (02:01 Geneva time)Table 2.2 Port cities with population over 1 million estimated to have highest increasedpopulation exposure to surge-induced floods, 2005 to projected 2070CityCountryPopulation2005 (000s)Populationexposed 2005(000s)Populationexposed 2070(000s)IncreaseQuingdao China 2,817 88 1,851 2,103%Luanda Angola 2,766 1 18 1,800%Dhaka Bangaldesh 12,430 844 11,135 1,319%Mogadishu Somalia 1,320 9 115 1,278%Conakry Guinea 1,425 41 496 1,210%Chittagong Bangladesh 4,114 255 2,866 1,124%Ningbo China 1,810 299 3,305 1,105%Dar-es-Salaam Tanzania 2,676 36 351 975%Yangon Myanmar 4,107 510 4,965 974%Karachi Pakistan 11,608 49 473 965%Douala Cameroon 1,761 11 101 918%Lagos Nigeria 10,886 357 3,229 904%Kulna Bangladesh 1,495 441 3,641 826%N’ampo Republic of Korea 1,102 22 181 823%Port-au-Prince Haiti 2,129 1 8 800%Source: Nicholls et al. (2008)Vision three: City-level data for multi-hazardsThe DesInventar database offers a finer scale of data, with greater information at thelocal level, portraying a more detailed reality of risk facing cities and urban dwellersincluding small-scale events and everyday hazards.Using the city-level database from Cali, Colombia and plotting the events geographically,it is possible to see how the location of flooding events changes over time (see Figure 2.6).The details from Cali (analysed by Colombia’s Seismic Observatory of the South-West orOSSO) show how the pattern of flooding events is related to informal urban expansionin low-lying areas along the rivers, and to subsequent improvements in infrastructureover time. In Cali, risk patterns for small flood events expand concentrically from thecentre of the city outwards to the periphery following the expansion of informal settlements.Additionally, small pockets of risk may be found in central areas ignored byformal urbanization, such as riverbanks and steep slopes.Case studies of cities in Argentina, Costa Rica and Mexico also support the findingsfrom Cali, showing how extensive risk is generated through urban expansion and closelylinked to increased run-off from new urban development, chronic underinvestment incity-wide storm and surface drainage, location of informal settlements in flood-proneareas and inadequate water management for wider watersheds. It is likely that urban42
Strictly under embargo until Wednesday 22 September at 00:01 GMT (02:01 Geneva time)expansion is driving risk in many Asian and African cities, too – and quite possibly evenmore strongly than in the above examples from Latin America, since a much lower proportionof the population in Asian and African cities have infrastructure and services.Figure 2.6Geographic distribution and frequency of registeredflooding events between 1950 and 1990 in Cali, Colombia1950–591960–69RecordBetween2 and 5Between6 and 10Between11 and 201970–791980–89Between21 and 50Source: OSSO (2008)Vision four: Settlement-scale data for fire disastersAnother vision of urban risk is offered by the Monitoring, Mapping and Analysisof Disaster Incidents in South Africa (MANDISA) database, which has records for18,504 fire events in Cape Town, South Africa from January 1995 to the end of 2004.The database, unique to Cape Town, provides an extremely detailed picture of fire risk,and shows us the massive extent of small-scale disaster events that are usually not partWorld Disasters Report 2010 – Focus on urban risk43
Strictly under embargo until Wednesday 22 September at 00:01 GMT (02:01 Geneva time)44CHAPTER 2of urban risk calculations, yet have a devastating effect on households affected by thefire. It also offers an unprecedented opportunity for a better understanding of a city’srisk profile and is an extremely useful resource for defining priorities for risk reduction.Most of the fire incidents in the database are localized small and medium events, withover half destroying ten houses or less. Nonetheless, it is estimated that the fires affected40,000 people in informal settlements over the period in 8,554 events. The cost of thesesmall events is also considerable, not only for the households which lose their house andbelongings in the fires, but also for the emergency and social services of Cape Town. Forexample, in Joe Slovo, an informal settlement of Cape Town, it was estimated that thefires in 2000 cost 702,989 South African rand (worth US$ 91,000 in February 2010).Two-thirds of these losses represented direct losses to the households and the rest wereborne by fire services, social services and the South African Red Cross Society.Historically, devastating fires were common in cities – fires destroyed much of Londonin 1666, Chicago in 1871 and Thessaloniki in 1917, for example – but large fires inresidential areas are no longer commonplace in cities in high-income nations. Fires figureprominently among the disasters that take place in informal settlements – althoughmost may not get recorded, in part because there is no emergency fire service or, if thereis one, it will not serve informal settlements or cannot access them. The reasons forfires are obvious: the use of candles and kerosene lamps for lighting (due to a lack ofelectricity); the use of wood-, charcoal- or paraffin-fuelled cookers; overcrowded housesmade of flammable materials; the high density of population within settlements; thelack of firebreaks; and, frequently, the lack of piped water supplies to help fight fires. Itwas found that fire incidents in Cape Town peak over the summer and holiday monthsof November, December and January due to hot, dry and windy summer conditionscoupled with holiday season activity such as increased alcohol consumption and peopletravelling away from home. Fires also peak again in the winter month of August due topeople bringing stoves inside to warm their houses. Box 2.2 gives the example of a firedisaster in an informal settlement in Hout Bay (close to Cape Town) and explains whyserious fire disasters are commonplace in many informal settlements.Box 2.2 Fires and fire risks in Imizamo Yethu, Hout Bay,South AfricaA fire in February 2004 in Imizamo Yethu,an informal settlement in Hout Bay, destroyed1,200 homes and left some 5,000 peoplehomeless. The settlement was created in1990 when forestry land was converted intoan 18-hectare site for 429 housing plots withservices. Imizamo Yethu means ‘through ourcollective struggle’. It is a mix of brick housesand shacks. It has piped water, mostly throughpublic taps – but the supply is irregular and atthe time of this fire, there had been no waterin the piped system for the previous 24 hours.The fire brigade was called but only half anhour after the fire started (many people did not
Strictly under embargo until Wednesday 22 September at 00:01 GMT (02:01 Geneva time)know the phone number) and the fire enginescould not access some areas because therewere no roads or because people had put theirpossessions in the road.The settlement has had other serious fires– for instance, before the February 2004 fires,there had been fires which destroyed between40 and 90 buildings in 1995, 1997, 2001and 2003. In 2008, about 23 houses wereburnt down in February, 60 in August, 200 inlate November and 200 in early December.The initial causes of these fires are oftennot clear but the widespread use of candles forlighting and open fires or dangerous paraffinstoves for cooking and heating is clearly partof the reason. The close physical proximity ofbuildings and the many that are made of flammablematerials help explain why fires spreadfrom house to house – although many of themore severe fires here and in other informalsettlements in Cape Town are also associatedwith high winds. The vulnerability gap: How trends in disasters fitwithin a broader picture of risk and vulnerabilityOne thing these different visions of urban risk have in common is that risk we areexperiencing in cities both today and in the future are produced over time, throughthe economic processes of urban development and various decisions taken at differenttimes by the authorities and the citizens. What we see as risk in cities, such as growth ininformal or illegal settlements, inadequate infrastructure or services, building on sitesat risk from high winds, floods or landslides, or building with flammable materials, isactually caused by a ‘vulnerability gap’. On one side of the gap is the lack of knowledgeor financial capacity and sometimes willingness of urban authorities to reduce vulnerabilities.Priorities in cities for economic growth, urban expansion and the fact that thewell-off in cities may not be overly vulnerable to disasters thwart efforts to reduce risk.On the other side of the vulnerability gap are the poor urban communities, who dowhat they can to reduce their vulnerability, but ultimately are limited in their financialand political capability to reduce the risk they face.Box 2.3 shows how in Istanbul, Turkey this vulnerability gap has emerged over time toproduce a city highly vulnerable to earthquakes and flood hazards. As in Istanbul, thisvulnerability gap in cities can eventually be narrowed as governments understand betterthe risks and develop the capability to take actions to reduce vulnerability in waysthat are accountable to everyone in the city.Box 2.3 The vulnerability gap in Istanbul, TurkeyIstanbul, the largest city and centre of productionin Turkey, is highly vulnerable to earthquakes,landslides and flood hazards. Thisvulnerability is partly a factor of Istanbul’slocation, lying just north of the seismically activeAnatolian fault line, but it is the precarious andWorld Disasters Report 2010 – Focus on urban risk45
Strictly under embargo until Wednesday 22 September at 00:01 GMT (02:01 Geneva time)fast-growing urban environment created overrecent years due to the absence of strategicplanning and informal development that hasresulted in elevated risk. In 1950, Istanbulhad a population of 1.16 million; today it ishome to 12.5 million people and producesone-quarter of the country’s GDP. Since the1999 Izmit earthquake, which killed more than17,000 people and impacted partly on theeastern edges of Istanbul, the city has been wellaware that another devastating earthquake willhappen and the next time possibly with evengreater impact and closer to Istanbul.In addition to earthquakes, flooding is alsobecoming a problem. Throughout the city, industries,residences and even major transportarteries are located on riverbeds and riverbanks.Small-scale flood events are a regularoccurrence, and local news channels periodicallyreport that one or two people have diedin flash floods. In September 2009, the heaviestrainfall recorded in Istanbul in 80 years causedflash flooding leading to the deaths of at least40 people and to US$ 550 million in damages.The bodies of seven women were discoveredin Bagcilar, a working-class suburb. They haddrowned in a minibus that was taking them tojobs at a textile factory.The vulnerability of Istanbul to multiple hazardstoday, in 2010, is a result of decisionsand actions about urban development madeover the last 60 years. Looking at the exampleof housing production in Istanbul shows us howa vulnerability gap is produced over time.Starting from the first waves of immigrationinto Istanbul in the 1940s and continuingthrough the 1980s, housing was producedthrough informal building, called gecekondu(meaning ‘built overnight’). Different versionsof amnesty laws throughout the years (1949,1953, 1963, 1966, 1976, 1983) effectivelygave many occupiers the ‘right to use’ of theland, and municipalities provided services tothese areas and undertook upgrading of publicinfrastructure. In 1984, a law was passed thatallowed the building of gecekondu areas upto four storeys, which dramatically transformedthe landscape of the city from single-storeygarden plots built by families themselves tomulti-storey apartment buildings built by smallscaledevelopers. Today, it is estimated that70 per cent of the housing stock is either illegalor legalized and much housing has been builtwith no supervision for earthquake buildingcodes. If a 7.5 magnitude earthquake (similarto the one in 1999) were to occur, it is estimatedthat of approximately 800,000 buildingsin Istanbul, 25 per cent would have moderatedamage, 10 per cent would have extensivedamage and 5 per cent could be expected tocollapse completely.In the past ten years, since the great earthquakeof 1999, the government has undertakenseveral initiatives to try and reduce theearthquake risk in Istanbul, including urbanmaster plans for earthquake risk reduction,legislative changes regarding building supervision,mandatory earthquake insurance andmandates for municipalities to undertake urbanregeneration projects to replace vulnerablebuildings. Thus, on one side of the vulnerabilitygap, the political will and the expertise forrisk reduction are now present in Istanbul, yetthe capacity for implementation is still lackingas these government initiatives have had littleimpact on the ground thus far.The other side of the gap – people’s abilityto reduce risk – is limited by many factors,including their perception of risk, their knowledgeof earthquake-safe building techniques,complicated ownership structures and financialconstraints. For example, to make existingbuildings safer, authorities have proposedretro fitting to meet earthquake safety standards.46
Strictly under embargo until Wednesday 22 September at 00:01 GMT (02:01 Geneva time)However, the incentive for owners to retrofit isvery low for an earthquake that may or maynot happen over the next 50 years. The costfor retrofitting is high and amounts to little financialreturn in terms of increased propertyvalue or rental value; furthermore, multipleowners must agree and the building must bevacated for several months.The Greater Municipality of Istanbulhas also started to earmark gecekonduareas for rehabilitation, under the GreaterMunicipalities Law (Law No. 5216, 2004),which gives authority for the “vacating anddemolishing of dangerous buildings and allother ‘non-conforming’ structures”. This hasled to forced evictions and massive threatsof eviction across the city, where gecekonduareas will be bulldozed and rebuilt by theMass Housing Adminstration, leading to thelikely displacement of poor urban dwellers.While relocation into new earthquake-safeareas is planned, the new houses – even thoughsubsidized – are too far away from jobs formost people to afford, so people are left homeless.Thus rehabilitation may physically reducethe vulnerability of the built environment of thecity, yet it is dramatically increasing people’slevel of poverty and exclusion. ConclusionUrban vulnerability is generated differently at the scales of the individual, household,community and city. City-scale investments, for example, in flood drainage may succeedin protecting core functions but can also generate vulnerability for the poor. InDelhi, a lack of foresight has led to the construction of storm drains during a housingcrisis and, not surprisingly, the colonization of drains by landless informal settlers. Thedrains now generate flood risk among the poor while helping protect the wider cityfrom flooding. Identifying and reducing vulnerability is no easy task in an era of rapidurbanization.Historically, the focus at city level has always been on physical over social infrastructure.This is beginning to change as city authorities recognize the importance of socialsafety nets (including support for the elderly and homeless), access to good-qualityhealth and education, and implementation of building standards.The commoditization of urban life means that, in contrast to more rural contexts,money is required to meet even the most basic of needs – water, food and shelter.This restricts the ability of the vulnerable poor to accumulate assets and to protectthemselves from hazard. It also makes it difficult to recover from disaster, magnifyingimpact where the loss of accumulated assets, such as a dwelling, can set back householddevelopment irretrievably.However, looking at the trends for the future, we see that increasing urbanization alsobrings the potential to reduce the losses from disasters in the long term even though itmay increase disaster losses in the short term. Rapid urbanization, of the kind that ishappening in parts of Asia and Africa, will, in the short run, most likely increase lossesWorld Disasters Report 2010 – Focus on urban risk47
Strictly under embargo until Wednesday 22 September at 00:01 GMT (02:01 Geneva time)This informallybuilt settlement inKaradolap, Istanbul, isslated to be bulldozedand replaced withformally built houses.In part, the reasonfor this is an effort toreduce earthquakerisk, but this willdisplace long-timeresidents of the area,as most of them willnot be able to affordto purchase the newhouses in this area.© Cassidy Johnsonfrom disasters. This is partly because urbanization is happening at such a fast rate thatgovernments are not able to keep pace in managing disaster risk. Floods, earthquakesand the impacts of climate change are likely to cause more deaths and damages inrapidly growing cities with high exposure to natural and public health hazards. Industrialgrowth will bring with it more technological hazards. However, once urban areasbecome more consolidated, and likely more wealthy, it will be possible for governmentsto implement risk reduction measures to protect people. This is assuming thatgovernments will want to act in good faith and in a way that is accountable to all urbanresidents, wealthy and poor.The availability of information on urban disasters is still quite poor. At present, it is notpossible to understand the number of urban disasters, the extent of disaster impacts onurban areas or how trends in urban disasters differentiate between global regions. Theproblem of climate change and how it will affect cities shows some promise for betterregional data on urban risk. However, the profile of hazards that are studied underclimate change are limited and do not include the full range that would encompass adisaster’s perspective.48
Strictly under embargo until Wednesday 22 September at 00:01 GMT (02:01 Geneva time)The focus on assets, especially higher-level indicators like economic or insured losses,as a major factor in determining disaster risk is providing a deceptive view of how disastersare actually impacting on people, especially poor households in cities. If we areto look at risk at the household level and affecting the urban poor, the types of eventsthat would seriously impact on people’s lives and their ability to recover such as assetslost, days of work and school missed, increased expenditure on food and prevalence ofsickness, we would get a different risk picture with poor urban dwellers at highest risk.More detailed understanding of urban risks is needed at two levels. First of all, at thescale of the individual city, where more data are needed such as that provided by theMANDISA database. Second, a disaggregated view of risk should also be pursued atthe urban district level as per the DesInventar model, to improve analysis of small,everyday disasters in order to better understand more subtle but important variationsin risk which, in turn, will enable more appropriate disaster risk reduction measuresto be put in place around often ‘unseen’ or unrecorded events. This can be invaluablefor urban programming and provide a full perspective on the extent of hazardsfaced by the urban poor or those living in informal settlements. Third, more precisereporting is needed at the national and international levels to understand how largescaledisasters impact on urban areas. For example, more precise information in theCRED database about the location of the event, including which urban areas theevent impacted.Chapter 2 was written by Cassidy Johnson, Development Planning Unit, Bartlett Schoolof the Built Environment, University College London with contributions from David Satterthwaite,Senior Fellow, International Institute for the Environment and Development,London, and Mark Pelling, Reader in Human Geography, King’s College London. She alsowrote Box 2.3. Box 2.1 was written by I. Sanogo and N. Ifeanyi, World Food ProgrammeFood Security Analysis Service, Rome. Box 2.2 was written by David Satterthwaite.World Disasters Report 2010 – Focus on urban risk49
Strictly under embargo until Wednesday 22 September at 00:01 GMT (02:01 Geneva time)Advisory Group on Forced Evictions. Report to the Executive Director of the UN-HabitatProgramme. Mission to Istanbul, Republic of Turkey, June 8 to 11th 2009.Bull-Kamanga, L. et al. ‘From everyday hazard to disasters: the accumulation of risk inurban areas’ in Environment and Urbanization, Vol. 15, No. 1, pp. 193–204, 2003.Cowan, B. Alleviation of Poverty through the Provision of Local Energy Services;Identification and Demonstration of Selected Energy Best Practices for Low-incomeUrban Communities in South Africa. Cape Town: Energy Research Centre, 2008.Centre for Research on the Epidemiology of Disasters (CRED). Emergency EventsDatabase (EM-DAT). Louvain, Belgium: CRED, Catholic University of Louvain.Available online: www.emdat.be.DesInventar. Disaster Management Information System. Available online:www. desinventar.net.Disaster Mitigation for Sustainable Livelihoods Programme (DiMP). Evaluation ofthe Fire Mitigation Programme in Joe Slovo Informal Settlement, Cape Town. Reportprepared for the Ukuvuka Operation Fire Stop Programme. Cape Town: Universityof Cape Town, 2002.Erdik, M. and Eser, D. ‘Earthquake Risk and its Mitigation in Istanbul’ in NaturalHazards, Vol. 44, pp. 181–197, 2008.Green, R. ‘Informal Settlements and Natural Hazard Vulnerability in Rapid GrowthCities’ in Bosher, L. (ed.), Hazards and the Built Environment: Attaining Built-inResilience. Oxford: Taylor and Francis, 2008.Huq, S. and Alam, M. ‘Flood Management and Vulnerability of Dhaka City’ inKreimer, A. et al. (eds.), Building Safer Cities: The Future of Disaster Risk. DisasterRisk Management Series No. 3. Washington DC: The World Bank, 2003.Intergovernmental Panel on Climate Change (IPCC). ‘Climate Change 2007: Impacts,Adaptation and Vulnerability. Contribution of Working Group II to the FourthAssessment Report of the IPCC’ in Parry, M.L. et al. (eds.) Fourth Assessment Reportof the IPCC. Cambridge: Cambridge University Press, 2007.MacGregor, H.N. et al. Hazard Profile and Vulnerability Assessment for InformalSettlements: An Imizamo Yethu Case Study with special reference to the Experience ofChildren. Cape Town: DiMP, University of Cape Town, 2005.Munich Re Group. NatCat database. Available online: www.munichre.com/en/reinsurance/business/non-life/georisks/natcatservice/default.aspx.Munich Re Group. Mega cities – Mega risks: Trends and Challenges for Insurance andRisk Management. Munich: Munich Re, 2004.50CHAPTER 2Sources and further information
Strictly under embargo until Wednesday 22 September at 00:01 GMT (02:01 Geneva time)Munich Re Group. Topics Annual Review: Natural Catastrophes 2002. Munich: MunichRe, 2002. Available online: www.munichre.co.jp/public/PDF/Topics_2002_NaturalHazardIndex.pdf.Nicholls, R.J. et al. ‘Ranking Port Cities with High Exposure and Vulnerability to ClimateExtremes: Exposure Estimates’ in Environment Working Papers, No. 1. Paris: OECD,2008. Available online: www.olis.oecd.org/olis/2007doc.nsf/linkto/env-wkp(2007)1.Organisation for Economic Co-operation and Development (OECD). OECD TerritorialReviews, Istanbul, Turkey. Paris: OECD, 2008.Observatorio Sismológico del Sur-Occidente (OSSO). ‘Urbanización, Marginalizacióny Prefiguración de Desastres en Ciudades “Medianas” de Países en Desarrollo Cali,Colombia’. Background paper for Global Assessment Report on Disaster Risk Reduction,May 2009. Geneva: UNISDR, 2008.Pharoah, R. ‘Fire risk in informal settlements in Cape Town, South Africa’ in Pelling,M and Wisner, B. (eds.), Disaster Risk Reduction: Cases from Urban Africa. London:Earthscan Publications, 2009.Potts, D. ‘The slowing of sub-Saharan Africa’s urbanization: evidence and implications forurban livelihoods’ in Environment and Urbanization, Vol. 21, No. 2, pp. 253–259, 2009.Rashid, S.F. ‘The Urban Poor in Dhaka City: Their Struggles and Coping Strategiesduring the Floods of 1998’ in Disasters, Vol. 24, No. 3, pp. 240–253, 2000.Sanogo, I. and Ifeanyi, N. Livelihood and Food Security in Urban Emergencies. A Synthesis ofSelected WFP Practices. Draft document. Rome: WFP Food Security Analysis Service, 2009.Satterthwaite, D. ‘The Transition to a Predominantly Urban World and its Underpinnings’in Human Settlements Discussion Paper Series Urban Change – 4. London: InternationalInstitute for Environment and Development, 2007.United Nations Human Settlements Programme (UN-Habitat). State of the World’sCities 2010/2011 – Bridging The Urban Divide. Geneva, 2009.United Nations International Strategy for Disaster Reduction (UNISDR). GlobalAssessment Report on Disaster Risk Reduction. Geneva: UNISDR, 2009.United Nations Population Division. World Urbanization Prospects: the 2005 Revision.CD-ROM Edition data in digital form (POP/DB/WUP/Rev.2005). New York:UN Population Division, Department of Economic and Social Affairs, 2005.World Food Programme (WFP) and UN Children’s Fund (UNICEF). Bangladesh HouseholdFood Security and Nutrition Assessment 2009 Report. Dhaka: WFP and UNICEF, 2009.Wisner, B. and Pelling, M. ‘African Cities of Hope and Risk’ in Pelling, M and Wisner,B. (eds.), Disaster Risk Reduction: Cases from Urban Africa. London: EarthscanPublications, 2009.World Disasters Report 2010 – Focus on urban risk51
Strictly under embargo until Wednesday 22 September at 00:01 GMT (02:01 Geneva time)52CHAPTER 3
Strictly under embargo until Wednesday 22 September at 00:01 GMT (02:01 Geneva time)Starting over:Community rights andpost-disaster responseWhen a large disaster occurs, the initial responses from governments and from better-offhouseholds unaffected by the disaster are usually admirable. But rarely does this carryover to help those most affected with their two most pressing priorities: reconstructingtheir homes and livelihoods. While most national and international disaster relief agencieshave become increasingly effective in the much-needed rapid response to disasters,they are less effective in developing longer-term responses that allow the survivors torebuild their homes and livelihoods. They focus on what they can do for the victims,not what needs to be done by them. After a disaster, the needs for medical treatment,healthcare, food and water, and often temporary accommodation are obvious, as is theneed for specialist help to find and help free many of those trapped in the wreckage. Thisis what both national and international disaster relief agencies are set up to do. But thestage after this is more difficult particularly where all well-located land sites are valuableand where most of those who are most impacted live or lived in informal settlements.The disaster does not remove what are often antagonistic relationships between localgovernments and the urban poor and their informal settlements. Disaster relief agenciescan provide relief but they cannot address the root cause of why so much of thecity’s population was so heavily affected, i.e., because they lived in illegal settlementswith poor-quality homes on dangerous sites to which the government had failed toprovide infrastructure and services. Disaster relief agencies cannot get safer land sitesfor housing where those who lost their homes in informal settlements can build –such sites are too valuable and those in government and higher-income groups wouldnot support this. If the people who lost their homes are allowed to occupy publicspaces after the disaster (parks and school buildings, for instance), the local governmentusually wants them to move on after a certain period of time in order to returnthe spaces to their designated uses. Local governments may want to prevent peopleliving in informal settlements from returning there and rebuilding. Indeed, disasterscan provide possibilities for well-connected developers and businesses to acquire sitesthat were previously occupied by informal settlements as was evident in many coastalcommunities devastated by the 2004 Indian Ocean tsunami. The obvious and essentialprinciple of allowing those most affected to be at the centre of decisions aboutwhere, and how, to rebuild is ignored. Disasters do not often change attitudes withingovernment agencies in regard to the needs and rights of the inhabitants of informalsettlements. However, as some examples given later in this <strong>chapter</strong> show, disasters canprovide the opportunity to catalyse a change in relations with longer-term benefits forthe urban poor.Photo opposite page:Terrain Golf, a sportsclub in Pétionville,Haiti, was turnedinto a refugee campalmost overnight afterthe 12 January quake.It is managed by theJ/P Haitian ReliefOrganization, set upby the actor SeanPenn.© José Manuel Jimenez /IFRCWorld Disasters Report 2010 – Focus on urban risk53
Strictly under embargo until Wednesday 22 September at 00:01 GMT (02:01 Geneva time)54CHAPTER 3Evenif urban poor groups have some assets undamaged by the disaster, these can bequickly eroded by having to pay for consumption needs and through loss of livelihoodsor sources of income, so all the inequalities and difficulties that the urban poor facedbefore the disaster remain to constrain the post-disaster response. Having a home in aninformal settlement usually means lacking land tenure and any official documentationof ‘ownership’ of the land and house. It also often means living in a settlement with noinfrastructure, such as piped water supplies, sewers, drains and paved roads, because localgovernments refuse to provide these to ‘illegal’ settlements. It is this lack of infrastructurethat greatly increases the impact of the disaster event. Most informal settlements havelittle or no public provision for healthcare or emergency services, which further limitsneeded responses to disasters. After a disaster, the lack of tenure and documentation,combined with an absence of links to local government, compounds the constraints onresponse. Disaster relief and support for rebuilding often depend on proof of residenceand identity cards, which also explains why many do not move to safer sites when warnedabout an approaching storm or flood as they fear they will not be allowed to return home.The Asian Coalition for Housing Rights has noted that, unless disaster aid quickly learnsto work with the untitled, the unregistered, the unlisted and the undocumented, it cansupport and even reinforce the inequalities that existed prior to the disaster.Local governments may allow people whose homes were destroyed to settle in temporarycamps but would never sanction these as places where they can stay and rebuildpermanent homes. They often do not permit them to return to their former settlementbut they are also unwilling to provide them with alternative land sites (or if they do,these are peripheral sites with little or no infrastructure, far from their previous homes,social networks and places where they work). There may be good reasons for not wantingthem to return to their former sites because these are so much at risk (from floodsor cyclones, for instance) and post-disaster reconstruction could provide an opportunityto allow those affected to get safer sites on which to rebuild. However, they almostnever get appropriate new sites and they are hardly ever consulted about the appropriatenessof new locations. Fine words about ‘rebuilding a new, safe city’ and ‘decentralizing’to avoid the previous high concentration of informal settlements usually becomedistant camps and reconstruction sites where no one wants to live.Alfredo Stein, commenting on the reconstruction plan in Haiti to move people awayfrom the capital and drawing on his work in post-Hurricane Mitch reconstruction,said, “You are going to be constructing ghettos that are far away from where peoplewill need to restore their economic lives.” The estate agent’s mantra ‘location, location,location’ is actually even more relevant for low-income groups. Stein, an experton urban planning based at the Global Urban Research Centre at the University ofManchester, notes that planners must assume that people will return to their homesitesand work closely with them to rebuild. If their former site is destroyed or toodangerous for them to rebuild on, then they must be included in real discussions aboutwhat would be appropriate relocation sites given government capacity to act rapidly
Strictly under embargo until Wednesday 22 September at 00:01 GMT (02:01 Geneva time)on this. However, it is complicated to get them new land sites that they can afford andthat meet their needs as regards livelihoods. Host communities, for instance, may notwant them in their neighbourhoods, or the legal and institutional obstacles may beinsuperable.Despite these difficulties, there is now a rich experience of community-driven responsesto disasters in urban areas upon which this <strong>chapter</strong> draws as it examines the experiencesof community groups following a disaster. The complexity of needs and constraintscreated by the institutional framework in urban areas means that successful engagementwith the state is critical in securing a pro-poor response, and this <strong>chapter</strong> explainshow this can be achieved.Experiences with community-driven responsesto disastersDrawing on the experience of many communities and local non-governmental organizations(NGOs) after disasters, one of the most important responses is to supportthe people affected to meet, network and often share their grief and, in their owntime, begin to participate in creating solutions. This means involving local peoplefrom the start in any discussion of rebuilding and in managing the shift from relief toreconstruction. If people are living in temporary camps, they should also be engagedin camp organization and management. Well-organized, representative, communityorganizations are also valuable allies for agencies supporting reconstruction as they canprovide much of the information base for rebuilding, contribute to the rebuilding andsupervise local builders and contractors (all of which are time consuming and difficultfor staff from donor agencies or international NGOs).Post-disaster responses have to strengthen and support the survivors’ own organizationsand keep women at the centre. This is often difficult, however, as more aggressiveand well-connected groups frequently dominate priorities and actions. People areaffected in different ways and may have different priorities, and they see other affectedgroups as competitors in seeking funds from external organizations.Visits and exchanges between community organizations have proved important inmany instances to allow survivor groups to learn from other community-driven experiencesand also to show what they are doing or planning. In Banda Aceh, Indonesia,after the 2004 tsunami, a network of community organizations of survivors wasneeded to cope with what was called the second tsunami – the surge of unplanned,unregulated, uncoordinated international aid that poured into the city, often bypassingcommunity structures. With international aid under pressure to spend and to build,many buildings were put up, but when construction was finished and aid agencieswithdrew, communities were left with no source of income, no social cohesion andlittle support for the future.World Disasters Report 2010 – Focus on urban risk55
Strictly under embargo until Wednesday 22 September at 00:01 GMT (02:01 Geneva time)After the earthquake in the Marathwada region of Maharashtra, India in 1993, twoIndian NGOs with long experience in working with grass-roots associations organizedmeetings for affected communities in the two most-impacted districts to sharetheir loss, grieve and also share their experiences of how they had saved many people.This was the first time that women were included in such meetings. It also allowedthem to discuss what they needed and how they could become involved in rebuilding.A local NGO working with the 20,000 households displaced by a mud volcano disasterin Sidoarjo, Indonesia in 2006, noted: “Perhaps the most important support fromexternal donors could have been on-the-ground, long-term support for those affectedto develop their capacities, to agree on and put forward their solutions and then implementthem. It seems that changes in donor structures and staff have actually movedmany donors further away from such an approach.”Box 3.1 describes the experiences of the Philippines Homeless People’s Federation incommunity-driven responses to five disasters between 2000 and 2008. The federationis a national network of 161 urban poor community associations and savings groupswith more than 70,000 individual members from 18 cities and 15 municipalities.Members promote community savings in order to build their own financial capacitiesand to promote community development and social cohesion.Box 3.1 The Philippines Homeless People’s Federation’s rolein community-driven disaster responseThe Philippines’ location within the circum-Pacific seismic belt means that the country isregularly affected by earthquakes, volcaniceruptions, typhoons, storm surges, landslides,floods and droughts. The link between vulnerability,and disaster and poverty is strong –many low-income groups live in high-risk sitesand have poor-quality housing. They also haveless protective infrastructure and fewer resourcesto call on after being impacted by disasters.The Philippines Homeless People’sFederation (HPF) is a national network of urbanpoor community associations and savingsgroups that are engaged in many initiativesto secure land tenure, build or improve homesand increase economic opportunity, workingwherever possible in partnership with localgovernments. The five disasters listed in thetable below encouraged the HPF to developits own policies and practices first for disasterresponse, and later for disaster risk reduction.The HPF was already active in Payataswhen the trash slide happened and had beenimplementing a mix of community-based developmentprogrammes (savings and loanschemes, secure tenure initiatives) and welfareprogrammes (for the elderly, health, childcareand rehabilitation of children with disabilities)with support from the Vincentian MissionariesSocial Development Foundation Inc. However,it recognized its lack of knowledge and skillsin how to address disasters.The HPF’s response to these disasters wasto work with the survivors, helping them toorganize and to influence reconstruction. Forinstance, in Barangay Guinsaugon, after thelandslide, they worked with survivors, helpingthem to organize (including a survey covering56
Strictly under embargo until Wednesday 22 September at 00:01 GMT (02:01 Geneva time)all those in the evacuation centre), supportingthem in developing savings schemes, organizingexchange visits to see other communitybasedhousing schemes and organizing theconstruction of 103 temporary housing unitswithin four months of the disaster. The HPF’simmediate response to the Mount Mayor mudflowand floods was the dispatch of a teamto establish links with all the affected communitiesand to help them set up communityorganizations. It also supported surveys, organizedexchanges and promoted savings.These efforts focused on three municipalitieswhere there were several communities on particularlydangerous sites, supportive local governmentsand communities interested in theHPF and an absence of sustained relief fromaid agencies. Surveys were organized thatincluded families in high-risk areas that hadnot been affected by the mudslide and familiesliving in homes at risk of eviction alongthe railway tracks. The organized communitieswere able to select and acquire resettlementsites. The importance of this experience“is the pervading belief and commitment ofaffected families and communities to act andsave to recover and to prepare for and evadefuture disasters. The communities showed thisthrough their volunteering efforts and adoptionof the savings programme, collectivelysaving close to P500,000 [US$ 11,000] inless than a year. Their willingness to providecounterparts in terms of volunteer work andsavings prompted the federation to supporttheir land acquisition initiatives,” said JocelynCantoria, HPF’s regional coordinator. The disasters Year DetailsTrash slides at the Payatas solid waste dumpin Quezon City (metro Manila)2000 Heavy rains from typhoons caused a 15-metre (50ft) slope in thedump to collapse, burying hundreds of homes; 288 people werekilled and several hundred families displaced. Subsequent flashfloods affected the homes and livelihoods of many more people.Landslide in Barangay Guinsaugon 2006 The whole barangay (district) was buried and another 80 barangaysaffected. A total of 154 deaths were recorded, 968 people reportedmissing, 3,742 displaced and 18,862 affected.Mount Mayor mudflow and floods 2006 Typhoons triggered huge floods, mudslides and avalanches. Inthe Bicol region alone, at least 208 people died and another261 were reported missing. These settlements were recoveringfrom a previous typhoon.Fire in the settlement of the lower Tipolo 2007 246 structures were destroyed leaving 913 people homeless.Homeowners Association in MandaueFlash flood in Iloilo 2008 In the city of Iloilo, 152 of its 180 barangays were affected byheavy rain and flooding. Up to 500 people were killed, 261,335affected. Many houses were washed away and many householdslost their documentation.The work of the Philippines HPF in responding to disasters identified some constraintson community-driven responses that are common in most urban areas. These include:The difficulties faced by the affected population to produce documents requiredby the government because these were either lost or destroyed by the disasterThe common response of those affected to wait for others, especially governmentagencies, to do things and not to take the lead themselvesWorld Disasters Report 2010 – Focus on urban risk57
Strictly under embargo until Wednesday 22 September at 00:01 GMT (02:01 Geneva time)58CHAPTER 3The response limitations of local governments to provide land needed for temporaryaccommodation or permanent relocation and the stringent land-use subdivisionand conversion regulations that inhibit thisThe lack of funds to help with relocation (funding is often only available forimmediate relief and not for resolving the more fundamental problems)The difficulty in getting official permission for necessary actions that oftenrequire the agreement of many different bodiesThe high price of building materials for reconstruction (especially for disasterswith widespread impacts, such as the floods in Iloilo).Community organizations take the leadProblems always arise after a disaster in urban areas that need representative communityorganizations to manage them, such as who gets the temporary accommodation, whogets priority for new housing, how to design the ‘reblocking’ (reshaping of plot boundariesto improve access) that is acceptable to both tenants and ‘owners’. In 2007, CARE’sKabul Area Shelter and Settlement Project, funded by the United States Agency forInternational Development’s Office of Foreign Disaster Assistance, began with a landusagesurvey and the creation of community councils to select beneficiaries in clustersrather than individually. CARE also signed a memorandum of understanding with theKabul municipality, which linked housing to broader issues of land tenure, occupancyrights and housing security, and partnered with the Afghan Development Associationand the Sanayee Development Organization, two local NGOs. CARE’s report on theproject noted: “Essentially, a successful shelter intervention must include strategies forgood governance that focus on increasing people’s understanding of their rights andresponsibilities, as well as enhance the ability of authorities to listen to the needs of thepeople, that encourage all to find solutions to problems that affect everyone.”Shack/Slum Dwellers International (SDI) is a confederation of country-level organizationsof the urban poor from 28 countries throughout Africa, Asia and Latin America.According to the SDI affiliates that have responded to disasters, certain factors havefacilitated effective responses. The first is the existence of savings groups in the affectedsettlements, which helped to provide immediate support for those impacted by thedisasters. The second is the existence of community organizations which were able tohelp with immediate relief and support the social cohesion needed to take action toresolve longer-term issues such as rebuilding or relocation (see Box 3.2).Community-leaders from SDI affiliates often visit disaster sites and impacted communitiesand encourage and support the formation of local representative organizationsand savings groups. They also bring their experience with savings management,organizational development, community surveys and house modelling, developinglife-size models of houses to see which design and which materials produce the bestlow-cost housing. They support community profiling and surveys in order to mobilize
Strictly under embargo until Wednesday 22 September at 00:01 GMT (02:01 Geneva time)those affected, help them get organized, gather necessary data about the disaster siteand support them in showing their capabilities to local government. Where relocationis necessary, they help highlight the importance of being able to get land on suitable,well-located sites where access to income-earning opportunities is as importantas the site itself. The effectiveness of this is much enhanced if there are supportivelocal governments and national agencies. Obtaining, when necessary, land or title toBox 3.2 Inclusive equitable citiesShack/Slum Dwellers International seeks tobuild local movements at a neighbourhoodlevel, primarily around land and basic services.The network grew from the seven foundingmembers in 1996 (Cambodia, India, Namibia,Nepal, South Africa, Thailand and Zimbabwe)to 16 core affiliates in 2006 (Brazil, Ghana,Kenya, Malawi, Philippines, Sri Lanka, Tanzania,Uganda, Zambia) with links to ten morecountries by 2010 (Angola, Argentina, Bolivia,Egypt, Indonesia, Mozambique, Nigeria,Pakistan, Sierra Leone and Swaziland). SDI’smethodology encourages local communitiesto design housing solutions to address theirneeds, refining these solutions through practice.It also seeks, in general, to be non-confrontationalin its relations with local authoritieswith the understanding that city-wide solutionsto the problems of insecure tenure and lack ofaccess to services need to be in place.SDI affiliates have achieved significant successwith secure tenure in India, Kenya, Malawi,Namibia, Philippines, South Africa, Thailandand Zimbabwe. Local groups have negotiatedfor state subsidies to secure land and basic servicesfor over 150,000 families. Their experiencehighlights the importance of strong localorganizations if community solutions are to beallowed to prevail and if communities are to havethe capacities they need to take up new challengesonce they move to permanent sites andnew homes. In terms of disaster preparedness,there is an increasing awareness in SDI communitiesabout the work required with local authoritiesand local NGOs to minimize disaster-related risk.The interest of tenants and those who claimto ‘own’ land may differ considerably. The exceptionsare notable because they are rare.SDI’s Kenyan affiliate, the Kenyan People’sHomeless Federation, supported by localNGOs, worked with local savings schemes inHuruma, one of Nairobi’s many informal settlements,to regularize the settlement. A communitysurvey had identified 1,105 tenants, 1,002structure owners (i.e., owners of the house butnot legal owners of the land) and 202 residentlandowners. The residents were unanimousin seeing security of their homes and land astheir biggest need. Hence, when the governmentsaid that they could have legal tenure ifthe residents could agree on a land-sharing arrangement,they negotiated to divide the land.The outcome was inclusive of all groups andoffered the owners sufficient land for them toaccept a compromise.Communities that come together to addresstheir need for tenure, infrastructure and ser vicesare more likely to be prepared in the eventof a disaster. As the risks of climate changeare increasingly recognized, more communitygroups want to educate themselves about therisks attached to their location both to preparethemselves and to negotiate for appropriate assistancefrom the authorities. World Disasters Report 2010 – Focus on urban risk59
Strictly under embargo until Wednesday 22 September at 00:01 GMT (02:01 Geneva time)60CHAPTER 3it (which often requires high-level political support for a more rapid response frombureaucracies) and permission to begin rebuilding are particularly urgent. In some disasters,technical support for affected populations in developing responses (for example,forming home-owner associations, drafting memoranda of understanding with localgovernments, designing houses and site layout, and raising funds) proved important.Building the information base for effectiveresponsesOne obvious first step in reconstruction is surveys of settlements and impacted householdsin order to assess the damages and to develop a costed plan for rebuilding, buta key issue is who should be engaged in this process? Is this to be done by externalexperts who report to the official organizations ‘in charge’ or might it be better doneby involving community organizations and volunteers? In a growing number of cases,community organizations formed by survivors have taken the lead role in these surveysand, in doing so, have reinforced their opportunities to influence responses. This drawson the experiences of federations of slum/shack dwellers in informal settlements incities in Asia and Africa which have undertaken careful, detailed surveys and mappingof their settlements to provide the information base for upgrading and for negotiatingwith local governments for support.This documentation, covering every household and providing detailed mapsundertaken by the survivors, helps not only to provide necessary documents forreconstruction but it also fosters the strong community organization needed tocope with inappropriate government policies and with the commercial forceswhich often seek to take advantage of the disaster. For instance, the surveys helpprovide households with documentation of the land site they occupy or occupiedprior to the disaster. Community-managed surveys also help build the confidenceand capacity of the inhabitants. This is real disaster prevention because it providesthe basis for low-income communities to avoid eviction and to negotiate the rightto rebuild and to get tenure, and thus avoids the catastrophic impact of relocationto inappropriate locations. The surveys and maps also help to ensure thatthe government takes the local organizations seriously. An engagement with localorganizations that have information about the population to be assisted changesthe nature of the relationship and the potential capacity of the local community isbetter appreciated.Starting repairs and reconstructionA second obvious step is to start with repairs and reconstruction. And, again,who should undertake this? In Pakistan, after the devastating earthquake in 2005,there was a legitimate desire within government to make sure that the rebuildingproduced buildings and infrastructure that were more resilient to likely future
Strictly under embargo until Wednesday 22 September at 00:01 GMT (02:01 Geneva time)disaster events. Governments often try to ban rebuilding until there is a detailedassessment of damages and until it can set guidelines and standards for rebuilding– but this can very often delay essential responses. For those with the least assets,who need to restart livelihoods and rebuild homes, all delays add to their difficulties.Community-driven reconstruction can draw on people’s own knowledge andskills. There are, for instance, often many skilled artisans and experienced buildersamong the affected population who can play an important role in the reconstructionif given appropriate technical support to ensure they build disaster relianceinto new structures.It is important for the network of affected communities to develop their relations withlocal governments and with professionals who are part of the reconstruction effort.They need to develop a common understanding among professionals, aid organizations,government departments and other community groups about what should bedone and then use this common understanding to devise ways to deal with problems ina more collective and coordinated way. This is necessary to avoid a lack of coordinationamong different organizations and competition among community groups for fundsor recognition. Again, community exchanges are key mechanisms by which everyonecan learn – and slum dwellers’ federations have long learned the value of bringing governmentagency staff and other professionals into these community exchanges. Thisalso allows successful partnerships between government agencies, professionals andcommunity organizations to be highlighted so, for instance, government staff worriedabout allowing more flexible standards for building and infrastructure can visit a sitewhere local government has successfully followed such an approach.In urban areas, community-based initiatives to build or improve housing and to installinfrastructure and services have shown their effectiveness in many places but they arelimited by their impossibility to put in place large infrastructure, such as water mainsto supply communities with piped water systems or the trunk sewers and storm drainsinto which community-developed systems can feed. Clearing household waste fromstreets, gutters, drains and open spaces can be organized by communities but it needsa larger system to collect and remove it. So community-driven strategies have to forgelinkages and develop partnerships with local governments and this is where a real partnershipbetween community-managed ‘little pipes’ and government-provided ‘bigpipes’ can achieve risk reduction at scale.Getting landIt is much easier to rebuild in existing settlements as no new land site has to be acquiredand most existing urban settlements have some infrastructure or at least have trunkinfrastructure (roads, water mains, sewers, drains, electricity cables) close by. But whereverland is valuable – which means most urban contexts – it is often more difficultfor affected communities either to get back the land on which they lived prior to theWorld Disasters Report 2010 – Focus on urban risk61
Strictly under embargo until Wednesday 22 September at 00:01 GMT (02:01 Geneva time)62CHAPTER 3disasteror to get safer sites on which to rebuild. ‘Safe’ sites are of no use to low-incomehouseholds if they are far from former homes and from income-earning opportunities.Whenever a large-scale disaster hits a city, there is always a temptation to envisage areconstruction process that avoids the sites most impacted, especially the informal settlements.Governments often respond to disasters by passing new land-use regulationsthat prevent rebuilding in many of the most affected areas.One common community-driven response is for community organizations to demonstrateto governments and, where relevant, international agencies their competenceand capacity in rebuilding. One way to do this is by reoccupying the old sitesand building permanent homes. This is what took place in Gujarat, India, after the2001 earthquake when the government tried to stop people moving back to ‘unsafe’places. But when the people who moved back showed evidence of their investmentin permanent houses, the government had little choice but to agree with them stayingthere. In the immediate aftermath of the 2004 tsunami in Banda Aceh, survivorsfrom 25 coastal settlements moved back in defiance of the government relocationprogramme. When they proved they were able to rebuild and to establish a planto create protective ecological buffers between their settlements and the sea, thegovernment supported their actions. In the responses to the disasters in Payatasdescribed in Box 3.1, it was possible to get land for temporary or permanent accommodationon suitable sites.The need for ‘flexible’ money for affectedhouseholds and communitiesThere is a need for national and local disaster funds that are able to respond rapidlyand have the capacity to provide support right down to affected individuals and households.These funds should support both immediate responses and the development oflonger-term solutions in ways that serve each affected community. Cash support foraffected households has proved effective in many instances and can also stop the erosionof household assets, which is particularly serious for low-income groups.As noted earlier, key priorities – apart from guaranteeing basic needs (shelter, food,clean water, sanitation) and avoiding household asset depletion – are supporting livelihoodsand rebuilding. This often needs administrative streamlining to get fasterresponses from bureaucracies in terms of approving community-driven plans and helpingto resource them. This is not easy, especially for external funders who respond tothe emergency with neither contacts nor knowledge of the areas in which they aresuddenly working. It is difficult for outsiders to know how to support livelihoods andthose most in need. This is more easily done if community organizations, such as localsavings groups, can help. In many nations, national federations of slum/shack dwellershave set up their own national and local funds through which external support for theirwork can be channelled.
Strictly under embargo until Wednesday 22 September at 00:01 GMT (02:01 Geneva time)In urban areas, rebuilding homes and restoring livelihoods are usually closely linked,as the home provides a safe place for families, access for income earners and, often,a site for home-based enterprises. An evaluation of responses to the Gujarat earthquakenoted: “People constantly emphasized the need to restore livelihoods rather thanreceive relief and expressed some frustration that outsiders did not listen to them onthis point.”Community-driven initiatives for disaster riskreductionMost disasters, including the five listed in Box 3.1, could have been anticipated andmuch death and destruction avoided, had surveys of settlements in high-risk sites beenundertaken and follow-up action carried out to address problems the surveys highlighted.Interviews or discussions with those living in informal settlements that floodpoint to a range of measures that they take in the home to reduce the impact. Obviousmodifications can be made to houses to make them more resistant to disaster. Theseinclude having high or raised cupboards or other types of furniture that people can siton in case of floods, fitting high shelves on which goods can be stored (including foodand water) and keeping all electric wiring and plugs close to the roof (if the house isconnected to a source of electricity). In Indore, India, many households had heavyThe Indian state ofAndhra Pradesh washit by one-in-100-yearfloods in 2009. Aftersuch a disaster, peopleneed help not only toaccess food, shelterand clean water, butalso to rebuild homesand livelihoods.© Rob Few/IFRCWorld Disasters Report 2010 – Focus on urban risk63
Strictly under embargo until Wednesday 22 September at 00:01 GMT (02:01 Geneva time)metal beds that did not wash away. Stores of food and water are essential in placesprone to flooding. Brazilian President Lula da Silva has described how the homes helived in as a child were often flooded. “When our house flooded, I sometimes wokeup at midnight to find my feet in water, cockroaches and rats fighting over space, andvarious objects floating around the living room, so I had to get up in the middle ofthe night,” he said. “Our biggest concern was preventing the furniture from gettingruined. Not that we had much to get ruined… Every time it rained, we used to nailanother piece of wood across the doorframe, and dump another truckload of earth toreinforce the barricade. But every time it rained the water level rose further. And theauthorities never did anything.” Houses can be protected against flooding to somedegree by building on stilts, creating drainage ditches nearby, erecting barriers to stopwater coming in (these include temporary measures such as sandbags) or having outletsso that flood waters flow out.Community-driven ‘upgrading’ of informal settlements is an important aspect of disasterrisk reduction, as it improves the quality of housing and puts in place the infrastructureand services that reduce disaster risk. Upgrading slums has become one ofthe most common and effective ways to improve housing conditions in cities in LatinAmerica and Asia. In nations such as Argentina, Brazil and Thailand, upgrading programmeshave reached a significant proportion of the urban population that lives orused to live in informal settlements. At their best, upgrading programmes on sites atrisk of flooding make space for necessary storm drains but also rehouse people whohave to move to make way for infrastructure within the same community.Box 3.3 Housing, land and property rightsand post-disaster shelter programmingProblems concerning housing, land and property(HLP) rights and other issues frequentlyarise following natural disaster. These are ofteninstrumental in determining the extent towhich post-disaster shelter programming succeedsor fails. HLP issues can determine theextent to which the rights of those affectedby disaster are respected, protected and, ultimately,fulfilled and enforced. If left withoutsuitable policy (or sometimes legal) interventions,such HLP problems can create obstaclesfor the implementation of shelter programmes.What works well in a highly urbanized contextmay prove entirely ill suited for post-disastershelter needs in a rural area of a developingcountry. Likewise, relocation of disaster-affectedcommunities may be necessary and desiredby certain groups in some contexts, but maybe wholly inappropriate or illegal in many others.There is a growing realization that HLPrights perspectives need to be woven into theinternational community’s shelter programmingactivities. Though HLP rights issues may playthemselves out in different ways, it is possibleto identify the most likely types of HLP challengesto emerge following disaster. These include:HLP rights issues in informal, customaryor extralegal settlements.Dwellers residing within informal, customaryor extralegal settlements (those without explicit64
Strictly under embargo until Wednesday 22 September at 00:01 GMT (02:01 Geneva time)ownership or other formalized/legal rights toreside at a given location) often bear the bruntof natural disasters and resultant displacementand damage to property. However, on thewhole, post-disaster HLP policy tends to provideclearly preferential treatment to formal propertyowners, often to the detriment of the rights ofthose within the informal or customary sectors,thus raising questions of equity and rights.Structural landlessness and homelessness.Even though pre-disaster landlessand homeless families constitute one of themost vulnerable groups affected by disaster,these families are frequently excluded or at bestmarginalized in relief and recovery processes.This group can include informal occupants orsquatters on public or private land who areunable to return to their homes, such as peopleliving in a coastal buffer zone in post-tsunamiSri Lanka. They can also be pre-disaster tenantswho were not allowed to return to theirformer homes and lands or households headedby women who were not permitted to purchaseproperty or not on the same terms as men. Inpost-tsunami Aceh, more than 15,000 landparcels (7,000 hectares) were irretrievablydamaged, with resettlement on public land asthe only available option. Following the 2005Pakistan earthquake, the failure of the authoritiesto provide housing assistance to the landlesswas identified as a major reason for longtermdisplacement and the prolonged existenceof temporary shelter settlements.Land grabbing and illegal/unfairland acquisition. The unjust acquisition ofland following a disaster can have a detrimentalimpact both on the people whose land is literallystolen and on humanitarian agencies engagedin shelter activities. Land grabbing cantake a variety of forms ranging from outrightviolence (by both public and private actors),to carefully orchestrated legislative measuresdesigned to achieve outcomes in the aftermathof disaster that would have been politically infeasiblehad the disaster itself not taken place.Following Hurricane Katrina in New Orleans,public officials attempted to undertake a rangeof planning and zoning measures during thereconstruction process, which had the actualeffect of significantly changing land use andland and housing ownership patterns – in otherwords, a land grab.Restitution or resettlement? Accordingto relevant international standards, suchas the United Nations Principles on Housingand Property Restitution for Refugees andDisplaced Persons (2005), there is, whenconditions so permit, a presumption of restitutionand an emerging right to return to one’soriginal home for displaced people followingboth disaster and conflict. In many instances,however, restitution can be blocked due to HLPdisputes over a land plot or dwelling, real orattempted land grabs, the secondary occupationof homes and lands and various other commonpost-disaster situations. In post-tsunamiThailand, HLP restitution rights for communitiesliving on land informally were secured throughthe resolution of many HLP disputes by a specialland sub-commission, but in many cases,the technically extralegal or informal tenurestatus held by disaster victims can greatly affecttheir rights in post-disaster settings.Proving who has which HLP rights.Following the Pisco earthquake in Peru, shelterprogramming was affected due to the difficultiesin clarifying the existence of property titlesfor the land potential beneficiaries were occupying.The international community developedprocedures to select reconstruction beneficiaries,which procedures rely on vulnerability criteria(i.e., the elderly, disabled people, childrenand others) and on criteria related to the tenureof the land and properties built on it.World Disasters Report 2010 – Focus on urban risk65
Strictly under embargo until Wednesday 22 September at 00:01 GMT (02:01 Geneva time)Inequitable treatment of ownersand non-owners. Although housing, landor property owners (many of whom may haveforms of HLP insurance protection) and tenantsand other non-owners are equally affected bydisaster, frequently the latter groups face inequitabletreatment within the HLP sector. Followingthe Pisco earthquake, 78 per cent of the populationthat had title received grants for reconstruction,while tenants and informal dwellersgenerally did not. The same distinctions weremade after the 1995 Kobe earthquake inJapan, where owners were invariably entitledto return to their pre-quake homes, whereas tenantswere often forced to find new housing astheir former neighbourhoods were transformedinto new and more expensive areas. AfterHurricane Katrina, relatively small amounts offinancial assistance were provided to rebuildrental units compared to the considerable sumsprovided to owner-occupiers to rebuild.HLP disputes and secondary occupation.HLP disputes generated by thesecondary occupation of homes and landsare commonplace following disasters. Suchdisputes can occur between many differentparties, such as two poor families strugglingover access to a single piece of land. Moreominously, disputes between poor communitiesand private sector interests, which seek tocontrol the disputed land for development purposes,can seriously undermine broader postdisasterrecovery efforts and cause forced andarbitrary evictions.Insecure tenure. Inadequate or insecureHLP tenure can significantly worsen the HLPprospects of disaster-affected populations, aswell as creating considerable challenges forshelter providers in the aftermath of disasters.Tenure insecurity – or the reduced degree ofprotection against eviction and other threats –can arise through a wide range of pre-existing66CHAPTER 3or post-disaster circumstances. These can relateto structural weaknesses of the HLP rights registrationand record-keeping systems in countriesaffected by disaster, a lack of clarity betweencustomary and formal HLP rights frameworks,systemic bias against non-owners (resultingin far lesser tenure protection) and the loss,damage or manipulation of land registers andother methods of recording HLP rights. Insecuretenure can make people reluctant to flee fromtheir homes and lands when disaster strikes forfear of losing access to them after the event.In the specific context of HLP rights anddisaster, the ‘do no harm’ principle shouldmean that humanitarian actors only supportlocal or national HLP laws and policies thatare consistent with internationally protectedHLP rights. International agencies should buildthese perspectives into their overall activitiesto ensure the broad promotion and protectionof HLP rights. It should also mean that humanitarianinstitutions consciously ensure that theyare not complicit in any approaches to HLPissues pursued by national and local governmentsthat are contrary to international rulesand regulations. In effect, such an approachwould prioritize rights over expediency, striveto remove the pro-ownership bias that still dominatesmany shelter efforts and develop newinternal and external mechanisms to continuallystrengthen HLP rights issues in the contextof shelter programming. Five key principles areworthy of consideration in this respect:Expand beneficiary participation in HLPprocesses and decision-makingDefine ‘building back better’ as ‘lands forthe landless and homes for the homeless’Treat owners, tenants and informal dwellersequally by emphasizing security of tenureOppose openly arbitrariness and disasterdrivenland grabsPrioritize restitution first.
Strictly under embargo until Wednesday 22 September at 00:01 GMT (02:01 Geneva time)However, the scope of the upgrading varies from minor improvements such as communalwater taps, paved roads and street lighting, which do little to reduce disasterrisk, to comprehensive improvements to each house and good-quality infrastructure(piped water and sewers to each house) and services (including schools and healthcarecentres). Upgrading should also include the provision of legal tenure of the land andhouse to the occupants but this is often avoided due to costs and legal complications,which may also involve compensation for the landowner.The concept of upgrading implies an acceptance by governments that the settlementto be upgraded is legitimate and that the inhabitants have a right to live there and theright to the infrastructure and services that are so central to risk reduction. But theextent to which it engages the inhabitants and their community organizations in itsdesign and implementation varies a lot. One of the most interesting upgrading initiativesis that of the Thai government because it supports community-driven upgrading,and scale is achieved by the very large number of local initiatives that it supports.Managed by the Community Organizations Development Institute (CODI), thischannels government funds in the form of infrastructure subsidies and housing loansdirect to savings groups formed by low-income inhabitants in informal settlements.It is these savings groups that plan and carry out improvements to their housing ordevelop new housing, and work with local governments or utilities to improve infrastructureand services. From 2003 to early 2008, within the Baan Mankong or securehousing programme, CODI approved 512 projects in over 200 urban centres covering53,976 households, and it plans a considerable expansion of the programme within thenext few years. Overall, CODI (and the organization out of which it developed, theUrban Community Development Office) has provided loans and grants to communityorganizations that reached 2.4 million households between 1992 and 2007.This initiative has particular significance in three aspects: the scale; the extent ofcommunity-involvement; and the extent to which it seeks to institutionalize community-drivensolutions within local governments. Its funding is drawn almostentirely from domestic resources – a combination of contributions from nationaland local government and from households and communities. CODI also providessupport to networks of community organizations formed by the urban poor, to allowthem to work with municipal authorities, other local actors and national agencies oncity-wide upgrading programmes. It also demonstrates how to regularize illegal landtenure. Those living in illegal settlements can get legal land tenure by a variety ofmeans, including purchasing the land from the landowner supported by a governmentloan, negotiating a lease, agreeing to move to another location provided by thegovernment agency on whose land they are squatting, or agreeing to move to part ofthe site they are occupying in return for tenure (land sharing). CODI also providesloans to community organizations to lend to their members to help build or improvetheir homes.World Disasters Report 2010 – Focus on urban risk67
Strictly under embargo until Wednesday 22 September at 00:01 GMT (02:01 Geneva time)Most of the experiences described above are from nations where national federations ofslum or shack dwellers have developed and have actively sought to work with local governments.The kinds of post-disaster interventions described in this <strong>chapter</strong>, includingthe capacity to reduce or avoid extreme events, should be a key part of urban povertyreduction strategies. Often, however, they are not seen as the responsibility of agenciesthat work on poverty reduction. Meanwhile, guidelines for urban poverty reduction,such as the Poverty Reduction Strategy Papers fostered by the World Bank and theInternational Monetary Fund, often give little or no attention to disaster risk reductionin urban areas – although in fact, this is part of a larger problem: that these institutionsdo not give much attention to urban areas at all.This <strong>chapter</strong>, including Box 3.1, was written by David Satterthwaite, Senior Fellow, InternationalInstitute for Environment and Development (IIED), with contributions fromSheela Patel, Director, Society for the Promotion of Area Resource Centers, Somsook Boonyabancha,Secretary General, Asian Coalition for Housing Rights, Thomas Kerr, AsianCoalition for Housing Rights, and Arif Hasan, Visiting Fellow, IIED. Box 3.2 was writtenby Diana Mitlin, Senior Research Associate, Human Settlements Programme, IIED. Box3.3 was contributed by Scott Leckie, Director, Displacement Solutions.68CHAPTER 3Conclusion
Strictly under embargo until Wednesday 22 September at 00:01 GMT (02:01 Geneva time)Sources and further informationAdelekan, I.O. ‘Vulnerability of poor urban coastal communities to flooding in Lagos,Nigeria’ in Environment and Urbanization, Vol. 22, No. 2, 2010.Arputham, J. ‘Developing new approaches for people-centred development’ inEnvironment and Urbanization, Vol. 20, No. 2, pp. 319–337, 2008.Asian Coalition for Housing Rights (ACHR). Tsunami Update. Bangkok: ACHR,2006.ACHR. Tsunami; How Asia’s Precarious Coastal Settlements are Coping after the Tsunami.Housing by People in Asia 16. Bangkok: ACHR, 2005.Boonyabancha, S. ‘Land for housing the poor by the poor: experiences from the BaanMankong nationwide slum upgrading programme in Thailand’ in Environmentand Urbanization, Vol. 21, No. 2, pp. 309–330, 2009.Boonyabancha, S. ‘Baan Mankong; going to scale with “slum” and squatter upgradingin Thailand’ in Environment and Urbanization, Vol. 17, No. 1, pp. 21–46, 2005.Community Organisation Resource Centre, 2010. Available online: www.corc.co.za.CARE. Delivery of Humanitarian Shelter in Urban Areas – The Case of ‘KASS’, TheKabul Area Shelter and Settlement Project as a model. CARE, 2007. Available online:www.sheltercentre.org/library/Delivery+Humanitarian+Shelter+Urban+Areas+The+Case+Kass+The+Kabul+Area+Shelter+and+Settlemen.Cosgrave, J. Responding to Earthquakes 2008; Learning from earthquake relief andrecovery operation. Geneva: Alnap and ProVention Consortium, 2009.Displacement Solutions and International Federation of Red Cross and red CrescentSocieties (IFRC). Housing, Land and Property (HLP) Rights in Post-Disaster Settings:Proposals for IFRC Shelter Policy and Response. 2008.Douglas, I. et al. ‘Unjust waters: climate change, flooding and the urban poor in Africa’in Environment and Urbanization, Vol. 20, No. 1, pp. 187–206, 2008.Hamdi, M., Wardah, H. and Sauter, G. ‘Uplink Porong: Supporting communitydrivenresponses to the mud volcano disaster in Sidoarjo, Indonesia’ in GatekeeperSeries 137j, IIED, London, 2009.Hasan, A. Participatory Development: The Story of the Orangi Pilot Project-Researchand Training Institute and the Urban Resource Centre, Karachi. Oxford: OxfordUniversity Press, 2010.Humanitarian Initiatives UK, Disaster Mitigation Institute and Mango, A. IndependentEvaluation: The DEC Response to the Earthquake in Gujarat, January, Volume Two:Main Report. London: Disasters Emergency Committee, 2001.World Disasters Report 2010 – Focus on urban risk69
Strictly under embargo until Wednesday 22 September at 00:01 GMT (02:01 Geneva time)70CHAPTER 3Inter-Agency Standing Committee (IASC). Protecting Persons Affected by NaturalDisasters: IASC Operational Guidelines on Human Rights and Natural Disasters.Washington DC: Brookings, 2006.Jabeen, H., Allen, A. and Johnson, C. ‘Built-in resilience: learning from grassrootscoping strategies to climate variability’ in Environment and Urbanization, Vol. 22,No. 1, 2010.Karanja, I. ‘An enumeration and mapping of informal settlements in Kisumu, Kenya,implemented by their inhabitants’ in Environment and Urbanization, Vol. 22, No.1, 2010.Da Silva, L. et al. ‘The Programme for Land Tenure Legalization on Public Land’ inEnvironment and Urbanization, Vol. 15, No. 2, pp. 191–200, 2003.Leckie, S. (ed.) Housing, Land and Property Restitution Rights forRefugees and DisplacedPersons: Laws, Cases and Materials. Cambridge: Cambridge University Press, 2007.Mitlin, D. Urban Poor Funds: development by the people, for the people. Poverty Reductionin Urban Areas, Working Paper 18. London: IIED, 2008.Mitlin, D. and Muller, A. ‘Windhoek, Namibia: towards progressive urban landpolicies in Southern Africa’ in International Development Planning Review, Vol. 26,No. 2, pp. 167–186, 2004.Patel, S. ‘Reflections about disasters and the poor: Exploring possibilities to addresspreparedness and management by communities of the urban poor’, unpublishedbackground paper, 2010.Patel, S. d’Cruz, C. and Burra, S. ‘Beyond evictions in a global city; people-managedresettlement in Mumbai’ in Environment and Urbanization, Vol. 14, No. 1, pp.159–172, 2002.Phonphakdee, S., Visal S., and Sauter G. ‘The Urban Poor Development Fund inCambodia: supporting local and citywide development’ in Environment andUrbanization, Vol. 21, No. 2, pp. 569–586, 2009.Rayos, J. Community-driven Disaster Intervention: Experiences of the Homeless People’sFederation in the Philippines. Manila and London: HPFP, PACSII and IIED, 2010.Roy, A., Jockin, N.A. and Javed, A., ‘Community police stations in Mumbai’s slums’ inEnvironment and Urbanization, Vol. 16, No. 2, pp. 135–138, 2004.Stein, A. Commentary quoted in Haitians begin to return to unprepared capital, AssociatedPress, 6 February 2010. Available online: www.thespec.com/article/717662.Stephens, C., Patnaik, R. and Lewin, S. This is My Beautiful Home: Risk Perceptionstowards Flooding and Environment in Low Income Urban Communities: A Case Studyin Indore, India. London: London School of Hygiene and Tropical Medicine, 1996.
Strictly under embargo until Wednesday 22 September at 00:01 GMT (02:01 Geneva time)Syukrizal, A., Hafidz, W. and Sauter, G. ‘Reconstructing Life: After the Tsunami: theWork of Uplink Banda Aceh in Indonesia’ in Gatekeeper Series 137i, IIED, London,2009.Tearfund. Learn the lessons: Governments must change the way they do aid work afterthousands of needless deaths in recent disasters. London: Tearfund, 2005.Teodoro, J.I.E. and Rayos Co, J.C. ‘Community-driven land tenure strategies: theexperiences of the Homeless People’s Federation of the Philippines’ in Environmentand Urbanization, Vol. 21, No. 2, pp. 415–442, 2009.Thohir, S.A., Hafidz, W. and Sauter, G. ‘The how, when and why of communityorganisational support: Uplink Yogyakarta in Indonesia’ in Gatekeeper Series 137k,IIED, London, 2009.United Nations Development Programme (UNDP), UN Human SettlementsProgramme (UN-Habitat) and Centre for Architecture and Human Rights. Supportfor Rehabilitation of Traditional Communities Affected by the Tsunami. Bangkok,2008.UN-Habitat. Scoping Report: Addressing Land Issues after Natural Disasters. Geneva:UN-Habitat, 2008.Vincentian Missionaries. ‘The Payatas Environmental Development Programme:micro-enterprise promotion and involvement in solid waste management inQuezon City’ in Environment and Urbanization, Vol. 10, No. 2, pp. 55–68, 1998.Weru, J. ‘Community federations and city upgrading: the work of Pamoja Trust andMuungano in Kenya’ in Environment and Urbanization, Vol. 16, No. 1, pp. 47–56,2004.World Disasters Report 2010 – Focus on urban risk71
Strictly under embargo until Wednesday 22 September at 00:01 GMT (02:01 Geneva time)72CHAPTER 4
Strictly under embargo until Wednesday 22 September at 00:01 GMT (02:01 Geneva time)Urban violenceAs more people crowd together into cities, urban violence has become a definingfeature of daily life in some developing countries. In Latin America, the Caribbeanand sub-Saharan Africa, the bloodshed reaches a scale as bad as, or worse than, thatof many wars. The United Nations Human Settlements Programme (UN-Habitat)reports that in a recent five-year period, approximately 60 per cent of urban dwellersin developing countries have been victims of crime. That number rises to 70 per centin parts of Latin America and Africa. Nairobi, the capital of Kenya, once the pride ofEast Africa and home to the headquarters of United Nations (UN) agencies, has beendubbed ‘Nairobbery’. Many of South Africa’s cities are characterized by a new form ofapartheid, with the rich isolated behind electric fences and the poor penned into slumswhere law and order is markedly absent.Over the past 20 years, the increasingly rapid pace of urbanization in developingcountries has resulted in a dramatic increase in urban violence. The transition from anagriculture-based economy to a primarily industrial one involves mass migration fromthe countryside to the city. Most migrants gravitate to slums or squatter settlements,home to some 1 billion people today. These areas are generally large and sprawling,making it difficult to supply their residents with the most basic of needs.For some, migration brings real improvement as skilled workers enjoy higher wagelevels in the cities and this promotes education and supports broader development.For many others, however, this transition results in extreme poverty, insecurity andincreased vulnerability. As they crowd into shanty towns and slums, sometimes inappalling conditions with little or no access to clean water and sanitation, they clashwith older populations and other migrants for scarce jobs, housing and basic services.The police are very often too overstretched or intimidated to maintain law and orderand these ungoverned areas provide a fertile breeding ground for criminal networkstrafficking in drugs, guns and people.This <strong>chapter</strong> presents an overview of the causes and costs of urban violence and analyseshow extreme inequality and political instability are fuelling the increase in violence incities in the developing world, before reviewing some of the strategies currently beingapplied to tackle the problems caused by urban violence.The causesThere are many definitions of violence. The Crisis States Research Centre at the LondonSchool of Economics and Political Science recently adapted a three-fold categorizationof political, economic and social violence to provide a particularly useful classificationin urban contexts.Photo opposite page:Among the root causesof urban violence arepoverty, discriminationand the availabilityof alcohol, drugsand weapons. Youngpeople living in slumsare particularly at riskof becoming victimsor perpetrators of thisviolence.© Victor Lacken/IFRCWorld Disasters Report 2010 – Focus on urban risk73
Strictly under embargo until Wednesday 22 September at 00:01 GMT (02:01 Geneva time)74CHAPTER 4Economicviolence is driven by material gain and includes street crime, drug-relatedviolence and kidnapping. This type of violence is common where urban inequality andpoverty combine to produce unequal access to economic opportunity. In some cases,societal transformation and development policies such as structural adjustment haveexacerbated poverty and inequality and contributed to increased crime and violence.It is also closely associated with the existence of an informal economy where the poorfind ways to earn a living providing informal services and trade. In Latin Americancities, ‘social cleansing’ campaigns by the authorities to remove poor people and streetvendors from the cities and to segregate them in designated areas have resulted inincreased levels of violence and crime. At household level, social violence increases asa result of failure to meet family expectations, while economic violence increases asdesperation and frustration drive some people to commit robbery and other crimes.Social violence is mainly an interpersonal phenomenon, driven by the desire to get ormaintain social power and control, between individuals and within and between familiesand communities. Gangs are a common manifestation of social violence, formed inresponse to social and economic exclusion where young people find a sense of belongingand status. Social cleansing, spatial segregation of urban areas and extrajudicialkillings by police are also categorized as social violence. For example, in Nairobi, where60 per cent of the population lives on 5 per cent of the city’s land, corruption is rifeand youth gangs wreak terror with guns smuggled in from Somalia and Uganda. Theprivileged classes live in walled-off houses with ‘safe havens’, complete with radio alarmpanic buttons, where they can hide during robberies. The poor rely on vigilante groupsto protect them.Political violence is driven by a desire to gain or maintain political power, often byelite groups. It is closely associated with lack of reform within the police and judiciaryor the de facto abandonment of urban areas to criminal networks and drug gangs. A‘criminalization of governance’ occurs when these gangs impose their own rules in poorneighbourhoods, often providing security and dispensing justice but institutionalizingviolence. In May 2010, Jamaica’s government declared a state of emergency in partsof Kingston, the capital city, after shooting and firebomb attacks on police stations bysuspected supporters of an alleged drug lord. Seventy-three people were killed as thousandsof soldiers and police laid siege to a district of the capital that officials say servesas a ‘garrison community’ for the alleged drug gang. Attempts to arrest the suspect wereviolently repelled by his supporters. Hundreds of residents blocked the roads into theneighbourhood carrying placards proclaiming their support for the alleged gang leader,who they said provided security and other essential services for their community.Organized crimeOrganized crime, international drug trafficking, trade in lethal weapons and urbanstreet gangs are acute manifestations of urban violence which usually comprise overlappingdimensions of political, economic and social violence.
Strictly under embargo until Wednesday 22 September at 00:01 GMT (02:01 Geneva time)Drug production and traffickingSouth America produces about 900 tonnes of cocaine a year, mostly for sale to theUnited States and Europe. Drug trafficking organizations have openly challenged governmentsin a number of countries including Colombia, Mexico and Jamaica throughconflict and intimidation and the use of advanced military tactics and military-gradeweapons. Violence is mostly associated with the transit, rather than the consumption,of illicit drugs – to the US through Central America and the Caribbean and to Europethrough West Africa. Mexico’s drug cartels reportedly command more than 100,000foot soldiers, putting them on a par with the Mexican armed forces which command130,000 troops. The cartels are said to earn up to US$ 40 billion from the drug trade,a figure which exceeds the gross domestic product (GDP) of many low-income countries.The US Department of State recently reported that entire regions of Guatemalaare now essentially under the control of drug trafficking organizations, the most visibleof which is the Mexican group known as the Zetas.When governments react with force the violence can spiral out of control. One UnitedStates travel advisory warned US citizens about the levels of violence in Mexico, describingthe shoot-outs between Mexican security forces and the drug cartel gunmen as similar to“small-unit combat”. Indeed, the global intelligence company Strategic Forecasting, Inc., orSTRATFOR, reports that Mexico’s armed forces have now been deployed in nearly everystate in the country. Increasingly they are charged with maintaining general public safety.FirearmsFirearms increase the lethality of violence. According to the Small Arms Survey, civiliansown about 650 million firearms worldwide (three-quarters of the known total)and gun violence kills at least 200,000 people each year in countries at peace.The illegal trade in small arms is believed to be worth at least US$ 1 billion per year.Many small arms remain in urban areas following a conflict, while others trickle overborders from countries currently or formerly at war. South Africa gets guns fromMozambique and Angola, and Nairobi receives weapons from Somalia and Uganda.In Brazil, where more than 100 people die from firearm violence every day, gangs havebeen seen with arms either pilfered or sold from military arsenals. In the favelas of Riode Janeiro, youths carry assault rifles, machine guns and submachine guns.The ‘guns for ganja’ trade – where undocumented handguns from Haiti are exchangedfor marijuana from Jamaica – is seen as a major factor contributing to the record levelsof murder and violent crime in Jamaica. According to the US State Department’s 2010International Narcotics Control Strategy Report, around 70 per cent of the illegal firearmsentering Jamaica originate in the United States. Mexico is another major recipient ofguns from the US. The Bureau of Alcohol, Tobacco, Firearms and Explosives estimatesthat Mexican drug trafficking organizations acquire thousands of weapons each year inArizona, California and Texas and smuggle them across the border to Mexico.World Disasters Report 2010 – Focus on urban risk75
Strictly under embargo until Wednesday 22 September at 00:01 GMT (02:01 Geneva time)76CHAPTER 4Urbanstreet gangsUrban street gangs are made up mostly of marginalized young men between the agesof 15 and 24, a sector of society that commits a disproportionately large share of violentacts. Some of the reasons people join gangs include finding a sense of belonging,reacting to repressive treatment, resisting the status quo, climbing out of poverty andachieving social status. (See Box 4.2.)The appeal of American gang culture has spread into Latin America and the Caribbean,often with members who brought it back to their countries of origin after being arrestedin the United States and deported. Between 2000 and 2004, around 20,000 youthsassociated with gangs in the Los Angeles slums were deported to Central Americancountries many had never even visited. Their families had fled to the United States inthe 1980s to escape civil war and children born into or brought up in the slums driftedinto gangs and criminality and fell foul of the crackdown that followed the 1992Los Angeles riots. The notorious Mara Salvatrucha gang, for example, started in theLos Angeles region and is now entrenched in Central America, sending youth homiciderates soaring.Nairobi’s gang names are inspired by conflict and political movements, such as Talibanand Boys of Baghdad. Sometimes they work as mercenaries for political leaders. Thestreets of Lagos, Nigeria, are plagued by the Area Boys, tens of thousands of looselyorganized delinquent youths who harass, threaten, bribe and extort money from passers-by.What started as a small band of hoodlums in the 1980s has grown with theinflux of unemployed migrants to the city, in an oil-rich country where up to 70 percent of the population lives below the poverty line.The costsIt is difficult to measure the exact costs of urban violence, both tangible and intangible,but they are substantial, affecting the economic, political and social development ofcities and nations. A study in El Salvador, for example, put the total national cost ofviolence at 11.5 per cent of GDP.Lives lost and ruinedOne simple calculation is homicide rates, which are highest in Latin America, theCaribbean and sub-Saharan Africa. Drug-producing countries have a homicide level35 per cent higher than the average rate for the rest of the world. In Mexico, violentconfrontations between drug cartels have killed some 23,000 people since late 2006.In Rio de Janeiro, the homicide rate has tripled since the 1970s. In São Paulo, it hasquadrupled. In some cities of Latin America, the homicide rate is as high as 120 per100,000 people. In Jamaica last year, the murder rate reached 1,672 – one of the highestrates per capita in the world. A worsening economic climate has been blamed for asignificant increase in other violent crimes including theft, robbery and rape.
Strictly under embargo until Wednesday 22 September at 00:01 GMT (02:01 Geneva time)Economic developmentIn economic terms, large numbers of dead, injured and imprisoned people mean a lossof work productivity and income, a lower GDP, higher hospital and healthcare costs,increased expenditures for policing, justice and prisons, and more. And while urbanviolence is rooted in underdevelopment and inequality, there is a vicious circle bywhich urban violence undermines development and further weakens state institutions.Significant levels of crime and violence discourage foreign investment and impedeentrepreneurs from investing in their own country. Insecurity can lead to capital flightand a brain drain. Tourists stay away. Property values plummet. Geographical segregationworsens, as small businesses and educated middle-class residents flee high-crimeneighbourhoods, leaving these areas to the criminals and those too poor to leave. As aresult, the situation continues to deteriorate.Social costsUrban violence damages social capital, prevents social mobility, destroys communalbonds, erodes neighbours’ trust in one another and in police or local authorities, andcreates a wall between marginalized communities and the establishment. The worstaffected are the most vulnerable people, who become poorer, more segregated and lessequal.Simply the fear and anxiety that persistent violence engenders can increase the coststo society. While the rich shut themselves off behind elaborate security systems, theunderprivileged are forced into slum settlements or stigmatized neighbourhoods. Themost vulnerable – women, the elderly, the destitute – may stop going to work, dropout of night school or keep their children at home. A nationwide survey revealed thatin South Africa, fear of crime prevented about one-quarter of respondents from startingtheir own businesses or taking public transport. In Lagos, 70 per cent of thosesurveyed feared becoming victims of crime.Democratic freedomHigh levels of urban violence constrain the exercise of democracy by weakening institutions’legitimacy through corruption, undermining the authority of local governmentand preventing political participation through fear and intimidation.There is a loss of press freedom when gangs and criminal groups target and sometimeskill investigative journalists who report on their activities. “Scores of reporters andnumerous news outlets are engaging in self-censorship for fear of retribution,” warnsthe Committee to Protect Journalists. Crimes are underreported and corruption isunchecked.The militarization of law enforcement in a growing number of countries also threatensfreedom. To confront the drug cartels behind so much of the urban violence, states areWorld Disasters Report 2010 – Focus on urban risk77
Strictly under embargo until Wednesday 22 September at 00:01 GMT (02:01 Geneva time)increasingly calling on national armies and other military forces. In Mexico, Colombiaand Jamaica, the sight of troops being deployed to conduct searches, secure neighbourhoodsand hunt down suspected criminals is leading to a blurring of the distinctionbetween civil and military responsibility. This may be necessary when criminal networks’firepower becomes a threat to the state’s monopoly on force, but the use of thearmy for public security should be an exception and should never be allowed to dilutethe principle of civilian control of the military.Box 4.1 Violence and young people in urban settingsFor young people, the risk of experiencing violence– as victims, perpetrators and / or observers– is highest in urban environments wheremore than 1 billion people under the age of18 years live, many of them in slums.Young people are impacted by, and inflicton themselves and others, violence acrossa variety of urban settings. Violence – suchas being beaten, exploited, bullied, sexuallyabused, exposed to rage and angry blows betweenothers, or having self-esteem constantlycrushed – occurs in communities, homes,schools, institutions, workplaces and online.Some of these settings are considered‘private’ such as homes, institutions and workplaces;in these settings violence can stay hidden,invisible and secret behind closed doors.It is not spoken of and is denied, ignored oreven accepted as an inevitable reality. As oneyouth put it: “I have been sexually abused fourtimes. I really want help but I’m too scared. Myfriend had the same thing happen but won’ttell anyone. No one understands. I’m scared.”In contrast, in public settings like citystreets, slums and school yards, violence canoften be flagrant, unconcealed and visible tothe community. “It is easy to get beaten if youare a street boy. People can rape you. Mencan beat a boy and rape him. There is nothingyou can do but run away if you are lucky,” saida child surviving on the streets of a mega-city.Too often the private and public forms ofviolence against young people are treated asthough they are separate and unconnected. Inreality, violence against young people in privateand public settings is deeply intertwined;violence in homes and private settings spills outto all aspects of a young person’s life. A commonexample of this spill-over can be seen inthe role of young people in urban gangs andcrime networks. Although not often recognizedas such, these are a visible, public culminationof violence that begins in the private sphere.Through child abuse in the home, bullyingat school or exposure to family membersphysically and psychologically tearing eachother down, young people learn that violencecan be tolerated and used effectively to controlthose who have less power, and it caneven help gain benefits. “Witnessing violenceteaches you violence and makes you hate,” explainedone young person. In addition, theseexperiences can push young people awayfrom their homes and leave them dependent onand vulnerable to others. A former gang memberrecounted that: “A lot of the young womenare escaping from horrible home situations,especially with their fathers… So if the girlsgo out with these guys from the paramilitaryit gives them a sense of rebellion, of power.These guys protect them – a guy with a gun. Itis very common.”78
Strictly under embargo until Wednesday 22 September at 00:01 GMT (02:01 Geneva time)Surrounding what happens in homes andon the streets is a set of social, economic, politicaland environmental factors that shapesthe opportunities and choices available to theyoung. To escape, some young people canmake harmful choices and be drawn into aworld of drugs, guns and crime. Each youngperson caught in the cycle of violence meansadults have failed in their responsibility to protect;it means a diminished potential for prosperity,safety and success for each community.In 2007, the International Red Cross andRed Crescent Movement defined violence inurban settings, especially for children andyouth, as a “great humanitarian challenge”.In 2010 the International Federation of RedCross and Red Crescent Societies (IFRC) reinforcedand expanded on this by launching theIFRC Global Strategy on Violence Prevention,Mitigation and Response with a particular focuson urban environments and the risk amongchildren and youth.The strategy builds on the diverse, grassrootsexperience of Red Cross and Red CrescentSocieties in addressing violence in each cornerof the globe through working with orphans,young migrants fending for themselves orfleeing with their families, children living onthe streets or those caught in the crossfire infavelas; helping young people to finish school,learn livelihoods and hold on to their dreamsin the aftershock of war or disaster that hasleft their cities depressed; or enabling adultsor youth to reach out to young people andeducate them on violence prevention.Root causes include the availability andmisuse of alcohol, drugs and weapons; genderinequalities; discrimination and exclusion;violent cultural norms; poverty and a lack ofeconomic opportunity; weak or missing supportsystems; and tolerance for the misuse ofpower.While adults in their families, workplacesand communities have clear responsibilities, itis only in partnership with young people themselvesthat violence can be prevented, mitigatedand responded to – in any setting, privateor public. Risk factorsA study of the world’s hot spots reveals a range of reoccurring preconditions or riskfactors that combine to provide fertile ground for urban crime and violence. Two setsof factors in particular are linked to higher levels of urban violence: socio-economicfactors, which entrench poverty, exclusion and inequality, and political-institutionalfactors, which can produce a crisis of governance.Socio-economic factorsDeprivationDeprivation of human needs has been widely recognized as an important underlyingsource of social conflict. In towns and cities of developing countries, one out of everythree people lives in the slums. And because slum dwellers rarely pay taxes, manymunicipalities decide they are not entitled to public services or security. As a result,slum dwellers find themselves ignored by the state, deprived of basic services andexcluded from society. In the particular context of rapid urbanization, governmentfailure to provide security and basic social services, such as clean water, sanitation,health and education facilities, may fuel tensions arising from the integration of ruralWorld Disasters Report 2010 – Focus on urban risk79
Strictly under embargo until Wednesday 22 September at 00:01 GMT (02:01 Geneva time)4migrants80CHAPTER 4into city life creating a volatile atmosphere and leading to violent confrontationsbetween groups competing for scarce resources. Forcible eviction is a constantthreat. Large-scale evictions by public authorities displace millions every year, sometimesfor redevelopment or beautification projects, or simply to target and removeundesirable groups.In Mumbai, India, up to 400,000 people were displaced by a slum-clearance drive inlate 2004 and early 2005, while in Zimbabwe, 700,000 people were forced to vacatetheir homes in six weeks in May–June 2005. Most of these people ended up even morevulnerable than before. Cambodia has one of the fastest-growing rates of urbanizationin Asia and, in recent years, Phnom Penh has experienced an unprecedented boom inproperty values. As market prices have increased, whole communities have been relocatedfrom land they occupied or bought in the post-war period, or forced out of theirhomes to make way for condominiums, shopping malls and office blocks. Housingrights groups estimate that 133,000 people – 10 per cent of the city’s population – havebeen evicted since 1990.Many of these conditions can also be seen in Dhaka, Bangladesh, one of the world’sfastest-growing cities. Here, the population was 400,000 in 1950, grew to around 12million by 2007 and is projected to reach 20 million by 2020. Between one-third andone-half of its residents are poor, living in 3,000 slums and squatter settlements. Manyexperience physical harm or murder at the hands of mastaans, armed thugs who controlthe slums through extortion and terror. Migrant women who work long hours andwalk home late at night are particularly vulnerable. In 2001, the government enactedan urban cleansing programme in the slums. Reportedly, while the police carried outmass evictions, mastaans raped and looted unhindered.InequalityA factor even more important than poverty is inequality. Countries with high levels ofurban violence tend to suffer from very unequal income distribution patterns and thisunequal access to economic opportunity is frequently cited as the main risk factor forurban violence. Studies have shown that income inequality – which is highest in Africaand Latin America – is much more strongly associated with violent crime than poverty.In Latin America, homicide rates are between 40 and 56 per cent higher than the restof the world. According to data compiled by the UN Economic Commission for LatinAmerica and the Caribbean (ECLAC), 180 million people in the region are living inpoverty, 71 million of whom are classed as indigent or ultra-poor. Figures for 2008indicate a slowdown in poverty reduction and a reversal of the downward trend inindigence since 2002. Only Brazil, Paraguay and Peru continued to reduce the numberof people living in ultra-poverty, by around 1 percentage point. Indigence increased bybetween 1.4 and 2.5 per cent in Venezuela, the Dominican Republic, Ecuador, Mexicoand Panama. Costa Rica and Uruguay recorded very slight increases. In Colombia,indigence rose by 2.7 per cent between 2005 and 2008, or 0.9 per cent per year.
Strictly under embargo until Wednesday 22 September at 00:01 GMT (02:01 Geneva time)Table 4.1 Measuring inequalityCountry 1992–2007*Chile 52Mexico 48.1Brazil 55Colombia 58.5Peru 49.6Ecuador 54.4Dominican Republic 50Jamaica 45.5El Salvador 49.7Honduras 55.3Bolivia 58.2Guatemala 53.7South Africa 57.8Kenya 47.7Haiti 59.5Source : UNDP (2009)* The Gini index co-efficient lies between 0 and 100.A value of 0 represents absolute equality and 100 absolute inequality.Although income distribution also improved compared with 1990, with an averagedrop of 4 per cent in the Gini index, income inequality in Latin American countriescontinues to be among the highest in the world. The most significant improvementswere in Venezuela, Nicaragua, Panama and Uruguay, while Argentina, Costa Rica andEcuador recorded increased levels of inequality.These increases no doubt contributed to citizens’ perception that their countries sufferedfrom great distributive injustice. A 2009 ECLAC report found that: “The perceptionthat income distribution is highly inequitable is associated with a distrust ofpolitical institutions and a belief that governments serve the elites more than theyserve the majority.” For many people, inequality is a consequence of an elite minorityretaining a disproportionate level of control and influence over income and economicopportunity. This was seen as a threat to social cohesion, particularly in the context ofincreasing poverty and deprivation.Spatial segregation is also an important factor in increasing urban violence. The geographicalconcentration of the poor in slums, shanty towns and outlying semi-urbanareas isolates them from the rest of society and from the housing, health and educationservices, employment opportunities and social capital they need to improve their lives.As cities expand and develop, the poor are increasingly subjected to a combination ofeconomic decline and social cleansing programmes to remove them from the streets.World Disasters Report 2010 – Focus on urban risk81
Strictly under embargo until Wednesday 22 September at 00:01 GMT (02:01 Geneva time)82CHAPTER 4Thisdislocation significantly reduces their access to opportunities for informal businessor self-employment, running hawker stalls, kerbside repairs or providing cheaptransport. Without access to the economic and social life of the city they becometrapped in a vicious circle of poverty and exclusion, which passes from generation togeneration. Desperation and frustration can often boil over into conflict, crime andviolence.Social factorsThere are social factors, too, such as a culture of machismo, where males earn statusby proving their strength and masculinity. Demographics also count, since young menare most often the victims and the perpetrators of violent crime. High youth unemploymentis another cause. Worldwide, young people aged 15 to 24 represent onequarterof the working-age population, yet account for almost one-half of the globalunemployed. Nearly 25 per cent of the workforce in this age group earns less thanUS$ 1 a day.In Latin America and the Caribbean, drug use and trafficking have been central to aprocess of social decomposition producing violence within families, between gangs,between dealers and with corrupt officials. As traditional social institutions are eroded,they are replaced by perverse social capital in the form of gangs, drug mafias who ‘govern’neighbourhoods and networks of corrupt public servants and politicians.Street children, who may number in the tens of millions worldwide, are easy targetsfor membership in youth gangs. They end up on the street due to poverty, child abuseor the disintegration of the family. In general they have little education, are exposedto drugs and sex and live at risk of HIV / AIDS and teenage pregnancy. They are bothvictims and perpetrators of crime, which they commit in order to survive. In Nairobi,where approximately 60,000 people are homeless, street children mug pedestrians andsnatch purses, pick pockets, extort money and engage in prostitution. Here and inmany other cities from Guatemala to India, street children are seen as a menace tosociety and police brutality against them is widely accepted.Political-institutional factorsIn cities around the world, from Managua and Lagos, to Kinshasa and Karachi, there isa generalized lack of trust in the state’s ability to prevent crime and violence. Authoritiesare unwilling or unable to protect the populations of rapidly expanding urbanareas. Many local governments lack the financial resources to recruit additional policeofficers or buy basic equipment such as handcuffs or helmets. Often, underpaid policeofficers refuse to risk their lives by entering dangerous neighbourhoods. In some countriesthe vast majority of crimes are never investigated – overload, lack of resources,incompetence and corruption lead to the erosion of the investigative capacity of thecriminal justice system. In some cases, criminal networks become so powerful that theyeven threaten the state.
Strictly under embargo until Wednesday 22 September at 00:01 GMT (02:01 Geneva time)Crisis of legitimacyMany states with high levels of urban violence are characterized by their inability toprovide services or security, maintain an effective presence throughout their territoryor collect taxes. The social contract between the state and society is dysfunctional.When the social contract functions well, the state mobilizes sufficient public revenueand provides security and other essential services, and citizens pay taxes to finance stateactivity to produce these public goods. The state’s legitimacy – public confidence in thepolitical institutions, rules and cultural and social norms that regulate the operationof government – is enhanced and stability reinforced. When the state fails to meet thecitizens’ expectations, legitimacy is eroded.States may be unwilling or unable to meet the expectations of the people. In some countrieselite groups are not willing to fund social programmes and significant proportions of thenational budget may go towards military or other elite sectors while health and educationreceive only a fraction of the allocation needed to provide basic services. When citizenscommit to the social contract and consent to be governed, they expect that their basic needswill be met – this is the essence of legitimacy. If these expectations are ignored or repeatedlyfrustrated, legitimacy is eroded. When legitimacy is very low, citizens may be reluctant topay taxes and may condone or engage in anti-social, violent or criminal activity. For example,tax revenues in Mexico amount to 11 per cent of GDP, in Guatemala they are equivalentto 12 per cent, in Peru 16 per cent. In Pakistan, tax revenue has fallen to 9 per cent.Jamaica Red Crossvolunteer providingcounselling to childrenliving in the TivoliGardens garrisoncommunity in thecapital, Kingston,following an eruptionof violence earlierthis year.© Jamaica Red CrossWorld Disasters Report 2010 – Focus on urban risk83
Strictly under embargo until Wednesday 22 September at 00:01 GMT (02:01 Geneva time)84CHAPTER 4Unconsolidatedstate formation and weak political institutionsCountries undergoing a transition to democracy, emerging from periods of authoritarianrule or recovering from internal conflict are particularly vulnerable to high levels of urbanviolence. In the past, political authority may have been monopolized by a dominant rulingclass or coalition of powerful groups. This culture of monopolizing power and limitingaccess to other groups has frequently led to political instability and populism, sometimesprecipitating a crisis of legitimacy. These countries also tend to have weak political institutionswith multiple and often competing centres of power. When regimes are paralysedby divisions and state–elite conflicts, critical judicial and economic reforms, which arenecessary to consolidate democratic transitions, promote economic growth and developa genuine social contract, become impossible because they threaten the vested interestsof elites. Unreformed judicial systems remain politicized and corrupt and are often overwhelmedby the rise in crime and the demands of international counterterrorism andcounter-narcotics campaigns. Failure to respond effectively to rising crime and violencecreates a chain reaction as impunity destroys the credibility of the law enforcement systemand this in turn erodes its capacity for deterrence. This inhibits economic growth andundermines state capacity to deliver basic services, contributing to a worsening of theconditions of deprivation and inequality that drive people to commit violent acts.When the effectiveness of the law does not apply to all citizens and groups, or to all theterritory of the state, the state loses its authority. Impunity also contributes to a cultureof excessive force or brutality by police in poor neighbourhoods, including the practiceof torture and even summary execution of crime suspects from slum or shanty town settlements.Police have been known to target entire communities rather than individualoffenders, so that civilians view them as ‘enforcers’ and not protectors. These crimes oftengo unpunished. Data from the US State Department and Amnesty International showthat in 2006, extrajudicial killings accounted for more than 50 deaths in 31 countries. Inthe favelas of Rio de Janeiro, military police combat drug gangs by conducting violent massraids, turning neighbourhoods into urban battlefields. According to the UN Special Rapporteur,Brazilian police declared extrajudicial killings and summary executions to be “actsof resistance followed by death”, and recorded 1,330 of these ‘resistance killings’ in 2008.ExclusionGovernment failure to provide essential public goods leads to exclusion. For thewealthy this situation is often pre-empted by self-exclusion as they choose to hire privatesecurity forms, send their children to private schools or seek medical treatmentand preventive healthcare at private hospitals. But this self-exclusion only compoundsthe government’s failure and contributes to the creation of a different class of citizen,an underclass with little access to basic human needs, living on the fringes of anelite society whose opulence it can only access on a satellite TV channel. Research hasshown that the urban poor feel rejected by society, discriminated against and systematicallydenied the opportunities to improve their quality of life. This discriminationis internalized and expressed in lack of confidence in the state and its institutions
Strictly under embargo until Wednesday 22 September at 00:01 GMT (02:01 Geneva time)and in a sense of hopelessness for the future. Research also demonstrates that thissystematic segregation of the poor entrenches and perpetuates poverty over generations.One Latin American expert refers to a “dissident conscience” which develops inmarginalized urban communities and is commonly expressed through violence. Whenthe excluded and the marginalized look around and see business owners evading tax,politicians buying votes and appointing family members and friends to public posts,or using public money for personal gain, they lose confidence in the institutions of thestate and begin to question what they gain from obeying the law.StrategiesThe recently passed benchmark – more than half the world’s population living inurban centres – served to focus international attention on a major crisis that has notbeen adequately addressed until now. Thus far, solutions to the problems of urbanviolence have been scattershot and poorly financed, with little in-depth evaluation ofwhat works and what doesn’t.Asking the police and criminal justice system to fix everything may only make mattersworse. A broad-based response looks at better urban planning, effective and inclusivelocal governance, community involvement, reform of police and judicial systems, educationand jobs for youth, effective international laws against organized crime, disarmamentand gun awareness, and tailored responses to the specific circumstances ofeach particular local context.Meaningful citizen involvement in local governance is key to reducing urban violence.The social contract between the state and society is based on an active dialogue aboutthe expectations that citizens have of the state, its capacity to provide services, includingsecurity, and to secure revenue from its population and territory to provide theseservices. In addition, because people’s needs and expectations of the state evolve overtime and the state’s capacity and resources are impacted by changes in both domesticand international political and financial conditions, this dialogue needs to be continuallyrevisited and the agreement updated. A fundamental precondition for an effectivesocial contract, therefore, is a set of effective political institutions and processesthrough which the state and its citizens can engage, consult and dialogue to renegotiateand reinstitutionalize aspects of the contract.As the government representatives closest to the people, strong local leaders can increase astate’s legitimacy. Local authorities that engage with constituents, respond to their needsand include them in decision-making can build trust in the community and encourageinter-group dialogue to ease any tensions. At the same time, community involvementin urban planning, service provision and violence-reduction strategies increasesthe chances that they will work. To ensure they can deliver on their commitments,municipal governments need to have enough autonomy and resources to act effectively.World Disasters Report 2010 – Focus on urban risk85
Strictly under embargo until Wednesday 22 September at 00:01 GMT (02:01 Geneva time)86CHAPTER 4In Latin America, several countries have delegated authority to the cities, with positiveresults. In Medellín, Colombia, the homicide rate fell from 174 to 29 per 100,000inhabitants between 2002 and 2007, largely thanks to local government initiatives.Mayors emphasized violence prevention, worked with civil society organizations andinvested in supplying informal settlements with public transport, education, housingand even libraries. In Bogotá, mayors backed police training missions, improved publictransport, built libraries and put restrictions on guns and alcohol. These and othermeasures brought down the homicide rate from 80 per 100,000 inhabitants in 1993to 19 per 100,000 in 2007.Following an increase in firearm violence, Toronto, Canada, is advocating for a countrywidehandgun ban.Urban planning, design and management are important elements in safety. Criminalacts tend to occur and reoccur in specific places: dark alleys, unlit areas, isolated busstops. The physical layout of a city, its lighting, landscape maintenance and transportationsystems can create or diminish opportunities for crime. A woman who commutesfrom work late at night and must walk on a dark, empty road from her bus stop to herhome is easy prey for potential offenders.In 1996, UN-Habitat launched the Safer Cities Programme, after several African mayorsasked the organization for help in addressing urban insecurity. This programmecontributes to UN-Habitat’s main goal of sustainable urbanization by creating partnershipswith local governments to prevent crime and violence through planning andmanagement.Community policing has spread to cities around the world and in a variety of forms.Basically, it holds that community participation is a necessary part of the security processand that the police are accountable to the people. In Mumbai, where police areoften corrupt or absent, authorities have created a system of panchayats, neighbourhoodorganizations that serve as links between slum dwellers and the local police.The panchayats resolve disputes at the local level, improve police accountability andempower women, since many of the volunteer representatives are female.A form of community policing is now having an impact on the favelas of Rio, too. Inlate 2008, Brazil’s military police moved into the Santa Marta slum, battling the druggangs and eventually clearing them out. Then the city’s first ‘pacifier police division’stayed on, opening permanent bases in the favela, while the state invested in paving thestreets, painting houses and building a health centre. The project has been copied inother favelas, reducing violent crime by up to 85 per cent in some areas and there areplans to extend it throughout the city by the time of the 2016 Olympics. It must benoted, however, that the police alone cannot solve the pressing problems of unemploymentand a lack of public services, which continue to weigh heavily upon Rio’s favelas.
Strictly under embargo until Wednesday 22 September at 00:01 GMT (02:01 Geneva time)At the same time, many of the world’s largest cities are relatively secure, proving thaturban settings are not automatic backdrops for murder and mayhem. With enoughleadership, imagination and cooperation, solutions can be found to make the 21stcentury metropolis a safe and desirable place to live.Box 4.2 Red Cross Red Crescent actionThe Red Cross Red Crescent strives to preventurban violence by improving children’s self-esteem,teaching them skills and demonstratingpeaceful resolution of conflict. In Sierra Leone,where children suffered through 11 years ofcivil war and were often made to fight, the SierraLeone Red Cross Society developed childadvocacy and rehabilitation centres (since expandedto Liberia). The programme offers psychosocial,educational and vocational trainingto war-affected youth and ex-combatants,helping them to reintegrate their communities.In South Africa, a programme entitled ‘Socceragainst crime’ brings young people of differentbackgrounds together to play the sport, to helpend the kind of discrimination and violenceagainst foreigners that devastated Gautengprovince in 2008.In Central America and the Caribbean, theSpanish Red Cross runs a violence preventionproject with eight countries. It targets youthleaders at risk and involves them in a varietyof social projects which differ from country tocountry. In Guatemala, they do theatre and singing.In Nicaragua, young people learn to makenecklaces and bracelets by hand and sell themin their communities. In the Dominican Republic,youth help to clean up national parks and coastlines.“Our work is to help them become partof their communities,” Juan José Martinez Solis,violence prevention coordinator for the SpanishRed Cross, told the World Disasters Report.A Canadian Red Cross programme calledRespectED teaches children and youth to stopbullying, harassment, dating violence andabuse. It has been expanded to urban settingsin Sri Lanka and Guyana. And in Norway, theRed Cross has a street mediation programme,where young people teach their peers how tocommunicate peacefully and manage conflict.A standby mediation team intervenes in ongoingconflicts, such as those between gangs.When Michel Minnig, former head ofthe International Committee of the Red Cross(ICRC) in Southern America, arrived in the regionin 2004, he was struck by the gravity ofthe situation in Rio’s favelas. As he explained,“The consequences for the civilian populationof this armed violence in an urban setting weresimilar to the ones we used to see in an armedconflict – people killed and wounded, a lackof infrastructure, a whole range of tension andabuse.” Minnig was one of the early proponentsof ICRC action to help improve dignityfor and respect towards the most vulnerable inhabitantsof Rio’s favelas. And so in December2008, the organization launched a pilot projectin seven of the city’s most wretched slums.Since then, the ICRC, the Brazilian RedCross and other local and state actors havestarted to work together, conducting first-aidtraining for residents, ensuring access to medicalcare including mental health, addressingthe situation of adolescent mothers andtheir children, working with seven schools toimprove humanitarian values and space intheir surroundings. Very importantly, the ICRCworks with the police to integrate internationalWorld Disasters Report 2010 – Focus on urban risk87
Strictly under embargo until Wednesday 22 September at 00:01 GMT (02:01 Geneva time)human rights standards and humanitarian principlesinto their work.The IFRC promotes the Youth as Agents ofBehavioural Change programme, which inviteschildren to participate in role-playing games orvisualization exercises and then discuss their emotions.For example, a group forms a circle andprevents others from breaking through, a gamethat teaches empathy for excluded immigrants.The games are an instinctive, non-cognitiveway to learn compassion, active listening, criticalthinking, non-judgement, mediation and apeaceful resolution of tensions. Games andexercises are adapted to meet the needs andchallenges of each national context and peereducation is essential. “The programme is aboutchanging mindsets, attitudes and behaviour ina society and how youth can play a leadershiprole in that,” said IFRC’s Katrien Beeckman, whofounded the programme. The future of urban violenceAt best, however, these strategies can only hope to lessen the impact of violence in thetargeted communities. This is not to deny the important progress that has been madethrough community-centred approaches and development initiatives. For example, theadoption of targeted social programmes that deal directly with the problem of poverty,such as the Benazir Bhutto Income Support Programme in Pakistan, Progresiva in Mexicoor Bolsa Familia in Brazil and other conditional cash transfer schemes, have helped reduceincome inequality in targeted communities. But these gains are threatened by globaleconomic conditions, ageing populations and the failure to extend the benefits throughreforms that improve the quality and reach of health and education services nationally. Forexample, while developed countries regularly spend up to 18 per cent of total governmentexpenditure on health, Kenya spends only 6.1 per cent, Jamaica barely 4.2 per cent andPakistan a paltry 1.3 per cent. And while important progress has been made in the numberof children attending primary and secondary school education, the quality is oftenappalling. In Brazil where 70.4 per cent of the population is qualified as ‘low educationattainment’ in the UN Development Programme’s 2009 Human Development Index, aquarter of the education budget is spent on free university education while primary andsecondary education is neglected. In parts of Pakistan, the female literacy rate is 3 per cent.Regardless of how sophisticated the economic models used to develop governmentstrategies to cushion the effects of economic crisis and support income redistributionare, no amount of social spending or development programming innovations will beable to withstand the corrosive impact of corruption or to resist being derailed by elitegroups if the political system does not establish equality before the law. The principlethat the law of the land should apply equally to all is a cornerstone of a free societyand one which is often markedly absent in countries where urban violence is rife. Thediscretionary application of tax codes, zoning laws, public procurement and contractingregulations, criteria for public appointments, restrictions on the exploitation ofnatural resources and even court rulings, benefits the few and establishes a neo-feudalhierarchy of elite groups, special interests and favoured individuals, creating one of themost powerful incentives for widespread crime and violence. International assistance88
Strictly under embargo until Wednesday 22 September at 00:01 GMT (02:01 Geneva time)can help, but – as the Organisation for Economic Co-operation and Development’sDevelopment Assistance Committee points out – international actors have not yetadequately incorporated into policies or practice a sufficiently nuanced understandingof the dynamics of state failure to establish stable political order or developed appropriatelycontextualized state-building strategies.International assistance is also needed to tackle the tidal wave of urban violence drivenby drug production and trafficking in Latin America. It is no coincidence that theCaribbean basin has the world’s highest murder rate. The 2008 report of the LatinAmerican Commission on Drugs and Democracy – chaired by Fernando HenriqueCardoso, Ernesto Zedillo and César Gaviria, former presidents of, respectively, Brazil,Mexico and Colombia – stated categorically that the so-called ‘war on drugs’ was afailure, with staggering costs for the hemisphere, and called for a new paradigm to dealwith the problems of narcotics. Similarly, calls for the restoration of the United Statesban on the sale of assault weapons which expired in 2004 have been echoed by officialsin both the US and the countries of the Caribbean basin in which tens of thousands ofweapons originating in the United States are seized every year.As this <strong>chapter</strong> illustrates, the dramatic increase in urban violence is rooted in the economic,social and political conditions in which rapid urbanization takes place and theglobalization of international crime and in particular drug trafficking and the illegaltrade in firearms. Without comprehensive action to tackle these conditions, addresseconomic inequality and reform political systems characterized by weakness and instability,violence is likely to continue. Ultimately, confronting elite and special interestgroups may be the single most important challenge for violence reduction.Chapter 4 was co-written by Amy Serafin, freelance journalist, and Sean Deely, independentconflict and development analyst. Box 4.1 was contributed by Gurvinder Singh, CanadianRed Cross, and Sandra Gutiérrez, IFRC Principles and Values Department. AmySerafin contributed Box 4.2.Sources and further informationAgostini, G. et al. Understanding the Processes of Urban Violence – An AnalyticalFramework. London: Crisis States Research Centre, Development Studies Institute,London School of Economics and Political Science, 2008.BBC. ‘Jamaica unrest: Your stories’. BBC News, 25 May 2010. Available online: http://newsvote.bbc.co.uk / mpapps / pagetools / print / news.bbc.co.uk/2/hi / americas/8703872.stm?ad=1.BBC. ‘Profile: Christopher “Dudus” Coke’. BBC News, 24 May 2010. Available online:http://news.bbc.co.uk/2/hi / world / latin_america/10146172.stm.World Disasters Report 2010 – Focus on urban risk89
Strictly under embargo until Wednesday 22 September at 00:01 GMT (02:01 Geneva time)90CHAPTER 4CanadianConsortium on Human Security. Human Security for an Urban Century:Local Challenges, Global Perspectives. Vancouver, 2007.Cardona, J. ‘“Cops and narcos” playground games for Mexico kids’. Reuters, 17 May2010. Available online: www.reuters.com / article / idUSN13272264.Carter, S. ‘Exclusive: 100,000 foot soldiers in Mexican cartels’. Washingtontimes.com,3 March 2009. Available online: www.washingtontimes.com / news/2009/mar/03/100000-foot-soldiers-in-cartels/.Casas-Zamora, K. Drugs and Democracy: Towards a Paradigm Shift. The BrookingsInstitution, 22 April 2010. Available online: www.brookings.edu / opinions/2009/0422_drugs_and_democracy_casaszamora.aspx.Centre for International Cooperation and Security Department of Peace Studies.The impact of armed violence on poverty and development. Full report of the ArmedViolence and Poverty Initiative, University of Bradford, March 2005.Council on Foreign Relations. Organized Crime in the Western Hemisphere:An Overlooked Threat? A Council on Foreign Relations Symposium, 18 November2009. Available online: www.cfr.org / project/1445/cfr_symposium.html.Covell, K. Seen, heard and believed: What youth say about violence. Ontario, Canada:Canadian Council of Provincial Child and Youth Advocates, Save the ChildrenCanada and UNICEF, 2006.Daniels, A. ‘Taming Brazil’s favelas’. The Daily Telegraph, 11 March 2010. Availableonline: www.telegraph.co.uk / news / worldnews / southamerica / brazil/7414677/Taming-Brazils- favelas.html.Davis, N. ‘Haiti and Jamaica’s deadly trade’. BBC News, 25 October 2008. Availableonline: http://news.bbc.co.uk/2/hi / americas/7684983.stm.Dowdney, L. Children of the Drug Trade: A Case Study of Children in Organized ArmedViolence in Rio de Janeiro. Rio de Janeiro: Viveiros de Castro Editora Ltda, 2003.Downie, A. ‘Behind Brazil’s Killing Spree’. Time, 17 May 2006. Available online:www.time.com / time / world / article/0,8599,1195272,00.html.Economist, The. ‘Lump Together and Like It: The problems – and benefits – of urbanizationon a vast scale’. 6 November 2008.Economist, The. ‘The mob takes on the state’. 18 May 2006.Fairholm, J. and Singh, G. Handbook on preventing violence against children. Vancouver,Canada: Canadian Red Cross Society, 2010.Fox, S. and Hoelscher, K. The Political Economy of Social Violence. Crisis States ResearchCentre, Development Studies Institute, London School of Economics WorkingPaper 72.2, 2010.
Strictly under embargo until Wednesday 22 September at 00:01 GMT (02:01 Geneva time)Fukuyama, F. ‘A Quiet Revolution: Latin America’s Unheralded Progress’, in ForeignAffairs, November / December 2007, Washington DC: Council on ForeignRelations.Helps, H. ‘Drug-linked violence shakes Jamaica capital, 31 dead’. Reuters, 25 May2010. Available online: www.reuters.com / article / idUSN25506808.Helps, H. ‘Four killed as Jamaicans clash over drug lord’. Reuters, 24 May 2010.Available online: www.reuters.com / article / idUSTRE64 M2CP20100525?loomia_ow=t0: s0: a49: g43: r3: c0.073171: b34325232: z0.Helps, H. ‘Jamaica declares emergency in capital over violence’. Reuters, 23 May 2010.Available online: www.reuters.com / article / idUSTRE64 M2CP20100523?loomia_ow=t0: s0: a49: g43: r4: c0.082430: b34301492: z0.IKV Pax Christi. Kidnapping is Booming Business. July 2008.International Centre for the Prevention of Crime (ICPC). International Report onCrime Prevention and Community Safety: Trends and Perspectives. Montreal: ICPC,2010.International Red Cross and Red Crescent Movement. Together for humanity.Declaration at the 30th International Conference of the Red Cross and RedCrescent. Geneva: International Federation of Red Cross and Red CrescentSocieties, 2007.Jayasinghe, M. Pakistan – A Preliminary Evaluation of the Tax Gap. Atlanta: GeorgiaState University, 2007.Lauria, C. Drug Trade, Violent Gangs Pose Grave Danger. Committee to ProtectJournalists, 10 February 2009.Liebermann, S. and Coulson, J. ‘Participatory Mapping for Crime Prevention in SouthAfrica – local solutions to local problems’ in Environment and Urbanization, Vol.16, No. 2, 2004.McIlwaine, C. and Moser, C. Urban Poor Perceptions of Violence and Exclusion inColombia. Washington DC: The World Bank, 2000.Moser, C. and McIlwaine, C. Participatory urban appraisal and its application for researchon violence. London: International Institute for Environment and Development-SAGE, 1999.Moser, C. ‘Urban violence and insecurity: An introductory roadmap’ in Environmentand Urbanization, Vol. 16, No. 2, 2004.Moser, C. Reducing Urban Violence in Developing Countries. Brookings Global Economyand Development, Policy Brief 2006-1, November 2006.World Disasters Report 2010 – Focus on urban risk91
Strictly under embargo until Wednesday 22 September at 00:01 GMT (02:01 Geneva time)92CHAPTER 4Neild,R. Themes and debates in public security reform: A manual for civil society,Community Policing. Washington Office on Latin America, 2009. Available online:http://gw.wola.org / media / Security%20Policy / pub_security_themesdebates_5communitypolicing.pdf.O’Donnell, G. On the State, Democratization and Some Conceptual Problems: A LatinAmerican View with Glances at Some Post-Communist Countries. Working Paper#192, April 1993.Organisation for Economic Co-operation and Development (OECD) DevelopmentAssistance Committee (DAC). Concepts and Dilemmas of Statebuilding in FragileSituations: From Fragility to Resilience. OECD DAC Discussion Paper. Paris:OECD, 2008.OECD DAC. Small Arms and Light Weapons (SALW). OECD DAC Issues Brief. Paris:OECD, 2005.Ortega, S.T. et al. ‘Modernization, age structure, and regional context: a cross-nationalstudy of crime’ in Sociological Spectrum, Vol. 12, pp. 257–277, 1992.Pinheiro, P.S. World report on violence against children. New York: United Nations, 2006.Rodgers, D. Dying for it: gangs, violence and social change in urban Nicaragua. CrisisStates Research Centre Working Papers, series 1, 35. London: London School ofEconomics and Political Science, Crisis States Research Centre, 2003.Serrano, M. and Celia Toro, M. ‘From Drug Trafficking to Transnational OrganizedCrime in Latin America’ in Berdal, M. and Serrano, M. (eds.) TransnationalOrganized Crime and International Security: Business As Usual? Boulder, Colorado:Lynne Rienner Publishers Inc., 2002.Sheridan, M.B. ‘Mexico’s Calderón tells Congress he needs U.S. help in fighting drugwars’. The Washington Post, 21 May 2010.Small Arms Survey. Guns and the City. Geneva: Small Arms Survey, 2007.Stavrou, A. Crime in Nairobi: Results of a Citywide Victim Survey. Safer City Series #4.Nairobi: United Nations Human Settlements Programme (UN-Habitat), 2002.Stevens, A. and Bewley-Taylor, D. with contributions from Dreyfus, P. Drug marketsand urban violence: Can tackling one reduce the other? The Beckley FoundationDrug Policy Programme. 2009. Available online: www.beckleyfoundation.org / pdf / report_15.pdf.Strategic Forecasting, Inc. (STRATFOR). Mexican Drug Cartels: Government Progressand Growing Violence. Austin, Texas: STRATFOR, 2008.Tedesco, L. Urban Violence: A Challenge to Institutional Strengthening the Case of LatinAmerica. FRIDE Working Paper 78. Madrid: FRIDE, 2009.
Strictly under embargo until Wednesday 22 September at 00:01 GMT (02:01 Geneva time)Tedesco, L. Latin American States – Failed or Evolving? FRIDE Working Paper 37.Madrid: FRIDE, 2007.United Nations (UN). Background paper. Workshop on Practical Approaches toPreventing Urban Crime, Twelfth UN Congress on Crime Prevention and CriminalJustice, Salvador, Brazil, 2010.UN. ‘The Chronicle Interview: Miloon Kothari’, in UN Chronicle, Issue 1, 2006.Available online: www.un.org / Pubs / chronicle/2006/issue1/0106p44.html.United Nations Development Programme (UNDP). Human Development Report2009. New York: UNDP, 2009. Available online: http://hdr.undp.org / en / reports / global / hdr2009/.UNDP. Build your own tables – Human Development Report 2009. Available online:http://hdrstats.undp.org / en / buildtables / rc_report.cfm.United Nations Economic Commission for Latin America and the Caribbean(ECLAC). Social Panorama of Latin America. ECLAC Briefing Paper, November2009. Available online: www.cepal.org / cgi-bin / getProd.asp?xml=/publicaciones/xml/0/37840/P37840.xml&xsl=/dds / tpl-i / p9f.xsl&base=/tpl-i / top-bottom.xslt.UN Human Settlements Programme (UN-Habitat). Global Report on HumanSettlements 2009: Planning Sustainable Cities. Nairobi : UN-Habitat, 2009.UN-Habitat. The Challenge of Slums – Global Report on Human Settlements 2003.Nairobi : UN-Habitat, 2003.UN-Habitat. Global Report on Human Settlements 2007: Enhancing Urban Safety andSecurity. Nairobi: UN-Habitat, 2007.UN Office on Drugs and Crime (UNODC). Crime and Development in CentralAmerica, Caught in the Crossfire. Vienna: UNODC, 2007.United States Department of Justice. National Drug Threat Assessment 2010.Washington DC: US Department of Justice, National Drug Intelligence Centre,2010.United States Department of State. 2010 International Narcotics Control Strategy Report.Washington DC: US Department of State, Bureau of International Narcotics andLaw Enforcement Affairs, 2010. Available online: www.state.gov / p / inl / rls / nrcrpt/2010/vol1/137194.htm.World Bank. Dhaka: Improving Living Conditions for the Urban Poor. BangladeshDevelopment Series, Paper No. 17. Dhaka: World Bank, June 2007.Youth as Peacebuilders, Medellín, Colombia. Interview available online: www.childrenyouthaspeacebuilders.ca/ pdfs / kind/24.pdf.World Disasters Report 2010 – Focus on urban risk93
Strictly under embargo until Wednesday 22 September at 00:01 GMT (02:01 Geneva time)94CHAPTER 5
Strictly under embargo until Wednesday 22 September at 00:01 GMT (02:01 Geneva time)Urban risk to healthThe rapid rise in the number of people living in urban centres and cities around theglobe brings with it new forms of urban risk in the health sector. It is a tragic irony,but millions of people continue to be exposed daily to diseases that medical science haslong known how to prevent and / or to cure. Acute respiratory infections, dysentery anddiarrhoea, largely under control in cities in high-income countries, continue to exacta significant toll on the health and well-being of a disproportionate number of thosewho live in the sprawling slums of the developing world. Tuberculosis (TB) is rampantin many cities worldwide regardless of their overall economic status. At the same time,more recent non-infectious conditions such as diabetes, heart disease and depression,which are linked to urban lifestyles, threaten both rich and poor in all countries. OnWorld Health Day in April 2010, Jacob Kumaresan, director of the World HealthOrganization’s Centre for Health Development based in Kobe, Japan, said: “Whileurban living continues to offer many opportunities, including potential access to betterhealthcare, today’s urban environments can concentrate health risks and introducenew hazards.”The World Health Organization (WHO) cites a multitude of health challenges inmodern cities, relating to “water, environment, violence and injury, non-communicablediseases (cardiovascular diseases, cancers, diabetes and chronic respiratory diseases),unhealthy diets and physical inactivity, harmful use of alcohol as well as therisks associated with disease outbreaks. City living and its increased pressures of massmarketing, availability of unhealthy food choices and accessibility to automation andtransport all have an effect on lifestyle that directly affect health.”The conundrum of urban living is that, on the one hand, in well-governed cities wherehealth and social services are available alongside safe and well-functioning infrastructure,people can aspire to live to a ripe old age. People living in the progressive cityenvironment of Porto Alegre in Brazil have a life expectancy of 76 years. But even inthe United Kingdom, a member of the G8, variations in urban wealth and employmentseem to be key determinants of good health and life expectancy. Research by theChartered Society of Physiotherapy has found that men live an average of 69.3 years inthe city of Glasgow compared to 80.8 years in the more affluent environs of London’sChelsea and Kensington. WHO has cited “the extremely poor health, more characteristicof a poor developing country” of the inner city poor as a factor in reducing overalllife expectancy for the United States.Nonetheless, city life can bring significant health benefits. Cities where environmentalhealth hazards are reduced through provision of a safe water supply, sanitation,waste management and adequate shelter, and in which pollution is monitored andcontrolled, have lower mortality and morbidity rates. People in well-organized urbanPhoto opposite page:Living in towns andcities can bringnotable healthbenefits, but urbanareas can also attractinfectious disease,while non-infectiousconditions such asdiabetes and heartdisease are linked tourban lifestyles andthreaten city dwellersall over the world.© Claudia Janke/British Red CrossWorld Disasters Report 2010 – Focus on urban risk95
Strictly under embargo until Wednesday 22 September at 00:01 GMT (02:01 Geneva time)96CHAPTER 5environmentscan generally expect to live longer as they will also be well informedabout the health benefits of not smoking, hygiene, good diet and exercise.The other end of the urban health spectrum can be found in low- and middleincomecountries where most of the world’s impoverished urban dwellers live. Inhouseholds lacking basic shelter services – water supply and sanitation in particular– the prevalence rate of diarrhoea among urban children soars, averaging 38per cent in Pakistan, 33.3 per cent in Cameroon, 23.9 per cent in the DemocraticRepublic of the Congo and 32.3 per cent in Jordan. Diarrhoeal diseases account fornearly 2 million deaths out of a total of almost 10 million among children underthe age of 5. There are parallels here with what we see unfolding in relation to theimpact of natural disasters on urban centres and the dramatic differences in fatalitiesbetween low- and high-income nations (as highlighted in Chapter 1). Over theperiod from 1990 to 2006, industrialized countries saw under-5 child mortalityrates drop from 10 to 6 per 1,000 live births, while in developing countries overallthe reduction was only 103 to 79, a staggering gap which captures the urban riskdivide in health.In 2008, the average urban centre in Australia would not have experienced an infantmortality rate (IMR) of more than 5 per 1,000 live births, whereas, in the same year,the Nairobi Urban Health and Demographic Surveillance System, which covers ademographic surveillance area that straddles the two slums of Korogocho and Viwandaniwith a combined population of 73,661, found an IMR of 87 per 1,000 live births,above the national average of 81. It is not the fact of urban life as such that poses theproblem for health; rather, it is the way in which these cities are governed and theapplication, or not, of appropriate public health and housing policies which determinethe health consequences for the inhabitants.Hunger and malnutrition in urban settings result not only from food insecurity (seeBox 5.1) but are also a consequence of environmental hazards and shelter deprivation.Unhealthy living conditions in urban slums create a vicious circle whereby thelikelihood of a child contracting diarrhoea, an acute respiratory tract infection and / ormalaria are greatly increased by poor waste management and non-existent water treatmentsystems. According to current research almost half of all nutritional problems arelinked to slum living conditions. Malnutrition is particularly lethal in combinationwith infectious diseases such as pneumonia, malaria, measles and diarrhoeal diseases– the major killer diseases affecting children. It is an underlying factor in over half ofall child deaths.Data cited by the United Nations Human Settlements Programme (UN-Habitat)show that the prevalence of child malnutrition can often be higher in urban areas thanin rural areas in countries such as Benin and the Democratic Republic of the Congo.In the case of the latter, “46 per cent of children living in non-durable urban housing
Strictly under embargo until Wednesday 22 September at 00:01 GMT (02:01 Geneva time)are malnourished, compared with 16 per cent in rural areas […] in India, 45 per centof children from households without adequate sanitation are malnourished accordingto recent Demographic and Health Survey data”.Today, over 25 per cent of the world’s urban population live in informal settlementsor slums. A slum household is defined by UN-Habitat as lacking one or more ofthe following: durable housing; sufficient living area; access to water and sanitation;and secure tenure. There are no reliable statistics available for this last indicator.Boosted by immigration from rural areas and continuing high birth rates, today’sUN-Habitat estimate of 827.6 million slum dwellers is expected to hit a total of 889million by 2020 assuming government efforts to tackle the issue are maintained andstepped up.In many cases and especially in the developing world, urbanization has taken placeso quickly that governments have struggled to keep up when it comes to providingneeded infrastructure. When people are crowded together in unsanitary conditions,disease thrives. A 2005 report in The Lancet estimated that nearly half the urban populationin Africa, Asia and Latin America has one or more of the main communicablediseases associated with inadequate water and sanitation – including diarrhoea andworm infections. Even in the developed world, cities can attract infectious disease.TB incidence, for example, is much higher in big cities, even in developed countries.New York has four times the national average TB infection rate. In some parts of London,TB is more common than in China.But infectious diseases are only a part – and an increasingly small part on a globalscale – of the health challenge facing urban dwellers. Non-communicable diseases andmedical conditions, such as heart disease and diabetes, kill 35 million people a year.According to a 2009 WHO survey, the leading global risks for mortality in the worldare high blood pressure (responsible for 13 per cent of deaths globally), tobacco use(9 per cent), high blood glu cose (6 per cent), physical inactivity (6 per cent) and overweightand obesity (5 per cent). These risks are responsible for exposure to chronicdiseases such as heart disease, diabetes and cancers.Countries in South-East Asia and sub-Saharan Africa are particularly affected by theburden of disease as measured by WHO in disability adjusted life years (DALYs).These are underweight (6 per cent of global DALYs) and unsafe sex (5 per cent), followedby alcohol use (5 per cent) and unsafe water (4 per cent). While the other threeparticularly affect South-East Asia and sub-Saharan Africa, alco hol use shows a uniquegeographic and sex pat tern, with its burden highest for men in Africa, in middleincomecountries in the Americas and in some high-income countries.On current trends, non-communicable diseases – those that are not infectious and donot spread from person to person – will be responsible for 75 per cent of all deathsWorld Disasters Report 2010 – Focus on urban risk97
Strictly under embargo until Wednesday 22 September at 00:01 GMT (02:01 Geneva time)100CHAPTER 5slums of the Indian capital, New Delhi, many health indices, such as infant mortality,are worse than in rural areas, which were long considered to suffer the worst ravages ofpoverty and deprivation. Like other big developing country metropolises, New Delhiattracts migrants from rural areas in search of work and what they hope will be a betterlife. For instance, many were attracted to the city by the prospect of jobs in constructionas the city set about putting in place the necessary infrastructure for the AsianGames in 1982. Ironically, many of those workers who settled with their families inthe Pashta slums on the banks of the Yamuna River have now found themselves amongthe 150,000 people who have been made homeless as the courts ordered a 40-hectare(100-acre) strip along the Yamuna to be cleared for a riverside promenade close to a keysite for 2010’s Commonwealth Games.In New Delhi, slum dwellers make up over 40 per cent of the population. Peopledefecate outside in the fields or the drains, according to Asha, a non-governmentalorganization (NGO) that works with slum dwellers to improve their living conditions.Residents are exposed to stagnant water, open drains, floods, rubbish, and noise andair pollution. It is little wonder that people get sick. Open sewers are just one of theunsanitary aspects of slum conditions. In addition to helping the spread of dysentery,cholera and other preventable diseases, the water contains parasites such as hookworm,whipworm and roundworm that infect the slum dwellers and children in particular.In a country with a fast-growing economy and a middle class larger than that of theUnited States, New Delhi is also a glaring example of the health inequalities to befound in big cities. “There is a stark dichotomy here. On the one hand, Delhi has agood health infrastructure with excellent health facilities, which are, in fact, better thanother parts of the country. For instance, it is possible to have a heart transplant here, ata cost. Yet, the urban poor cannot access even the most basic of healthcare facilities,”said Thomas Chandy of Save the Children India.Sometimes, people living in slums and informal settlements do not even show upon official population statistics, so it is little surprise if health and other services arealso not provided. The population of the Haitian capital Port-au-Prince was 700,000,according to the last official census taken in 2003. But the real number is more thanthree times higher. “You see people moving for economic need into unplanned periurbanenvironments, with a great deal of overcrowding, re-creating the conditionsof the 19th century. It is as if none of the lessons of the 19th century health movementhad been learned,” said Michael J. Ryan, director of WHO’s Global Alert andResponse department.Children bear the bruntChildren are most at risk from the precarious sanitary and health conditions reigningin slum areas. UN-Habitat’s State of the World’s Cities 2006/7 report states that
Strictly under embargo until Wednesday 22 September at 00:01 GMT (02:01 Geneva time)Getting public healthinformation to allurban dwellers,including those inremote or informalsettlements, is essentialto stop the spreadof disease. Here aMalagasy Red CrossSociety volunteer tellsinhabitants of thecapital, Antananarivo,about a vaccinationcampaign for children.© BenoitMatsha-Carpentier/IFRCNew research suggests that HIV may have been around in central Africa for far longerthan was initially suspected. It was possibly only with the growth of urban centres, suchas Kinshasa, the capital of the Democratic Republic of the Congo, that the disease tookroot and then picked up the momentum to spread quickly around the world. In mostparts of the world, HIV / AIDS is a predominantly urban phenomenon. UNAIDS, theUN’s Joint Programme on HIV / AIDS, estimates that, on average, HIV is 1.7 timesmore prevalent in urban than in rural areas. This is largely explained by the fact thatmany of the risk factors, such as injecting drug use, are also more common in cities. Sexworkers or men who have sex with other men, two other high-risk groups, are also morenumerous in cities, if only because of the higher population density. But even in sub-Saharan Africa, where HIV is transmitted principally through unprotected heterosexualsex, research shows that urban women are more likely to be infected than rural women.New diseases can emerge by jumping the species barrier from animals to humans.This was certainly the case in one of the two diseases that have most alarmed internationalhealth officials in recent years – the H5N1 flu virus, more commonly knownas ‘bird flu’ or ‘avian flu’, which is believed to have originated in wild fowl. It was alsoprobably true of the other, SARS (severe acute respiratory syndrome). Both diseasesdemonstrated how dense, urban living conditions provide the ideal breeding groundfor new viruses.102
Strictly under embargo until Wednesday 22 September at 00:01 GMT (02:01 Geneva time)SARS caused near global panic for a while after it erupted in mainland China and thenHong Kong in late 2002 and early 2003. It has been called the first disease of the internetage because global communications helped fan fears about its potentially deadlyimpact. In the end only some 8,000 people caught the respiratory disease, mainlyin South-East Asia and Canada, but it was fatal in nearly 900 cases. The newness ofthe disease, the fact that it was initially little understood and its high fatality rate,compared with the one in 1,000 of normal seasonal influenza, all stoked the worldwideanxiety. International flights were cancelled and schools, shops and offices shut inheavily affected cities such as Hong Kong and Singapore.People in Hong Kong stopped going out and donned face masks. Sales of bottledvinegar soared because it was believed to act as an effective disinfectant. Tourism inthe most affected areas slumped. Switzerland even barred jewellers from Hong Kongfrom taking part in the annual international jewellery fair at Basle, and the women’ssoccer World Cup was moved from China to the United States. Hong Kong’s economyshrank 2.6 per cent and Singapore’s by 2 per cent in the first half of 2003. Overall, theAsian Development Bank estimated losses in tourism revenue at nearly US$ 15 billion,or 0.5 per cent of gross domestic product.Fortunately, the H5N1 virus, with a fatality rate of some 60 per cent – far higher thanSARS – is not easily transmitted between humans. Since first appearing in China andViet Nam in 2003, it has infected some 500 people, mainly in South-East Asia andEgypt. Nearly 300 deaths have been confirmed. The disease is now endemic in poultryin certain parts of the world. Worryingly, cities of South-East Asia – where the keepingof live poultry and live poultry markets are common – offer a pool of possible futureinfection and raise the spectre that the virus could yet mutate and pose a new threat.If the H5N1 virus were as contagious as the latest new influenza bug – H1N1 –then the impact in terms of loss of life could be catastrophic. H1N1, which was firstdetected in Mexico in April 2009, has been among the fastest-spreading viruses everrecorded. By the time WHO declared a global pandemic a mere two months later,74 countries and territories had reported infections. As of April 2010, cases had beenreported in 214 countries, including 17,798 deaths. Again, cities speeded contagionlocally, with international travel doing the rest.“In terms of risk management human populations are now forced to live in a way thatprovides a wonderful point of amplification for disease and then travel and trade andthe whole connection between these urban centres is creating a pathway to globalizationfor these diseases,” noted WHO’s Ryan.Perhaps one of the best examples of how urban living can stoke epidemics is the tropicaldisease dengue fever. The incidence of dengue, whose effects can range from mild fever tofatal haemorrhaging, has grown dramatically worldwide to the point that some 2.5 billionWorld Disasters Report 2010 – Focus on urban risk103
Strictly under embargo until Wednesday 22 September at 00:01 GMT (02:01 Geneva time)– two-fifths of the world’s population – are now at risk, according to WHO.The organization estimates that there may be as many as 50 million infections every year,with most going unreported. In the Americas there were more than 890,000 reportedcases of dengue in 2007, of which 26,000 were of the often-fatal haemorrhagic fever type.104CHAPTER 5peopleYet 50 years ago, the disease was virtually unknown. It first appeared in Manila in thePhilippines in 1953 and had jumped to Bangkok, Thailand by the end of the decade.Before 1970, only nine countries had experienced epidemics of the severe haemorrhagicfever, which kills in almost 25 per cent of cases. By 1995, this number had risento around 40. The disease is now endemic in more than 100 countries in Africa, theAmericas, the eastern Mediterranean, South-East Asia and the western Pacific. Notonly is the number of cases increasing, as the disease reaches new areas, but so too is thenumber of serious outbreaks. In 2007, Venezuela reported over 80,000 cases, includingmore than 6,000 cases of haemorrhagic fever.The disease is spread by the Aedes aegypti mosquito, which has come to thrive in tropicalurban environments. It breeds in and around city homes, in roof gutters, beneathrefrigerators, under flowerpots and anywhere there is stagnant water, including in wastepackaging and discarded food tins. Used tyres are a favourite breeding ground. Withglobalization, the mosquito also gets to travel easily. Dengue is thought to have arrivedin Brazil, now one of the most affected countries, in the rims of tyres exported from Asia.Cities change usWith 70 per cent of the global population forecast to be living in urban areas by 2050,the predominant lifestyle around the world will become increasingly an urban one. Butwhat are the implications of an urban lifestyle for health? It is a mixed picture wherebymany improvements in basic health indicators, such as infant and child mortality ratesand life expectancy, have to be balanced against health threats which stem directly fromurban living.The major risk factors for non-communicable disease are an unhealthy diet, lack ofexercise, smoking and excessive use of alcohol: all of them fostered one way or anotherby urban living.Perhaps the most visible and most health-threatening manifestation of the risk factorsis obesity. Being significantly overweight greatly increases the chances of developingtype 2 diabetes, heart and respiratory problems and even some forms of cancer.According to WHO, over 1.6 billion adults are overweight and nearly one in four isobese. By 2015, the figure for those overweight will have risen to 2.3 billion. As anexample of the likely impact on health, WHO forecasts that the number of peoplewith obesity-related diabetes will double to 300 million between 1998 and 2025 –with three-quarters of that growth projected in the developing world.
Strictly under embargo until Wednesday 22 September at 00:01 GMT (02:01 Geneva time)Urban life affects the way people work, move around and relax. Office jobs require lessphysical exertion than farm work, while getting around in a city is more likely to involvesome form of transport – often door to door, if it is a car or motorcycle – rather thanwalking. Pressure to build within urban areas can leave less and less space for parks andareas of recreation. “What urbanization does is to change behaviour patterns,” notedWHO’s Kumaresan. “People have different eating habits, different levels of physicalactivity. If there are no fields or parks, kids have nowhere to run around and play. Theseare some examples of what urbanization does to our changing patterns of lifestyle.”Although there is no firm statistical correlation between rising urbanization and thegrowth of non-communicable diseases, there is no doubt that both have been advancingalmost hand in hand. At the beginning of the last century, only some 10 per cent of theworld’s population was urban, and infectious diseases, such as malaria and tuberculosis,were still by far the biggest causes of premature death among adults. But by the final decadesof the 20th century, nearly half of the world already lived in urban centres, some toosmall to be considered cities, and the burden of early death had also changed radically.In the developed countries of North America and Europe, non-communicable diseaseshad long been fatal, which is why they used to be known as the ‘diseases of the rich’.But by the beginning of the 21st century, 60 per cent of premature deaths aroundthe world were being caused by non-communicable disease. In Latin America andthe Carib bean, they account for two out of every three deaths, according to the PanAmerican Health Organization (PAHO).New ways, new dietThe Gulf region is a case in point. Over the last 30 years it has experienced remarkableeconomic growth, modernization and urbanization. As the population has becomericher and increasingly urban, diets have changed and now include a greater intake ofprocessed and fast foods, rich in fats, saturated fats, salt and sugars, all of which fuelobesity. The percentage of people who are overweight in Kuwait, the United ArabEmirates and Egypt ranges from 68 per cent to 74 per cent.In the Americas, the story is similar. The Latin American and Caribbean region is oneof the most urbanized in the world, with more than three-quarters of its 433 millionpeople living in towns and cities. Eating habits are changing, with people consumingless fruit, fewer vegetables and more processed food. According to PAHO, 50 to 60per cent of adults in Latin America and the Caribbean are overweight or obese. Evenmore worrying for the future, the same goes for 7 to 12 per cent of children under 5.At the same time, 30 to 60 per cent of the population do not take the minimum levelof exercise – 30 minutes a day – recommended by WHO. Predictably, in the past fewyears, the region has witnessed an explosion in chronic non-communicable disease– cancers, hypertension and heart problems. According to WHO figures, more thanWorld Disasters Report 2010 – Focus on urban risk105
Strictly under embargo until Wednesday 22 September at 00:01 GMT (02:01 Geneva time)75 per cent of the 6.2 million deaths estimated to have occurred in the region in 2005were related to chronic diseases. In urban settings, poorer people have access to cheaperfoods, which will often be less nutritious than more expensive varieties. It often costsless to eat badly.But the health problems of urban dwellers, particularly the poor, extend well beyondeating badly and doing little exercise when it comes to exposure to non-communicabledisease. In 2004, some 1.2 million people died from respiratory illnesses caused byoutdoor urban air pollution. According to WHO, some 1.5 billion urban dwellers– mostly in developing countries – face levels of air pollution that are above the maximumrecommended limits. Emissions from motor vehicles and factories are estimatedto cause about 8 per cent of lung cancer deaths, 5 per cent of cardiopulmonary deathsand about 3 per cent of respiratory infection deaths. This is likely to get worse as WorldBank projections indicate that motorized vehicles in cities will quadruple by 2050.Traffic kills and maims in large numbers. Around 90 per cent of the 1.3 million deathsa year attributable to road accidents occur in low- to middle-income countries.Indoor pollution can be even more lethal. About 25 per cent of city dwellers in developingcountries and 70 per cent of city dwellers in least developed countries use solidfuels for household heating and cooking. In 2004, exposure to indoor pollution wasestimated to cause about 2 million deaths worldwide, mostly from pneumonia, chroniclung disease and cancer.Box 5.2 Hi-tech rescue in a mega-cityImagine you are in charge of delivering muchof the emergency health services to a megacityof over 20 million people and 4 millionvehicles. It is a city so choked with traffic thatdrivers are only allowed take to the road onalternate days. There are 500,000 traffic accidentsa year, countless heart attacks and fires.How then do you meet the challenge ofproviding a 24/7 service, 365 days of theyear, with 1,100 staff and a fleet of just 153ambulances, each of which will normally respondto an average of five calls a day?The Beijing branch of the Red Cross Societyof China, led by Executive Vice President LuHan, has come up with a series of innovationsdesigned to maximize the use of limitedresources by applying technology to the provisionof ambulance services to a degree notseen in any other urban environment of its size.Speaking to the World Disasters Report during aRed Cross forum on urban risk at the ShanghaiExpo, she said: “Urban response has becomea priority in a crowded city. The Beijing RedCross 999 line responds to over 50 per cent ofthe emergencies in the city. In comparison withthe government’s 120 line, our 999 emergencyservices line offers more choices. We are morefocused on meeting the needs of our patients.For instance, we have 32 first-aid stations locatedin the traffic bureau’s branch offices to ensuretimely response to traffic accidents and there isalso close coordination with the fire brigade.”106
Strictly under embargo until Wednesday 22 September at 00:01 GMT (02:01 Geneva time)The Red Cross has 90 first-aid stationsthroughout the city and all its ambulances areequipped with GPS and closed circuit television.The command centre at headquarters alwaysknows where its ambulances are and theycan be diverted at a moment’s notice to thescene of a major accident. Doctors can assistremotely with the early treatment of seriously injuredpatients and ensure patients are broughtto the appropriate hospital department.In 2009, in pursuit of their goal of savingboth time and lives, they augmented their vehiclefleet with 50 motor bikes for first aiders whoare equipped with Personal Digital Assistants(or palmtops) and GPS. “Motorcycles canreach the patients very fast when there aretraffic jams. So we can make good use of thefirst four to six minutes after the call comes in,for this is the most precious period of time especiallyif the ambulance is going to be delayedby traffic,” said Han.In addition, she explained: “999 has aspecial programme for more than 200,000households in Beijing. If they press a certainbutton on their phone panel, 999 will beaware of the basic medical background of thefamily, medical records, address and phonenumber. These are usually families looking afteran elderly person.”The Chinese Red Cross has developed aunique mobile phone platform with many featuresnot found on standard models. The GPSequippedphones have proved useful to manyfamilies caring for a senile senior citizen lostin the city. The phones have an alarm buttonwhich will alert the Red Cross emergencycentre when activated without even making aphone call. The phones can vocalize text messagesfor those who have poor sight and actas a torch and they also have an in-built radio.A third generation of this mobile phone,which costs less than US$ 100, is now underdevelopment. It can dial 999 when activatedby an immobilized patient wearing a watchlikedevice on the wrist.The Beijing Red Cross provides many otherservices including helping victims of traffic accidentscompile insurance claims through the 999forensic centre’s reports and providing medicalcare to anyone being held in police custody.“Hi-tech equipment is only one aspect ofour work. In addition to the technology wehave also been focusing on increasing people’sknowledge, skills and general awarenessabout disaster risk reduction. The BeijingRed Cross issued 6 million copies of its familyfirst-aid manual in Beijing last year. More than3 million people had received basic first-aidtraining by the end of 2009. We will continueto enhance our smart power – strategic planningand management in order to build a saferand securer mega-city,” concluded Han.Visitors to one of the city’s most populartourist attractions, Tiananmen Square, will behappy to hear that there is a first-aid post andambulance stationed there 24/7. You are alsoin a city where more than 3 million peoplehave received basic first-aid training – so helpmay never be too far away. Mean streetsViolence is a serious risk to health in many large cities (see Chapter 4), whether it isRio de Janeiro, Los Angeles or the banlieues of Paris. Much of this violence is relatedto the illicit drugs business which largely depends on end users living in cities. Butthere are other urban factors such as social exclusion, xenophobia and marginalization,unemployment and alcohol abuse that also fuel violence.World Disasters Report 2010 – Focus on urban risk107
Strictly under embargo until Wednesday 22 September at 00:01 GMT (02:01 Geneva time)108CHAPTER 5Illicit drugs are not just a source of violent crime, their use also poses a huge healthchallenge in itself and it is a problem that is heavily concentrated in cities. The samegoes for alcohol abuse. Use of illicit drugs is fuelled by social and economic pressuresand facilitated by easy availability in urban areas. According to WHO, urbanization isassociated with twice the rate of hospital admission for drug or alcohol disorders.Given the pressures of city life, it is no surprise that urban living fuels mental disturbanceand distress. Levels of fear, anxiety and mental illness have been shown to be higher inurban environments. In a study carried out in Sweden in 2004, adult Swedes living indensely populated areas had nearly twice the rate of serious mental illness as those livingin thinly populated parts of the country. A sense of lack of control, fear of unemployment,the breakdown of traditional social ties and bonds – a particular problem forimmigrants – and urban overcrowding are all factors that can trigger high levels of stress.One private clinic quoted in Britain’s Guardian newspaper reported a 33 per cent risein the number of people from the financial sector seeking advice for anxiety, depressionand stress after the global financial crash of late 2007 and 2008. Unemployment, orthe threat of it, undermined their sense of personal worth. Another group particularlyexposed to stress in urban settings is the elderly. Older city dwellers, particularly inricher countries, often face loneliness and depression unless they are rich enough to beable to pay for private care.WHO forecasts that within the next ten years unipolar depression will account for thegreater burden of disease in developing countries. Community-based studies of mentalhealth in developing countries support the view that 12 per cent to 51 per cent ofurban adults suffer from depression in some form or other. Risk factors include maritalbreakdown, poverty, exposure to stressful events, long-term stress and lack of socialsupport. Symptoms of depression are more common among urban women than menand among poor urban neighbourhoods rather than in non-poor urban areas. Inadequateshelter, unemployment and the relentless struggle to cope with adversity are alldrivers of mental ill health for the urban poor.Box 5.3 Safety on the urban roadRoad transportation has become a key elementof urbanization. By speeding up communicationsand the transport of goods and people,it has generated a revolution in contemporaryeconomic and social relations.However, this has not come about withoutcost: environmental pollution and urban stressare directly linked to growing road transportation.Above all, it is increasingly associatedwith the rapid escalation of road crashes andpremature deaths, as well as with physicalhandicaps and psychological trauma.Losses are not limited to reduced workerproductivity and trauma affecting a victim’s
Strictly under embargo until Wednesday 22 September at 00:01 GMT (02:01 Geneva time)private life. Equally significant are the risingcosts in health services and the added economicbur den (estimated between 1 and 3 per centof gross national product). In developing countries,the costs often exceed the internationaldevelopment assistance received each year.Consequently, there is a direct link betweenroad safety improvement and poverty reduction.The situation is made worse in developingcountries by rapid and unplanned urbanization.The absence of adequate infrastructurein cities, together with the lack of a legal regulatoryframework, makes the exponential risein the number of road crashes all the moreworrying.Road crash fatality numbers are comparableto the number of global deaths causedby TB or malaria. Worldwide, road traffic injuriesare the leading cause of death amongyoung people aged 15 to 29 and the secondmost common cause of death for those aged5 to 14. An estimated 1.3 million people arekilled in road crashes worldwide each yearand as many as 50 million are injured. Forevery death, 20 to 30 people are disabled,many permanently.“If significant preventive actions arenot taken, we estimate that by 2020road trauma will rank as the sixth biggestcause of death.”WHORoad crash mortality projection 2020Cost-effective solutions do exist and havealready achieved very positive results in manycountries. Together with its hosted project, theGlobal Road Safety Partnership (GRSP), theInternational Federation of Red Cross and RedCrescent Societies (IFRC) has prioritized thereduction of disastrous road safety crashesaffecting young people. IFRC and GRSP areadvocating for the adoption of straightforwardsolutions to avoid or significantly decrease thetragic human, social and economic consequencesof urban road crashes. These include:implementation of national road safety actionpolicy; better road systems; first-aid training;and closer partnerships with governments, theprivate sector and civil societyViet Nam offers a good example of success.In 2006, the Vietnamese National TrafficSafety Committee, the Asia Injury PreventionFoundation, the Red Cross of Viet Nam andthe French Red Cross contributed to efforts tocreate a national action helmet plan supportedby GRSP. That led to enactment and enforcementof a new helmet law. In 2008, Viet Namsaw the first results: 1,500 fewer lives lost comparedwith 2007 when 12,500 people diedon the road. Campaign posters produced bythe Red Cross of Viet Nam and the FrenchRed Cross in Hanoi and Ho Chi Minh Cityin millions of people per year2.020201.51.00.50.02010 2020HIC: High income countries2010LMIC: Low- and middle-income countriesSource: WHO/World Bank (2004)World Disasters Report 2010 – Focus on urban risk109
Strictly under embargo until Wednesday 22 September at 00:01 GMT (02:01 Geneva time)Modern city life takes a heavy toll on health, partly through the unsanitary and oftendangerous conditions in which millions of people are forced to live, partly throughthe lifestyle choices that it encourages and partly from the strains and stresses that itimposes. Lack of policy and poor planning by municipal and central government playa significant role in these outcomes.While it is true that the number of slum dwellers continues to rise, some of the mostsignificant strides in health improvements are being taken in countries where goodurban governance is actively encouraged and supported and where lifting people outof slum conditions is a public policy goal. China and India have made progress inrecent years in reducing their slum populations, showing what economic growth andpolitical will can do. Some specific examples of how this can be done, particularlythrough community-based initiatives, are cited in Chapter 3 of this report, includingthe Thai government’s support to community-driven upgrading whereby scale isachieved through the very large number of local initiatives that it supports. At a locallevel, NGOs such as Asha show what can be achieved by working with slum dwellersto improve living conditions and fight disease. In the 49 New Delhi slums in whichAsha is active, child mortality is now 36 for 1,000 live births, which is less than halfthe rate of India as a whole.When it comes to non-communicable disease, there are signs that political leadersare waking up to the threat. Whether it be Bogotá’s ciclovia (specially constructedroutes for cyclists in the Colombian capital) or Singapore’s green labelling of disheson school menus to help students identify healthy foods, examples are multiplying ofcountries and cities taking initiatives to tackle the problems of inadequate diet and lackof exercise. Community networks are being forged to overcome the challenges of socialbreakdown and violence in poor and underprivileged city zones of both developingand developed countries.Underpinning all such initiatives is the growing awareness that tackling city healthproblems is not just a question of doctors and nurses. Nor is it solely a matter of alleviatingpoverty, although that is a crucial and necessary condition. It requires that citiesbe well planned, well managed and also well governed. Only then will they pose less ofa threat to the health of those who live in them.Chapter 5 was written by Richard Waddington, freelance writer and former Reuters bureauchief. Boxes 5.1 and 5.2 were contributed by Denis McClean, Editor, World DisastersReport. Box 5.3 was contributed by Gérard Lautrédou, Road Safety Adviser, IFRC.110CHAPTER 5Conclusion
Strictly under embargo until Wednesday 22 September at 00:01 GMT (02:01 Geneva time)Sources and further informationBurris, S. et al. ‘Emerging Strategies for Healthy Urban Governance’ in Journal ofUrban Health, Vol. 84 (Suppl. 1), pp. 154–163, 2007. Available online: www.ncbi.nlm.nih.gov / pmc / articles / PMC1891653/.Chartered Society of Physiotherapy. ‘Lower life expectancy in cities’, BBC News, London,20 June 2006. Available online: http://news.bbc.co.uk/2/hi / uk_news/5097778.stm.Durán, V.H. ‘Stopping the rising tide of chronic diseases – Everyone’s Epidemic’ inPAHO, Perspectives in health E-magazine, March 2008. Available online: www.paho.org / english / dd / pin / ePersp001_article01.htm.Food and Agriculture Organization of the United Nations (FAO). FAO launches antihungerpetition. Rome: FAO Media Centre, 2010. Available online: www.fao.org / news / story / en / item/42158/icode /.Humanitarian Futures Programme (HFP). Urban Catastrophes: The Wat / San Dimension.London: HFP, King’s College, 2010. Available online: www.humanitarianfutures.org / main / content / usaid-future-crisis-drivers.International Monetary Fund (IMF). Food and fuel prices: Recent developments, macroeconomicimpact and policy responses. Washington DC: IMF, 2008. Available online:www.imf.org / external / np / pp / eng/2008/063008.pdf.Leon, D.A. ‘Cities, urbanization and health’ in London School of Hygiene & TropicalMedicine, International Journal of Epidemiology, Vol. 37, No. 1, pp. 4–8, 2008.Available online: http://ije.oxfordjournals.org / cgi / content / short/37/1/4.Martinez, R. and Fernandez, A. ‘Child malnutrition in Latin America and theCaribbean’ in Economic Commission for Latin America and the Caribbean andUNICEF, Challenges: Newsletter on progress towards the Millennium DevelopmentGoals from a child rights perspective. No. 2, April, 2006. Available online: www.unicef.org / lac / Desafios_2_ing(9).pdf.Mercado, S. et al, ‘Urban Poverty: An Urgent Public Health Issue’ in Journal of UrbanHealth, Vol. 84 (Suppl. 1), pp. 7–15, 2007. Available online: www.ncbi.nlm.nih.gov / pmc / articles / PMC1891652/.Orzechowski, F. Soaring Food Prices: A Global Crisis. Speech given to 10th InternationalFood Aid Conference, April 2008. Available online: http://crs.org / newsroom / testimony/ entry.cfm?id=1455.Pan American Health Organization (PAHO). Haiti: Health in the Americas 2007 –Volume II. Available online: www.paho.org / hia / archivosvol2/paisesing / Haiti%20English.pdf.World Disasters Report 2010 – Focus on urban risk111
Strictly under embargo until Wednesday 22 September at 00:01 GMT (02:01 Geneva time)112CHAPTER 5Patel R.B. and Burke, T.F. ‘Urbanization: An Emerging Humanitarian Disaster’ in TheNew England Journal of Medicine, Vol. 361, No. 8, pp. 741–743, 2009. Availableonline: http://content.nejm.org / cgi / content / short/361/8/741.Popkin, B.M. ‘Urbanization, Lifestyle Changes and the Nutrition Transition’ in WorldDevelopment, Vol. 27, No. 11, pp. 1905–1916, 1999.Sanogo, I. and Ifeanyi, N. Livelihood and Food Security in Urban Emergencies: A Synthesisof Selected WFP Practices. Rome: World Food Programme, Food Security AnalysisService, 2010.Stevens, A. and Bewley-Taylor, D. with contributions from Dreyfus, P. Drug marketsand urban violence: Can tackling one reduce the other? The Beckley FoundationDrug Policy Programme. 2009. Available online: www.beckleyfoundation.org / pdf / report_15.pdf.Sundquist, K., Frank, G. and Sundquist J. ‘Urbanization and incidence of psychosisand depression; follow-up study of 4.4 million women and men in Sweden’ in TheBritish Journal of Psychiatry, Vol. 184, pp. 293–298, 2004. Available online: http://bjp.rcpsych.org / cgi / content / full/184/4/293.The Guardian. ‘Stress levels soar in the square mile.’ London: 8 October 2008. Availableonline: www.guardian.co.uk / society/2008/oct/08/mental.health.financial.crisis.The Lancet. Vol. 365, No. 9456, 5 March 2005. Available online: www.thelancet.com/ journals / lancet / issue / vol365no9456/PIIS0140-6736(00)X9461-5.United Nations Children’s Fund (UNICEF). State of the World’s Children. New York:UNICEF, 2008.United Nations Human Settlements Programme (UN-Habitat). State of the World’sCities 2010/2011 – Bridging The Urban Divide. London and Washington DC:UN-Habitat, 2010.UN-Habitat. Planning Sustainable Cities – Global Report on Human Settlements.Nairobi: UN-Habitat, 2009. Available online: www.unhabitat.org / pmss.UN-Habitat. State of the World’s Cities 2008/2009 – Harmonious Cities. London andWashington DC: UN-Habitat, 2008.UN-Habitat. State of the World’s Cities 2006/7. London: Earthscan Publications, 2007.UN-Habitat. The Urban Penalty: The Poor Die Young. UN-Habitat Features, 2006.Available online: http://bit.ly / cIQa4Z.UN-Habitat. Global Report on Human Settlements – The Challenge of Slums. Nairobi:UN-Habitat, 2003. Available online: www.unhabitat.org / pmss.World Bank. Food price crisis imperils 100 million in poor countries, Zoellick says. WorldBank News & Broadcast, 14 April 2008. Available online: http://bit.ly / bLb92B.
Strictly under embargo until Wednesday 22 September at 00:01 GMT (02:01 Geneva time)World Economic Forum. Global Risks 2010. Geneva: World Economic Forum, 2010.Available online: www.weforum.org / pdf / globalrisk / globalrisks2010.pdf.World Health Organization (WHO). World Health Day News Bulletin. Geneva: WHO,2010. Available online: www.who.int / bulletin / volumes/88/4/10-010410.pdf.WHO. Global Health Risks – mortality and burden of disease attributable to selected majorrisks. Geneva: WHO, 2009. Available online: www.who.int / healthinfo / global_burden_disease / GlobalHealthRisks_report_full.pdf.WHO. Our cities, our health, our future: Acting on social determinants for health equity inurban settings. Report of the Knowledge Network on Urban Settings to the World HealthOrganization (WHO) Commission on Social Determinants of Health. Kobe, Japan:WHO, 2008. Available online: www.who.or.jp / knusp / KNUS_final_report.pdf.WHO. Report on Infectious Diseases – Removing Obstacles to Healthy Development. Geneva:WHO, 1999. Available online: www.who.int / infectious-disease-report / index-rpt99.html.WHO and World Bank. World report on traffic injury prevention. Geneva: WHO, 2004.Available online: http://whqlibdoc.who.int / publications/2004/9241562609.pdf.World Disasters Report 2010 – Focus on urban risk113
114CHAPTER 6Strictly under embargo until Wednesday 22 September at 00:01 GMT (02:01 Geneva time)
Strictly under embargo until Wednesday 22 September at 00:01 GMT (02:01 Geneva time)Urbanization andclimate change riskAll successful urban centres provide proof of the ability of human societies to adapt tothe particular physical and climatic conditions in which they are located. While disasterevents have long had the capacity to disrupt urban communities, livelihoods andeconomies, climate change presents a new and systematic challenge to urban developmentand sustainability. Last year was the fifth warmest year on record and the decade2000–2009 was warmer than the previous two record-breaking decades. In 2009,severe climate events included: a record-breaking heatwave which badly affected majorurban centres in southern Australia; drought-related food shortages in Kenya whichaffected slum dwellers in Nairobi; and heavy rains which caused floods in many townsacross central Europe.This <strong>chapter</strong> explains the need for a specific focus on climate change and how it impactsurban centres, while recognizing that good practices in disaster risk reduction are at thecore of climate change adaptation in most instances. Firstly, it assesses the ways inwhich climate change will affect patterns of risk, using both a geographical analysis (thedistribution of risk between cities) and a social analysis (the distribution of risk withincities). This highlights how, without adequate adaptation, the increase in disaster riskin the next few decades is likely to be unprecedented through more intense or frequentstorms, more intense precipitation and more serious heatwaves and drought. Secondly,it illustrates the ways in which efforts to reduce risk from disasters will increasinglyneed to incorporate an explicit awareness of climate change issues. Finally, it looks atthe ways in which cities can address climate change – both through reducing greenhousegas emissions and through adapting to cope with the consequences. These practicesare particularly important in the global context of increasing urbanization andthe need to improve the well-being of urban residents – including issues of mobility,shelter and food supply – without increasing energy use and greenhouse gas emissions.Responding to climate change requires improving existing structures and building thecapacity of departments responsible for urban development and environmental management– and their links to the institutions responsible for disaster response. At thesame time, climate change adaptation can be used as an entry-point to develop moreeffective environmental strategies that meet the needs of urban residents. If properlyaddressed, adapting to climate change can help cities to meet a wider range of desirableobjectives concerning liveability, service provision and the reduction of disaster risk.This will require a sharing of knowledge and skills between the two communities ofpractice, so that climate change practitioners can learn from the experiences of disasterrisk reduction, and disaster risk reduction can cope effectively with new climatechallenges.Photo opposite page:Many people livingin developingcountries’ coastalcities, such as herein Dakar, Senegal,face ever more severefloods due to morefrequent storm surges,heavy rainfall andinadequate drainagesystems.© Ricci Shryock / IFRCWorld Disasters Report 2010 – Focus on urban risk115
Strictly under embargo until Wednesday 22 September at 00:01 GMT (02:01 Geneva time)Box 6.1 Key organizations and concepts in climate changeThe growing policy focus on climate changehas led to the development of new institutionsand the use of new terminology, some of whichdiffers from that used in disaster risk reduction.The Intergovernmental Panel onClimate Change (IPCC) is the global scientificbody established by the United NationsEnvironment Programme and the WorldMeteorological Organization (WMO). It producesAssessment Reports (most recently, theFourth Assessment Report in 2007) that summarizethe state of knowledge on climate changeand its potential consequences. Its preparationfor the Fifth Assessment Report acknowledges aneed for greater attention to adapting cities toclimate change and incorporating knowledgeand experience on disaster risk reduction.The United Nations Framework Conventionon Climate Change (UNFCCC)provides the global legislative frameworkfor reducing global warming and respondingto climate change and convenes the annualmeeting for negotiating emissions reductionsand adaptation financing known as theConference of Parties, or COP (e.g., COP15 inCopenhagen, held in December 2009).Greenhouse gases are gases thatab sorb and emit radiation of specific wavelengths,leading to the trapping of heat in theearth’s atmosphere, a process known as thegreenhouse effect. Although the processoccurs naturally and is important in supportinglife on earth, the emission of carbon dioxide,nitrous oxide, methane and other gases as aresult of human activity has raised the concentrationof these gases sufficiently to result inanthropogenic climate change.Adaptation is an adjustment in naturalor human systems in response to actual orexpected climate change in order to reduceits harmful impacts. It may take place beforethe impacts are felt, may be planned throughdeliberate policies, or may be spontaneous.It can involve individuals, communities, localgovernments and nation states.In the climate change arena, mitigationrefers to a reduction in atmospheric greenhousegases, thereby limiting the extent of anthropogenicclimate change. It involves both reducingthe quantities of emissions and enhancing theability of natural and human systems to absorbgreenhouse gases. Changing patterns of risk :The effects of climate changeAlthough the earth’s climate has always been dynamic, over the last 100 years globaltemperatures have been rising largely as a result of human activities, a process known asanthropogenic climate change. This has been driven by the production of greenhousegases – and their increasing concentration in the atmosphere – since the industrialrevolution. Observed changes include an increase in the global average temperature of0.740 degrees Celsius, increased ocean temperature and acidity, a decline in snow coveragein the northern hemisphere, more frequent and intense extreme weather events,shifts in the distribution of animal and plant species, and a rise in global average sealevels of 17 centimetres. The IPCC’s Fourth Assessment Report concluded that likelyfuture changes in climate include warmer and fewer cold days and nights, warmer and116
Strictly under embargo until Wednesday 22 September at 00:01 GMT (02:01 Geneva time)more frequent hot days and nights, increased frequency of warm spells and heatwavesover most land areas, increased frequency of heavy precipitation events over mostareas, increased areas affected by drought, increased intense tropical cyclone activityand increased incidence of extreme high sea level. These changes will result in a rangeof impacts on urban areas, as shown in Table 6.1.Table 6.1 Climate change impacts on urban areasChange in climateChanges in meansTemperaturePrecipitationSea-level riseChanges in extremesExtreme rainfall / tropical cyclonesDroughtHeat- or cold-wavesAbrupt climate changeChanges in exposurePopulation movementsBiological changesPossible impact on urban areasIncreased energy demands for heating / coolingWorsening of air qualityExaggerated by urban heat islandsIncreased risk of floodingIncreased risk of landslidesDistress migration from rural areas as a result of crop failuresInterruption of food supply networksCoastal floodingReduced income from agriculture and tourismSalinization of water sourcesMore intense floodingHigher risk of landslidesDisruption to livelihoods and city economiesDamage to homes and businessesWater shortagesHigher food pricesDisruption of hydroelectricityDistress migration from rural areasShort-term increase in energy demands for heating / coolingPossible significant impacts from rapid and extreme sea-level riseMovements from stressed rural habitatsExtended vector habitatsSource: Adapted from Wilbanks et al. (2007)The extent to which urban centres are vulnerable to these changes in climate is influencedby a variety of factors. The location of cities affects the types of climate hazardsto which they are exposed, and whether they are particularly likely to be affected byhigher temperatures, changing patterns in precipitation, sea-level rise or more frequentor severe extreme events. However, and more importantly, vulnerability to theseimpacts is mediated through the social and economic circumstances of the city and itsresidents, and through the ability of stakeholders and institutions to address the challengesof climate change, sometimes referred to as adaptive capacity. Because of this,cities in low- and middle-income nations are particularly vulnerable to climate change– indeed, the IPCC concluded that “the distribution of impacts and vulnerabilities isWorld Disasters Report 2010 – Focus on urban risk117
Strictly under embargo until Wednesday 22 September at 00:01 GMT (02:01 Geneva time)118CHAPTER 6still considered to be uneven, and low-latitude, less-developed areas are generally atgreatest risk due to both higher sensitivity and lower adaptive capacity”.It is also worth noting that most developing world cities – and the countries in whichthey are located – have contributed very little to the global greenhouse gas emissionsthat are causing climate change in the first place. At a national level, average annual percapita greenhouse gas emissions are more than 20 tonnes of carbon dioxide equivalentin many highly industrialized countries including Australia, Canada and the UnitedStates. At the opposite end of the scale, emissions from many sub-Saharan Africancountries including Burkina Faso, Malawi and Tanzania are less than 0.2 tonnes percapita per year – a more than 100-fold difference. The fact that urban residents inthese countries are likely to be the worst affected means that supporting climate changeadaptation is a vital environmental justice issue for the 21st century. In his address tothe United Nations Summit on Climate Change in September 2009, IPCC ChairmanRajendra K. Pachauri spelt out what this could mean: “In Africa, by 2020, between75 and 250 million people are projected to be exposed to water stress due to climatechange, and in some countries yields from rainfed agriculture could be reduced by upto 50%. The impacts of climate change would be disproportionately severe on someof the poorest regions and communities of the world. My own analysis suggests that atleast 12 countries are likely to tend towards becoming failed states and communitiesin several other states would show potential for serious conflict due to scarcity of food,water stress and soil degradation.”Complex inter-linkages exist between the effects of climate change and the process ofurbanization. It is likely that extreme events and gradual changes alike will, in manycases, contribute to increasing levels of mobility. In most of these cases, mobility (alongwith income diversification) will be an important strategy for households and communitiesto reduce vulnerability to environmental and non-environmental risks andthereby to cope with climate change. At the same time, however, high urban densitiescan increase vulnerability to climate change-related disasters – particularly becauseinadequate institutions and lack of infrastructure are often concentrated in areas wherethere are also high population densities of low-income urban residents. In particular,rural–urban migrants often have no choice but to settle on land that is already denselypopulated or in relatively vacant sections that are particularly prone to disasters. Citiescan also concentrate adaptive capacities: economic resources, diversified food sources,a wide range of income-generating opportunities, transmission mechanisms for earlywarning systems and efficiencies of scale for emergency responses are capacities thathave the potential to be much stronger in urban areas.The geographical distribution of climate change riskThe types of information used to assess the potential threats from climatic hazardsare past records of exposure to extreme weather events such as tropical storms, likely
Strictly under embargo until Wednesday 22 September at 00:01 GMT (02:01 Geneva time)impacts of changing precipitation patterns and susceptibility to sea-level rise and stormsurges. However, exposure to risk is not the same as vulnerability. A 2009 WWF reporton the risks of climate change in ten Asian cities concluded that Manila, Ho Chi MinhCity, Shanghai and Dhaka were all highly exposed to climatic threats. Some cities thatare also highly exposed – including Kuala Lumpur, Hong Kong and Singapore – wereidentified as being much less vulnerable, because they possess the adaptive capacity tomanage threats. The most vulnerable cities, such as Dhaka, Jakarta and Manila, areboth highly exposed and have relatively low levels of adaptive capacity.Urban areas located in coastal areas are particularly exposed to sea-level rise. The lowelevationcoastal zone – the contiguous area along the world’s coastlines that is less than10 metres above sea level – covers just 2 per cent of the world’s land area but contains13 per cent of the world’s urban population. By 2007, Africa had 37 cities with morethan 1 million inhabitants and half of them are within – or have parts within – the lowelevationcoastal zone. In Cotonou, Benin, coastal erosion is already affecting residentialareas, fishing communities and the city’s industrial and tourism sectors. A sea-level riseof 50cm would lead to over 2 million people in Alexandria, Egypt, needing to abandontheir homes and would cause financial losses associated with land, property and tourismincome of over US$ 35 billion. Much of Lagos, Nigeria is also low-lying, and thelow-income urban population there faces a worsening situation as floods become moresevere from the combination of increasing frequency of storm surges, heavy rainfall oflong duration or high intensity and inadequate drainage systems.The East African coast is also expected to be affected by sea-level rise, resulting inpotential adaptation costs of up to 10 per cent of gross domestic product. In Dar esSalaam, Tanzania, coastal erosion is affecting the area of Kunduchi Beach to the northof the city. Other activities – such as the dynamiting of coral reefs for fishing, sandextraction for construction and the removal of mangroves – will worsen the impacts ofsea-level rise in this area. In Asia, large sections of Dhaka and Shanghai are only oneto five metres above mean sea level, while much of Mumbai is built on landfill and islikely to suffer from more serious storm surges and increased frequency and intensityof extreme weather as a result of climate change. Perhaps not surprisingly, in all of thesecases, it is mostly low-income households living in informal or illegal settlements thatface the greatest risks from flooding. Salinization of drinking water and groundwateris also a concern, as many coastal cities derive water from just above salt fronts. As sealevels rise, so too does the likelihood of drawing in saline water for municipal watersupply systems.Another geographically specific aspect of climate risk is an increase in water scarcity,which will particularly affect cities located in semi-arid regions. As South Americanglaciers retreat, many cities in the Andes will face water shortages during the dry season.A study from the central Andes of Peru suggests that the largest city in the region,Huancayo, with a population of approximately 325,000, is already experiencing waterWorld Disasters Report 2010 – Focus on urban risk119
Strictly under embargo until Wednesday 22 September at 00:01 GMT (02:01 Geneva time)shortages. Retaining walls and small dams have been constructed on nearby lagoons,but now these interventions are being called into question as they may have contributedto water shortages, along with the increased demands that come with populationgrowth, land-use changes and deforestation. The city of Quito will also face watershortages, as glacial retreat is exacerbated by increased sedimentation of waterways,land-use modification and increases in water use due to higher temperatures. Foodinsecurity in urban areas is also influenced by climate change impacts on agriculture asa consequence of water scarcity and other weather impacts on crop production.Box 6.2 Cooperating on flood risk in Saint-Louis, SenegalSaint-Louis is Senegal’s former capital and ithad 180,000 inhabitants in 2002. The cityis situated on three islands cut off from eachother by the Senegal River, its tributaries andthe Atlantic Ocean. Some areas of the city areless than 2.5 metres above mean sea level. Thecity has experienced recurrent flooding since1990, caused by the rains and peak flows inthe Senegal River. The rising river level is theresult of the silting-up of the river bed, the dumpingof household waste, the reduced area availablefor flood-water irrigation (as unplanned urbanizationmeans these areas are now coveredby houses) and a shallow water table that risesto the surface when the river swells and drainspoorly during the winter season.Who is affected by flooding?Flooding in Saint-Louis generally affects areasinhabited by the lowest-income groups. Thehousehold economy of those most at risk fromflooding is very fragile; after each flood, theirpoverty is increased. Schools generally takein the flood victims and two or three familiesmay find themselves living in a single classroomand the school year may be reduced byseveral months. Economic activity also slowsdown as workplaces are under water.The extent of the floods that occurred duringthe 2009 winter season led the Senegaleseauthorities to initiate the national disaster responseplan to address the situation. Stagnantrainwater in the flooded areas, combined witha lack of clean water, inadequate drainageand wastewater and solid waste management(only 30 per cent of households have a regularsolid waste collection and less than 10 percent sewer connections) brings serious healthimpacts. Risks are further compounded by theproliferation of disease vectors (flies, mosquitoes,cockroaches, rats, mice, etc.), poor hygieneand high levels of overcrowding.Responding to vulnerabilityThe strategy of the Senegalese non-governmentalorganization (NGO) Enda-Tiers Monde inresponse to flooding in Saint-Louis has beenbased not on building infrastructure but onstrengthening local governance. Stakeholderscome together to engage in dialogue andexchange views in order to find solutions toproblems that are beyond their individual skillsor capacities. An action plan has been developedand is managed by a steering committee,which ensures that the programme’s information,education and communication activitiesare implemented smoothly. Plays, exhibitions,media broadcasts, teatime ‘chats’, interviews,photo exhibitions, intensive awareness-raisingcampaigns, open-air conferences and public120
Strictly under embargo until Wednesday 22 September at 00:01 GMT (02:01 Geneva time)feedback have all been used to help changebehaviour.Activities focus primarily on:digging paths to evacuate stagnant waterregular maintenance of drainage channelsdisinfecting stagnant water, in associationwith the national hygiene departmentplacing sandbags to help inhabitants getabout within the neighbourhood itself.The authorities use local labour for some drainageworks and women’s groups are involvedin awareness-raising activities to combat diarrhoeaand measures to be taken to prevent malariaand other diseases. NGOs work closelywith the state’s decentralized structures (healthand sanitation departments, fire brigade, etc.)to raise awareness and change the population’sbehaviour.The social distribution of climate change riskSocial factors account for a large proportion of the variability in vulnerability to climatechange impacts. Firstly, poverty and marginality are key contributors to vulnerability.Exposure to climate risk is particularly evident for households and communitiesliving in sites that are exposed to storm surges, flooding and landslides and which lackthe resources and options to modify these effectively. Low-income urban residents areparticularly vulnerable to climate change for a variety of reasons, including:greater exposure to hazards (e.g., through living in makeshift housing on unsafesites)lack of hazard-reducing infrastructure (e.g., roads allowing emergency vehicleaccess)less adaptive capacity (e.g., inability to move to less dangerous sites or access savingsor insurance)less state provision of assistanceless legal and financial protection.Secondly, climate change is expected to exacerbate pre-existing gender dimensionsof vulnerability. On top of the well-documented and disproportionate impact ofdisasters on women’s morbidity and mortality, climate change will impact women’slivelihoods by reducing economic opportunities and will increase the burden ofreproductive labour, for example, through a growing burden of child disease (seeTable 6.2).Thirdly, age greatly shapes vulnerability to the consequences of climate change. Childrenhave higher susceptibility to diseases caused by poor sanitation or spread by vectors.Climate change may reduce availability of potable water, both through absolutescarcity and through increased spread of bacterial diseases, and vectors such as mosquitoesmay expand their range due to rising temperatures. In addition, very young childrenhave less capacity to cope with high temperatures and less ability or knowledge torespond rapidly to disaster events, and can suffer long-term damage to their cognitiveWorld Disasters Report 2010 – Focus on urban risk121
Strictly under embargo until Wednesday 22 September at 00:01 GMT (02:01 Geneva time)Table 6.2 Gender and climate vulnerabilityAspect of vulnerabilityGendered division of labour and‘poverty of time’Gender-ascribed social responsibilitiesCultural expectations of gender normsUnequal entitlements to land andpropertyHigher representation of women ininformal sectorContribution to urbanvulnerabilityWomen have prime responsibility for‘reproductive’ labour; lack of time toengage in ‘productive’ labourWomen have prime responsibility for‘reproductive’ labour; lack of time toengage in ‘productive’ labourConstraints on women’s mobility andinvolvement in certain activitiesLimited access to productive resourcesLower wages and lack of financialsecurityContribution to climatevulnerabilityLimited financial assets to buildresilience and to cope with disastereventsAdditional domestic responsibilitieswhen access to food, water andsanitation are disrupted; additionaltime required to care for young, sickand elderlyHigher mortality from disaster eventsdue to lack of skills and knowledgeLimited ability to invest in more resilientland or shelterDamage to homes and neighbourhoodsaffects women’s incomes more severelyas income-earning activities are oftenundertaken at homeSafety and security in public spaces Limited freedom to use public space Particular problem in temporaryaccommodation / relocation sites; highrates of sexual abuse and violenceLimited engagement of women inplanning processesUrban plans fail to meet particularneeds of women and childrenClimate adaptation plans fail to meetneeds of women and children; failureto incorporate women’s perspectivesmay result in higher levels of risk beingacceptedand social development as a result of early experiences. Heatwaves particularly affectelderly residents of temperate cities where the building stock is not suited to continuoushigh temperatures – the 2003 European heatwave was associated with more than70,000 additional deaths across the continent.Finally, in addition to morbidity and mortality as a result of one-off events, climatechange will also result in qualitatively different patterns of health burdens on urbanpopulations. Weather and climate also influence air pollution-related mortality andmorbidity, the prevalence of mosquito- and tick-borne diseases and the spread ofwater- and food-borne diseases, e.g., through survival of bacterial pathogens and thetransportation of disease organisms into water supplies. In northern Mexico, heatwaveshave been correlated with increases in mortality rates; 10 per cent of summerdeaths are associated with heat strain in Buenos Aires, Argentina; and records showincreased cases of diarrhoea in Peru.122
Strictly under embargo until Wednesday 22 September at 00:01 GMT (02:01 Geneva time)Addressing the causes of climate change:The role of cities in climate change mitigationUltimately, reducing the risk of climate change requires global strategies to limit theatmospheric concentration of greenhouse gases. Without substantial coordinatedefforts to reduce emissions, vast areas of the earth’s surface – including many largeurban centres – will be affected by catastrophic changes in their climate. For instance,the IPCC’s Fourth Assessment Report noted the possibility of global warming causing apartial de-glaciation of the Greenland ice sheet and the West Antarctic ice sheet, whichwould contribute to a sea-level rise of several metres that would imply major changesin coastlines and inundation of low-lying areas. But the time frame for this is uncertainand this change could be prevented if governments follow IPCC recommendations foremissions reduction.In this regard, climate change mitigation can be seen as the most effective form ofclimate change-related disaster risk reduction, and is an area in which cities can play akey role. As stated previously, most of the earth’s population has made a minimal contributionto climate change and the burdens of mitigation ought not to be borne bythese societies. In high- and many middle-income nations, however, urban areas needto be at the forefront of taking responsibility for climate change and reducing theiremissions accordingly. Although the contribution of urban areas to global greenhousegas emissions cannot be accurately quantified, the consumption behaviour of wealthyurban residents is a significant contributor to this. Similarly, various mitigation activitiescan also yield substantial public health benefits, including greater levels of physicalactivity and lower levels of air pollution.A range of urban activities and sectors contribute considerably to greenhouse gasemissions. These include energy supply (direct and through electricity generationfrom thermal power stations), transportation, industry and waste. Urban authoritiesare able to contribute to emissions reductions in different ways, for example, by providingimproved public transportation options or by providing incentives for homeownersto fit more energy-efficient appliances. Cities such as New York and Londondemonstrate that large and dense urban settlements offer opportunities for reducingcarbon footprints – the average resident of New York generates just 30 per cent ofthe emissions of the average American and the average London resident generatesjust 55 per cent of the emissions of the average UK resident. Indeed, long-term planningto reshape urban form and structure may result in much more efficient publictransportation infrastructure that meets both environmental and social needs. However,efforts to reduce emissions also need to take a ‘consumption-based’ approach,recognizing that many of the goods and services consumed by urban residents (particularlyin more affluent countries) – including food, energy and consumer goods– are associated with emissions from outside the urban area itself and frequently fromother countries.World Disasters Report 2010 – Focus on urban risk123
Strictly under embargo until Wednesday 22 September at 00:01 GMT (02:01 Geneva time)Several initiatives – including the C40 Climate Leadership Group and Cities forClimate Protection, sponsored by ICLEI-Local Governments for Sustainability – helpshare knowledge and good practices between cities involved in reducing their greenhousegas emissions. Urban authorities in low- and middle-income nations have alsobegun to exploit opportunities to generate ‘carbon credits’ through reducing emissionsfrom solid waste management and other activities. At the same time, however, it mustbe ensured that these efforts do not divert attention from the strong adaptation needsthat face many residents of these cities.Box 6.3 Urban flooding in IrelandMuch of urban Ireland was thrown into chaosby widespread flooding in the same week inNovember 2009 that the Irish Academy of Engineering(IAE) published a landmark reportIreland At Risk – Critical Infrastructure and ClimateChange which warned that storm surgescombined with a sea-level rise of 50cm wouldmean that a one-in-100-year flood could happenas often as every five years.Rainfall totals were the highest on recordfor November in many places and river levelsreached record heights as the Irish Red Crossdeployed volunteers and ambulances to assistin evacuations and to ensure that vital healthpersonnel were able to report to work.Months later the island nation, whose majorcities all lie on the coast, was still counting thecost. In County Cork alone, it was estimated thatflood damage ran to 100 million euros as a damequipped with a new 50-metre-wide spillway designedto cope with an extreme flood, failed tocope. The River Lee burst its banks and floodedthe centre of Cork, Ireland’s second largest city.“Failure to act now will put our society atan unacceptable risk,” said the IAE’s president,Michael Hayden. “You’ve only to thinkof Hurricane Katrina for an example of howclimate change coupled with poor planningand zoning decisions can lead to social andeconomic disaster.”In a week when the country’s major riversburst their banks, the academy warned thathomes in coastal cities could become uninsurableunless urgent measures were taken andcited Benjamin Franklin’s adage: “An ounce ofprevention is worth a pound of cure.”The IAE further predicted that unless urgentaction was taken to strengthen critical infrastructurethe following would happen: changingrainfall patterns would affect water supplies;rising sea levels would inundate coastalcities and towns; severe weather incidentswould damage energy installations, hospitals,telecommunications, railways and other criticalinfrastructure, and contaminate water supplies.The Irish Sunday Tribune newspaper notedin an editorial other factors that played a rolein the November flooding which saw thousandsof people evacuated from their homes:“The legacy of the past decade has been oneof appalling and corrupt planning decisionswhich have allowed building on flood plains;building regulations that allowed uninsulated,energy-inefficient homes to be thrown up anyhow,anywhere; inadequate flood managementschemes which at times have been poorlymanaged; and now last week, the failure tohave a fully working flood emergency plan inoperation should the worst happen has addedto the misery of tens of thousands of people.”124
Strictly under embargo until Wednesday 22 September at 00:01 GMT (02:01 Geneva time)The Green Party Minister for the EnvironmentJohn Gormley said in January 2010 that thefloods showed up the “questionable nature”of development decisions made by some localauthorities, 19 of whom had to be compensatedby the government for emergency servicesprovided during the flooding. He also ordereda major review of the remit of the EnvironmentalProtection Agency and announced a three-yearwater conservation investment plan as waterlosses continue to be a major problem in manyparts of the country despite the rainfall. Reducing the effects of climate change:Local planning for adaptation and disasterrisk reductionMuch recent climate change policy has stressed the ‘co-benefits’ of mitigation strategies:the ways in which reducing greenhouse gas emissions can meet broader goals of increasedenergy independence, lower costs and higher quality of life. However, for a large proportionof the world’s urban population, this is of limited value as their emissions are alreadyextremely low but there are many strong co-benefits between climate change adaptation anddevelopment. This includes disaster risk reduction but also addresses slow-onset changessuch as the salinization of groundwater which affect the accumulation of risk over time.For practical purposes such as policy design, the distinction between natural variability(including extreme events) and incremental variability due to climate change is trivial –the key is to recognize and address underlying factors causing vulnerability. A startingpoint for reducing climate risk, therefore, is a better understanding of the particularhazards and vulnerability faced by urban centres. This is a context-specific process butthere are several underlying principles that can be followed. Firstly, projected climatescenarios and their potential impacts need to be understood but their limitations alsoneed to be known. Future projections contain a wide range of uncertainties in relationto both the absolute extent of climate change and the ways in which this will be experiencedat the geographical scale of the city. Secondly, a detailed analysis needs to beundertaken to identify the most vulnerable groups, areas, sectors and how they may beaffected – a process that has much in common with assessing vulnerability to disasters.Thirdly, the combined impacts of direct and indirect factors need to be taken intoaccount – recognizing both the effects of climate change and the implications for urbanresidents of policies formulated to address these. Finally, existing capacities to respondand adapt must be assessed. With the exception of the climate projection component,this is already good practice in identifying vulnerability to a range of extreme events.Climate change adaptation and disaster risk reduction thatmeet the needs of the urban poorUrban governance is increasingly accepted as a multifaceted process involving a rangeof stakeholders, including civil society organizations, the private sector, the academicand research community, and the formal mechanisms of local government. BuildingWorld Disasters Report 2010 – Focus on urban risk125
Strictly under embargo until Wednesday 22 September at 00:01 GMT (02:01 Geneva time)Box 6.4 After the stormAfter the storm a tentative blackbird chorus,silent throughout it, started cheeping again.The city, for fear of a worse overflow,had unlocked dams, so water levels roseat an alarming rate; the rivers bursttheir banks, swamping fields in a sea of rain,and flooded low-lying districts in one go,the waters sparing neither man nor beast.Square miles shrank as a sudden deluge rushedfrom the rain-sodden hills. Ye nymphes of Bandon,where were you when the great south-facing windowsof heaven were opened and it bucketed downon quiet Munster? No one had imaginedembankments would give way under the surge,the river Lee engulfing market towns’water mains, drains and residential lanes.It struck in late November, so by and largeno ripening crops suffered, no standing grain,but haylofts were awash and much of the hardwork of the summer proved to be in vain.Reservoirs, lakes poured down in a tide of mudsubmerging farms. An astonishing six inchesfell in a single night from inky cloud.Not much distinction now between sea and land:some sat in dinghies rowing where they’d sown,navigating their own depth-refracted groundand scaring rainbow trout among the branches.Global warming, of course, but more like waras if dam-busting bombers had been here:aerial photographs of the worst-hit areasshowed roads, bridges, basic infrastructuredevastated, the sort of thing you expectin China or Louisiana but not in Cork.Detritus of the years, carpet and car,computers and a wide range of expensivegadgetry went spinning down the riverwith furniture and linen, crockery, shoesand clothes, until it finally gave over;not everyone had full insurance cover.126
Strictly under embargo until Wednesday 22 September at 00:01 GMT (02:01 Geneva time)The inquiry dealt only with technical issues,avoiding larger questions. Telephonelines down, ‘boil water’ notices in force,drainage schemes overwhelmed and of no use,authorities hinted that it could’ve been worse.(There would be building work for months to come,developers would have no cause to complain.)A general cleaning-up operation began;houses, garages, skips gleamed with the slimedeposited everywhere like a disease.We will get over it though we’re not sure how.The country sighed in the calm after the storm,emergency services set themselves to the grimsequel as drowned townlands emerged at last,the earth increasing as the flow decreased.The birds, crowing and piping with relief,announced a partial return to normal lifeand light shone in the cloud until next time.It’s snow and black ice we’ve to contend with now.‘After the storm’ by Derek Mahon,from An Autumn Wind (2010)by kind permission of the author andThe Gallery Press (www.thegallerypress.com)resilience to disasters and climate change requires the involvement of all these actors.However, it is important that responses take into account the particular circumstancesof the urban poor who are generally the most vulnerable both to extreme events andto slow-onset changes. There are several specific ways in which adaptation to climatechange and disaster risk reduction can take this into account:Ensure that infrastructure works for the poor. New infrastructure – particularlyfor the provision of water, sanitation and drainage – is an important aspect of urbanadaptation to climate change and to building broader resilience. Yet too often, existinginfrastructure is poorly maintained. Often it is poor maintenance of storm andsurface drains that contributes so much to flooding – for instance, for many cities,the need to de-silt them and clear them of garbage before the monsoon rains come.Improving waste collection services from low-income communities can reduce floodingat times of heavy rain and can improve child health through reducing exposureto disease. Effective transportation systems can enable low-income groups to live insafer physical surroundings while still being able to access employment and livelihoodopportunities.World Disasters Report 2010 – Focus on urban risk127
Strictly under embargo until Wednesday 22 September at 00:01 GMT (02:01 Geneva time)Support slum and squatter upgrading. Where large numbers of people live in poorqualityhousing in informal settlements, improving housing and getting basic infrastructurein place is a priority for adaptation. However, it is important to make sure that these newhouses and infrastructure are constructed in such a way that they can withstand likely futurechanges in climate. In association with this, it is important to address related social issues:people and communities who are healthier, better educated and with secure tenure are moreable to deal effectively with a wide range of shocks and stresses, including one-off extremeevents and climate change. Ongoing action to improve the provision of public services canprovide households with a firmer base from which to face the challenges of climate change.Urban planning, management and governance are all now firmly on the IPCC agenda.Rainfall totals forNovember 2009in Ireland were thehighest on record,and large parts ofthe city of Cork andsurrounding areaswere flooded whenthe River Lee burstits banks.© The Irish ExaminerReconsider zoning, planning and building regulations. Zoning and planning controlshave often served to exclude a large proportion of the urban population in lowandmiddle-income nations from legal land markets. The identification of ‘vulnerable’land in preparing for climate change should not be used in the same way. Instead, thesecontrols can be used to help provide appropriate and safe locations for low-incomehouseholds while reducing their exposure to the risks of flooding, slope failure andother disasters. The application of building standards that are appropriate to local contexts,including affordability, and used in ways that support incremental improvementscan make housing resistant to extreme weather, while still enabling poor residents livingin self-built or artisan-built constructions to upgrade at an appropriate pace and cost.128
Strictly under embargo until Wednesday 22 September at 00:01 GMT (02:01 Geneva time)Ensuring climate and disaster preparednessin key urban sectorsEngaging with a wide range of stakeholders is key to ensuring that adaptation and disasterrisk reduction actions meet the needs of a broad cross-section of urban residents.This approach has been used by several major stakeholders and projects as the meansof engaging in climate change adaptation in urban areas. Both the Asian Cities ClimateChange Resilience Network and UN-Habitat’s Cities in Climate Change Initiativeuse multi-stakeholder engagement processes to support urban adaptation. However,many specific actions need to be taken at a sectoral level. As Table 6.3 shows, many ofthese specific actions in water supply provision, storm and flood-water management,public health, energy and transportation meet both climate change and disaster riskreduction objectives.Table 6.3 Examples of climate change and disaster preparedness goals and actionsPriority planning area Preparedness goal Preparedness actionsWater supply Expand and diversify water supply Develop new groundwater sourcesConstruct new surface water reservoirsEnhance existing groundwater suppliesthrough aquifer storage and recoveryDevelop advanced wastewater treatmentcapacity for water re-useReduce demand / improve efficiencyIncrease billing rates for waterChange building codes to require low-flowplumbing fixturesProvide incentives (e.g., tax breaks,rebates) for switching to more waterefficientprocessesIncrease drought preparednessUpdate drought management plans torecognize changing conditionsStorm- and flood-watermanagementIncrease public awareness about impacts onwater suppliesIncrease capacity to manage storm waterReduce property damage from floodingImprove information to manage storm andflood eventsProvide information on climate changeimpacts to water supplies and howresidents can reduce water use in utilityinserts, newsletters, web sites, localnewspapersIncrease capacity of storm-water collectionsystemsModify urban landscaping requirements toreduce storm-water runoffPreserve ecological buffers (e.g., wetlands)Move or abandon infrastructure inhazardous areasChange zoning to discourage developmentin flood hazard areasUpdate building codes to require moreflood-resistant structures in floodplainsIncrease the use of climate and weatherinformation in managing risk and eventsUpdate flood maps to reflect change riskassociated with climate changeWorld Disasters Report 2010 – Focus on urban risk129
Strictly under embargo until Wednesday 22 September at 00:01 GMT (02:01 Geneva time)Public health Reduce impacts of extreme heat events Improved early warning systems forextreme heat eventsOpen additional cooling centres duringextreme heat eventsIncrease use of shade trees to reduceurban temperaturesImprove disease surveillance and protection Increase monitoring of known diseases andpotential diseases moving into the areaIncrease public education on diseaseprevention for vector-borne illnesses thatcould increase as a result of climate changeEnergyEnsure consistency of energy supplies whileexpanding to low-income groupsStrengthening of overhead transmissionand distribution infrastructureUnderground cabling for utilitiesReduced dependence on single sources ofenergyReduce greenhouse gas emissions associatedwith energy useEnergy efficiencyUse of renewable sourcesTransportationEnsure that transportation network functionsdespite changes in temperature andprecipitationEnsure that transportation system facilitatesrapid emergency responsesRealignment or relocation of transportinfrastructureImproved design standards and planningfor roads, rail and other infrastructureEffective emergency plans for utilizingtransportation networks for evacuations, etc.Source: Adapted from ICLEI (2007) and IPCC (2007)Financing urban adaptationMeeting the challenges of climate change will require considerable investment in infrastructureand services – particularly in low- and middle-income nations. However,many of the existing assessments of adaptation costs have been based on present investmentin infrastructure and have not taken into account the infrastructure deficit (thecurrent shortfall in infrastructure provision for cities under existing climatic conditions)present in many cities in low- and middle-income nations. Any realistic measureof the costs of adaptation in urban areas therefore needs to be informed by an analysisof current disaster risks and the required investment in housing, early warning systemsand rapid and effective post-event responses including temporary accommodation,restoring access to services, supporting rapid return to damaged settlements and supportingrebuilding.However, new funding pathways are currently being developed that are intended tosupport investment in adaptation to climate change. Some of these fall under thebanner of traditional overseas development assistance. Others are coordinated underthe UNFCCC, although their precise nature is the focus of ongoing UNFCCC130
Strictly under embargo until Wednesday 22 September at 00:01 GMT (02:01 Geneva time)negotiations. However, there are no clear mechanisms through which internationalclimate change adaptation funds can be transferred to local governments (includingcity authorities) and many urban interventions, including financing for large-scaleinfrastructural projects, fail to assess the likely impacts of climate change.Towards urban resilienceThe ultimate objective of disaster risk reduction and climate change adaptation isto produce resilient cities. Rather than focusing on anticipating specific hazards –whether these are short-term disaster risks or longer-term changes in climate – citystake holders, particularly in low- and middle-income nations, ought to take a broader,integrated approach that addresses both current and future development needs.Resilience therefore takes into account the economic, social, psychological, physicaland environmental factors that are necessary for humans to survive and to thrive.Locally rooted strategies to build resilience need to incorporate a strong focus on bothdisaster risk reduction and climate change adaptation and need to be embedded withina city’s institutional and organizational framework.Many aspects of resilience are closely associated with a holistic approach to development.Individuals and households that have access to adequate food, clean water,healthcare and education will inevitably be better prepared to deal with a variety ofshocks and stresses – including those arising due to climate change.Box 6.5 Building resilience as a strategy for climate changeadaptation and disaster risk reductionResilient towns and cities are able to withstanda variety of challenges. As well as helping tomanage the challenge of climate change, increasingresilience generates a wide range ofadditional advantages. The Resilience Allianceand the Asian Cities Climate Change ResilienceNetwork suggest that urban resilience involvesthe following components:Redundancy. When one system is disrupted,another system can provide similarservices. For example, if individuals aretrained in basic health and emergencyresponses, they are able to provide immediatesupport if transportation and communicationsystems are disrupted following anextreme event.Flexibility. The failure of a single systemcauses a minimal impact to other systems.For example, a city with a diversified economicbase will avoid catastrophic failureif a single industry fails due to economicchange or environmental disaster.Capacity to reorganize. Climatechange will result in changing conditions– and resilient cities are able to introducenew structures, organizations and land-usemeasures in response to this.Capacity to learn. This ensures thatfuture decisions are made on the basisof relevant information and appropriateforethought.Source: ISET, 2009World Disasters Report 2010 – Focus on urban risk131
Strictly under embargo until Wednesday 22 September at 00:01 GMT (02:01 Geneva time)Integrated actions and multi-stakeholderapproachesCreating resilienttowns is not only aquestion of improvedinfrastructure, but alsoof raising communities’awareness of thehazards they mayface. In Samoa,residents learn how tomap out disaster andhealth risks.© Rob Few/IFRCCreating more resilient towns and cities that are able to cope with disaster risks andclimate change requires action by a range of stakeholders. These can include those whoare (or are likely to be) affected, those who have technical expertise, those who havefinancial resources and those with authority for decision-making. These stakeholderscan then come together as steering committees or working groups to address particularissues. As the Saint-Louis case study shows, the combined knowledge, skill andpolitical influence of groups working together is able to generate more effective resultsthan individual organizations working on their own. Development and humanitarianorganizations can also modify their programmes, policies and practices to addressclimate change in urban areas more effectively. These organizations can also facilitate arange of household coping strategies through their actions.ConclusionWork got under way in earnest this year on the IPCC’s Fifth Assessment Report whichwill look closely at urbanization processes and is due for delivery in 2014. This isjust one year prior to the ultimate date, 2015, set by the IPCC for global emissions132
Strictly under embargo until Wednesday 22 September at 00:01 GMT (02:01 Geneva time)to peak if the planet is to have a chance of limiting temperature increase to between2 and 2.4 degrees Celsius. The general acceptance by the G8 of a 2 degrees Celsiusceiling may still be too much for many coastal cities’ defences and this needs to berecognized sooner rather than later when it comes to investment in disaster risk reduction.Entrenched dichotomies between climate change adaptation and disaster riskreduction need to be dismantled long before then to enable a focus on building urbanresilience. The International Federation of Red Cross and Red Crescent Societies forexample, in its Strategy 2020, addresses climate change adaptation “through scaling updisaster risk reduction measures and strengthening traditional methods of coping withdisasters that are relevant in particular environmental contexts”.Climate change will have both a quantitative and a qualitative impact on the risksfacing urban areas in coming decades. In particular, the inability to predict futureemissions scenarios and the lack of precise knowledge about the impacts that thesewill have on the global climatic system means that urban residents and authorities willhave to deal with an increasing level of uncertainty around the frequency and intensityof extreme weather events. Many countries still have some way to go in order to catchup with reality: a WMO survey in 2006 showed that more than 60 per cent of its 189members are inadequately equipped to warn populations against hazards, particularlyin most vulnerable countries. It seems remarkable that it was only in April 2010 that30 ministers in charge of meteorology in Africa met for the first time under the auspicesof WMO and the African Union, given that Africa is so poorly equipped to dealwith climate change at both urban and rural levels.When combined with increasing levels of urbanization and ongoing social and environmentalproblems in towns and cities, risk and vulnerability for many urban residentsare likely to be exacerbated. The impacts of climate change will be distributedunevenly within urban populations, with low-income groups being particularly vulnerabledue to their greater exposure to hazards and their lower levels of adaptivecapacity. A focus on building resilience to cope with uncertainty, rather than applyingsolutions based on specific scenarios, is therefore the best way of protecting the livesand livelihoods of urban residents.The actions taken by urban authorities, civil society organizations and humanitarianagencies in urban areas can make a substantial difference to the ability of towns andcities – and their residents – to respond to disasters and climate change. For citydwellers in low-income and many middle-income countries, the biggest single issue isthe infrastructure deficit – the inability of urban systems to deal with current climatevariability. Many of the hazards and risks facing cities as a result of climate change aremodifications to existing hazards and risks – and cities that are unable to deal withthe challenges of today will be unable to deal with the new climate challenges of thefuture. Improved planning for disaster risks, including better short-term forecastingof shocks, is therefore also a key component for responding to climate change. At theWorld Disasters Report 2010 – Focus on urban risk133
Strictly under embargo until Wednesday 22 September at 00:01 GMT (02:01 Geneva time)134CHAPTER 6same time, the development of sound responses to existing patterns of risk will form asolid basis with which to deal with those that are genuinely new. These measures needto be considered within an overall framework of a global transition to a low-carboneconomy in order to minimize the risk of dangerous climate change taking place in thecoming decades.Chapter 6 and Box 6.1 were written by David Dodman, Senior Researcher, HumanSettlements and Climate Change Groups at the International Institute for Environment andDevelopment, London. Box 6.2 was written by Khady Diagne from the NGO, Enda-TiersMonde; Box 6.3 was written by Denis McClean, World Disasters Report editor; Box 6.4is a contribution from poet Derek Mahon; and Box 6.5 was written by the Institute forSocial and Environmental Transition (ISET).
Strictly under embargo until Wednesday 22 September at 00:01 GMT (02:01 Geneva time)Sources and further informationAdelekan, I. ‘Vulnerability of poor urban coastal communities to flooding in Lagos,Nigeria’ in Environment and Urbanization, Vol. 22, No. 2, 2010.Alejandra, M. and Takanashi, K. ‘Vulnerability and Adaptation to Climate Changein Central Peruvian Andes Cities: report of pilot study’ in Proceedings of the8th International Conference on Southern Hemisphere Meteorology and Oceanography,24–28 April, Foz de Iguazu, Brazil, 2006.Awosika, L. et al. ‘Sea level rise on African coastal zone’ in Nigerian Institute forOceanography and Marine Research, Vol. 12, No. 3, pp. 14–16, 1991.Ayers, J. ‘International funding to support urban adaptation to climate change’ inEnvironment and Urbanization, Vol. 21, No. 1, pp. 225–240, 2009.Bartlett, S. ‘Climate change and urban children: impacts and implications for adaptationin low- and middle-income countries’ in Environment and Urbanization,Vol. 20, No. 2, pp. 501–519, 2008.Bloomberg, M. and Aggarwala, R. ‘Think Locally, Act Globally: how curbingglobal warming emissions can improve local public health’ in American Journal ofPreventative Medicine, Vol. 35, No. 5, pp. 414–423, 2008.Boko, M. et al. ‘Africa’, in Parry, M.L. et al. (eds), Climate Change 2007: Impacts,Adaptation and Vulnerability. Contribution of Working Group II to the FourthAssessment Report of the Intergovernmental Panel on Climate Change. Cambridge:Cambridge University Press, 2007.de Sherbinin, A., Schiller, A. and Pulsipher, A. ‘The vulnerability of global cities toclimate hazards’ in Environment and Urbanization, Vol. 19, No. 1, pp. 39–64, 2007.Dodman, D. ‘Urban form, greenhouse gas emission and climate vulnerability’ inGuzmán, J. et al., Population Dynamics and Climate Change. United NationsPopulation Fund (UNFPA) and International Institute for Environment andDevelopment (IIED), 2009.Dodman, D. ‘Blaming cities for climate change? An analysis of urban greenhousegas emissions inventories’ in Environment and Urbanization, Vol. 21, No. 1,pp. 185–201, 2009.Dodman, D., Ayers, J. and Huq, S. ‘Building Resilience’ in Worldwatch Institute, Stateof the World 2009: Into a Warming World. Washington DC: Worldwatch Institute,2009.Dodman, D. and Satterthwaite, D. ‘Institutional capacity, climate change adaptationand the urban poor’ in IDS Bulletin, Vol. 39, No. 4, pp. 67–74, 2008.World Disasters Report 2010 – Focus on urban risk135
Strictly under embargo until Wednesday 22 September at 00:01 GMT (02:01 Geneva time)136CHAPTER 6Dossou,K. and Gléhouenou-Dossou, B. ‘The vulnerability to climate change ofCotonou (Benin): the rise in sea level’ in Environment and Urbanization, Vol. 19,No. 1, pp. 65–79, 2007.El-Raey, M. ‘Vulnerability assessment of the coastal zone of the Nile Delta of Egyptto the impact of sea level rise’ in Ocean and Coastal Management, Vol. 37, No. 1,pp. 29–40, 1997.ICLEI. Preparing for Climate Change: a guidebook for local, regional and state governments.Center for Science in the Earth System (The Climate Impacts Group), JointInstitute for the Study of the Atmosphere and Ocean (University of Washington)and King County Washington, 2007. Available online: www.ecy.wa.gov/climatechange/docs/CCguidebook_localgovs_2007.pdf.Intergovernmental Panel on Climate Change (IPCC). Statement of R.K. Pachauri,Chairman, IPCC to the UN Summit on Climate Change, 22 September 2009.Available online: www.ipcc.ch/pdf/presentations/rkp-statement-unccs-09.pdf.IPCC. The Fourth Assessment Report: Climate Change 2007. Geneva: IPCC, 2007.Available online: www.ipcc.ch/publications_and_data/publications_and_data_reports.htm#1.IPCC. The Regional Impacts of Climate Change:An assessment of vulnerability. Geneva:IPCC, 2001. Available online: www.grida.no/climate/ipcc/regional/index.htm.International Federation of Red Cross and Red Crescent Societies. Strategy 2020.Geneva: IFRC, 2010. Available online: www.ifrc.org.Institute for Social and Environmental Transition (ISET). Asian Cities Climate ChangeResilience Network – Responding to the Urban Climate Challenge. Boulder, Colorado:ISET, 2009. Available online: www.rockefellerfoundation.org/news/publications/acccrn-responding-urban-climate.Irish Academy of Engineering. Ireland At Risk – Critical Infrastructure and ClimateChange. Dublin: IAE, 2009. Available online: www.iae.ie/site_media/pressroom/documents/2009/Nov/17/Ireland_at_Risk_2.pdf.Kovats, R.S. and Koppe, C. ‘Heat waves past and future impacts on health’, in Ebi,K., Smith, J. and Burton, I. (eds.), Integration of Public Health with Adaptationto Climate Change: Lessons learned and new directions. London: Taylor & FrancisGroup, 2005.Kovats, R.S. and Akhtar, R. ‘Climate, climate change and health in Asian cities’ inEnvironment and Urbanization, Vol. 20, No. 1, pp. 165–175, 2008.Lebel, L. et al. ‘Integrating Carbon Management into the Development Strategies ofUrbanizing Regions in Asia: implications of urban function, form, and role’ inJournal of Industrial Ecology, Vol. 11, No. 2, pp. 61–81, 2007.
Strictly under embargo until Wednesday 22 September at 00:01 GMT (02:01 Geneva time)Mata, J. L. and Nobre, C. Background paper: Impacts, vulnerability and adaptation toclimate change in Latin America. Presented at UNFCCC Regional Workshop onLatin American Adaptation, Lima, 18–20 April 2006.McGranahan, G., Balk, D. and Anderson, B. ‘The rising tide: assessing the risksof climate change and human settlements in low elevation coastal zones’ inEnvironment and Urbanization, Vol. 19, No. 1, pp. 17–37, 2007.Neira Carrasco, J. Medidas asumidas por el Municipio del Distrito de Quito para afrontarlos efectos del cambio climático. 2007. Available online: www.comunidadandina.org/desarrollo/cl_JuanNeira.pdf.Patt, A., Dazé, A. and Suarez, P. ‘Gender and climate change vulnerability: what’s theproblem, what’s the solution?’ in Ruth, M. and Ibarraran, M. (eds.), DistributionalImpacts of Climate Change and Disasters: Concepts and Cases. Cheltenham: EdwardElgar, 2009.Schneider, S. et al. ‘Assessing key vulnerabilities and the risk from climate change’in Parry, M. et al. (eds.), Climate Change 2007: Impacts, Adaptation andVulnerability. Contribution of Working Group II to the Fourth Assessment Report ofthe Intergovernmental Panel on Climate Change. Cambridge: Cambridge UniversityPress, 2007.Satterthwaite, D. and Dodman, D. ‘The costs of adapting infrastructure to climatechange’ in Parry, M. et al., Assessing the costs of adaptation to climate change: a reviewof the UNFCCC and other recent estimates. London: IIED/Grantham Institute,2009.Tacoli, C. ‘Crisis or Adaptation? Migration and climate change in a context of highmobility’ in Guzmán, J. et al., Population Dynamics and Climate Change. UNFPA/IIED, 2009.United Nations Human Settlements Programme (UN-Habitat). Cities in ClimateChange Initiative. Nairobi: UN-Habitat, 2008. Available online: www.unhabitat.org/pmss/listItemDetails.aspx?publicationID=2565.Wilbanks, T. et al. ‘Industry, Settlement and Society’ in Parry, M. et al. (eds.), ClimateChange 2007: Impacts, Adaptation and Vulnerability. Contribution of Working GroupII to the Fourth Assessment Report of the Intergovernmental Panel on Climate Change.Cambridge: Cambridge University Press, 2007.World Meteorological Organization (WMO). WMO statement on the status of theglobal climate in 2009. Geneva: WMO, 2010. Available online: www.wmo.ch/pages/prog/wcp/wcdmp/documents/WMOStatement2009.pdf.WWF. Mega-Stress for Mega-Cities: A Climate Vulnerability Ranking of Major CoastalCities in Asia. Gland, Switzerland: WWF, 2009. Available online: http://assets.panda.org/downloads/mega_cities_report.pdf.World Disasters Report 2010 – Focus on urban risk137
138CHAPTER 7Strictly under embargo until Wednesday 22 September at 00:01 GMT (02:01 Geneva time)
Strictly under embargo until Wednesday 22 September at 00:01 GMT (02:01 Geneva time)Urban governance anddisaster risk reductionThis year sees an unprecedented level of attention on urban governance and sustainableurban development, not least in the new campaign being launched by the UnitedNations International Strategy for Disaster Reduction (UNISDR), Making CitiesResilient, which seeks the commitment of mayors, city leaders and local governmentsto concrete measures to reduce disaster risk, and to work on their implementation withcommunity organizations, the private sector and national governments.According to the United Nations Human Settlements Programme (UN-Habitat), theMillennium Development Goal ‘slum target’ has been reached, improving the livesof 227 million people, particularly in China and India, but the population of slumdwellers around the world continues to grow at around 10 per cent annually. Lessonsclearly need to be learned from this about how good urban management practices insome parts of the world can facilitate learning and help reduce risk in other parts wherelittle progress is being made, particularly among the urban populations of sub-SaharanAfrica and west Asia.The quality and capacity of local government in a city have an enormous influence onthe level of risk that its population faces from disasters and, in particular, on whetherrisk-reducing infrastructure serves everyone including those living in low-income areas.Local or municipal governments also influence whether provision has been made toremove or reduce disaster risk from events such as floods and large-scale fires or to buildinto the city the capacity to withstand potential disaster events such as earthquakes.The quality and capacity of local government also have an enormous influence on thelevels of risk from everyday hazards that can contribute much to mortality, injury orillness but that are not considered disasters, such as vector-borne diseases and trafficaccidents. These risks are not an inherent characteristic of cities but the result of thelimitations of their governments in meeting their responsibilities and, more broadly, oflimitations of governance including the quality of their relations with the inhabitantsand civil society organizations.Most of what local governments do, or should be doing, is about reducing risks fortheir populations through ensuring services such as good provision for water, sanitation,drainage, solid waste collection, healthcare, all-weather access roads, electricity,emergency services and provision for transport and traffic management. They shouldalso ensure health and safety standards are met. Even if provision for some of theseare contracted to private enterprises or provided by higher levels of government, it isusually the responsibility of local government to coordinate or oversee their provision.Local governments that support meeting development needs reduce disaster risk. InPhoto opposite page:In Aceh, Indonesia,builders work indifficult conditionsunder a very hot sunto construct a largewater reservoir, builtwith support fromthe Indonesian andAmerican Red CrossSocieties.© Vina Agustina/American Red CrossWorld Disasters Report 2010 – Focus on urban risk139
Strictly under embargo until Wednesday 22 September at 00:01 GMT (02:01 Geneva time)CHAPTER 7addition to key roles in pre-disaster damage limitation they also have an important rolein post-disaster response and rebuilding.The concentration of people and enterprises in cities is often seen as increasing risk andexposure but it also means economies of scale and proximity for most forms of infrastructure,including roads, electricity, water and sanitation, and services such as publictransport, communications, education, healthcare or good waste collection systems– all of which can contribute greatly to the reduction of risk. In a well-governed city,much of the disaster risk in terms of death and serious injury is enormously reducedby good-quality buildings and infrastructure. If these interventions do not preventdisasters, they can dramatically cut the death and injury tolls and should limit theeconomic impacts. This applies not just in cases of extreme weather or earthquakesbut also for industrial accidents and fires. In the past, fires devastated many of theworld’s wealthiest cities. Indeed, the city of Venice pushed its glass-making industriesto a separate island, Murano, in the 13th century to reduce the risk of fire. In morerecent times, fire risk reduction was built into building regulations and controls overenterprises and into rapid response capacity from emergency services. Unfortunately,such risk reduction is not present for most cities in low- and middle-income nations,or at least for their low-income districts.Chapter 1 described the web of institutions that help reduce or remove disaster risk inurban areas. In addition, a combination of land-use planning and management and theapplication of building standards should ensure that this continues even in a rapidlyexpanding city. In disaster situations, it may be easier to offer emergency assistanceand care to concentrated populations because the health infrastructure, road networks,airports, ports and communications systems are all in place. However, in most cities inlow- and middle-income nations, a high proportion of the population is not served byany of the risk reduction measures noted above. If cities are not well governed and thuspay little or no attention to the measures that reduce disaster risk, the consequencesof a disaster can be drastic. The recent earthquake that devastated Port-au-Prince andits surrounds in Haiti is an example of how dangerous a city can be if it is externallydependent and poorly governed with little institutional capacity, no emergency plansand little capacity or will to address the structural causes of vulnerability.A mismatch between the city’s population growth and the capacity to keep down risks,support good-quality housing and provide infrastructure and services is often blamedon population growth or on ‘uncontrolled urbanization’. Usually though, it is an institutionalfailure to keep up with economic developments which attract migrants. Muchof what contributes to reducing disaster risk is the same as what is needed to satisfyeveryday needs.However, even in well-governed cities, it is a challenge to get disaster risk reductionembedded in all the relevant sectors and agencies, as Box 7.1 on Durban shows. Here,140
Strictly under embargo until Wednesday 22 September at 00:01 GMT (02:01 Geneva time)the city government has developed a municipal climate protection programme that isworking in partnership with its disaster management branch but it is difficult for bothto get buy-in from key sectors and support for disaster risk reduction when the cityfaces many pressing development needs and its budget is constrained by the recession.The uncertainty around levels of risk for many potential catalysts of disasters makes itdifficult to provide the needed economic rationale for preventive measures.Box 7.1 Disaster preparedness and climate change adaptationin Durban, South AfricaDurban is one of the few cities worldwide thathas a municipal government which has developeda locally rooted climate change adaptationstrategy. Developing this strategy has alsomade evident the need to strengthen the city’sdisaster management capacity – disaster risk reductionneeds to be embedded in the city’s sectoraldepartments and investment programmes.Durban is the largest port and city on theeast coast of Africa and has around 3.7 millioninhabitants. The municipal climate protectionprogramme was initiated in 2004 with an impactanalysis to identify the range and severityof climate change-related risks and the neededadaptation responses. It was difficult to get mostsectors of government to act because of highworkloads, extensive development challenges,the perception of climate change as a distantthreat and a shortage of skills and funds, so itwas decided to develop sector-specific adaptationplans that could be integrated into existingbusiness plans and funding. The health and watersectors were selected as pilots because oftheir high-risk profile and political importance.The risk analysis showed that adaptation inthese two key sectors could not eliminate disasterrisks so there was a need for both disaster riskreduction and disaster preparedness. A disastermanagement municipal adaptation plan (MAP)was developed. This highlighted how disastermanagement in the city was focused on shorttermrelief, such as handing out food and blankets,rather than proactively addressing strategicplanning issues focused on disaster prevention.Disaster management also lacked the staff and‘institutional muscle’ to ensure all municipal departmentsengage in risk assessment, monitoringand response. The disaster management MAPidentified five priorities:1. Implementing the disaster risk managementframework. This identifies the prerequisitesfor effective disaster management withinthe city, i.e., integrated institutional capacity,disaster risk assessment, disaster risk reduction,response and recovery, information managementand communication, education, training, publicawareness and research, and funding. Thisframework was submitted to the council but implementingit is likely to be a lengthy proceduregiven that it involves institutional change.2. Comprehensive city-wide risk assessment.This is being developed through a partnershipbetween the environmental planning andclimate protection department and the disastermanagement branch.3. Strengthen the disaster managementbranch. Although much needed, it isdifficult to secure the support given the constraintson the city budget.4. Revision of contingency plans forkey risk areas. There is an immediate needto update existing contingency plans (particularlyfor priority risk areas). These should includeconsiderations such as the need to establishemergency operation centres linked to an earlywarning system and regular rehearsal exercises.World Disasters Report 2010 – Focus on urban risk141
Strictly under embargo until Wednesday 22 September at 00:01 GMT (02:01 Geneva time)The management of the major hazard installationregulations (which govern the notification, riskassessment and emergency planning requiredof new and existing hazardous installations) alsoneeds improvement.5. Hosting a disaster managementsummit. To help raise the profile and awarenessof the disaster management MAP includingdisaster risk reduction.What has emerged from the developmentof the disaster management MAP is the soberingrealization that despite the serious risksposed by climate change, basic institutionaland resource challenges within local governmentare delaying appropriate planning andresponses. These challenges will have to bemet but they inevitably depend on political willand the ability to access additional funding.Land-use management and disaster riskFor almost all urban centres, it falls to local government to manage land use and thisshould ensure that dangerous sites, such as flood plains, are not built on, that there isadequate provision for schools and other services, that open space for parks and playgroundsis protected and that watersheds and natural coastal protective defences, suchas mangroves and dunes, are preserved in an ecological manner. Land-use managementalso has to ensure that sufficient land with infrastructure is available for housing andenterprises. Local regulations on site development and buildings should ensure thatnew buildings meet health and safety standards. All this helps to reduce risks fromeveryday hazards and from disasters, especially when combined with the provision ofessential infrastructure and services. Indeed, they help stop extreme weather eventsbecoming disasters. They should also be the means by which risks from earthquakesare much reduced. However, it is hard for any politician to gain votes by pointing toa disaster that did not happen and it is difficult, or even impossible, for the agenciesconcerned with disaster response to get attention paid to these deficiencies.Informal settlements in a city are a reflection of governance failures – especially inland-use management. They reflect a failure of local authorities to ensure sufficientland with infrastructure is available for new housing in appropriate locations. Veryoften this is linked to the lack of power and resources available to city governments andthe disinterest of national government and international agencies in addressing cityproblems. The results are visible in almost all cities in low-income nations and mostcities in middle-income nations: urban expansion is haphazard, determined by wheredifferent households, residential areas, enterprises and public sector activities locateand build, legally or illegally. There is no plan to guide this process or if there is, it isignored. There are usually many regulations to prevent this but these are avoided orbypassed by politicians and real estate interests.As cities expand in an unplanned patchwork of high and low density, this greatlyincreases the costs of providing risk-reducing infrastructure and services. It also meansthe segregation of low-income groups in illegal settlements on the most hazardous sitessuch as those affected by periodic floods, sea surges, seasonal storms and land subsidence.142
Strictly under embargo until Wednesday 22 September at 00:01 GMT (02:01 Geneva time)For many cities, including those mentioned in Box 7.2, disasters are not new. They havea record of disasters at different scales. The cases mentioned highlight institutional incapacityto address urbanization issues from different angles. When combined with lack ofaccountability to citizens and little scope for citizen participation, this means little actionto reduce risks in urban areas, especially where low-income groups live. For much urbanexpansion, the ‘solution’ to the lack of institutional capacity to manage land use has beento be outside the legal framework of building codes and land-use regulations, and outsidethe scope of officially recorded and legally sanctioned land transactions. In many cities,some high- and middle-income groups also occupy dangerous land sites but the possibilityto reduce risk and receive emergency assistance and insurance coverage is muchgreater. City and municipal governments can thus be key players in disaster risk creationand amplification or in disaster risk reduction. This has been acknowledged for sometime by the development and disaster response community, and several governments atnational and regional levels have designed structures to support local governments.Box 7.2 Latin American cities expand over high-risk areasMuch of the housing in Caracas, Venezuela,is built on slopes crossed by gorges that leadto the Guaire, the city’s main river. Low-incomegroups have settled on unstable land and ingorges, where their houses often act as barriersto natural water run-off. In December1999, Venezuela experienced one-in-100-yearrainfall and this caused massive landslides andfloods that killed hundreds of people.After the floods in the city of Santa Fe,Argentina, in 2003 and again in 2007, cityauthorities recognized that for the last 50 yearsthere had been no urban land policy and thatpeople settled where and how they could,prioritizing proximity to workplaces or socialnetworks.Managua, Nicaragua, is located on a stripof land where there are 18 active faults and achain of volcanoes. In this city of 1.4 millionpeople, 79 per cent of the houses are of bad ormediocre construction quality and 18 per centneed complete renovation. About 45,000 familieslive in 274 informal settlements, which lackaccess to water, sanitation and electricity. It isestimated that each year in Managua 3,000homes are built without authorization and thuswith no oversight of the quality of construction.During Hurricane Mitch in 1998, the citiesof Tegucigalpa and Comayaguela in Honduraswere seriously affected. Most damage was concentratedaround the four rivers that cross thesecities. Inadequate city infrastructure, especiallywater, sanitation and drainage, lack of zoningcodes, the concentration of services and infrastructurein only a few areas, lack of official preventionand mitigation strategies, together withan inappropriate management of river basinscontributed to the vulnerability of these areas.The local nature of disaster riskIt is at the local level that disasters materialize: lives and livelihoods are lost, houses andinfrastructure damaged and destroyed, health and education compromised. This is alsoWorld Disasters Report 2010 – Focus on urban risk143
Strictly under embargo until Wednesday 22 September at 00:01 GMT (02:01 Geneva time)144CHAPTER 7wherePhoto opposite page:On 27 May 2006,an earthquakecaused widespreaddestruction around thecity of Yogyakarta onJava, Indonesia, killingsome 6,000 people.The Indonesian RedCross Society, backedby the IFRC, launcheda massive reliefoperation to help theinjured and those whowere displacedby the quake.© Spanish Red Crossthe lack of attention to disaster risk reduction by local governments becomesevident – even as politicians and civil servants hide behind the term ‘natural disaster’ orfind fault with their predecessors. But it is also at the local level that risk managementbecomes possible. Vulnerability and hazards interact generating specific risk conditions,which are socially and geographically specific, dynamic and in constant flux. It isat the local level that civil society can interact with government and together plan fordisaster risk reduction within a local development framework.The 1990s – the International Decade for Disaster Risk Reduction – brought a shiftin the way disasters are understood with much more attention being paid to the linksbetween development, disasters and environmental degradation. From this came awidespread consensus that risks are a social construction and that risk reduction shouldbe implemented locally and with local actors. For Latin America, two key factors contributedto this: decentralization processes and state reforms in many countries; andthe occurrence of several major disasters in the region which affected large populationcentres. Several countries enacted new legislation or are in the process of makingamendments so as to meet the challenges of development and disaster risk reduction;in many cases this includes the transformation of emergency response agencies intonational risk reduction systems.Governments – many at the local level – have assumed new roles and responsibilities,including modifying their approach to risk management, integrating different actorsinto the process and implementing risk management within development planning.But these remain the exception and a wide gap exists between rhetoric and practice.Many governments at different levels continue to focus only on emergency and reconstructionefforts and the latter often fail to incorporate long-term actions that wouldreduce risk and vulnerability to disasters. Disaster risk reduction is not a one-off activitybut a continuous process.What makes cities and municipal governmentsaddress disaster risk reduction?Some city governments have shown how to incorporate disaster risk reduction intodevelopment, i.e., to go beyond provisions for disaster preparedness. They have implementedthe development initiatives and associated controls, regulatory frameworksand governance mechanisms that are essential to reducing risks. These have includedupgrading programmes for informal settlements, urban land-use management withassociated zoning and building codes, housing improvements and expanding coverageof city-wide infrastructure and services. Most examples of this come from nations orcities where popular pressure and political reforms have made local governments moreaccountable and responsive to their citizens. Obviously, this has to include local governmentswhich develop relations with those who live in informal settlements and developthe capacity to govern with, and for, them. One of the most important innovations in
Strictly under embargo until Wednesday 22 September at 00:01 GMT (02:01 Geneva time)many such cities is participatory budgeting, where the inhabitants of each district inthe city are able to influence priorities for public investments and details of the city’sbudget are published and made much more transparent. In the 1980s the Brazilian cityof Porto Alegre pioneered participatory budgeting and in 2004, the city introduced theLocal Solidarity Programme which allows residents in the city’s 17 municipal divisionsto participate in forums where projects for the next city budget are proposed and prioritized.More than 70 cities worldwide have adopted participatory budgeting.This shift by local governments to disaster risk reduction has been driven by differentfactors. In some nations, it is driven by stronger local democracies (for instance,a shift to elected mayors and city councils) and decentralization so city governmentshave a stronger financial base. Sometimes the trigger has been a particular disaster,such as Hurricane Mitch in Central America, or a sequence of disaster events, such asthe Armero and Popayan earthquakes and other disasters in Colombia, which helpsdrive countries and their city and municipal governments to adopt new approaches fordisaster risk reduction.After Hurricane Mitch, governments in Central America finally realized that thebest way to respond to disaster risk was to reduce it. They made efforts at legalreform in order to transform traditional emergency response frameworks into riskWorld Disasters Report 2010 – Focus on urban risk145
Strictly under embargo until Wednesday 22 September at 00:01 GMT (02:01 Geneva time)CHAPTER 7reduction systems that were multi-sectoral and inter-institutional. In each country,a national commission for risk management and disaster prevention was set up. Forinstance, in Nicaragua, the Sistema Nacional para la Prevención, Mitigación y Atenciónde Desastres (national system for disaster prevention, mitigation and response,now known as SINAPRED) was created in 2000 to work with local governmentsto strengthen the country’s institutional capacity for disaster preparedness and management,integrating disaster mitigation and risk reduction into local developmentprocesses. Local governments are responsible for activities related to prevention,mitigation, preparation, response, rehabilitation and reconstruction within theirterritories, based on risk assessments. Several municipalities have incorporatedpreventive planning especially in regard to approving building licences and landuse, and different sectors including health, education and planning share disasterrisk information. The system operates with a national disaster fund. Most of thesenational systems are, however, relatively new and need time to consolidate. Anotherconcern is that local governments may be allocated responsibilities for which theylack the capacity and resources.Addressing the limits in disaster risk reductionby municipal and city governmentsWhile local government engagement is essential for disaster risk reduction, manydisaster risks need coordinated action across a range of local governments. For instance,many large cities are composed of different municipalities (local governments) and disasterrisks are often concentrated in particular municipalities. For example, São Paulois made up of a central city with about 11 million inhabitants and 38 separate municipalities,while Buenos Aires consists of a central city of some 3 million inhabitants and26 municipalities. The municipalities with the highest disaster risks are often amongthe weakest financially and have the largest concentrations of low-income groups livingin informal settlements. They therefore have the largest deficits in provision for theinfrastructure and services that underpin risk reduction.Most flood problems in urban areas require a river basin management approach but forlarge cities, this can require investments and coordination among many different localgovernment units – often including local governments controlled by opposing politicalparties. Or extreme weather events can simply overwhelm the capacity of a localgovernment or require actions outside its boundaries and competence.In December 2009, several small and medium-sized cities in Argentina, includingSalto, Pergamino, Arrecifes, Carmen de Areco and San Antonio de Areco, were floodedafter torrential rains led to local rivers overflowing their banks. San Antonio de Areco,a town of more than 21,000 inhabitants, was hit particularly hard and 3,000 peoplehad to be evacuated. The city government could not address the causes of the flooding.In part this was linked to rainfall in the whole region being greater than normal,146
Strictly under embargo until Wednesday 22 September at 00:01 GMT (02:01 Geneva time)due to El Niño. Many other factors contributed to the floods, however, including alack of control within the Areco river basin, for example, narrow sections of the riverwere not dredged, bridges and highways impeded water flow, changes in land use hadincreased the speed of run-off, and increased run-off caused by local drainage channelsconstructed by property owners in an uncoordinated manner.However, there are examples of coordinated actions among neighbouring local governments.In San Salvador, El Salvador, mayors of the metropolitan area formed acommittee to work together, with the support of the city planning unit, on certainissues such as water provision, solid waste treatment, environmental protection andcity infrastructure. After the earthquakes in 2001, the planning unit started work onmicro-zoning of risk in the Ilopango Lake basin, which also called for the involvementof other municipalities within the basin that were outside the metropolitan area.Perhaps the main barrier to risk reduction is translating what is known into what isdone. Many city and municipal governments, if asked, know that they should have along-term development plan for their city that includes disaster risk reduction. Manyalso know that this is important for climate change adaptation. The issue, therefore,is why this is not done. Obviously for many urban centres, it is because they have nodevelopment plan or if they do, it is not adhered to. But, as Box 7.1 illustrated, evenfor city governments that are able to implement their development plans, getting localdisaster risk reduction included in the plans needs trained government staff in keypositions and political support. It also needs local governments with funding capacity.It comes as no surprise that most of the innovations described so far in this <strong>chapter</strong>come from cities in middle-income nations where local governments have beenstrengthened. Disaster risk reduction needs long-term plans and support, especiallywhere the backlogs in key infrastructure and services are largest – which brings us backto the very large mismatch between what needs to be done and local capacities.Civil society groups including local non-governmental organizations (NGOs) andgrass-roots organizations have key roles in emergency responses after disasters but theystruggle to influence physical reconstruction. In addition, the channels and vehicles forparticipation – necessary to allow them to influence disaster risk reduction – are oftenabsent. The effectiveness of disaster risk reduction is not just what a local governmentdoes but also what it encourages and supports.Support from higher levels of governmentand budgetary constraintsVery few city governments in Africa, Asia and Latin America have the financial resourcesto invest in disaster risk reduction without support from provincial or national government.That support may not be forthcoming if, for example, the city government’spolitical orientation differs from that at provincial or national level.World Disasters Report 2010 – Focus on urban risk147
Strictly under embargo until Wednesday 22 September at 00:01 GMT (02:01 Geneva time)As large cities have grown without the necessary infrastructure, so the gap betweenwhat is needed and what is affordable can widen to an almost impossible degree (seeChapter 2). More than 50 per cent of the population of many large cities in Africa andAsia live in settlements without basic infrastructure. The haphazard spatial expansionof a city and the concentration of many low-income settlements on flood plains, steepslopes or other sites at risk add to the costs. The capacity of municipal governments inmost cities in low-income nations to invest in necessary infrastructure remains limited,however, even if they have been able to modernize tax collection systems or have bettercost-recovery for services such as water supplies. And this is not helped by the reluctanceof most bilateral aid agencies to support urban development.Infrastructure to prevent disaster risks is often costly to both build and maintain. Thedevastating floods that affected Santa Fe, Argentina, in 2003 and 2007 were in partdue to incomplete or unmaintained infrastructure. The city has increasingly expandedon to the Río Salado flood plain. To protect itself from floods, it had to create embankmentsand dykes, but the infrastructure to protect certain city areas was supposed to bein place shortly after 1998 but was never completed due to lack of resources. In addition,the pumps and drainage systems installed to evacuate water in protected areas didnot work because of vandalism and lack of maintenance.Box 7.3 Good governance and disaster risk reduction in AcehAccording to the Centre for Research on theEpidemiology of Disasters, more than 19 millionof Indonesia’s 210 million people havebeen affected by 309 disasters in the last twodecades. Aceh, the westernmost province ofIndonesia, is inhabited by some 4 million people.On 26 December 2004, Aceh was struckby an earthquake measuring 9.0 on the Richterscale and the subsequent tsunami left 130,000people dead, 37,000 missing and an additional500,000 people displaced. Damageand losses were estimated at US$ 4.8 billion.Aceh was also suffering from a 30-year conflictthat had claimed the lives of 15,000 peopleby the time a peace agreement was signed inAugust 2005.The international and national shift inparadigm from focusing on disaster responseto enhancing disaster risk reduction underpinsthe reform process in Indonesia. Collaborationbetween the government, civil society organizationsand international agencies led to adisaster management law, which was enactedin 2007. The law authorizes the creationof a National Disaster Management Agency(BNPB), which reports directly to the presidentof Indonesia and has a mandate to coordinateall contingency, preparedness, mitigation,prevention, disaster management trainingand disaster risk reduction activities (i.e., riskassessment and mapping). The law also addressesand regulates the development andapplication of disaster management and disasterrisk reduction plans at national and locallevels. Following passage of the law, the presidentissued Presidential Regulation 8/2008,which formally established the BNPB. Soonafterwards, the minister of home affairs issuedDecree No. 46/2008 mandating the establishmentof local disaster management agencies in148
Strictly under embargo until Wednesday 22 September at 00:01 GMT (02:01 Geneva time)all provinces by the end of 2009. The law hasbeen further clarified with additional governmentalregulations regarding the participationof international and non-government actors inall phases of the disaster management cycle.The Aceh provincial government now includesdisaster risk reduction as one of theprovince’s seven development priorities, andhas introduced measures to mainstream disasterrisk reduction into all development sectors,including policy framework, setting up a localdisaster management agency, developing alocal action plan and standard operating procedures,and increasing partnerships with civilsociety organizations. The provincial governmenthas also pursued other initiatives, such asimplementing the Aceh Green Program (mangroveplantation, reforestation), improvingspatial planning and building codes, introducingdisaster risk reduction into school curricula,and constructing or improving infrastructurewith disaster mitigation functions (such as riverand coastal embankments, drainage and accessto evacuation buildings).Promoting disaster risk reductioninitiatives in Banda AcehThe city of Banda Aceh is the capital of Acehprovince and inhabited by some 219,619people. It was among the most severely affectedmunicipalities during the 2004 earthquakeand tsunami.In line with the disaster risk reductionframework at national and provincial levels,the Banda Aceh city government has also integrateddisaster risk reduction into its developmentplan, which includes the city’s spatialplanning. While a city disaster managementagency has not yet been set up, the city governmenthas already developed a contingencyplan and standard operating procedures fordisaster response, both of which have beentested through several simulations (including theIndian Ocean wave exercise drill in December2009). The drills involved all stakeholders includinggovernment, civil society organizationsand community members.In addition, the Banda Aceh government hasworked closely with civil society groups, includingthe Red Cross and Red Crescent, to promotecommunity awareness on disaster risks. It hasalso instituted various measures to mitigate disasterrisks, including the integrated communitybaseddisaster preparedness and school-baseddisaster preparedness programmes implementedby the Indonesian Red Cross Society (PMI),improved access to evacuation buildings andfire brigades trained and equipped to take actionat any time. The city’s mayor and deputymayor have demonstrated their support andcommitment by attending several disaster riskreduction-related activities. Finally, the city governmenthas established a strong partnershipwith PMI, which has trained and equipped disasterresponse teams (known as SATGANA),which are ready to respond to any emergencies.With financial and technical assistance fromthe American Red Cross’ tsunami recovery programme,the PMI is implementing its integratedcommunity-based risk reduction programme inBanda Aceh. The programme, which seeks toenhance the capacity of vulnerable communitiesto reduce the risk and minimize the impactof disasters, has four objectives:1. Build disaster preparedness and responsecapacity of targeted communities2. Develop disaster management capacityof targeted schools by conducting disasterpreparedness and response sessions forstudents3. Enhance PMI’s disaster managementcapacity at national, provincial and district/sub-district levels4. Strengthen the capacity of the localgovernment’s disaster management andresearch in disaster risk reduction.World Disasters Report 2010 – Focus on urban risk149
Strictly under embargo until Wednesday 22 September at 00:01 GMT (02:01 Geneva time)The programme helps communities to identifypotential risks and hazards in their villagesby establishing community disaster managementcommittees and disaster response teams,which are trained in disaster risk reduction issuesand disaster response skills. It also supportscommunities with mitigation activities,contingency funds and disaster drills andworks to improve their awareness of disasterrisk reduction issues. In addition to schools andcommunities, the programme works closelywith local government and civil society organizationsto strengthen government disastermanagement capacity.Disaster risk reduction and urban developmentMuch disaster risk reduction is implemented as part of local governments’ conventionalresponsibility to provide or improve infrastructure and services, and supportimprovements in housing. Perhaps the most important of these are programmes toupgrade slums, which improve the quality of housing and the provision of housingrelatedinfrastructure and services (including water, sanitation and drainage) to settlementsthat are considered (or officially designated) as slums, including those thatdeveloped illegally. In cases where these programmes are done well and in consultationwith the inhabitants, they can transform the quality of low-income neighbourhoodsand reduce or remove disaster risks. Upgrading programmes have been carried out for40 years, and in countries such as Argentina, Colombia, Dominican Republic, Egypt,Indonesia, Morocco and Thailand, they have reached a significant proportion of theurban population, reducing slum incidence in the best cases by nearly 50 per cent.Photo opposite page:Nairobi, Kenya: A girlempties the contentsof her bucket into asmall stream that runsthrough Kibera, oneof Africa’s largestslums. With more than600,000 people livingwithin one squaremile, Kibera’s lackof basic sanitationfacilities makes itspopulation vulnerableto a wide range ofinfectious diseases.© Victor Lacken/IFRCHow well-governed a city is, is also shown in the way its government responds todisasters. In Tegucigalpa, four years after Hurricane Mitch, bridges linking poor areasto the city centre had still not been rebuilt. In Caracas, eight months after the floodsand landslides of 1999, many poor city dwellers were still living in emergency sheltersin very difficult conditions. At that time, the government was criticized for prioritizingactions that benefited certain economic interests (rebuilding roads and economicinfrastructure) at the expense of addressing social issues. Again, the importance for riskreduction of good relations between local governments and their lower-income citizensis illustrated.City and municipal governments are often among the main providers of healthcareand emergency services. The quality of these services and the extent of their coveragewill obviously influence their effectiveness in disaster response. In well-governed cities,such services are also active in promoting disaster risk reduction and, where needed,in making early warning systems work. However, for much of the urban populationin low- and middle-income nations, especially those living in informal settlements,there is no public healthcare or emergency service, or if there is, it is of poor qualityand difficult to access. Ironically, it may be that private healthcare is more important150
Strictly under embargo until Wednesday 22 September at 00:01 GMT (02:01 Geneva time)in informal settlements than in the rest of the city although its quality and coverage arealways limited by what local inhabitants can afford.Disasters also provide obvious challenges for services: not only do they have to respondto the emergency but they also have to restore healthcare for displaced people andthose with chronic diseases who need regular treatment and medicines. After the January2010 earthquake in Haiti, there was much concern about the disruption to treatmentfor people living with HIV/AIDS and tuberculosis. Another problem that occurswhen settlements need to be evacuated is assisting people who need help to move.The provision of efficient emergency services is an essential role of city and municipalgovernments in furthering disaster risk reduction.Many city and municipal governments do risk management at the local level but notlocal risk management. They support projects that contribute to aspects of risk reduction(local organization for prevention and mitigation, reforestation, building codes,land-use norms, physical protection works and early warning systems) but these donot as yet contribute to, or become embedded in, local development. Similarly, mostnational systems and the international community support some elements of locallyimplemented risk reduction but do not address the social vulnerability which defineslevels of disaster risk and which is often associated with prevailing chronic or everydayrisk conditions. Local risk reduction will be a priority for local actors according to howWorld Disasters Report 2010 – Focus on urban risk151
Strictly under embargo until Wednesday 22 September at 00:01 GMT (02:01 Geneva time)152CHAPTER 7muchthey contribute to reducing everyday risks and to their understanding of howvulnerability factors are embedded in the local development process.In Latin America, over the last 20 years, a network of academics and practitionersfrom different countries and institutions has promoted new approaches to disaster riskmanagement which stressed disaster risk reduction, local action and local governmentresponsibility, and worked with vulnerable groups to understand and address disasterrisk. Much of this work has been promoted directly or indirectly by La Red de EstudiosSociales en Prevención de Desastres en America Latina (Network of social studies in disasterprevention in Latin America).Many nations in Latin America now have well-established institutional structuresto support disaster risk reduction. In addition to the Colombian and Nicaraguansystems mentioned above, other nations have focused on broadening national emergencysystems. For example, Peru’s national system and its civil protection committee,both of which are emergency response structures, focus on capacity building,training and awareness-raising. In El Salvador, many associations of municipalities ormicro-regions exist, for example, the association for land-use planning in the JiboaValley.Associations and networks of local governments have also been created to unite effortsin addressing risk reduction. After Hurricane Mitch in Honduras, the municipalitiesof La Masica, Arizona, Esparta, San Francisco and El Porvenir established an association,MAMUCA (Community of central Atlántida municipalities), to unite effortsand create a platform for dialogue and cooperation in preparing for extreme events andcoordinating local response. This helped shift national disaster management systems tocommunity level. It involved participatory diagnosis and planning, awareness- raising,prioritizing strategic reconstruction activities and participating in local decisionmakingthrough public meetings. MAMUCA also became involved in the nationaland regional disaster risk management systems, which helped improve evacuationsduring storms, through community-based disaster reduction practices, and encouragedthe formation of local emergency committees integrated with municipal, regional andnational emergency committees. The municipal emergency committees are chaired bythe mayors and include representatives of the local council and local institutions, suchas the police, the fire department and the Red Cross.It is still difficult to get national programmes and networks to support local actionand encourage coordination between local governments. Risk reduction needs to bepromoted and supported in most sectors of local government and coordinated betweenthem – no easy task institutionally. Reviews on the actions, programmes and structuresset up after Hurricane Mitch show mixed results in terms of how they managed toembed disaster risk within local development and thus address the structural causes ofvulnerability.
Strictly under embargo until Wednesday 22 September at 00:01 GMT (02:01 Geneva time)ConclusionAs we pointed out at the beginning of this <strong>chapter</strong>, disaster risk can be greatly reducedor removed by ‘good’ local governance and support for better-quality housing andinfrastructure, and service provision. This is especially true for cities that are exposed toextreme weather or earthquakes. Special provision also needs to be made for identifyingand acting on disaster risk reduction. For local governments, it should be easier toget involved in local risk management when the process is embedded within the localdevelopment process and when it is clear that actions that can reduce disaster risk alsowork to reduce everyday risks and contribute to local development. Of course, this alsodepends on higher levels of government allowing local governments the financial andinstitutional capacity to act.For the international agencies that fund risk reduction or development, there is a needto support local-level institutional changes which engage local governments with civilsociety organizations. Local governments are often bypassed as external funding goesto national governments or through international NGOs. Institutional change oftenrequires long-term support. It may also require more staff, presenting problems forinternational agencies that face strong pressures to keep down their staff costs. But mostinternational agencies feel more comfortable funding projects not processes. Despite acommitment to ‘good governance’, local ownership and coordinated approaches, mostagencies still monitor and evaluate their work with traditional frameworks, measuringadvances and results for quantifiable and visible products and short-term objectives.There are also still too many disaster risk reduction programmes designed by outsideexperts with no real ownership or assimilation by local stakeholders from local government,community organizations and the private sector. This has to change.This <strong>chapter</strong> and Box 7.2 was written by Jorgelina Hardoy of the International Instituteof Environment and Development (IIED) – Latin America (Instituto Internacional deMedio Ambiente y Desarrollo – America Latina) with contributions from Debra Roberts,Deputy Head, Environmental Planning and Climate Protection Department, EthekwiniMunicipality, Durban, South Africa, Mark Pelling, Reader in Human Geography, King’sCollege London, and David Satterthwaite, Senior Fellow of IIED’s Human SettlementsProgramme. Debra Roberts wrote Box 7.1. Box 7.3 was contributed by Dino Argianto,Disaster Management Coordinator, and Syarifah Marlina, Deputy Head of Programs,Tsunami Recovery Program, Indonesia, American Red Cross.World Disasters Report 2010 – Focus on urban risk153
Strictly under embargo until Wednesday 22 September at 00:01 GMT (02:01 Geneva time)CHAPTER 7Sources and further informationAlmansi, F. ‘Rosario’s Development’ in Environment and Urbanization, Vol. 21, No. 1,pp. 19–35, 2009.Asociación Civil Canoa. www.canoa.org.ar/PrPe-Recons.html.Bollin, C. and Mascher, F. Honduras: Community-based disaster risk management andintermunicipal cooperation. A review of experience gathered by the special intermunicipalassociation MAMUCA. Eschborn, Germany: GTZ, 2005.Boonyabancha, S. ‘Land for housing the poor by the poor: experiences from the BaanMankong nationwide slum upgrading programme in Thailand’ in Environmentand Urbanization, Vol. 21, No. 2, pp. 309–330, 2009.Boonyabancha, S. ‘Baan Mankong: going to scale with ‘slum’ and squatter upgradingin Thailand’ in Environment and Urbanization, Vol. 17, No. 1, pp. 21–46, 2005.Cabannes, Y. ‘Participatory budgeting: a significant contribution to participatorydemocracy’ in Environment and Urbanization, Vol. 16, No. 1, 2004.Caputo, G. et al. Desastres y Sociedad en America Latina. Buenos Aires: IIED–AL/GEL.Cardona, A. et al. ‘Organización Institucional para la Gestión de Riesgos’, in Clarke,C. and Pineda Mannheim, C. (eds.), Riesgo y Desastres. Su Gestion Municipal enCentro America. Publicaciones especiales sobre el Desarrollo No 3. BID, 2007.Christoplos, I., Mitchell, J. and Liljelund, A. ‘Re-framing risk: the changing context ofdisaster mitigation and preparedness’ in Disasters, Vol. 25, No. 3, pp. 185–198, 2001.Cilento Sarli, A. La vulnerabilidad urbana de Caracas. 2007. Available online:http://168.96.200.17/ar/libros/venezuela/rvecs/3.2002/sarli.doc.Colina, F. et al. Pilot Study of Community Based Disaster Management Strategy forEarthquakes. Case of La Vega, FUNDAPRIS – JICA. ProVention CRA Toolkit CaseStudy, 2004.Centre for Research on the Epidemiology of Disasters (CRED). Annual DisasterStatistical Review 2007. Brussels: CRED, 2008.Díaz Palacios, J. and Miranda, L. ‘Concertación (reaching agreement) and planningfor sustainable development in Ilo, Peru’, in Bass, S. et al. (eds.), Reducing Povertyand Sustaining the Environment. London: Earthscan Publications, 2005.Dodman, D., Hardoy, J. and Satterthwaite, D. ‘Urban development and intensiveand extensive risk’ in United Nations International Strategy for Disaster Reduction(UNISDR), Global Assessment Report on Disaster Risk Reduction: Risk and Poverty ina Changing Climate. Geneva: UNISDR, 2009.Elguezabal, S. Refugiados ambientales: los exiliados del Mundo, Telenoche Investiga. 2007.154
Strictly under embargo until Wednesday 22 September at 00:01 GMT (02:01 Geneva time)Fay, M., Ghesquiere, F. and Solo, T. ‘Natural Disaster and the Urban Poor’ in En Breve,October, No. 23, pp. 1–4, 2003.Gavidia, J. ‘Priority Goals in Central America. The development of sustainable mechanismsfor participation in local risk management’ in Milenio Ambiental, Journal ofthe Urban Environment Programme of the International Development ResearchCentre, Montevideo, No. 4, pp. 56–59, 2006.González, V. ‘Confronting the Seismic Threat in the City of Managua. InstitutionalCooperation for Integrated Risk Management’ in Milenio Ambiental, Journal ofthe Urban Environment Programme of the International Development ResearchCentre, Montevideo, No. 4, pp. 36–39, 2006.Hardoy, J. and Pandiella, G. ‘Urban Poverty and Vulnerability to climate change inLatin America’ in Environment and Urbanization, Vol. 21, No. 1, pp. 203–224,2009.Hardoy, J., Mitlin, D. and Satterthwaite, D. Environmental Problems in an UrbanizingWorld: Finding Solutions for Cities in Africa, Asia and Latin America. London:Earthscan Publications, 2001.Hasan, A. Participatory Development: The Story of the Orangi Pilot Project-Researchand Training Institute and the Urban Resource Centre, Karachi. Oxford: OxfordUniversity Press, 2010.Jiménez, V. Report: Taller Vivencial de Intercambio de Experiencias Municipales enReducción de Riesgos, Caracas, Venezuela, 9 – 12 de Noviembre, 2006. Within theframework of Proyecto RLA/51467 “Fortalecimiento Regional y Reducción deRiesgos en Ciudades Mayores de la Comunidad Andina”, 2006.Kelly, P.F. ‘The politics of urban-rural relationships: land conversion in the Philippines’in Environment and Urbanization, Vol. 10, No. 1, pp. 35–54, 1998.Lavell A. La Gestión Local del Riesgo. Conceptos y prácticas. Programa Regional para laGestión del Riesgo en América Central. CEPREDENAC–PNUD, 2005.Lavell, A. ‘The Lower Lempa River Valley, El Salvador: Risk Reduction andDevelopment Project’, in Bankoff, G. et al. (eds.), Mapping Vulnerability: Disasters,development and people. London: Earthscan Publications, 2004.Lavell, A. La Red de Estudios Sociales en Prevención de Desastres en América Latina,La Red: Antecedentes, Formación y Contribución al Desarrollo de los Conceptos,Estudios y la Práctica en el tema de los Riesgos y Desastres en América Latina. Mimeo.2004.Lavell, A. Desastres Urbanos: Una Vision Global, Seminar on El Impacto de los DesastresNaturales en Areas Urbanas y en la Salud Publica Urbana en Centro America y elCaribe. ASIES, Guatemala, 2000.World Disasters Report 2010 – Focus on urban risk155
Strictly under embargo until Wednesday 22 September at 00:01 GMT (02:01 Geneva time)CHAPTER 7Lopez Follegatti, J. ‘Ilo: a city in transformation’ in Environment and Urbanization,Vol. 11, No. 2, pp. 191–202, 1999.Lungo, M. ‘Gestión de Riesgos nacional y local’, in Clarke, C. and Pineda Mannheim,C. (eds.), Riesgo y Desastres. Su Gestión Municipal en Centro América. Publicacionesespeciales sobre el Desarrollo No. 3. BID, pp.19–27, 2007.Mansilla, E. Centro América a 10 años de Mitch. Reflexiones en torno a la Reducción deRiesgo. CEPREDENAC and World Bank, 2008.Marulanda, L.M. El Biomanizales: Política Ambiental local. Documentación de laExperiencia de Gestión Ambiental Urbana de Manizales, Colombia. Instituto deEstudios de Vivienda y Desarrollo Urbano dentro del marco de implementacióndel proyecto: Apoyo para la implementación de Planes Nacionales de Acción delHabitat II (SINPA). Mimeo, 2000.Mata, J.L. and Nobre, C. Background paper: Impacts, vulnerability and adaptationto climate change in Latin America. Presented at Regional Workshop on LatinAmerican Adaptation, UNFCCC, Lima, Peru, 18–20 April 2006.Mehrotra, S. et al. Framework for Urban Climate Risk Assessment. Report prepared forthe World Bank Fifth Urban Research Symposium: Cities and Climate Change:Responding to an Urgent Agenda, Marseilles, 2009.Mejia, F.Y. Construyendo una Ciudad mas Saludable y Sostenible Ambientalmente.Estrategia Municipal para la Superacion de Condiciones de Vulnerabilidad del DistritoCentral, Capital de Honduras. ASIES, Guatemala, 2000.Menegat, R. ‘Participatory democracy and sustainable development: integratedurban environmental management in Porto Alegre, Brazil’ in Environment andUrbanization, Vol. 14, No. 2, pp. 181–206, 2002.Natenzon, C. Inundaciones catastróficas, vulnerabilidad social y adaptación en un casoargentino actual. Cambio climático, elevación del nivel medio del mar y sus implicancias.Paper submitted to Climate Change Impact and Integrated Assessment, EMFWorkshop IX, Snowmass, Colorado, 28 July–7 August 2006.Rabinovitch, J. ‘Curitiba: towards sustainable urban development’ in Environment andUrbanization, Vol. 4, No. 2, pp. 62–77, 1992.Rayos, J. Community-driven Disaster Intervention: Experiences of the Homeless People’sFederation in the Philippines. Manila and London: HPFP, PACSII and IIED, 2009.Roberts, D. ‘Thinking Globally, Acting Locally: Institutionalizing Climate Changeat the Local Government level in Durban, South Africa’, in Bicknell J., Dodman,D. and Satterthwaite, D. (eds.), Adapting Cities to Climate Change. Understandingand Addressing the Development Challenges. London: Earthscan Publications, 2009.156
Strictly under embargo until Wednesday 22 September at 00:01 GMT (02:01 Geneva time)Satterthwaite, D. et al. ‘Adapting to climate change in urban areas; the possibilitiesand constraints in low- and middle-income nations’, in Bicknell J., Dodman, D.and Satterthwaite, D. (eds.), Adapting Cities to Climate Change. Understanding andAddressing the Development Challenges. London: Earthscan Publications, 2009.United Nations Human Settlements Programme (UN-Habitat). State of the World’sCities 2010/2011 – Bridging The Urban Divide. Geneva: UN-Habitat, 2010.Velásquez, L.S. ‘The Bioplan: Decreasing poverty in Manizales, Colombia, throughshared environmental management’, in Bass, S. et al. (eds.), Reducing Poverty andSustaining the Environment. London: Earthscan Publications, 2005.Velásquez, L.S. ‘Agenda 21; a form of joint environmental management in Manizales,Colombia’ in Environment and Urbanization, Vol. 10, No. 2, pp. 9–36, 1998.von Hesse, M., Kamiche, J. and de la Torre C., Contribución temática de AméricaLatina al Informe Bienal y Evaluación Mundial Sobre la Reducción de Riesgo ISDR.GTZ-PNUD, 2008.Wang, H.G., Montoliu-Munoz, M. and Fatou D. Gueye, N. Preparing to ManageNatural Hazards and Climate Change Risks in Dakar, Senegal; A Spatial andInstitutional Approach. Pilot Study Report, 2009.World Bank. ‘Supporting Natural Disaster Reduction at the National and MunicipalLevel in Nicaragua’, in UNISDR, Global Assessment Report on Disaster RiskReduction: Risk and Poverty in a Changing Climate. Geneva: UNISDR, 2009.Zeballos Moreno, O. ‘Ocupación de laderas: incremento del riesgo por degradaciónambiental urbana en Quito, Ecuador’, in Fernández, M.A. (ed.), Ciudades en Riesgo,Degradación Ambiental, Riesgos Urbanos y Desastres. Lima: La Red, 1996.World Disasters Report 2010 – Focus on urban risk157
Strictly under embargo until Wednesday 22 September at 00:01 GMT (02:01 Geneva time)158ANNEXESDisclaimerThe data and opinions expressed in these annexes do notnecessarily represent the official policy of the InternationalFederation of Red Cross and Red Crescent Societiesor of individual National Red Cross or Red Crescent Societies.For further information regarding the figures, data and analysisprovided in Annexes 1 and 2, please contact the Centrefor Research on the Epidemiology of Disasters (CRED) andthe UN International Strategy for Disaster Reduction (UNISDR).
Strictly under embargo until Wednesday 22 September at 00:01 GMT (02:01 Geneva time)Forewarned isforearmed. Volunteersfrom NationalSocieties helpcommunities becomemore resilient todisaster risks throughactivities such ashazard mapping anddisaster preparedness.© Knud Falk/Danish RedCrossWorld Disasters Report 2010 – Disaster data159
Strictly under embargo until Wednesday 22 September at 00:01 GMT (02:01 Geneva time)According to the Centre for Research on the Epidemiology of Disasters (CRED), 351natural disasters and 225 technological disasters were reported worldwide in 2009.These two figures are both the lowest of the decade, in relation to casualties (naturaldisasters: 10,551; technological disasters: 6,707) and to the number of persons affected(natural disasters: 142 million; technological disasters: 33,000).The deadliest disaster in 2009 was an earthquake in southern Sumatra (Indonesia),which resulted in 1,117 deaths, a figure far below the major catastrophes of the decade,such as the Indian Ocean tsunami in 2004 (226,408 deaths), Cyclone Nargisin Myanmar in 2008 (138,366 deaths) or the 2008 Sichuan earthquake in China(87,476 deaths). Nevertheless, the Sumatra earthquake appears in 36th place in a rankingof disasters based on the number of persons killed. The technological disaster thatresulted in the highest number of deaths was the shipwreck of the ferry Teratai Primain Indonesia, with 247 people considered dead or missing.The disaster that resulted in the largest number of affected persons (almost 40 millionpeople affected) in 2009 was a flood in July in China. Droughts in north-eastern andeastern Africa (Ethiopia, Sudan, Kenya, Somalia, Uganda, Djibouti, Burundi) affectedalmost 20 million people. Typhoon Morakot affected more than 13 million people inChina, Taiwan and the Philippines in August, and a local storm affected 10 millionpeople in China in November. In May, Cyclone Aila affected 9 million people in Indiaand Bangladesh, and in September, Tropical Storm Ondoy (or Ketsana) affected nearly8 million people in the Philippines, Viet Nam, Lao People’s Democratic Republic andCambodia. Twelve other major natural disasters affected between 1 and 6 million peopleeach; nine of these events occurred in Asia, two in the Americas and one in Africa.All of these major disasters accounted for 90 per cent of the total number of peopleaffected by natural disasters. By comparison, technological disasters affect few people.An explosion in an ammunitions camp in Tanzania in April was the technological disasterthat affected the most people (19,366) in 2009.Natural disaster costs (US$ 41.5 billion) were the third lowest of the decade – after thelowest values of 2001 (US$ 35.5 billion) and 2006 (US$ 36.3 billion) – and representless than one-fifth of the record of 2005, when Hurricane Katrina caused damagesamounting to almost US$ 137 billion.In 2009, the costliest disaster was winter storm Klaus, which caused damages totallingUS$ 5.1 billion in France and Spain. Damages from the Aquila earthquake in Italy costUS$ 2.5 billion. Three tornadoes in the United States cost a total of US$ 6.2 billion;the earthquake in southern Sumatra caused damages amounting to US$ 2.2 billionand a flood in India in September also cost US$ 2.2 billion. Eleven other disasters160ANNEX 1Disaster data
Strictly under embargo until Wednesday 22 September at 00:01 GMT (02:01 Geneva time)(eight windstorms, one flood, one wild fire and one extreme temperature) cost morethan US$ 1 billion. These disasters accounted for 73 per cent of the total reporteddamages. By comparison, the most costly technological disaster was an explosion inan oil storage facility, which led to damages for a total amount of US$ 6.4 million inPuerto Rico.EM-DAT: A specialized disaster databaseTables 1–13 on natural and technological disasters and their human impact over thelast decade were drawn from CRED’s EM-DAT. Established in 1973 as a non-profitinstitution, CRED is based at the School of Public Health of the Catholic Universityof Louvain in Belgium and became a World Health Organization collaborating centrein 1980. Although CRED’s main focus is on public health, the centre also studies thesocio-economic and long-term effects of large-scale disasters.Since 1988, with the sponsorship of the United States Agency for International Development’sOffice of Foreign Disaster Assistance (OFDA), CRED has maintained EM-DAT, a worldwide database on disasters. It contains essential core data on the occurrenceand effects of more than 17,000 disasters in the world from 1900 to the present.The database is compiled from various sources, including United Nations (UN) agencies,non-governmental organizations, insurance companies, research institutes andpress agencies.ANNEX 1Priority is given to data from UN agencies, followed by OFDA, governments and theInternational Federation of Red Cross and Red Crescent Societies. This prioritizationis not a reflection of the quality or value of the data but the recognition that mostreporting sources do not cover all disasters or may have political limitations that couldaffect the figures. The entries are constantly reviewed for redundancies, inconsistenciesand the completion of missing data. CRED consolidates and updates data on a dailybasis. A further check is made at monthly intervals. Revisions are made annually atthe end of the calendar year. The database’s main objectives are to assist humanitarianaction at both national and international levels; to rationalize decision-making for disasterpreparedness; and to provide an objective basis for vulnerability assessment andpriority setting.Data definitions and methodologyCRED defines a disaster as “a situation or event, which overwhelms local capacity,necessitating a request to national or international level for external assistance (definitionconsidered in EM-DAT); an unforeseen and often sudden event that causes greatdamage, destruction and human suffering”. For a disaster to be entered into the database,at least one of the following criteria must be fulfilled:Ten or more people reported killed100 people or more reported affectedWorld Disasters Report 2010 – Disaster data161
Strictly under embargo until Wednesday 22 September at 00:01 GMT (02:01 Geneva time)162ANNEX 1Declaration of a state of emergencyCall for international assistance.The number of people killed includes people confirmed as dead and people missingand presumed dead. People affected are those requiring immediate assistance duringa period of emergency (i.e., requiring basic survival needs such as food, water, shelter,sanitation and immediate medical assistance). People reported injured or homeless areaggregated with those reported affected to produce a ‘total number of people affected’.The economic impact of a disaster usually consists of direct consequences on the localeconomy (e.g., damage to infrastructure, crops, housing) and indirect consequences(e.g., loss of revenues, unemployment, market destabilization). In EM-DAT, the registeredfigure corresponds to the damage value at the moment of the event and usuallyonly to the direct damage, expressed in US dollars (2009 prices).In 2007, a new natural disaster category classification was introduced in EM-DAT.This new classification was initiated by CRED and Munich Re and brought togetherCRED, Munich Re, Swiss Re, the Asian Disaster Reduction Center (ADRC) and theUN Development Programme (UNDP). The goals were to create and agree on a commonhierarchy and terminology for all global and regional databases on natural disastersand to establish a common and agreed definition of sub-events that is simple andself-explanatory.This classification is a first step in the development of a standardized international classificationof disasters. It distinguishes two generic categories for disasters (natural andtechnological), the natural disasters category being divided into five sub-groups, whichin turn cover 12 disaster types and more than 32 sub-types. The five sub-groups and12 types are as follows:Biological disasters: Insect infestations, epidemics and animal attacks (the lasttwo categories are not included in the World Disasters Report)Geophysical disasters: Earthquakes and tsunamis, volcanic eruptions, dry massmovements (avalanches, landslides, rockfalls and subsidence of geophysicalorigin)Climatological disasters: Droughts (with associated food insecurities), extremetemperatures and wildfiresHydrological disasters: Floods (including waves and surges), wet mass movements(avalanches, landslides, rockfalls and subsidence of hydrological origin)Meteorological disasters: Storms (divided into nine sub-categories).The technological disasters remain unchanged and comprise three groups:Industrial accidents: Chemical spills; collapse of industrial infrastructure; explosions;fires; gas leaks; poisoning; radiationTransport accidents: Transportation by air, rail, road or water
Strictly under embargo until Wednesday 22 September at 00:01 GMT (02:01 Geneva time)Miscellaneous accidents: Collapse of domestic / non-industrial structures; explosions;fires.In Tables 1–13, ‘disasters’ refer to disasters with a natural or a technological triggeronly, and do not include wars, conflict-related famines, diseases or epidemics. Theclassification of countries as ‘very high’, ‘high’, ‘medium’ or ‘low human development’is based on UNDP’s 2009 Human Development Index (HDI). For a small number ofcountries, which do not appear in the HDI, the World Bank’s classification of economiesby the countries’ level of income is used as reference (‘high’, ‘upper middle’ ‘lowermiddle’ and ‘low’).In both EM-DAT and the tables in this annex, data are considered at country level formany reasons, including the fact that it is at this level that they are reported most of thetime and also due to issues regarding possible aggregation and disaggregation of data.For droughts or food insecurities, which are often multi-year events, their impact overtime is taken into account.Bearing in mind that data on deaths and economic damage from drought are infrequentlyreported, CRED has adopted the following rules regarding data for droughts:The total number of deaths reported for a drought is divided by the number ofyears for which the drought persists. The resulting number is registered for eachyear of the drought’s duration.The same calculation is done for the reported economic damages.For the total number of people reported to be affected, CRED considers that thesame number is affected each year that the disaster persists.ANNEX 1Some disasters begin at the end of a year and may last some weeks or months into thefollowing year. In such case, CRED has adopted the following rules:With regard to the number of people reported affected, the total number isrecorded for both the start year and the end year.For the number of people reported killed, CRED distinguishes between suddenonsetdisasters (earthquakes, flash floods, landslides, etc.) and slow-onset disasters(wildfires, some floods, extreme temperatures, etc.) as follows:– Sudden-onset disasters – all those killed are registered according to the start yearof the disaster– Slow-onset disasters – the total of all those killed is divided by two and a half isattributed to each year of persistence.Reported economic damages are always attributed to the end year of the disaster.This is because damage is related to both the strength of a disaster and its duration.By using these rules, some data bias correction is attempted. However, they are farfrom perfect and CRED will try to improve them, as well as the database as a whole,in the future.World Disasters Report 2010 – Disaster data163
Strictly under embargo until Wednesday 22 September at 00:01 GMT (02:01 Geneva time)Key problems with disaster data include the lack of standardized collection methodologiesand definitions. The original information, collected from a variety of publicsources, is not specifically gathered for statistical purposes. So, even when the compilationapplies strict definitions for disaster events and parameters, the original suppliersof information may not. Moreover, data are not always complete for each disaster. Thequality of completion may vary according to the type of disaster (for example, thenumber of people affected by transport accidents is rarely reported) or its country ofoccurrence.Data on deaths are usually available because they are an immediate proxy for the severityof the disaster. However, the numbers put forward immediately after a disaster maysometimes be seriously revised, occasionally several months later.Data on the number of people affected by a disaster can provide some of the mostpotentially useful figures, for planning both disaster preparedness and response, butthey are sometimes poorly reported. Moreover, the definition of people affectedremains open to interpretation, political or otherwise. Even in the absence of manipulation,data may be extrapolated from old census information, with assumptions beingmade about percentages of an area’s population affected.Data can also be skewed because of the rationale behind data gathering. Reinsurancecompanies, for instance, systematically gather data on disaster occurrence in order toassess insurance risk, but with a priority in areas of the world where disaster insuranceis widespread. Their data may therefore miss out poor, disaster-affected regions whereinsurance is unaffordable or unavailable.For natural disasters over the last decade, data on deaths are missing for around onetenthof reported disasters; data on people affected are missing for around one-fifthof disasters; and data on economic damages are missing for 67 per cent of disasters.The figures should therefore be regarded as indicative. Relative changes and trends aremore useful to look at than absolute, isolated figures.Dates can be a source of ambiguity. For example, a declared date for a famine is bothnecessary and meaningless – a famine does not occur on a single day. In such cases,the date the appropriate body declares an official emergency has been used. Changesin national boundaries cause ambiguities in the data and may make long-term trendanalysis more complicated.However, in some cases, available data may differ greatly according to sources, be moreor less documented estimations and / or subject to controversies. In these cases, CREDalways compiles all available data or analysis to try to make its own documented estimation,which can be revised when more accurate data are provided.164ANNEX 1Caveats
Strictly under embargo until Wednesday 22 September at 00:01 GMT (02:01 Geneva time)Information systems have improved vastly in the last 25 years and statistical data arenow more easily available, intensified by an increasing sensitivity to disaster occurrenceand consequences. Nevertheless there are still discrepancies. An analysis of the qualityand accuracy of disaster data, performed by CRED in 2002, showed that occasionally,for the same disaster, differences of more than 20 per cent may exist between thequantitative data reported by the three major databases – EM-DAT (CRED), NatCat(Munich Re) and Sigma (Swiss Re).Despite efforts to verify and review data, the quality of disaster databases can only beas good as the reporting system. This, combined with the different aims of the threemajor disaster databases (risk and economic risk analysis for reinsurance companies,development agenda for CRED), may explain differences between data provided forsome disasters. However, in spite of these differences, the overall trends indicated bythe three databases remain similar.The lack of systematization and standardization of data collection is a major weaknesswhen it comes to long-term planning. Fortunately, due to increased pressuresfor accountability from various sources, many donors and development agencies havestarted paying attention to data collection and its methodologies.Part of the solution to this data problem lies in retrospective analysis. Data are mostoften publicly quoted and reported during a disaster event, but it is only long afterthe event, once the relief operation is over, that estimates of damage and death can beverified. Some data gatherers, like CRED, revisit the data; this accounts for retrospectiveannual disaster figures changing one, two and sometimes even three years after theevent.ANNEX 1Philippe Hoyois, senior research fellow with CRED, Regina Below, manager of CRED’sEM-DAT disaster database, and Debarati Guha-Sapir, director of CRED, preparedthe statistics annex. For further information, please contact: Centre for Research on theEpidemiology of Disasters (CRED), School of Public Health, Catholic University ofLouvain, 30.94, Clos Chapelle-aux-Champs, 1200 Brussels, Belgium, tel.: +32 2 7643327, fax: +32 2 764 3441, e-mail: contact@emdat.be, web site: www.emdat.beWorld Disasters Report 2010 – Disaster data165
Strictly under embargo until Wednesday 22 September at 00:01 GMT (02:01 Geneva time)166ANNEX 1Table 1 Total number of reported disasters, 1 by continent, by year and by level of human development (2000 to 2009)2000 2001 2002 2003 2004 2005 2006 2007 2008 2009 Total 2Africa 202 184 197 170 164 170 200 181 168 146 1,782Americas 151 134 156 126 137 139 103 133 144 111 1,334Asia 303 295 310 294 318 359 304 257 238 225 2,903Europe 130 96 115 96 98 127 98 104 57 75 996Oceania 13 18 19 20 22 16 18 11 13 19 169Very high humandevelopment131 114 132 115 106 111 98 95 85 78 1,065High human development 156 125 143 124 149 145 109 132 99 107 1,289Medium humandevelopment454 415 450 399 422 468 420 365 362 318 4,073Low human development 58 73 72 68 62 87 96 94 74 73 757Total 799 727 797 706 739 811 723 686 620 576 7,184Source: EM-DAT, CRED, University of Louvain, Belgium1In Tables 1–13,’disasters’ refer to those with a natural and/or technologicaltrigger only, and do not include wars, conflict-related famines, diseases orepidemics.2Since slow-onset disasters can affect the same country over a number of years,it is best to use figures on total numbers to calculate annual averages over adecade rather than as absolute totals (see the methodology <strong>chapter</strong> of thisannex).See note on UNDP’s Human Development Index country status in the section ondisaster definitions in the introduction to this annex.With 576 disasters, 2009 is the year with the lowest number of disasters of thedecade, far below the peaks of 2000, 2002 and 2005.Among continents, Africa and Asia experienced their smallest number ofdisasters of the decade. In the Americas and in Europe, this number was thesecond lowest of the last ten years.In 2009, the number of disasters for Oceania was the third highest of thedecade.Numbers of disasters were at their lowest level in 2009 in countries with veryhigh human development and medium human development, and near theirlowest level in countries with high human development. On the other hand, thisnumber remained proportionaly high in countries with low human development.With 39 per cent of all disasters, Asia remains the most frequently hit continentand is, in 2009, just below its decade’s average of 40 per cent.
Strictly under embargo until Wednesday 22 September at 00:01 GMT (02:01 Geneva time)Table 2 Total number of people reported killed, by continent, by year and by level of human development (2000 to 2009)2000 2001 2002 2003 2004 2005 2006 2007 2008 2009 TotalAfrica 5,392 4,520 7,639 6,160 4,246 3,184 5,789 3,695 3,039 3,142 46,806Americas 2,066 3,077 2,108 2,082 8,437 5,438 1,558 2,921 2,730 2,160 32,577Asia 88,056 105,960 89,427 39,030 238,404 90,796 20,634 15,581 235,618 9,744 933,250Europe 1,622 2,338 1,810 73,373 1,259 1,044 5,837 1,665 787 1,319 91,054Oceania 205 9 91 64 35 46 24 273 25 893 1,665Very high humandevelopment1,518 1,433 1,431 72,889 1,102 2,925 4,152 1,017 883 2,090 89,440High human development 2,478 2,905 2,843 2,983 2,572 1,961 2,707 3,182 1,589 2,804 26,024Medium humandevelopment15,049 33,643 16,085 43,446 247,165 93,414 24,318 17,391 237,373 11,000 738,884Low human development 78,296 77,923 80,716 1,391 1,542 2,208 2,665 2,545 2,354 1,364 251,004Total 97,341 115,904 101,075 120,709 252,381 100,508 33,842 24,135 242,199 17,258 1,105,352Source: EM-DAT, CRED, University of Louvain, BelgiumSee note on UNDP’s Human Development Index country status in the section ondisaster definitions in the introduction to this annex.In 2009 the number of people reported killed was the lowest of the decade, farbelow the decade’s average of 110,535.On the other hand, in Oceania, the number of people killed largely surpassedits peaks of 2000 and 2007.In 2009, 56 per cent of people killed by disasters lived in Asia, far below thedecade’s average of 84 per cent.Inversely the proportions of people killed in Africa (18 per cent), in the Americas(13 per cent) and in Oceania (5 per cent) were significantly higher than theirdecade’s average (4, 3 and 0.2 per cent, respectively).The number of people reported dead was also the lowest of the decade incountries of medium and low human development.The deadliest disaster in 2009 was an earthquake in southern Sumatra(Indonesia), which caused 1,117 deaths. This figure is far below the deathtolls caused by the Indian Ocean tsunami in 2004 (226,408 deaths), CycloneNargis in Myanmar in 2008 (138,366 deaths) and earthquakes in Sichuan,China in 2008 (87,476 deaths), Kashmir in 2005 (73,338 deaths) Bam, Iranin 2003 (26,796 deaths) and Gujurat, India in 2001 (20,005 deaths).ANNEX 1World Disasters Report 2010 – Disaster data167
Strictly under embargo until Wednesday 22 September at 00:01 GMT (02:01 Geneva time)168ANNEX 1Table 3 Total number of people reported affected, by continent, by year and by level of human development(2000 to 2009), in thousands2000 2001 2002 2003 2004 2005 2006 2007 2008 2009 Total 1Africa 46,000 45,545 44,601 29,266 36,902 22,856 22,965 12,526 21,465 24,468 306,595Americas 975 10,913 2,517 3,995 9,698 8,308 1,450 9,119 20,410 5,776 73,161Asia 206,644 186,203 663,070 235,689 132,290 129,716 119,660 192,185 182,465 111,793 2,159,715Europe 2,929 787 1,493 1,546 538 527 260 1,651 268 146 10,144Oceania 7 31 41 38 119 28 38 172 105 77 658Very high humandevelopment781 1,238 1,006 575 5,560 1,176 142 1,176 13,489 2,470 27,613High human development 911 8,162 2,675 4,633 4,024 6,878 1,400 8,037 5,495 2,591 44,806Medium humandevelopment228,503 206,084 680,839 242,503 155,556 135,414 122,889 195,814 190,231 123,149 2,280,981Low human development 26,361 27,996 27,203 22,822 14,406 17,968 19,942 10,625 15,499 14,050 196,872Total 256,556 243,480 711,722 270,533 179,546 161,436 144,373 215,652 224,714 142,260 2,550,272Source: EM-DAT, CRED, University of Louvain, Belgium1Since slow-onset disasters can affect the same people a number of years, it isbest to use figures on total numbers affected to calculate annual averages overa decade rather than as absolute totals.See note on UNDP’s Human Development Index country status in the section ondisaster definitions in the introduction to this annex.In 2009, the number of 142 million people affected by disasters was the lowestof the decade, far below the annual average of 255 million people affected.In Asia and Europe, the number of people affected was, in 2009, the lowest ofthe decade.In 2009, the number of people affected living in countries of low humandevelopment and of medium human development was the second lowest of thedecade.Three major disasters, affecting more than 10 million people, occurred in China:floods in July (almost 40 million people affected) and two windstorms in Augustand November (11 and 10 million people affected, respectively).
Strictly under embargo until Wednesday 22 September at 00:01 GMT (02:01 Geneva time)Table 4 Total amount of disaster estimated damage, by continent, by year and by level of human development(2000 to 2009) – in millions of US dollars (2009 prices)2000 2001 2002 2003 2004 2005 2006 2007 2008 2009 TotalAfrica 1,243 805 436 6,455 1,908 38 244 782 863 173 12,947Americas 6,800 15,946 15,386 25,085 74,679 189,370 7,226 16,625 64,162 13,337 428,616Asia 27,108 15,687 15,855 27,630 75,332 30,494 24,873 35,747 117,927 15,449 386,102Europe 22,176 2,395 40,283 21,415 2,072 17,261 2,584 22,796 4,644 10,789 146,414Oceania 668 696 2,601 691 627 241 1,368 1,488 2,506 1,726 12,612Very high humandevelopment39,272 16,087 60,332 50,959 122,083 192,144 11,694 46,461 64,178 24,655 627,865High human development 2,259 3,952 3,328 2,907 7,058 14,607 2,041 11,564 6,360 2,412 56,488Medium humandevelopment8,370 15,421 10,842 27,178 24,878 30,641 22,557 18,922 119,537 14,234 292,579Low human development 8,094 69 60 233 600 12 3 489 27 173 9,760Total 57,995 35,528 74,561 81,277 154,619 237,404 36,295 77,436 190,102 41,474 986,691Source: EM-DAT, CRED, University of Louvain, BelgiumSee note on UNDP’s Human Development Index country status in the section ondisaster definitions in the introduction to this annex.As mentioned in the introduction, damage assessment is frequently unreliable.Even for the existing data, the methodologies are not standardized and thefinancial coverage can vary significantly.Depending on where the disaster occurs and who reports it, estimations mayvary from zero to billions of US dollars. The total amount of damage reported in2009 was the third lowest of the decade, after 2001 and 2006.Inversely, in Oceania, the amount of damages was the third highest of thedecade, after 2002 and 2008.In 2009, Europe accounted for 26 per cent of damage, above its 15 per centaverage of the decade.Very high human development countries experienced 59 per cent of damage in2009, compared to 64 per cent for the entire decade.Inversely, the contribution of medium human development countries to thetotal amount of damages climbed to 34 per cent, up from 30 per cent for thedecade.Windstorm Klaus, in France, was the costliest disaster in 2009 (more than US$3 billion reported damages), but it appears only at the 51st place in the rankingof the most expensive disasters.ANNEX 1World Disasters Report 2010 – Disaster data169
Strictly under embargo until Wednesday 22 September at 00:01 GMT (02:01 Geneva time)170ANNEX 1Table 5 Total number of reported disasters, by type of phenomenon and by year (2000 to 2009)2000 2001 2002 2003 2004 2005 2006 2007 2008 2009 Total 1Droughts / food insecurity 43 43 40 23 19 28 20 14 20 23 273Earthquakes / tsunamis 31 25 37 40 42 25 24 21 23 22 290Extreme temperatures 31 23 15 26 19 29 32 25 11 26 237Floods 2 158 157 171 160 132 195 229 218 169 150 1,739Forest / scrub fires 30 14 22 14 8 13 9 18 5 9 142Insect infestation 2 2 n.d.r. n.d.r. 12 n.d.r. n.d.r. n.d.r. n.d.r. 1 17Mass movement: dry 3 1 n.d.r. 1 n.d.r. 1 n.d.r. 1 n.d.r. 3 1 8Mass movement: wet 4 28 24 20 21 15 12 20 10 12 31 193Volcanic eruptions 5 6 7 2 5 8 12 6 7 3 61Windstorms 102 108 124 86 127 130 76 105 111 85 1,054Subtotal climato-, hydro- &meteorological disastersSubtotal geophysicaldisasters394 371 392 330 332 407 386 390 328 325 3,65537 31 45 42 48 33 37 27 33 26 359Total natural disasters 431 402 437 372 380 440 423 417 361 351 4,014Industrial accidents 51 54 48 52 81 76 62 52 38 43 557Miscellaneous accidents 58 50 52 45 62 66 33 43 30 27 466Transport accidents 259 221 260 237 216 229 205 174 191 155 2,147Total technologicaldisasters368 325 360 334 359 371 300 269 259 225 3,170Total 799 727 797 706 739 811 723 686 620 576 7,1841Since slow-onset disasters can affect the same country over a number of years,it is best to use figures on total numbers to calculate annual averages over adecade rather than as absolute totals (see the methodology <strong>chapter</strong> of thisannex).2Includes waves and surges.3Landslides, rockfalls, subsidence of geophysical origin.4Landslides, avalanches, subsidence of hydrological origin.Note: ’n.d.r.’ denotes ‘no disaster reported’.In 2009, the number of both natural and technological disasters was the lowestof the decade, far below their peak of 2005.Among natural disasters, the most frequent were floods (43 per cent),in a proportion equal to the decade’s average (also 43 per cent).Extreme temperatures (7 per cent) and mass movements of hydrological origin(9 per cent) surpassed their decade’s average (6 and 5 per cent, respectively).All other natural disasters were sligthly below their decade’s average.Among technological disasters, transport accidents were the most frequent, buttheir number was the lowest of the decade.The number of miscellaneous accidents was also the lowest of the decade.
Strictly under embargo until Wednesday 22 September at 00:01 GMT (02:01 Geneva time)Table 6 Total number of people reported killed, by type of phenomenon and by year (2000 to 2009)2000 2001 2002 2003 2004 2005 2006 2007 2008 2009 TotalDroughts / food insecurity 76,379 76,476 76,903 38 80 88 208 n.a. 6 3 230,181Earthquakes / tsunamis 216 21,348 1,636 29,617 227,290 76,241 6,692 780 87,918 1,815 453,553Extreme temperatures 941 1,787 3,019 74,748 556 814 5,104 1,044 1,608 1,122 90,743Floods 1 6,025 5,014 4,236 3,772 7,100 5,764 5,863 8,565 4,037 3,419 53,795Forest / scrub fires 47 33 6 47 14 50 13 150 86 190 636Insect infestation n.a. n.a. n.d.r. n.d.r. n.a. n.d.r. n.d.r. n.d.r. n.d.r. n.a. n.a.Mass movement: dry 2 11 n.d.r. 60 n.d.r. 44 n.d.r. 11 n.d.r. 120 36 282Mass movement: wet 3 1,012 786 1,089 706 313 646 1,638 271 504 658 7,623Volcanic eruptions n.a. n.a. 200 n.a. 2 3 5 11 9 n.a. 230Windstorms 1,354 1,914 1,475 1,031 6,653 5,250 4,329 6,035 140,985 3,308 172,334Subtotal climato-, hydro- &meteorological disastersSubtotal geophysicaldisasters85,758 86,010 86,728 80,342 14,716 12,612 17,155 16,065 147,226 8,700 555,312227 21,348 1,896 29,617 227,336 76,244 6,708 791 88,047 1,851 454,065Total natural disasters 85,985 107,358 88,624 109,959 242,052 88,856 23,863 16,856 235,273 10,551 1,009,377Industrial accidents 1,807 1,279 1,112 1,444 1,797 2,281 1,832 1,656 776 933 14,917Miscellaneous accidents 1,341 1,341 2,013 1,438 2,115 2,669 1,126 909 895 916 14,763Transport accidents 8,208 5,926 9,326 7,868 6,417 6,702 7,021 4,714 5,255 4,858 66,295Total technologicaldisasters11,356 8,546 12,451 10,750 10,329 11,652 9,979 7,279 6,926 6,707 95,975Total 97,341 115,904 101,075 120,709 252,381 100,508 33,842 24,135 242,199 17,258 1,105,352Source: EM-DAT, CRED, University of Louvain, Belgium1Includes waves and surges.2Landslides, rockfalls, subsidence of geophysical origin.3Landslides, avalanches, subsidence of hydrological origin.Note: ’n.a.’ denotes ’no data available’; ’n.d.r.’ signifies ‘no disaster reported’.For more information, see section on caveats in introductory text.In 2009, deaths from both natural and technological disasters were at theirlowest level for the entire decade.Among natural disasters, the number of deaths from floods is the lowest of thedecade, but in proportion (32 per cent), it surpasses its 5 per cent decennialaverage.Conversely, forest / scrub fires resulted in the highest number and proportionof deaths.Deaths from industrial and transport accidents were the second lowest of thedecade; deaths from miscellaneous accidents, the third lowest.Most reported deaths caused by droughts and food insecurity during the decadewere attributable to the famine in the Democratic People’s Republic of Korea,although the estimates provided are disputed (see caveats in the introductorytext).ANNEX 1World Disasters Report 2010 – Disaster data171
Strictly under embargo until Wednesday 22 September at 00:01 GMT (02:01 Geneva time)172ANNEX 1Table 7 Total number of people reported affected, by type of phenomenon and by year (2000 to 2009), in thousands2000 2001 2002 2003 2004 2005 2006 2007 2008 2009 Total 1Droughts / food insecurity 164,579 166,772 428,879 81,842 35,272 30,643 41,971 9,578 36,411 29,498 1,025,446Earthquakes / tsunamis 2,479 9,711 851 4,194 3,147 6,187 3,859 1,382 47,580 3,221 82,612Extreme temperatures 28 213 104 1,890 2,140 2 63 988 79,172 1,050 85,651Floods 2 73,905 34,552 167,769 169,515 117,212 75,028 30,383 177,836 45,660 57,253 949,112Forest / scrub fires 39 6 26 184 21 7 2 1,785 59 12 2,140Insect infestation n.a. n.a. n.d.r. n.d.r. n.a. n.d.r. n.d.r. n.d.r. n.d.r. 500 500Mass movement: dry 3 n.a. n.d.r. n.a. n.d.r. n.a. n.d.r. n.a. n.d.r. 1 3 4Mass movement: wet 4 215 71 305 459 12 10 432 9 5 52 1,570Volcanic eruptions 127 110 278 25 53 341 379 51 136 57 1,556Windstorms 15,137 31,991 113,441 11,758 21,383 49,117 67,109 23,974 15,651 50,583 400,144Subtotal climato-, hydro- &meteorological disastersSubtotal geophysicaldisasters253,902 233,605 710,524 265,647 176,039 154,808 139,960 214,170 176,958 138,947 2,464,5622,605 9,822 1,130 4,219 3,200 6,528 4,237 1,433 47,717 3,280 84,172Total natural disasters 256,508 243,426 711,654 269,867 179,239 161,336 144,198 215,604 224,675 142,227 2,548,734Industrial accidents 17 19 2 646 157 16 137 3 14 6 1,017Miscellaneous accidents 24 31 61 15 102 77 35 41 21 23 430Transport accidents 7 3 6 5 48 6 4 4 4 4 91Total technologicaldisasters48 53 68 667 307 100 175 48 39 33 1,538Total 256,556 243,480 711,722 270,533 179,546 161,436 144,373 215,652 224,714 142,260 2,550,272Source: EM-DAT, CRED, University of Louvain, Belgium1Since slow-onset disasters can affect the same people over a number of years,it is best to use figures on total numbers affected to calculate annual averagesover a decade rather than as absolute totals.2Includes waves and surges.3Landslides, rockfalls, subsidence of geophysical origin.4Landslides, avalanches, subsidence of hydrological origin.Note: ’n.a.’ denotes ’no data available’; ’n.d.r.’ denotes ’no disaster reported’.For more information, see section on caveats in introductory text.In 2009, for both natural and technological disasters, the numbers of peopleaffected were at their lowest level for the decade.Disasters which affected the most people in 2009 were floods (57 millionpeople affected: 40 per cent of those affected by disasters).Windstorms (50 million people affected) accounted for 36 per cent of thoseaffected by disasters, far above their annual average (16 per cent).In Liberia, 500,000 people were affected by an insect infestation.
Strictly under embargo until Wednesday 22 September at 00:01 GMT (02:01 Geneva time)Table 8 Total amount of disaster estimated damage, by type of phenomenon and by year (2000 to 2009) – in millions of USdollars (2009 prices)2000 2001 2002 2003 2004 2005 2006 2007 2008 2009 TotalDroughts / food insecurity 5,107 2,787 9,884 863 1,700 2,149 3,337 524 216 245 26,811Earthquakes / tsunamis 514 8,920 2,466 9,622 43,844 7,366 3,652 15,492 85,491 6,059 183,425Extreme temperatures 461 242 n.a. 14,598 n.a. 439 1,064 n.a. 21,862 1,131 39,798Floods 1 32,148 5,757 31,990 24,152 11,965 19,707 8,307 25,181 19,655 7,723 186,584Forest / scrub fires 3,188 109 432 7,107 3 4,226 893 4,757 2,421 1,515 24,651Insect infestation 150 n.a. n.d.r. n.d.r. n.a. n.d.r. n.d.r. n.d.r. n.d.r. n.a. 150Mass movement: dry 2 n.a. n.d.r. n.a. n.d.r. n.a. n.d.r. n.a. n.d.r. n.a. n.a. n.a.Mass movement: wet 3 576 86 230 61 4 60 43 n.a. n.a. 154 1,212Volcanic eruptions 3 20 11 n.a. n.a. n.a. 160 n.a. n.a. n.a. 193Windstorms 15,523 17,589 17,597 24,874 95,616 202,996 18,839 30,584 60,457 24,641 508,717Subtotal climato-, hydro- &meteorological disastersSubtotal geophysicaldisasters57,152 26,570 60,132 71,655 109,289 229,577 32,482 61,045 104,612 35,409 787,923517 8,940 2,477 9,622 43,844 7,366 3,811 15,492 85,491 6,059 183,618Total natural disasters 57,669 35,510 62,609 81,277 153,133 236,943 36,293 76,537 190,102 41,468 971,541Industrial accidents n.a. 12 11,878 n.a. 1,022 450 n.a. 899 n.a. 6 14,268Miscellaneous accidents 326 6 74 n.a. n.a. 11 1 n.a. n.a. n.a. 418Transport accidents n.a. n.a. n.a. n.a. 463 n.a. n.a. n.a. n.a. n.a. 463Total technologicaldisasters326 18 11,952 n.a. 1,486 462 1 899 n.a. 6 15,150Total 57,995 35,528 74,561 81,277 154,619 237,404 36,295 77,436 190,102 41,474 986,691Source: EM-DAT, CRED, University of Louvain, Belgium1Includes waves and surges.2Landslides, rockfalls, subsidence of geophysical origin.3Landslides, avalanches, subsidence of hydrological origin.Note: ’n.a.’ denotes ‘no data available’; ’n.d.r.’ denotes ‘no disaster reported’.For more information, see section on caveats in introductory text.Estimates of disaster damage must be treated with caution, as the financialvalue attached to infrastructures in developed countries is much higher thanin developing countries. While reporting is better for large disasters, the lowreporting rates of direct damage make analysis difficult.The costliest disasters of the decade were windstorms (51.6 per cent), floods(19 per cent) and earthquakes / tsunamis (18.5 per cent).In 2009, hydrometeorological disasters accounted for 85 per cent of reporteddamages, with windstorms accounting for 59 per cent.Damages reported for droughts and floods were the second lowest of thedecade.The proportion of damages attributable, in 2009, to windstorms (59 per centof reported damages) was higher than their decennial average (52 per cent).ANNEX 1World Disasters Report 2010 – Disaster data173
Strictly under embargo until Wednesday 22 September at 00:01 GMT (02:01 Geneva time)174ANNEX 1Table 9 Total number of reported disasters, by type of phenomenon, by continent and by level of human development 1(2000 to 2009)Africa Americas Asia Europe Oceania VHHD HHD MHD LHD TotalDroughts / food insecurity 126 57 73 15 2 15 29 154 75 273Earthquakes / tsunamis 24 43 173 39 11 38 55 177 20 290Extreme temperatures 5 40 60 130 2 72 91 70 4 237Floods 2 421 356 655 259 48 236 372 870 261 1,739Forest / scrub fires 13 53 14 52 10 77 37 23 5 142Insect infestation 12 1 1 1 2 2 2 6 7 17Mass movement: dry 3 1 3 3 n.d.r. 1 n.d.r. 2 6 n.d.r. 8Mass movement: wet 4 13 38 122 14 6 8 40 137 8 193Volcanic eruptions 7 23 19 1 11 4 18 35 4 61Windstorms 94 329 416 150 65 366 159 489 40 1,054Subtotal climato-, hydro- &meteorological disastersSubtotal geophysicaldisasters684 874 1,341 621 135 776 730 1,749 400 3,65532 69 195 40 23 42 75 218 24 359Total natural disasters 716 943 1,536 661 158 818 805 1,967 424 4,014Industrial accidents 68 23 414 52 n.d.r. 22 51 454 30 557Miscellaneous accidents 114 66 212 72 2 56 91 283 36 466Transport accidents 884 302 741 211 9 169 342 1,369 267 2,147Total technologicaldisasters1,066 391 1,367 335 11 247 484 2,106 333 3,170Total 1,782 1,334 2,903 996 169 1,065 1,289 4,073 757 7,184Source: EM-DAT, CRED, University of Louvain, Belgium
Strictly under embargo until Wednesday 22 September at 00:01 GMT (02:01 Geneva time)1VHHD stands for very high human development, HHD stands for high humandevelopment, MHD for medium human development and LHD for low humandevelopment.See note on UNDP’s Human Development Index country status in the section ondisaster definitions in the introduction to this annex.2Includes waves and surges.3Landslides, rockfalls, subsidence of geophysical origin.4Landslides, avalanches, subsidence of hydrological origin.Note: ’n.a.’ signifies ’no data available’; ’n.d.r.’ signifies ’no disaster reported’.For more information, see section on caveats in introductory text.During the decade:Asia accounted for 40 per cent of the total number of disasters but for 74 percent of industrial accidents, 63 per cent of mass movements of hydrologicalorigin, 60 per cent of earthquakes / tsunamis and 45 per cent of miscellaneousaccidents.Africa accounted for 25 per cent of the total number of disasters but for 71 percent of insect infestations, 46 per cent of droughts / food insecurity events and41 per cent of transport accidents.Americas accounted for 19 per cent of the total number of disasters but for38 per cent of volcanic eruptions 37 per cent of wild fires and 31 per centof windstorms.Europe accounted for 14 per cent of the total number of disasters but for 55 percent of extreme temperatures and for 37 per cent of wild fires.Oceania accounted for 2 per cent of the total number of disasters but for 18 percent of volcanic eruptions, 7 per cent of wild fires and 6 per cent of windstorms.ANNEX 1World Disasters Report 2010 – Disaster data175
Strictly under embargo until Wednesday 22 September at 00:01 GMT (02:01 Geneva time)176ANNEX 1Table 10 Total number of people reported killed, by type of phenomenon, by continent and by level of human development 1(2000 to 2009)Africa Americas Asia Europe Oceania VHHD HHD MHD LHD TotalDroughts / food insecurity 1,069 54 229,056 2 n.a. n.a. n.a. 728 229,453 230,181Earthquakes / tsunamis 3,335 2,047 447,320 601 250 420 1,252 450,244 1,637 453,553Extreme temperatures 125 1,406 8,738 80,127 347 75,801 5,278 7,999 1,665 90,743Floods 2 7,934 7,662 36,856 1,250 93 1,017 4,250 42,341 6,187 53,795Forest / scrub fires 154 73 3 200 206 424 50 112 50 636Insect infestation n.a. n.a. n.a. n.a. n.a. n.a. n.a. n.a. n.a. n.a.Mass movement: dry 3 98 108 66 n.d.r. 10 n.d.r. 72 210 n.d.r. 282Mass movement: wet 4 202 1,041 6,068 229 83 96 981 6,436 110 7,623Volcanic eruptions 206 16 8 n.a. n.a. n.a. 14 11 205 230Windstorms 1,273 9,998 160,242 521 300 5,758 788 165,240 548 172,334Subtotal climato-, hydro- &meteorological disastersSubtotal geophysicaldisasters10,757 20,234 440,963 82,329 1,029 83,096 11,347 222,856 238,013 555,3123,639 2,171 447,394 601 260 420 1,338 450,465 1,842 454,065Total natural disasters 14,396 22,405 888,357 82,930 1,289 83,516 12,685 673,321 239,855 1,009,377Industrial accidents 2,576 382 10,915 1,044 n.d.r. 177 1,021 12,807 912 14,917Miscellaneous accidents 3,361 2,302 7,524 1,540 36 1,205 3,199 9,679 680 14,763Transport accidents 26,473 7,488 26,454 5,540 340 4,542 9,119 43,077 9,557 66,295Total technologicaldisasters32,410 10,172 44,893 8,124 376 5,924 13,339 65,563 11,149 95,975Total 46,806 32,577 933,250 91,054 1,665 89,440 26,024 738,884 251,004 1,105,352Source: EM-DAT, CRED, University of Louvain, Belgium
Strictly under embargo until Wednesday 22 September at 00:01 GMT (02:01 Geneva time)1VHHD stands for very high human development, HHD stands for high humandevelopment, MHD for medium human development and LHD for low humandevelopment.See note on UNDP’s Human Development Index country status in the section ondisaster definitions in the introduction to this <strong>chapter</strong>annex.2Includes waves and surges.3Landslides, rockfalls, subsidence of geophysical origin.4Landslides, avalanches, subsidence of hydrological origin.Note: ’n.a.’ signifies ’no data available’; ’n.d.r.’ signifies ’no disaster reported’.For more information, see section on caveats in introductory text.During the decade:Medium human development countries accounted for 67 per cent of the totalnumber of reported deaths but for almost all deaths from earthquakes, 96 percent of deaths due to windstorms, 86 per cent of those caused by industrialaccidents and 79 per cent of deaths from floods.Low human development countries accounted for 23 per cent of the totalnumber of reported deaths but almost all deaths were caused by droughts / foodinsecurity and 89 per cent of deaths following a volcanic eruption.Very high human development countries accounted for 8 per cent of the totalnumber of reported deaths, but for 67 per cent of deaths from wild fires.High human development countries accounted for 2 per cent of the total numberof reported deaths but for 22 per cent of deaths from miscellaneous accidentsand for 14 per cent of those from transport accidents.ANNEX 1World Disasters Report 2010 – Disaster data177
Strictly under embargo until Wednesday 22 September at 00:01 GMT (02:01 Geneva time)178ANNEX 1Table 11 Total number of people reported affected, by type of phenomenon, by continent and by level of human development 1(2000 to 2009), in thousandsAfrica Americas Asia Europe Oceania VHHD HHD MHD LHD TotalDroughts / food insecurity 276,890 7,308 739,975 1,273 n.a. n.a. 3,260 846,128 176,059 1,025,446Earthquakes / tsunamis 387 3,092 78,380 731 23 296 2,093 79,969 255 82,612Extreme temperatures n.a. 4,944 80,596 107 2 6 4,964 80,309 371 85,650Floods 2 23,596 29,245 892,535 3,570 167 13,330 16,561 901,380 17,841 949,112Forest / scrub fires 11 942 6 1,163 18 981 1,004 151 5 2,140Insect infestation 500 n.a. n.a. n.a. n.a. n.a. n.a. n.a. 500 500Mass movement: dry 3 1 3 n.a. n.d.r. n.a. n.d.r. n.a. 4 n.d.r. 4Mass movement: wet 4 16 187 1,352 3 11 2 178 1,076 313 1,570Volcanic eruptions 405 691 391 n.a. 69 16 688 730 121 1,556Windstorms 4,455 26,162 365,913 3,247 368 12,914 15,480 370,505 1,245 400,144Subtotal climato-, hydro- &meteorological disastersSubtotal geophysicaldisasters305,467 68,787 2,080,378 9,364 566 27,233 41,446 2,199,549 196,333 2,464,561793 3,786 78,771 731 92 312 2,781 80,703 376 84,172Total natural disasters 306,259 72,573 2,159,149 10,094 657 27,545 44,227 2,280,252 196,710 2,548,733Industrial accidents 104 566 325 23 n.d.r. 49 553 319 96 1,017Miscellaneous accidents 215 12 179 24 n.a. 10 20 382 18 430Transport accidents 16 10 61 4 n.a. 8 6 28 49 91Total technologicaldisasters335 587 566 50 n.a. 68 579 729 162 1,538Total 306,595 73,161 2159715 10,144 658 27,613 44,806 2,280,981 196,872 2,550,272Source: EM-DAT, CRED, University of Louvain, Belgium
Strictly under embargo until Wednesday 22 September at 00:01 GMT (02:01 Geneva time)1VHHD stands for very high human development, HHD stands for high humandevelopment, MHD for medium human development and LHD for low humandevelopment.See note on UNDP’s Human Development Index country status in the section ondisaster definitions in the introduction to this annex.2Includes waves and surges.3Landslides, rockfalls, subsidence of geophysical origin.4Landslides, avalanches, subsidence of hydrological origin.Note: ’n.a.’ signifies ’no data available’; ’n.d.r.’ signifies ’no disaster reported’.For more information, see section on caveats in introductory text.During the decade:Medium human development countries accounted for almost 89 per cent ofthe total number of people reported affected by disasters but for 97 per centof those affected by earthquakes / tsunamis, 95 per cent of people affected byfloods, 94 per cent of those affected by extreme temperature and 93 per centof those affected by windstorms.Low human development countries accounted for almost 8 per cent of thetotal number of people reported affected by disasters but for 54 per cent ofthose affected by transport accidents and 21 per cent of people affected bydroughts / food insecurities.High human development countries for 2 per cent of the total number of peoplereported affected by disasters but for 54 per cent of those affected by industrialaccidents, 47 per cent of those affected by wild fires and 44 per cent of peopleaffected by volcanic eruptions.Very high human development countries countries for 1 per cent of the totalnumber of people reported affected by disasters but for 46 per cent of thoseaffected by wild fires.ANNEX 1World Disasters Report 2010 – Disaster data179
Strictly under embargo until Wednesday 22 September at 00:01 GMT (02:01 Geneva time)180ANNEX 1Table 12 Total amount of disaster estimated damage, by type of phenomenon, by continent and by level of humandevelopment 1 (2000 to 2009) – in millions of US dollars (2009 prices)Africa Americas Asia Europe Oceania VHHD HHD MHD LHD TotalDroughts / food insecurity 737 8,113 11,937 3,639 2,385 9,458 4,180 13,173 n.a. 26,811Earthquakes / tsunamis 6,574 6,656 164,456 5,579 160 56,018 2,818 124,468 121 183,425Extreme temperatures 1 1,112 22,359 16,083 242 15,742 1,590 22,466 n.a. 39,798Floods 2 3,474 28,159 85,477 64,601 4,873 91,067 17,880 75,982 1,655 186,584Forest / scrub fires 441 13,420 15 8,810 1,966 23,982 182 487 n.a. 24,651Insect infestation n.a. n.a. n.a. n.a. 150 150 n.a. n.a. n.a. 150Mass movement: dry 3 n.a. n.a. n.a. n.d.r. n.a. n.d.r. n.a. n.a. n.d.r. n.a.Mass movement: wet 4 n.a. 122 465 626 n.a. 626 122 465 n.a. 1,212Volcanic eruptions 11 173 6 4 n.a. 4 173 6 11 193Windstorms 785 370,779 100,451 33,864 2,837 418,509 29,460 53,241 7,507 508,717Subtotal climato-, hydro- &meteorological disastersSubtotal geophysicaldisasters5,438 421,704 220,704 127,624 12,452 559,533 53,414 165,814 9,162 787,9236,585 6,829 164,461 5,583 160 56,021 2,991 124,474 131 183,618Total natural disasters 12,023 428,533 385,166 133,207 12,612 615,554 56,405 290,289 9,293 971,541Industrial accidents 921 6 452 12,889 n.d.r. 11,992 6 2,270 n.a. 14,268Miscellaneous accidents 3 77 20 319 n.a. 319 77 20 3 418Transport accidents n.a. n.a. 463 n.a. n.a. n.a. n.a. n.a. 463 463Total technologicaldisasters923 83 936 13,208 n.a. 12,311 83 2,290 466 15,150Total 12,947 428,616 386,102 146,414 12,612 627,865 56,488 292,579 9,760 986,691Source: EM-DAT, CRED, University of Louvain, Belgium
Strictly under embargo until Wednesday 22 September at 00:01 GMT (02:01 Geneva time)1VHHD stands for very high human development, HHD stands for high humandevelopment, MHD for medium human development and LHD for low humandevelopment.See note on UNDP’s Human Development Index country status in the section ondisaster definitions in the introduction to this annex.2Includes waves and surges.3Landslides, rockfalls, subsidence of geophysical origin.4Landslides, avalanches, subsidence of hydrological origin.Note: ’n.a.’ signifies ’no data available’; ’n.d.r.’ signifies ’no disaster reported’.For more information, see section on caveats in introductory text.Estimates of disaster damage must be treated with caution, as the financialvalue attached to infrastructures in developed countries is much higher thanin developing countries. While reporting is better for large disasters, the lowreporting rates of direct damage make analysis difficult.During the decade:Americas accounted for 43 per cent of the reported damages but for 89 percent of costs related to volcanic eruptions and 73 per cent of those relatedto windstorms.Asia accounted for 39 per cent of the reported damages but for 100 per centof those caused by transport accidents, 90 per cent of costs relatedto earthquakes / tsunamis, 56 per cent of those caused by extreme temperaturesand 46 per cent of those caused by floods.Europe accounted for 15 per cent of the reported damages but for 90 percent of those caused by industrial accidents, 76 per cent of those related tomiscellaneous accidents, 40 per cent of those caused by extreme temperatures,36 per cent of those caused by wild fires and 35 per cent of those caused byfloods.Africa accounted for 1 per cent of the reported damages but for 6 per cent ofthose caused by industrial accidents and 6 per cent of those caused by volcaniceruptions.Oceania accounted also for 1 per cent of the reported damages but for 9 percent of those caused by droughts and 8 per cent of those caused by wild fires.Very high human development countries accounted for 64 per cent of allreported damages and low human development countries for less than1 per cent.ANNEX 1World Disasters Report 2010 – Disaster data181
Strictly under embargo until Wednesday 22 September at 00:01 GMT (02:01 Geneva time)Table 13Total number of people reported killed and affected by disasters by country andterritory (1990 to 1999; 2000 to 2009; and 2009)Totalnumberof peoplereportedkilled(1990–1999)Totalnumberof peoplereportedaffected(1990–1999)Totalnumberof peoplereportedkilled(2000–2009)Totalnumberof peoplereportedaffected(2000–2009)Totalnumberof peoplereportedkilled(2009)Totalnumberof peoplereportedaffected(2009)Africa 27,913 180,081,852 46,806 306,594,733 3,142 24,468,380Algeria 469 68,389 4,200 411,903 103 2,628Angola 864 210,197 1,113 866,704 94 225,105Benin 37 834,196 385 290,774 60 120,449Botswana 20 105,500 3 148,792 0 5,056Burkina Faso 28 2,839,940 369 314,528 49 150,541Burundi 2 680,810 481 8,037,581 45 270,549Cameroon 555 378,164 764 37,916 36 305Cape Verde 18 16,306 60 30,001 3 n.a.Central AfricanRepublic7 76,618 294 73,279 4 23,972Chad 41 911,206 260 1,176,338 6 12,915Comoros 240 200 342 286,855 184 2,512Congo 665 78,500 138 139,668 n.d.r. n.d.r.Congo, DemocraticRepublic of the1,049 141,867 3,493 270,721 463 5,638Côte d’Ivoire 178 268 357 107,633 27 10,006Djibouti 145 240,775 197 1,223,173 13 340,024Egypt 2,561 261,830 3,257 7,147 83 73Equatorial Guinea n.d.r. n.d.r. 105 5,050 n.d.r. n.d.r.Eritrea 1 133 3,915,725 56 10,907,043 n.d.r. n.d.r.Ethiopia 1 836 6,788,247 1,717 49,334,051 n.a. 6,400,000Gabon 102 n.a. 94 811 n.a. 800Gambia 153 37,000 62 32,035 5 16,608Ghana 436 3,024,611 747 696,784 58 159,545Guinea 488 6,091 478 287,082 15 40,000Guinea Bissau 217 5,222 117 134,164 73 3Kenya 1,610 34,911,866 2,058 87,149,813 298 3,846,674Lesotho 22 994,750 41 1,956,561 n.d.r. n.d.r.Liberia 10 1,007,000 63 521,424 2 500,584Libya 252 n.a. 492 102 221 23Madagascar 501 1,510,056 1,116 5,905,799 27 130,799Malawi 494 31,368,500 854 15,035,023 26 37,134Mali 84 310,666 300 2,180,922 25 20,406Mauritania 147 514,194 187 3,132,763 1 9,000Mauritius 5 10,800 5 1,050 n.d.r. n.d.r.Mayotte (F) n.d.r. n.d.r. 21 12 n.d.r. n.d.r.Morocco 1,390 373,365 1,574 622,116 29 9,520182
Strictly under embargo until Wednesday 22 September at 00:01 GMT (02:01 Geneva time)Totalnumberof peoplereportedkilled(1990–1999)Totalnumberof peoplereportedaffected(1990–1999)Totalnumberof peoplereportedkilled(2000–2009)Totalnumberof peoplereportedaffected(2000–2009)Totalnumberof peoplereportedkilled(2009)Totalnumberof peoplereportedaffected(2009)ANNEX 1Mozambique 647 9,824,663 1,609 11,317,161 31 14,057Namibia 20 876,400 167 1,164,309 92 350,000Niger 117 3,383,387 153 13,439,751 3 79,129Nigeria 3,763 805,377 8,662 596,449 273 150,072Reunion (F) 59 n.a. 4 3,790 n.d.r. n.d.r.Rwanda 160 1,058,682 280 5,944,806 n.d.r. n.d.r.Saint Helena (UK) n.d.r. n.d.r. n.a. 300 n.d.r. n.d.r.Sao Tome and Principe n.d.r. n.d.r. 33 34 n.d.r. n.d.r.Senegal 356 418,807 1,558 815,801 6 264,000Seychelles 5 1,237 3 11,630 n.d.r. n.d.r.Sierra Leone 815 200,025 662 21,046 257 1,477Somalia 2,656 1,240,610 1,060 10,251,843 15 3,301,753South Africa 1,705 366,742 1,544 15,255,780 94 20,300Sudan 1,031 22,078,538 1,074 9,927,696 31 4,411,455Swaziland n.a. 1,500,000 55 4,573,744 n.d.r. n.d.r.Tanzania 1,886 14,011,208 1,357 7,180,971 157 70,048Togo 3 341,905 96 188,167 19 n.a.Tunisia 78 152,089 546 33,851 110 217Uganda 477 1,170,737 1,222 5,649,666 11 750,000Zambia 163 5,973,455 385 4,260,442 31 614,964Zimbabwe 213 25,055,131 536 24,631,878 62 2,100,039Americas 77,918 52,474,486 32,577 73,160,749 2,160 5,775,652Anguilla (UK) n.a. 150 n.d.r. n.d.r. n.d.r. n.d.r.Antigua and Barbuda 6 11,684 n.a. 25,800 n.d.r. n.d.r.Argentina 452 571,831 575 754,421 23 45,534Aruba (NL) n.d.r. n.d.r. n.d.r. n.d.r. n.d.r. n.d.r.Bahamas 5 1,700 68 20,578 n.d.r. n.d.r.Barbados n.a. n.a. 1 2,881 n.d.r. n.d.r.Belize 31 62,600 55 150,570 n.d.r. n.d.r.Bermuda n.d.r. n.d.r. 22 n.a. n.d.r. n.d.r.Bolivia 513 754,886 911 2,204,254 19 90,523Brazil 2,057 20,345,253 2,664 7,370,878 n.d.r. 1,871,486Canada 510 82,765 76 34,756 18 204Cayman Islands (UK) n.d.r. n.d.r. 2 300 n.d.r. n.d.r.Chile 447 335,550 247 765,071 24 3Colombia 2,919 1,926,254 1,988 4,693,859 83 31,850Costa Rica 163 1,023,851 139 469,336 31 128,618Cuba 818 2,536,690 201 9,839,475 14 30Dominica 13 5,716 5 7,805 n.d.r. n.d.r.Dominican Republic 843 1,024,425 1,237 300,467 7 14,565Ecuador 999 463,815 559 1,039,275 3 119,307World Disasters Report 2010 – Disaster data183
Strictly under embargo until Wednesday 22 September at 00:01 GMT (02:01 Geneva time)184ANNEX 1Totalnumberof peoplereportedkilled(1990–1999)Totalnumberof peoplereportedaffected(1990–1999)Totalnumberof peoplereportedkilled(2000–2009)Totalnumberof peoplereportedaffected(2000–2009)Totalnumberof peoplereportedkilled(2009)Totalnumberof peoplereportedaffected(2009)El Salvador 674 101,480 1,754 2,182,807 275 90,000Falkland Islands (UK) n.d.r. n.d.r. n.d.r. n.d.r. n.d.r. n.d.r.French Guiana (F) n.a. 70,000 n.d.r. n.d.r. n.d.r. n.d.r.Greenland (DK) n.d.r. n.d.r. n.d.r. n.d.r. n.d.r. n.d.r.Grenada n.a. 1,210 40 61,650 n.d.r. n.d.r.Guadeloupe (F) 4 899 21 153 n.d.r. n.d.r.Guatemala 830 150,703 2,251 3,422,077 36 2,513,828Guyana n.a. 1,252,600 44 409,774 n.d.r. n.d.r.Haiti 4,112 2,604,514 6,936 1,191,958 88 12,787Honduras 15,276 2,860,970 434 1,849,813 7 300,136Jamaica 28 556,512 55 429,410 n.d.r. n.d.r.Martinique (F) 10 5,110 2 106 n.d.r. n.d.r.Mexico 4,136 2,420,218 1,598 6,792,601 121 252,299Montserrat (UK) 32 13,000 n.a. 200 n.d.r. n.d.r.Netherlands Antilles (NL) 2 40,000 15 4 n.d.r. n.d.r.Nicaragua 3,690 1,919,740 335 569,807 n.a. 26,782Panama 147 49,102 143 100,671 22 4,258Paraguay 114 470,654 456 591,955 n.a. 212,735Peru 2,909 5,577,770 3,586 6,678,647 641 25,775Puerto Rico (USA) 67 156,005 113 16,999 n.a. 1,500Saint Kitts and Nevis 5 12,980 n.d.r. n.d.r. n.d.r. n.d.r.Saint Lucia 4 1,125 1 n.a. n.d.r. n.d.r.Saint Pierre etMiquelon (F)n.d.r. n.d.r. n.d.r. n.d.r. n.d.r. n.d.r.Saint Vincent andThe Grenadines3 300 4 1,534 n.d.r. n.d.r.Suriname n.d.r. n.d.r. 35 31,548 n.d.r. n.d.r.Trinidad and Tobago 5 1,627 3 1,760 n.d.r. n.d.r.Turks and CaicosIslands (UK)43 n.a. 89 1,818 85 118United States 5,283 4,407,989 5,198 20,850,645 215 11,314Uruguay 110 19,087 41 158,712 12 22,000Venezuela 30,648 623,718 673 136,374 18 n.a.Virgin Islands (UK) n.a. 3 n.d.r. n.d.r. n.d.r. n.d.r.Virgin Islands (US) 10 10,000 n.a. n.a. n.d.r. n.d.r.Asia 756,124 1,894,409,821 933,250 2,159,714,852 9,744 111,793,234Afghanistan 10,796 536,177 5,043 10,882,311 140 65,883Armenia 2 106 7,022,954 1 297,000 n.d.r. n.d.r.Azerbaijan 2 561 2,443,312 142 39,819 n.a. 5,000Bahrain 10 n.a. 212 60 n.d.r. n.d.r.Bangladesh 149,430 81,879,521 13,430 72,415,045 433 4,568,000Bhutan 39 65,600 223 1,012 23 12
Strictly under embargo until Wednesday 22 September at 00:01 GMT (02:01 Geneva time)Totalnumberof peoplereportedkilled(1990–1999)Totalnumberof peoplereportedaffected(1990–1999)Totalnumberof peoplereportedkilled(2000–2009)Totalnumberof peoplereportedaffected(2000–2009)Totalnumberof peoplereportedkilled(2009)Totalnumberof peoplereportedaffected(2009)ANNEX 1Brunei Darussalam n.a. n.a. n.d.r. n.d.r. n.d.r. n.d.r.Cambodia 816 18,789,379 526 8,392,339 36 178,104China’s PeopleRepublic 3 36,381 1,258,680,092 111,768 1,126,067,999 1,152 72,464,797Georgia 2 379 4,665 89 1,422,552 n.a. 7,306Hong Kong (China) 3 350 8,795 60 4,466 n.a. 350India 59,846 315,125,127 64,478 659,134,721 2,044 8,997,490Indonesia 8,705 7,065,982 182,999 11,668,855 1,946 2,876,919Iran, Islamic Republic 45,067 38,941,198 31,412 76,359,370 234 336Iraq 118 500 1,508 72,547 13 3,005Israel 156 1,343 49 885 n.d.r. n.d.r.Japan 6,602 1,441,107 1,128 1,654,816 89 32,848Jordan 59 198,340 145 150,322 n.d.r. n.d.r.Kazakhstan 2 244 638,036 212 81,177 63 43Korea, DemocraticPeople’s Republic 4 381,865 49,554,203 230,313 26,402,902 n.d.r. n.d.r.Korea, Republic 2,451 446,138 1,355 521,840 17 14Kuwait 2 200 43 76 43 76Kyrgyzstan 2 255 205,464 323 29,570 n.d.r. n.d.r.Lao People’sDemocratic Republic180 2,860,862 77 1,386,082 26 128,887Lebanon 70 104,075 93 17,609 44 39Macau (China) 3 n.a. 3,986 n.a. 133 n.d.r. n.d.r.Malaysia 890 49,574 287 460,282 n.a. 10,875Maldives 10 23,849 133 28,963 n.d.r. n.d.r.Mongolia 280 105,061 165 4,841,665 29 910,007Myanmar 775 684,323 138,962 2,752,674 24 1,351Nepal 3,446 865,442 2,946 2,574,231 203 175,104Oman n.d.r. n.d.r. 192 20,115 n.d.r. n.d.r.Pakistan 9,318 20,514,524 78,779 26,319,733 244 75,183Palestine (West Bankand Gaza) 5 14 20 5 765 n.d.r. n.d.r.Philippines 15,965 38,820,297 11,705 50,230,127 1,409 13,353,441Qatar n.d.r. n.d.r. 30 n.a. 30 n.a.Saudi Arabia 2,550 1,936 1,369 24,530 161 10,000Singapore 3 1,437 n.d.r. n.d.r. n.d.r. n.d.r.Sri Lanka 635 3,325,964 35,892 7,241,738 3 380,000Syrian Arab Republic 145 329,091 363 5539676 22 1,300,007Taiwan (China) 3,189 531,221 1,519 2,981,258 630 2,307,523Tajikistan 2 1,868 379,584 202 9,306,479 22 22,836Thailand 2,705 22,079,796 9,913 28,220,118 96 200,286Timor-Leste 6 n.d.r. n.d.r. 5 13,685 n.d.r. n.d.r.World Disasters Report 2010 – Disaster data185
Strictly under embargo until Wednesday 22 September at 00:01 GMT (02:01 Geneva time)186ANNEX 1Totalnumberof peoplereportedkilled(1990–1999)Totalnumberof peoplereportedaffected(1990–1999)Totalnumberof peoplereportedkilled(2000–2009)Totalnumberof peoplereportedaffected(2000–2009)Totalnumberof peoplereportedkilled(2009)Totalnumberof peoplereportedaffected(2009)Turkmenistan 2 40 420 11 n.a. n.d.r. n.d.r.United Arab Emirates 97 101 97 46 n.d.r. n.d.r.Uzbekistan 2 141 74,388 60 1,205,030 n.d.r. n.d.r.Viet Nam 8,603 20,247,866 4,015 20,918,620 410 3,717,512Yemen 7 962 357,871 971 31,609 158 n.a.Europe 35,503 52,351,392 91,054 10,144,275 1,319 145,660Albania 75 48,600 68 616,584 n.a. 11,150Austria 124 10,212 553 61,733 3 n.a.Azores (P) 74 1,215 n.d.r. n.d.r. n.d.r. n.d.r.Belarus 2 61 63,468 36 1,851 n.d.r. n.d.r.Belgium 99 3,040 2,161 2,779 1 n.a.Bosnia andHerzegovina 8 12 1,090 66 366,819 1 13,730Bulgaria 31 6,792 118 14,062 17 19Canary Islands (SP) n.a. n.a. 168 1,280 22 6Croatia 8 96 2,025 873 2,306 n.d.r. n.d.r.Cyprus 54 2,657 40 448 n.d.r. n.d.r.Czech Republic 9 54 102,171 511 218,915 15 14,462Czechoslovakia 9 41 n.a. n.d.r. n.d.r. n.d.r. n.d.r.Denmark 8 100 6 2,072 n.d.r. n.d.r.Estonia 2 912 140 25 130 n.d.r. n.d.r.Finland 11 33 24 415 n.d.r. n.d.r.France 770 3,530,410 21,353 80,017 18 200Germany 10 392 237,574 9,643 333,212 9 n.a.Gibraltar (UK) n.d.r. n.d.r. n.d.r. n.d.r. n.d.r. n.d.r.Greece 430 152,195 551 24,405 12 1,040Hungary 106 133,774 757 46,660 n.d.r. n.d.r.Iceland 34 83 n.a. 199 n.d.r. n.d.r.Ireland 46 4,200 1 500 n.a. n.a.Isle of Man (UK) n.d.r. n.d.r. n.d.r. n.d.r. n.d.r. n.d.r.Italy 852 74,270 21,017 129,377 364 61,147Latvia 2 6 n.a. 76 n.a. n.d.r. n.d.r.Lithuania 2 50 780,000 45 n.a. n.d.r. n.d.r.Luxembourg n.a. n.a. 190 n.a. n.d.r. n.d.r.Macedonia, FYR 8 198 11,515 59 1,110,149 15 38Malta 295 n.a. 112 31 n.d.r. n.d.r.Moldova 2 59 54,537 19 2,821,394 n.d.r. n.d.r.Montenegro 11 n.d.r. n.d.r. n.a. 1,536 n.a. 450Netherlands 204 265,170 2,021 3,196 n.d.r. n.d.r.Norway 411 4,000 37 2,242 n.d.r. n.d.r.Poland 462 226,006 1,158 21,245 199 274
Strictly under embargo until Wednesday 22 September at 00:01 GMT (02:01 Geneva time)Totalnumberof peoplereportedkilled(1990–1999)Totalnumberof peoplereportedaffected(1990–1999)Totalnumberof peoplereportedkilled(2000–2009)Totalnumberof peoplereportedaffected(2000–2009)Totalnumberof peoplereportedkilled(2009)Totalnumberof peoplereportedaffected(2009)ANNEX 1Portugal 136 3,377 2,891 150,897 n.a. 0Romania 472 177,801 607 217,266 78 27Russian Federation 2 5,301 2,090,161 4,461 1,974,446 363 85Serbia 11 n.d.r. n.d.r. n.a. 16,080 n.a. 3,710Serbia-Montenegro 8 11 115 77,103 77 49,182 n.d.r. n.d.r.Slovakia 9 67 48,015 67 10,787 32 20Slovenia 8 n.a. 700 309 1,655 n.d.r. n.d.r.Soviet Union 2 784 346,384Spain 541 36,068,625 15,797 9,666 20 n.a.Sweden 79 184 8 n.a. n.d.r. n.d.r.Switzerland 119 5,211 1,125 7,400 n.a. n.a.Turkey 20,958 5,286,686 1,864 773,348 81 35,137Ukraine 2 364 2,060,758 1,713 661,098 45 38United Kingdom 423 470,990 447 408,893 24 4,127Yugoslavia 8 177 120Oceania 3,562 39,073,198 1,665 657,658 893 76,966American Samoa (USA) n.d.r. n.d.r. 40 25,563 34 2,500Australia 320 36,649,932 831 98,218 560 36,569Cook Islands (NZ) 20 900 n.a. 1,352 n.d.r. n.d.r.Fiji 76 436,730 70 51,362 14 14,401French Polynesia (F) 13 511 20 n.a. n.d.r. n.d.r.Guam (USA) 229 12,033 5 15,644 n.d.r. n.d.r.Kiribati n.a. 84,000 n.a. 85 n.d.r. n.d.r.Marshall Islands n.a. 6,000 n.a. 600 n.d.r. n.d.r.Micronesia FederatedStatesn.a. 28,800 48 8,631 n.d.r. n.d.r.Nauru n.d.r. n.d.r. n.d.r. n.d.r. n.d.r. n.d.r.New Caledonia (F) n.a. n.a. 2 1,100 n.d.r. n.d.r.New Zealand 4 3,365 24 7,650 n.d.r. n.d.r.Niue (NZ) n.a. 200 1 702 n.d.r. n.d.r.Northern Mariana Is n.d.r. n.d.r. n.a. 300 n.d.r. n.d.r.Palau 1 12,004 n.d.r. n.d.r. n.d.r. n.d.r.Papua New Guinea 2,685 1,426,506 287 325,198 32 n.a.Samoa 21 283,000 158 5,585 148 5,585Solomon Islands 37 88,904 73 10,919 21 7,000Tokelau (NZ) n.a. 102 0 26 n.d.r. n.d.r.Tonga 1 9,674 84 17,061 84 561Tuvalu n.a. 850 18 n.a. n.d.r. n.d.r.Vanuatu 150 29,667 4 87,662 n.a. 10,350Wallis and Futuna (F) 5 20 n.d.r. n.d.r. n.d.r. n.d.r.World 901,020 2,218,390,749 1,105,352 2,550,272,267 17,258 142,259,892World Disasters Report 2010 – Disaster data187
Strictly under embargo until Wednesday 22 September at 00:01 GMT (02:01 Geneva time)Note: ’n.a.’ denotes ’no data available’; ’n.d.r.’ signifies’no disaster reported’. For more information, see sectionon caveats in introductory text.188ANNEX 11Prior to 1993, Ethiopia was considered one country, afterthis date it was separated into Eritrea and Ethiopia.2Prior to 1991 the Soviet Union was considered onecountry, after this date it became separate countries.The western former republics of the USSR (Belarus,Estonia, Latvia, Lithuania, Moldova, Russian Federation,Ukraine) are included in Europe; the southern formerrepublics (Armenia, Azerbaijan, Georgia, Kazakhstan,Kyrgyzstan, Tajikistan, Turkmenistan, Uzbekistan) areincluded in Asia.3Hong Kong became part of China in July 1997; Macaubecame part of China in December 1999.4The estimates provided are disputed. See the caveats inthe introductory pages of the statistical data for furtherinformation.5Since September 1993 and the Israel-PLO Declarationof Principles, the Gaza Strip and the West Bank havea Palestinian self-government. Direct negotiations todetermine the permanent status of these territoriesbegan in September 1999 but are far from a permanentagreement.6Since May 2002, East Timor has been an independentcountry: Timor-Leste.7Prior to May 1990, Yemen was divided into Araband People’s Democratic Republics; after this date itis considered one country.8Prior to 1992 Yugoslavia was considered one country,after this date it became separate countries: Bosnia andHerzegovina, Croatia, Serbia, Slovenia, Former YugoslavRepublic of Macedonia.9Prior to 1993, Czechoslovakia was considered onecountry, after this date it was divided into separatecountries: Czech Republic and Slovakia.10Prior to October 1990, Germany was divided into theFederal and Democratic Republics. After this date it wasconsidered as one country.11Between 1992 and 2006, Serbia and Montenegrowere considered one country. In 2006 they becametwo independent countries.Over the last decade, the highest numbers of deathsper continent were reported in Nigeria (Africa), Haiti(Americas), the Democratic People’s Republic of Korea(Asia) (see note 4 above), France (Europe) and Australia(Oceania).The highest numbers of people affected by disaster, bycontinent, were reported in Kenya (Africa), United Statesof America (Americas), People’s Republic of China (Asia),Moldova (Europe) and Papua New Guinea (Oceania).Compared to 1990–1999, the past decade has seendisaster deaths rise by 23 per cent and the numbersaffected by disasters rise by 15 per cent.The number of deaths has risen by 68 per cent in Africa,23 per cent in Asia and 156 per cent in Europe. It hasdecreased by 58 per cent in Americas and by 53 per centin Oceania.The number of people affected by disasters has risenof 70 per cent in Africa, 39 per cent in Americas and14 per cent in Asia. It has decreased by 81 per cent inEurope and by 98 per cent in Oceania.
Strictly under embargo until Wednesday 22 September at 00:01 GMT (02:01 Geneva time)ANNEX 1World Disasters Report 2010 – Disaster data189
190ANNEX 2Strictly under embargo until Wednesday 22 September at 00:01 GMT (02:01 Geneva time)
Strictly under embargo until Wednesday 22 September at 00:01 GMT (02:01 Geneva time)Making cities resilient:A ten-point checklist forlocal governmentsCities and local governments need to get ready, reduce the risks and become resilientto disasters. For the next two years and beyond, the United Nations InternationalStrategy for Disaster Reduction (UNISDR) will campaign together with its partnersfor this to happen.Making cities resilient, the 2010–2011 World Disaster Reduction campaign, addressesissues of local governance and urban risk while drawing upon previous UNISDRcampaigns for safer schools and hospitals, as well as on the sustainable urbanizationsprinciples developed in the United Nations Human Settlements Programme (UN-Habitat) World Urban Campaign 2009–2013.Overall, the campaign seeks to raise awareness and effect change by urging localgovernments to take immediate action and to build multi-stakeholder partnerships toachieve the implementation of the Hyogo Framework for Action at the local level. Thefollowing ten-point checklist of ‘essentials’ for making cities resilient, which builds onthe priorities identified in Hyogo Framework for Action 2005–2015: Building the resilienceof nations and communities to disasters (available online: www.unisdr.org / hfa), willserve as a guide for commitment during the campaign.Ten essentials for making cities resilient1. Put in place organization and coordination to understand and reduce disasterrisk, based on participation of citizen groups and civil society. Build local alliances.Ensure that all departments understand their role in disaster risk reductionand preparedness.2. Assign a budget for disaster risk reduction and provide incentives for homeowners,low-income families, communities, businesses and the public sector toinvest in reducing the risks they face.3. Maintain up-to-date data on hazards and vulnerabilities, prepare risk assessmentsand use these as the basis for urban development plans and decisions.Ensure that this information and the plans for your city’s resilience are readilyavailable to the public and fully discussed with them.Photo opposite page:Cities need to beable to respond tothe needs of bothinhabitants andvisitors. Not aneasy task in citiesattracting largenumbers of visitors,such as Mecca,which is visited bymillions of peopleduring the annualHajj pilgrimage,the world’s largestgathering.© Saudi Arabian RedCrescent SocietyWorld Disasters Report 2010 – Disaster data191
Strictly under embargo until Wednesday 22 September at 00:01 GMT (02:01 Geneva time)Invest in and maintain critical infrastructure that reduces risk, such as flooddrainage, adjusted where needed to cope with climate change.5. Assess the safety of all schools and health facilities and upgrade these as necessary.192ANNEX 24.6. Apply and enforce realistic, risk-compliant building regulations and landuseplanning principles. Identify safe land for low-income citizens and developupgrading of informal settlements, wherever feasible.7. Ensure education programmes and training on disaster risk reduction are inplace in schools and local communities.8. Protect ecosystems and natural buffers to mitigate floods, storm surges andother hazards to which your city may be vulnerable. Adapt to climate change bybuilding on good risk reduction practices.9. Install early warning systems and emergency management capacities in yourcity and hold regular public preparedness drills.10. After any disaster, ensure that the needs of the survivors are placed at the centreof reconstruction with support for them and their community organizations todesign and help implement responses, including rebuilding homes and livelihoods.Case studiesThe selected case studies illustrate how resilience can be put into practice by focusingon the ten essentials for making cities resilient. These case studies cover a number ofdifferent areas, ranging from risk assessment to risk communication, as well as differentgovernment levels and types of hazard.Essential 1Empowering local government as leaders in disaster reductionand recoveryMunicipal governments of Chincha, Pisco, Cañete and Ica, Peru(From UNISDR, Local Governments and Disaster Risk Reduction – Good practices andlessons learned, Geneva, April 2010.)After the 2007 earthquake in Peru, reconstruction and recovery in the affected regionswere typically fragmented and not well integrated into overall development and riskreduction work. Local government institutions, which were themselves affected bythe quake, were cast into a passive role. A United Nations Development Programme(UNDP) project partnered with municipal governments to help them enhance theirroles as leaders and coordinators of local development and recovery.
Strictly under embargo until Wednesday 22 September at 00:01 GMT (02:01 Geneva time)The UNDP Country Office intervention provided technical disaster risk reductionand recovery assistance to municipal governments. Although the project is a UNDPinitiative, it relied on the unique position of local governments to identify local prioritiesto reduce disaster risk. The municipal governments prioritized four areas, to whichUNDP provided close and permanent guidance: local governance; housing and territorialmanagement; economic reactivation; and information management.Results include the initiation of a process for updating and redesigning the municipalities’development plans (ten years) and annual plans for promoting sustained recoveryand risk reduction as well as the inclusion of development and capacity-buildingissues into the reconstruction, such as livelihoods, gender, information managementand institutional strengthening. Furthermore, the municipal governments’ regulartools and methods, such as their public investments system and information systemsfor monitoring and disseminating information, were improved. Land-use plans wererevised and made risk-sensitive. The comprehensive range of results has been an indicationof what can be achieved by local governments with the right support.Essential 2Changing standards for land-for-housing in NamibiaWindhoek, Namibia(From International Institute for Environment and Development (IIED), UrbanDevelopment and Intensive and Extensive Risk, Contribution to the Global AssessmentReport on Disaster Risk Reduction, 2009.)The city authorities in Windhoek recognized that to reach low-income households,they had to cut unit costs in their government-funded serviced-site programme. Thisprogramme had to recover the costs of developing land (both for housing and withinfrastructure to official standards), but this made it too expensive for low-incomegroups. This example from Namibia is interesting in that it shows how a change inapproach by the city government greatly increased the possibilities for low-incomehouseholds to be able to get their own housing.A new government policy, developed with the Shack Dwellers Federation of Namibia(a federation of savings groups formed mostly by low-income women), showed awillingness to overturn conventional approaches to standards and regulations, forinstance in plot sizes and in infrastructure standards, to make their serviced sites moreaffordable to low-income households. Plots can be rented, group purchased or leased.Significantly, families are allowed to upgrade services as they can afford to make theinvestments, extending sewerage and water lines from mains provision into theirhomes. Groups that belong to the Shack Dwellers Federation have access to their ownloan fund from which they can borrow for such service improvements, and around1,000 groups have taken such loans at an average household cost of US$ 150. However,this underestimates the number of improvements, because once households haveWorld Disasters Report 2010 – Disaster data193
Strictly under embargo until Wednesday 22 September at 00:01 GMT (02:01 Geneva time)194ANNEX 2asystem they can respond to, many can afford to make the improvements using theirown resources without the need to use loan finance.Essential 3Hazard identification and risk assessment at the provincial levelOntario, Canada(From UNISDR, Local Governments and Disaster Risk Reduction – Good practices andlessons learned, Geneva, April 2010.)Ontario passed its provincial Emergency Management and Civil Protection Act in2003. The act required all provincial ministries and municipal governments to identifyand rank all known and suspected emerging hazards and risks to community safety. Thisincluded carrying out a Hazard Identification and Risk Assessment (HIRA) process toassess risk, identify vulnerabilities and plan for comprehensive disaster risk reduction.The Ontario provincial government tasked Emergency Management Ontario with theimplementation of the province-wide HIRA report and methodology, on which theministry and municipal assessments would be based.Emergency Management Ontario produced an initial HIRA in 2003 which identified37 main risks for the province. All provincial government ministries are now workingon assessments based on this. A specialist officer in Emergency Management Ontariois currently reviewing the 37 hazards, identifying emerging hazards and developing amethodology to make the HIRA process even more effective and accurate. EmergencyManagement Ontario continues to provide comprehensive guidelines and technicalsupport for this risk assessment process.As a result, the provincial HIRA has improved the Ontario government’s ability toanticipate and mitigate the potential effects of hazards, throughout all ministry sectors.It is already helping to guide the creation of effective exercises, public awareness campaignsand training programmes focused on the most likely and dangerous hazards.This will improve disaster prevention, preparedness, mitigation, response and recovery.Essential 4A city government in a highly vulnerable flood-prone areadevelops a climate change plan with comprehensive disastermanagement measuresPune, India(From UNISDR, Adaptation to climate change by reducing disaster risks: country practicesand lessons, Briefing Note 2, Geneva, November 2009.)The city of Pune in Maharashtra State, India, has a population of nearly 5 millionpeople and is located at the confluence of the Mutha, Mula and Pavana rivers. It hasbeen affected by several severe floods over the last six decades, the most significant of
Strictly under embargo until Wednesday 22 September at 00:01 GMT (02:01 Geneva time)which was the 1961 flood that involved a major dam failure. Anticipating an increasedfrequency of floods due to climate change, a number of programmes have been putin place to build capacity, assess hazards and vulnerability, construct dams, dykes andseawalls, establish early warning systems, as well as projects concerning land-use planning,environmental protection and community education and resilience.A systematic city-wide plan of practical action to reduce flooding was implemented. Afirst step was to assess the flood risks by analysing hourly rainfall intensity and examiningthe likely changes in impacts in low-lying areas and places where natural drainage wasblocked by the construction of houses or by roads without adequate bridges. A detailedcity drainage map was developed. The plan introduced structural and planning measuresfor restoring natural drainage, widening streams, extending bridges and applying naturalsoil infiltration methodologies. Watershed conservation techniques, such as afforestationand building small earthen check dams, were undertaken in the hill zone. Property taxincentives were provided to encourage households to recycle wastewater or use rainwaterharvesting by storing run-off from their roofs for domestic use. These efforts were complementedby improvements in flood monitoring and warning systems and social protectionfor affected families. The initiative was driven jointly by the elected municipalgovernment, the municipal commissioner and Alert (active citizen groups), and involvesmany different city departments. It demonstrates that local governments can prepare forclimate change by reducing and managing the local factors that lead to disasters.Essential 5Making all healthcare facilities saferCayman Islands(From UNISDR, 2008–2009 World Disaster Reduction Campaign – Hospitals Safe fromDisasters, Geneva, January 2008.)The Cayman Islands, which is made up of three islands, has experienced the largestnumber of hurricane strikes in the Atlantic basin. In September 2004, the biggestisland, Grand Cayman, was hit by Hurricane Ivan, the islands’ worst hurricanein 86 years. Ivan destroyed or damaged 90 per cent of buildings. Power, water andcommunications were disrupted for months in some areas. But the island began amajor rebuilding process, including in the health sector.The Cayman Islands adopted a National Strategic Framework for Disaster Risk Reduction.Within this framework, the Health Services Authority, as the islands’ primaryprovider of healthcare, implemented several activities to make all its facilities safer.These activities address structural, non-structural, functional and workforce issues.For instance, at the structural level, the 124-bed Cayman Islands Hospital (the territory’sprincipal healthcare facility) was built to Category 5 hurricane standards. Olderfacilities were upgraded to new local and international building codes and protocolsfor healthcare facilities, and seismic risk reduction elements were introduced in theWorld Disasters Report 2010 – Disaster data195
Strictly under embargo until Wednesday 22 September at 00:01 GMT (02:01 Geneva time)of health facilities. The anticipated damage and recovery time was reduced andthe continuity of operations improved. The Cayman Islands Hospital, for instance,remained functional during and after Hurricane Ivan in 2004 while providing animpromptu shelter to more than 1,000 people.196ANNEX 2designEssential 6National policy with national government, local governmentand community fundingThailand(From IIED, Urban Development and Intensive and Extensive Risk, Contribution to theGlobal Assessment Report on Disaster Risk Reduction, 2009.)The Thai government is implementing one of the most ambitious ‘slum’ and squatterupgrading initiatives currently under way. Managed by the government’s CommunityOrganizations Development Institute (CODI), the Baan Mankong (secure housing)programme channels funds in the form of infrastructure subsidies and housing loansdirect to community organizations formed by low-income inhabitants in informal settlements.It is also significant in that it draws almost entirely from domestic resources – acombination of national government, local government and community contributions.Each community organization develops the solution that works best for them in regardto land. Within this national programme, there are a variety of means by which thosein illegal settlements can get legal land tenure, for instance, by the inhabitants purchasingthe land from the landowner (supported by a government loan), negotiatinga community lease, agreeing to move to another location provided by the governmentagency on whose land they are squatting, or agreeing with the landowner to move topart of the site they are occupying in return for tenure of that site (land sharing).CODI also provides loans to community organizations to ‘on-lend’ to their membersto help build or improve their homes. It also supports city governments in taking theinitiative to collaborate with urban poor organizations, for instance, providing a siteon which those living in various ‘mini’ squatter settlements in their jurisdiction couldrelocate, with the land provided on a 30-year lease.Essential 7Watch and learn: Children and communities study mountainand urban risksSaijo City, Japan(From UNISDR, Local Governments and Disaster Risk Reduction – Good practices andlessons learned, Geneva, April 2010.)In 2004, Saijo City in Shikoku island’s Ehime Prefecture was hit by record typhoonsthat led to flooding in its urban areas and landslides in the mountains. A small city
Strictly under embargo until Wednesday 22 September at 00:01 GMT (02:01 Geneva time)with semi-rural mountainous areas, Saijo City faces unique challenges in disaster riskreduction. First, Japan’s ageing population represents a particular problem. Young ablebodiedpeople are very important to community systems of mutual aid and emergencypreparedness. And as young people tend to move away to bigger cities, smaller towns inJapan have an even older population than the already imbalanced national average. Second,smaller cities like Saijo City are often spread over a mix of geographic terrains – anurban plain, semi-rural and isolated villages on hills and mountains, and a coastal area.To meet these challenges, the Saijo City government instigated in 2005 a risk-awarenessprogramme targeting schoolchildren. Focusing on the city’s various physical environments,the ‘mountain-watching’ and ‘town-watching’ project takes 12-year-olds, accompaniedby teachers, local residents, forest workers and municipal officials, on risk educationfield trips. The young urban dwellers meet with the elderly in the mountains tolearn together about the risks Saijo City faces and to remember the lessons learned ofthe 2004 typhoons. Meanwhile, a ‘mountain- and town-watching’ handbook has beendeveloped, and a teachers’ association for disaster education, a children’s disaster preventionclub and a disaster prevention forum, also for children, have been set up. The initiativeserves as an excellent example of a local government leading a multi-stakeholder andcommunity-based disaster risk awareness initiative that then becomes self-sustaining.Essential 8A rapidly growing municipality addresses the increasing riskof droughts by implementing a water resource managementprogrammeOverstrand, South Africa(From UNISDR, Local Governments and Disaster Risk Reduction – Good practices andlessons learned, Geneva, April 2010.)The Overstrand municipality, located along the coast of Western Cape Province inSouth Africa, has been faced with rapid and seasonal population growth and projectedshortages of water supply in the district of Hermanus. In addition, there has been adecline in rainfall since 1997 and climate change threatens to bring more variablerainfall and more extreme temperatures to the Western Cape region. In response, themunicipality adopted a comprehensive water resource management and developmentprogramme, which draws on the national policy and legislative platform developed bythe South African National Department of Water Affairs and Forestry.The municipality strived to implement a longer-term, multi-stakeholder programmewith growing public recognition of drought risk. The programme employed twomain strategies: better water demand management and finding additional, sustainablesources of water. The municipality conducted comprehensive water demand managementmeasures including clearing invasive alien plants, a public awareness campaignand a programme of leak detection and repair.World Disasters Report 2010 – Disaster data197
Strictly under embargo until Wednesday 22 September at 00:01 GMT (02:01 Geneva time)198ANNEX 2In order to find local water sources, groundwater drilling was initiated after carefulanalysis of various options. The permanent coordinating role of the local governmentwas vital in conducting such a long-term, multi-stakeholder programme involvingnational and provincial water agencies, a regional biodiversity conservation instituteand a group of community-based organizations. Uncertainty and scepticism amongstakeholders regarding extracting groundwater was overcome by establishing a participatorymonitoring committee and preparing relevant sets of baseline data.Essential 9Many partners, one system: An integrated flood earlywarning system for JakartaJakarta, Indonesia(From UNISDR, Local Governments and Disaster Risk Reduction – Good practices andlessons learned, Geneva, April 2010.)Jakarta, the capital of Indonesia, has a high flood risk – it is a coastal city and is the exitpoint of 13 rivers. Some 40 per cent of Jakarta lies below sea level and the provincialauthority area includes 110 islands. Hydrometeorological hazards have inflicted muchdamage in coastal areas and on residential areas near the river banks. During the annualand five-yearly floods, Jakarta has lost billions of dollars’ worth of investment in buildingand infrastructure.Integrating improvements into the flood early warning system for Jakarta has been atrue multi-stakeholder process, involving a huge range of local authorities and partners.By managing everyone’s interests and roles and improving coordination, the earlywarning system was upgraded from top to bottom. Technical improvements mean thatearlier flood warnings are now possible. But more importantly, preparedness capacityhas been built and streamlined. Key coordination hubs and standard operating procedureshave been established and tested with comprehensive drills, so that institutionsand communities are now more ready to act on warnings.Essential 10Institution building and capacity building for localgovernmentsPakistan(From UNISDR, Local Governments and Disaster Risk Reduction – Good practices andlessons learned, Geneva, April 2010.)The earthquake that struck the northern border area of Pakistan on 8 October 2005was the nation’s most devastating disaster ever. It claimed more than 73,000 lives,injured more than 128,000 people, rendered 2.8 million people homeless and affected3.5 million people in an area of 30,000 square kilometres. The response from the government,civil society and international donors was swift. The government established
Strictly under embargo until Wednesday 22 September at 00:01 GMT (02:01 Geneva time)a Federal Relief Commission and an Earthquake Rehabilitation and ReconstructionAuthority (ERRA) to support medium- to long-term recovery and reconstructionefforts.Since its founding in October 2005, ERRA has integrated disaster risk reduction in allits reconstruction work and has initiated a disaster risk management programme forcommunity preparedness in the affected districts. In its reconstruction work, ERRAhas followed a disaster risk management approach of risk reduction, risk avoidance,risk transfer and risk management. ERRA has also worked on strengthening community-baseddisaster preparedness in line with the Hyogo Framework for Action. Thisauthority has worked directly with local governments to build institutional and communitypreparedness through new union council disaster management committeesand union council emergency response teams.Overall, this initiative has yielded concrete results such as a guidebook for mainstreamingdisaster risk reduction into development, hazard indication maps for the districtsof Mansehra and Muzaffarabad, and disaster management committees and emergencyresponse teams being established in 112 union councils across the two districts.Michele Cocchiglia, programme officer with the UNISDR Secretariat, contributed this text.World Disasters Report 2010 – Disaster data199
Strictly under embargo until Wednesday 22 September at 00:01 GMT (02:01 Geneva time)200INDEXIndexAceh 35, 55, 62, 65, 71, 139, 148-149see also Indonesiaacute respiratory infections 95Afghan Development Association 58Afghanistan 184Africa 11-12, 14, 17-19, 22, 28, 32-34,36-37, 41, 43-44, 47, 50-51, 58-60,69-70, 73, 75-77, 80-81, 87, 91, 97-99,102, 104, 118-119, 133, 135, 139, 141,147-148, 150, 153, 155-156, 160, 166-169, 174-176, 178, 180-183, 188, 197see also North Africasee also East Africasee also South Africasee also West AfricaAfrican Union 133aid agencies 18, 21, 23, 27, 55, 57, 148see also disaster relief agenciesAmerican Red Cross 139, 149, 153Americas 11, 97, 104-105, 111, 160,166-169, 174-176, 178, 180-181, 183,188see also Central Americasee also North Americasee also Latin Americasee also South AmericaAmnesty International 84Andes 119, 135Angola 42, 59, 75, 182Argentina 42, 59, 64, 81, 122, 143, 146,148, 150, 183Asha 100-101, 110Asia 11-12, 17, 19, 22, 28, 31-33, 37,40-41, 47, 58, 60, 64, 69, 80, 97-99,103-104, 109, 119, 136-137, 139, 147-148, 155, 160, 166-169, 174-176, 178,180-181, 184, 188see also South Asiasee also South-East AsiaAsian Cities Climate Change ResilienceNetwork 129, 131, 136Asian Coalition for Housing Rights 26,28, 54, 68-69Asian Development Bank 103Asian Disaster Reduction Center(ADRC) 162assets 19-22, 25, 34, 38, 40, 47, 49, 54,61-62, 122, 137Australia 96, 115, 118, 187-188Baan Mankong 67, 69, 154, 196see also Community OrganizationsDevelopment Institute (CODI)see also ThailandBam 13, 35, 167see also IranBanda Aceh 35, 55, 62, 71, 149see also IndonesiaBangkok 28, 69, 71, 104see also ThailandBangladesh 22, 36, 38, 40-42, 51, 80,93, 98, 160, 184Beeckman, Katrien 88Beijing 32, 106-107see also ChinaBenazir Bhutto Income SupportProgramme 88
Strictly under embargo until Wednesday 22 September at 00:01 GMT (02:01 Geneva time)Benin 96, 119, 136, 182Bogotá 86, 110see also ColombiaBolivia 59, 81, 183Bolsa Familia 88Brazil 59, 64, 75, 80-81, 86, 88-90, 93,95, 98, 104, 135, 156, 183Brazilian Red Cross 87Buenos Aires 122, 146, 154see also ArgentinaBureau of Alcohol, Tobacco, Firearmsand Explosives 75see also United States of AmericaBurkina Faso 99, 118, 182Burundi 160, 182C40 Climate Leadership Group 124Calí 42, 51see also ColombiaCambodia 59, 70, 80, 160, 185Cameroon 42, 96, 99, 182Canada 86, 90, 101, 103, 118, 183, 194Canadian Red Cross 87, 89-90cancer(s) 95, 97, 104-106Cape Town 18, 43-45, 50-51see also South AfricaCaracas 143, 150, 154-155see also VenezuelaCardoso, Fernando Henrique 89CARE 58, 69Caribbean 12, 22, 37, 73, 75-76, 80, 82,87, 89, 93, 98-99, 105, 111Catholic Relief Services 99Cayman Islands 183, 195-196Central America 75-76, 87, 93, 145,155see also Americascentral government(s) 23, 110see also local government(s)Centre for Health Development 95see also World Health Organization(WHO)Centre for Research on theEpidemiology of Disasters (CRED)34-36, 49-50, 154, 159-169, 171-174,176, 178, 180see also EM-DAT databaseChandy, Thomas 100Chartered Society of Physiotherapy 95,111children 24, 37, 50-51, 56, 65, 76-77,79, 82-84, 87-88, 90, 92, 96-102, 105,112, 121-122, 135, 196-197see also street childrenChile 11, 81, 183China 22, 35, 40-42, 97, 103, 106, 110,126, 139, 160, 167-168, 185, 188Chittagong 41-42see also BangladeshCities for Climate Protection 124Cities in Climate Change Initiative 129,137see also United Nations HumanSettlements Programme(UN-Habitat)civil society 21, 86, 92, 109, 125, 133,139, 144, 147-150, 153, 191, 198World Disasters Report 2010 – Index201
Strictly under embargo until Wednesday 22 September at 00:01 GMT (02:01 Geneva time)202INDEXclimate change 7-8, 12, 16, 26-28, 40,48, 50, 59, 69, 115-125, 127-137, 141-142, 147, 155-157, 192, 194-195, 197see also greenhouse gas emissionsColombia 42, 51, 75, 78, 80-81, 86, 89,91, 93, 145, 150, 156-157, 183Comayaguela 143see also HondurasCommittee to Protect Journalists 77, 91community associations 56see also savings groupscommunity-based initiatives 61, 110Community OrganizationsDevelopment Institute (CODI) 67, 196see also ThailandConakry 41-42see also GuineaCork 124, 126, 128see also Irelandcorruption 74, 77, 82, 88Costa Rica 42, 80-81, 183Côte d’Ivoire 99, 182Cotonou 119, 136see also Benincrime 7, 11, 19, 37, 73-75, 77-80, 82,84-93, 108see also urban violencesee also violenceCrisis States Research Centre 73, 89-90,92see also London Schoolof Economics and Political ScienceCyclone Nargis 35-36, 160, 167cyclone(s) 3, 11-13, 22, 34-36, 54, 117,160, 167Dar es Salaam 119see also TanzaniaDemocratic Republic of the Congo 37,96, 102dengue 103-104depression 95, 108, 112DesInventar database 38, 42developed countries 88, 97-98, 105-106,110, 173, 181developers 25, 46, 53, 127developing countries 73, 79, 91, 96, 98,101, 106, 108-109, 115, 173, 181Development Assistance Committee(DAC) 92see also Organisation for EconomicCo-operation and Development(OECD)Dhaka 36, 41-42, 50-51, 80, 93, 119see also Bangladeshdiabetes 95, 97-98, 104diarrhoea 95-97, 101, 121-122disability adjusted life years (DALYs) 97disaster impacts 11, 16, 20, 22, 48disaster management 29, 50, 141-142,148-150, 152-154, 194, 199disaster preparedness 11, 21, 59, 129,141, 144, 146, 149, 161, 164, 199disaster relief agencies 26, 53see also aid agenciesdisaster risk reduction 14, 16, 20-21,26-29, 36, 49, 51, 56, 63-64, 68, 107,115-116, 123, 125, 127, 129, 131, 133,139-154, 157, 191-199
Strictly under embargo until Wednesday 22 September at 00:01 GMT (02:01 Geneva time)disasters 7-8, 11-16, 18, 20-22, 26-29,31, 34-38, 40-41, 43-45, 47-51, 53-58,60, 62-63, 65-66, 69-71, 87, 96, 106,110, 115, 118, 121, 125, 127-128, 133-134, 137, 139-145, 147-151, 154-155,159-176, 178-182, 188, 191, 195disease 7, 15, 21, 31, 95, 97-99, 101-106, 108, 110, 113, 120-122, 127, 130see also infectious disease(s)see also non-communicable disease(s)Djibouti 160, 182Dominican Republic 80-81, 87, 150,183donors 11, 56, 165, 198drought(s) 36-37, 56, 98, 115, 117,129, 160, 162-163, 170-181, 197drug trafficking 74-75, 89, 92Durban 29, 140-141, 153, 156see also South Africadysentery 95, 100early warning system(s) 118, 130, 141,150-151, 192, 195, 198earthquakes 11-12, 21, 34-36, 39,45-46, 48, 56, 69, 139-140, 142, 145,147, 153-154, 162-163, 167, 170-181East Africa 22, 73see also Africaeconomic loss(es) 34, 40economic violence 74see also violenceEcuador 80-81, 157, 183education 16, 38, 47, 73, 79, 81-83,85-86, 88, 98, 120, 130-131, 140-141,143, 146, 192, 195, 197Egypt 59, 99, 103, 105, 119, 136, 150,182El Niño 147El Salvador 76, 81, 147, 152, 155, 184EM-DAT database 28, 34-35, 50, 161-163, 165-169, 171-174, 176, 178, 180see also Centre for Research on theEpidemiology of Disasters (CRED)emergency management 192, 194emergency response 12, 21, 144-145,152, 199employment 7, 22, 24, 81-82, 95, 127Enda-Tiers Monde 120, 134see also SenegalEnvironmental Protection Agency 125see also Irelandepidemics 21, 37, 99, 101, 103-104,162-163, 166Ethiopia 160, 188Europe 12, 19, 34, 75, 101, 105, 115,166-169, 174-176, 178, 180-181, 186,188evictions 47, 50, 66, 70, 80extreme weather event(s) 12, 16, 116,118, 133, 142, 146favelas 75, 79, 84, 86-87, 90see also BrazilFifth Assessment Report 116, 133see also Intergovernmental Panelon Climate Change (IPCC)firearms 73-75, 79, 86, 89, 92see also lethal weaponsfire(s) 11-13, 15-17, 21, 36-37, 39,43-45, 50-51, 57, 106, 121, 139-140,149, 152, 161-163, 170-181World Disasters Report 2010 – Index203
Strictly under embargo until Wednesday 22 September at 00:01 GMT (02:01 Geneva time)204INDEXflooding 16-17, 21, 28, 37-38, 40-42,46-47, 57, 64, 69-70, 117, 119-121,124-125, 127-129, 135, 146, 195-196flood plains 21-22, 124, 142, 148flood(s) 7-8, 11-12, 16, 21-22, 28,34-37, 39-42, 45-48, 50-51, 54, 56-58,63-64, 98, 100, 115, 119-120, 124-125,129, 139, 142-143, 146-148, 150, 160-163, 168, 170-173, 177, 179, 181, 192,194-195, 198Food and Agriculture Organization ofthe United Nations (FAO) 98, 111food insecurity 37-38, 96, 99, 101, 120,170-178, 180food security 7, 37, 49, 51, 112Fourth Assessment Report 40, 50, 116,123, 135-137see also Intergovernmental Panelon Climate Change (IPCC)France 35, 160, 169, 186, 188French Red Cross 109G8 95, 133gangs 74-78, 82, 84, 86-87, 91-92Gauteng province 87see also South AfricaGaviria, César 89gender 79, 121-122, 137, 193Ghana 59, 182Glasgow 95see also United KingdomGlobal Road Safety Partnership (GRSP)109Global Strategy on Violence Prevention,Mitigation and Response 79see also International Federationof Red Cross and Red CrescentSocieties (IFRC)good practice 11, 16, 26-27, 125Gormley, John 125greenhouse gas emissions 16, 115, 118,123-125, 130, 135see also climate changeGreenland ice sheet 123gross domestic product (GDP) 32,38-39, 46, 75-77, 83Guardian, The 108, 112Guatemala 75, 81-83, 87, 155-156, 184Guinea 41-42, 182, 187-188Gujarat 62-63, 69see also IndiaGuyana 87, 184H1N1 103see also influenzaH5N1 102-103see also influenzaHaiti 11, 22-24, 27, 34-35, 42, 53-54,75, 81, 90, 99, 111, 140, 151, 184, 188Han, Lu 106-107Hayden, Michael 124healthcare 7, 16, 21, 26, 34, 53-54, 67,77, 84, 95, 100-101, 131, 139-140,150-151, 195heart disease(s) 95, 97-98heatwave(s) 16, 35, 115, 117, 122
Strictly under embargo until Wednesday 22 September at 00:01 GMT (02:01 Geneva time)high-income nations 12-13, 16-17,19-20, 22, 27, 32, 39-40, 44, 96see also low-income nationssee also middle-income nationsHIV/AIDS 151Ho Chi Minh City 109, 119see also Viet NamHonduras 81, 143, 152, 154, 156, 184Hong Kong 103, 119, 185, 188see also Chinahousing 8, 11-12, 15-16, 18-26, 28, 36,44, 46-47, 53-54, 56-59, 61, 64-70, 73,80-81, 86, 96-97, 121, 128, 130, 140,142-144, 150, 153-154, 162, 193, 196see also poor-quality housinghousing, land and property (HLP) rights64-66, 69Hout Bay 44see also South AfricaHuancayo 119see also PeruHuman Development Index (HDI) 88,163, 166-169, 175, 177, 179, 181see also United NationsDevelopment Programme (UNDP)humanitarian assistance 14hunger 96, 98-99, 111Hurricane Felix 22Hurricane Katrina 13, 34-35, 65-66,124, 160Hurricane Mitch 54, 143, 145, 150, 152hurricane(s) 22, 195hygiene 70, 96, 111, 120-121Hyogo Framework for Action 191, 199ICLEI-Local Governments forSustainability 124, 130, 136illegal settlements 21, 26, 45, 53, 67,119, 142, 196income-earning opportunities 19, 22,24, 26, 59, 62India 22, 28, 35, 56, 59, 62-63, 70, 80,82, 97, 100, 110, 139, 160, 167, 185,194Indian Ocean tsunami 35, 53, 160, 167see also tsunamiIndonesia 22, 35, 55-56, 59, 69, 71, 99,139, 144, 148, 150, 153, 160, 167, 185,198Indonesian Red Cross Society (PMI)149Indore 63, 70see also Indiaindustrial accident(s) 11, 13, 140, 162,170-181infant mortality rate (IMR) 96infectious disease(s) 11, 21, 95-97, 105,113, 150see also diseasesee also non-communicable disease(s)influenza 101, 103see also H1N1see also H5N1informal settlement(s) 11-12, 15, 17-19,22, 24-27, 41-42, 44-45, 49-51, 53-54,59-60, 62-64, 67, 70, 86, 97, 100, 102,128, 142-144, 146, 150-151, 192, 196see also shanty town(s)see also slum(s)World Disasters Report 2010 – Index205
Strictly under embargo until Wednesday 22 September at 00:01 GMT (02:01 Geneva time)206INDEXinfrastructure 11-12, 14-21, 23-27,33-34, 40-43, 45-47, 53-54, 56, 59-61,64, 67, 87, 95, 97, 100, 109, 118, 120-121, 123-124, 126-130, 133, 136-137,139-140, 142-144, 146-150, 153, 162,192-193, 196, 198insurance 17, 21-22, 25, 40, 46, 50, 66,107, 121, 126, 143, 161, 164Intergovernmental Panel on ClimateChange (IPCC) 50, 116-118, 123, 128,130, 133, 136international aid 21, 23, 55International Committee of the RedCross (ICRC) 87see also International Federationof Red Cross and Red CrescentSocieties (IFRC)see also Red Cross Red CrescentInternational Federation of Red Crossand Red Crescent Societies (IFRC)18, 28, 31, 37, 53, 63, 69, 73, 79, 83,88-89, 102, 109-110, 115, 136, 144,150see also International Committeeof the Red Cross (ICRC)see also Red Cross Red CrescentInternational Monetary Fund 68, 98,111International Red Cross and RedCrescent Movement 79, 91Iran 13, 35, 167, 185Ireland 5, 124, 128, 136, 186Irish Academy of Engineering (IAE)124, 136Irish Red Cross 124Istanbul 45-48, 50-51see also TurkeyIzmit earthquake 46see also TurkeyJakarta 119, 198see also IndonesiaJamaica 74-76, 78, 81, 88-91, 184Japan 13-14, 34, 66, 95, 113, 185,196-197Joe Slovo 44, 50see also South AfricaJordan 96, 185Kabul 58, 69see also AfghanistanKabul Area Shelter and SettlementProject 58, 69Karachi 42, 69, 82, 155see also PakistanKenya 59, 70-71, 73, 81, 88, 98, 115,150, 160, 182, 188Khulna 41see also BangladeshKingston 74see also JamaicaKinshasa 82, 102see also Democratic Republicof the CongoKobe 14, 66, 95, 113see also JapanKumaresan, Jacob 95, 105Kuwait 105, 185Lagos 42, 69, 76-77, 82, 119, 135see also Nigerialandlords 25land sharing 67, 196
Strictly under embargo until Wednesday 22 September at 00:01 GMT (02:01 Geneva time)landslide(s) 21-22, 45, 56-57, 117, 121,143, 150, 162-163, 170-173, 175, 177,179, 181, 196land tenure 54, 56, 58, 67, 70-71, 196see also tenureland use 27, 65, 142-143, 146-147Lao People’s Democratic Republic 160,185Latin America 11-12, 19, 23, 28, 32-33,37, 43, 58, 64, 73, 76, 80, 82, 86, 89,91-93, 97-99, 105, 111, 137, 144, 147,152-153, 155-156see also AmericasLatin American Commission on Drugsand Democracy 89lethal weapons 74see also firearmsLiberia 87, 99, 172, 182life expectancy 34, 95, 104, 111lifestyle(s) 95, 98, 104-105, 110, 112livelihoods 16, 19, 21, 25-26, 28, 38,50-51, 53-55, 57, 61-63, 79, 115, 117,121, 133, 143, 192-193local authorities 8, 17, 27, 59, 77, 85,125, 142, 198see also local government(s)see also municipalitieslocal government(s) 11, 18, 21, 26-27,53-54, 56-61, 66-68, 77, 82, 86, 116,124-125, 131, 139, 142-147, 149-150,152-153, 156, 191-199see also central government(s)see also municipalitiesLocal Solidarity Programme 145see also Porto AlegreLondon 32, 44, 49, 51, 95, 97, 99, 123see also United KingdomLondon School of Economicsand Political Science 73, 89, 92Los Angeles 76, 107see also United States of Americalow-income group(s) 11, 14-15, 19,21-22, 25, 54, 56, 62, 127, 130, 133,142-143, 146, 193low-income nations 13, 20, 142, 148see also high-income nationssee also middle-income nationsLuzon 37-38see also PhilippinesMaking Cities Resilient 139, 191see also United Nations InternationalStrategy for Disaster Risk Reduction(UNISDR)malaria 96, 101, 105, 109, 121Malawi 59, 118, 182malnutrition 7, 37, 96, 99, 111MAMUCA (Community of centralAtlántida municipalities) 152, 154see also HondurasManagua 82, 143, 155see also NicaraguaManila 37-38, 57, 70, 104, 119, 156see also PhilippinesMauritania 99, 182measles 96, 101Medellín 86, 93see also Colombiamega-cities 17, 19, 31-32, 34, 38, 78,106-107, 137Mexico 42, 75-76, 78, 80-81, 83, 88-90,92, 103, 122, 184Middle East 98World Disasters Report 2010 – Index207
Strictly under embargo until Wednesday 22 September at 00:01 GMT (02:01 Geneva time)nations 12-15, 17, 19,21-22, 24-27, 31-32, 39-40, 117, 123-124, 128, 130-131, 140, 142, 147, 150,157see also high-income nationssee also low-income nationsmigration 31, 73, 101, 117, 137Millennium Development Goal(s) 8, 15,111, 139Minnig, Michel 87mitigation 50, 69, 79, 116, 123, 125,143, 146, 148-151, 154, 194Mogadishu 41-42see also SomaliaMonitoring, Mapping and Analysisof Disaster Incidents in South Africa(MANDISA) database 43, 49Morocco 150, 182Mozambique 28, 59, 75, 183Mumbai 17, 24, 29, 35, 70, 80, 86, 119see also IndiaMunich Re 20, 28, 38, 50-51, 162, 165municipalities 23-24, 27, 46-47, 56-57,79, 146-147, 149, 152, 193see also local authoritiessee also local government(s)Murano 140Myanmar 22, 35-36, 41-42, 160, 167,185Nairobi 17, 59, 73-76, 82, 96, 98, 115,150see also KenyaNairobi Urban Health and DemographicSurveillance System 96Namibia 59, 70, 183, 193208INDEXmiddle-incomeNatCat database 38, 50see also Munich ReNational Disaster Management Agency(BNPB) 148see also Indonesianatural hazards 31, 36, 50, 157Near Eastsee Middle EastNepal 59, 185New Delhi 47, 100-101, 110see also IndiaNew Orleans 13, 34-35, 65see also United States of AmericaNew York 97, 123see also United States of AmericaNicaragua 22, 81, 87, 92, 143, 146,157, 184Nigeria 42, 59, 69, 76, 119, 135, 183,188Ningbo 41-42see also Chinanon-communicable disease(s) 95, 97-98,104-106, 110see also diseasesee also infectious disease(s)non-governmental organization(s)(NGOs) 11, 55-56, 58-59, 100, 110,120-121, 134, 147, 153, 161North Africa 19, 98see also AfricaNorth America 14, 105see also AmericasNorway 87, 186Norwegian Red Cross 87obesity 97-98, 104-105
Strictly under embargo until Wednesday 22 September at 00:01 GMT (02:01 Geneva time)Oceania 12, 166-169, 174-176, 178,180-181, 187-188Office of Foreign Disaster Assistance(OFDA) 35, 161see also United States of AmericaOrganisation for EconomicCo-operation and Development(OECD) 11, 51, 92organized crime 74, 85, 90, 92see also crimeOrzechowski, Frank 99, 111OSSO (Seismic Observatory of theSouth-West) 42, 51Pachauri, Rajendra K. 118, 136Pacific 56, 98, 104Pakistan 35, 42, 59-60, 65, 83, 88, 91,96, 185, 198Panama 80-81, 184Pan American Health Organization(PAHO) 105, 111pandemic(s) 7, 101, 103Paraguay 80, 184Paris 51, 92, 107see also FrancePeru 65, 80-81, 83, 119, 122, 152, 154,156, 184, 192Philippines 13, 22, 37-38, 56-57, 59,70-71, 99, 104, 155-156, 160, 185Philippines Homeless People’sFederation (HPF) 56-57Phnom Penh 80see also CambodiaPisco 65-66, 192see also Perupneumonia 96, 101, 106political violence 74see also violencepollution 95, 100-101, 106, 108,122-123poor-quality housing 15, 19, 21, 26, 53,56, 128see also housingpopulation growth 7, 12, 19, 40, 120,140, 197Port-au-Prince 11, 13, 23-24, 34-35, 42,100, 140Porto Alegre 95, 145, 156see also Brazilpoverty 11, 15-16, 18, 21-22, 28-29,47, 50, 56, 68, 70, 73-74, 76, 79-82,85, 88, 90, 100-101, 108-111, 120-122,154-155, 157see also urban povertyPoverty Reduction Strategy Papers 68President Lula da Silva 64see also BrazilProgresiva 88public transport 21, 77, 86, 140Puerto Rico 161, 184Quito 120, 137, 157see also Ecuadorreconstruction 23-26, 54-56, 58, 60-62,65-66, 144, 146-147, 152, 192-193,199Red Cross Red Crescent 87see also International Committeeof the Red Cross (ICRC)see also International Federationof Red Cross and Red CrescentSocieties (IFRC)World Disasters Report 2010 – Index209
Strictly under embargo until Wednesday 22 September at 00:01 GMT (02:01 Geneva time)210INDEXRed CrossSociety of China 106-107Red Cross of Viet Nam 109relocation 23, 47, 54, 58-60, 62, 64,122, 130resettlement 25, 57, 65, 70resilience 20, 50, 70, 92, 122, 127, 129,131, 133, 135-136, 191-192, 195RespectED 87see also Canadian Red CrossRio de Janeiro 31, 75-76, 84, 90, 107see also Brazilrisk 7-8, 11-12, 14-24, 26-29, 31,33, 36, 38, 40-51, 54, 56-57, 59, 61,63-64, 67-68, 70, 78-80, 82, 87, 95-96,98-100, 102-104, 106-108, 115-125,127, 129, 131, 133-134, 136-137, 139-157, 164-165, 191-199rural population 3, 12, 17rural–urban migration 31Ryan, Michael J. 100, 103Safer Cities Programme 86see also United NationsHuman Settlements Programme(UN-Habitat)Saint-Louis 120, 132see also Senegalsalinization 117, 119, 125San Antonio de Areco 146see also ArgentinaSanayee Development Organization 58San Francisco 40, 152see also United States of Americasanitation 15-17, 21, 29, 34, 37, 62, 73,79, 95-97, 99, 121-122, 127, 139-140,143, 150, 162San Salvador 147see also El SalvadorSanta Fe 143, 148see also ArgentinaSão Paulo 76, 146see also BrazilSave the Children India 100savings groups 56, 58, 62, 67, 193see also community associationssea-level rise 40, 117, 119, 123-124Senegal 99, 115, 120, 157, 183severe acute respiratory syndrome(SARS) 102-103Shack/Slum Dwellers International(SDI) 58-59Shanghai 106, 119see also Chinashanty town(s) 11, 73, 81, 84see also informal settlement(s)see also slum(s)shelter 8, 23, 25, 28, 47, 58, 62-66, 69,95-96, 108, 115, 122, 162, 196Sichuan earthquake 22, 35, 160Sierra Leone 59, 87, 183Sierra Leone Red Cross Society 87Sigma database 165see also Swiss ReSingapore 103, 110, 119, 185slum dwellers 15, 22, 31, 58-59, 61, 79,86, 97-98, 100, 110, 115, 139
Strictly under embargo until Wednesday 22 September at 00:01 GMT (02:01 Geneva time)slum(s) 7, 11, 15, 22-23, 28, 31, 37-38,58-62, 64, 68-70, 73, 76-81, 84, 86-87,93, 95-101, 110, 112, 115, 128, 139,150, 154, 196see also informal settlement(s)see also shanty town(s)Small Arms Survey 75, 92social violence 73-74, 90see also violenceSomalia 41-42, 74-75, 160, 183South Africa 18, 43-44, 50-51, 59, 73,75, 77, 81, 87, 91, 98, 141, 153, 156,183, 197South African Red Cross Society 44South America 75see also AmericasSouth Asia 22see also Asiasee also South-East AsiaSouth Asian tsunamisee Indian Ocean tsunamiSouth-East Asia 22, 97, 103-104see also Asiasee also South AsiaSpain 35, 160, 187Spanish Red Cross 87, 144Sri Lanka 35, 59, 65, 87, 185standards 12, 15, 20, 34, 46-47, 61, 65,88, 128, 130, 139-140, 142, 193, 195Stein, Alfredo 54, 70storm(s) 12, 16-17, 21, 37-38, 40, 42,47, 54, 56, 61, 64, 115, 118-119, 121,124, 126-127, 129, 142, 152, 160, 162,192see also windstorm(s)storm surges 12, 56, 115, 119, 121, 124,192Strategic Forecasting Inc. (STRATFOR)75, 92Strategy 2020 133, 136see also International Federationof Red Cross and Red CrescentSocieties (IFRC)street children 82, 101see also childrensub-Saharan Africa 41, 51, 73, 76,97-98, 102, 139see also AfricaSudan 160, 183Sumatra 22, 160, 167see also IndonesiaSunday Tribune 124Swaziland 59, 183Swiss Re 162, 165Switzerland 35, 103, 137, 187Taiwan 160, 185Tanzania 42, 59, 118-119, 160, 183technological accident(s) 16Tegucigalpa 143, 150see also Hondurastenure 8, 24, 54, 56, 58-60, 65-67,70-71, 97, 128, 196see also land tenureThailand 35, 59, 64-65, 69, 104, 150,154, 185, 196The Lancet 97, 112Toronto 86see also Canadatraffic accident(s) 15, 37, 106-107, 139World Disasters Report 2010 – Index211
Strictly under embargo until Wednesday 22 September at 00:01 GMT (02:01 Geneva time)212INDEXtransportation 86, 108, 122-123, 127,129-131, 162Tropical Storm Ketsana 37-38tropical storm(s) 37-38, 118, 160tsunami 11, 28, 35, 53, 55, 62, 65, 69,71, 148-149, 153, 160, 167see also Indian Ocean tsunamituberculosis (TB) 95, 97, 101, 105, 109,151Turkey 13, 45, 50-51, 187see also IstanbulUganda 59, 74-75, 160, 183unemployment 24, 82, 86, 107-108,162United Arab Emirates 105, 186United Kingdom 95, 187United Nations 12, 28-29, 31, 51, 65,71, 73, 92-93, 96, 98, 111-112, 116,118, 135, 137, 139, 154, 157, 161,191-192United Nations Children’s Fund(UNICEF) 51, 90, 98, 101, 111-112United Nations DevelopmentProgramme (UNDP) 71, 81, 93, 162-163, 166-169, 175, 177, 179, 181,192-193United Nations Economic Commissionfor Latin America and the Caribbean(ECLAC) 80-81, 93United Nations Framework Conventionon Climate Change (UNFCCC) 116,130, 137, 156United Nations Human SettlementsProgramme (UN-Habitat) 15, 23, 29,31, 37, 50-51, 71, 73, 86, 92-93, 96-97,99-100, 112, 129, 137, 139, 157, 191United Nations International Strategyfor Disaster Risk Reduction (UNISDR)28-29, 51, 139, 154, 157, 159, 191-192, 194-199United Nations Joint Programme onHIV/AIDS (UNAIDS) 102United Nations Population Division 51United Nations Principles on Housingand Property Restitution for Refugeesand Displaced Persons 65United Nations Summit on ClimateChange 118United States Agency for InternationalDevelopment (USAID) 58, 161United States Department of State 93United States of America 13, 19, 35, 58,75-76, 89, 93, 95, 100, 103, 118, 160-161, 184, 188upgrading (slums) 24, 27, 46, 60, 64,67, 69, 71, 110, 128, 144, 150, 154,192, 196urban adaptation 127, 129-130, 135urban centres 11, 14, 16-17, 19-21, 31,36, 67, 85, 95-96, 98-99, 101-103, 105,115, 117, 123, 125, 142, 147urban development 16-18, 20, 24, 28,42, 45-46, 115, 139, 148, 150, 154,156, 191, 193, 196urban dwellers 14-16, 31, 37, 40, 42,47, 49, 73, 96-97, 102, 106, 197urban governance 8, 23, 110-111, 125,139urban growth 12, 31, 33, 41
Strictly under embargo until Wednesday 22 September at 00:01 GMT (02:01 Geneva time)urbanization 7-8, 11-12, 16-19, 27-29,32, 34, 40, 42, 47-48, 50-51, 69-71,73, 79-80, 86, 89-91, 97, 101, 105,108-109, 111-112, 115, 118, 120, 133,135-137, 140, 143, 154-157urban management 27, 139urban population 12, 14-15, 17, 24,31-32, 64, 97-98, 119, 125, 128, 150urban poverty 15-16, 18, 21, 28, 68,111, 155see also povertyurban risk(s) 7-8, 11, 29, 31, 38, 43-45,48-49, 95-96, 106, 191, 196urban violence 73-74, 76-77, 79-81,83-85, 87-89, 91-92, 112see also crimesee also violenceUruguay 80-81, 184Venezuela 80-81, 104, 143, 155, 184Venice 140Viet Nam 103, 109, 160, 186volcanic eruptions 56, 162, 170-176,178-181vulnerability 7, 11, 16, 20, 31, 39-40,45-47, 50-51, 56, 65, 69, 73, 117-122,125, 133, 135-137, 140, 143-144, 151-152, 155-156, 161, 195vulnerability gap 20, 45-46vulnerable people 8, 77water 7, 14-17, 21, 26, 29, 34, 37, 40,42, 44, 47, 53-54, 61-64, 67, 73, 79,95-97, 99-101, 104, 117-122, 124-127,129, 131, 139-141, 143, 147-148, 150,162, 193, 195, 197-198West Africa 75see also AfricaWest Antarctic ice sheet 123women 16, 26, 46, 55-56, 65, 77-78,80, 86, 101-103, 108, 112, 121-122,193World Bank 29, 50, 68, 91, 93, 106,112-113, 156-157, 163World Economic Forum 98, 113World Food Programme (WFP) 51,98-99, 112World Health Organization (WHO) 95,97, 100-101, 103-106, 108-109, 113World Meteorological Organization(WMO) 116, 133, 137World Urban Campaign 2009–2013191see also United NationsHuman Settlements Programme(UN-Habitat)WWF 119, 137Yangon 35-36, 41-42see also MyanmarYouth as Agents of Behavioural Changeprogramme 88see also International Federationof Red Cross and Red CrescentSocieties (IFRC)Zambia 59, 183Zedillo, Ernesto 89Zimbabwe 59, 80, 183World Disasters Report 2010 – Index213
214INDEXStrictly under embargo until Wednesday 22 September at 00:01 GMT (02:01 Geneva time)
The Fundamental Principlesof the International Red Crossand Red Crescent MovementHumanityThe International Red Cross and Red Crescent Movement, born of a desire tobring assistance without discrimination to the wounded on the battlefield,endeavours, in its international and national capacity, to prevent and alleviatehuman suffering wherever it may be found. Its purpose is to protect life andhealth and to ensure respect for the human being. It promotes mutualunderstanding, friendship, cooperation and lasting peace among all peoples.ImpartialityIt makes no discrimination as to nationality, race, religious beliefs, class orpolitical opinions. It endeavours to relieve the suffering of individuals, beingguided solely by their needs, and to give priority to the most urgent cases ofdistress.NeutralityIn order to continue to enjoy the confidence of all, the Movement may not takesides in hostilities or engage at any time in controversies of a political, racial,religious or ideological nature.IndependenceThe Movement is independent. The National Societies, while auxiliaries in thehumanitarian services of their governments and subject to the laws of theirrespective countries, must always maintain their autonomy so that they may beable at all times to act in accordance with the principles of the Movement.Voluntary serviceIt is a voluntary relief movement not prompted in any manner by desire forgain.UnityThere can be only one Red Cross or Red Crescent Society in any one country. Itmust be open to all. It must carry on its humanitarian work throughout itsterritory.UniversalityThe International Red Cross and Red Crescent Movement, in which all societieshave equal status and share equal responsibilities and duties in helping eachother, is worldwide.
The International Federationof Red Cross and Red CrescentSocieties promotes thehumanitarian activities ofNational Societies amongvulnerable people.By coordinating internationaldisaster relief andencouraging developmentsupport it seeks to preventand alleviate human suffering.The International Federation,the National Societies andthe International Committeeof the Red Cross togetherconstitute the InternationalRed Cross and Red CrescentMovement.“When our house flooded, I sometimes woke up atmidnight to find my feet in water, cockroaches and ratsfighting over space, and various objects floating around theliving room, so I had to get up in the middle of the night.Our biggest concern was preventing the furniture fromgetting ruined. Not that we had much to get ruined… Everytime it rained, we used to nail another piece of wood acrossthe doorframe, and dump another truckload of earth toreinforce the barricade. But every time it rained the waterlevel rose further. And the authorities never did anything.– President Lula da Silva, BrazilWorld Disasters Report 2010Focus on urban riskThis year’s World Disasters Report takes an in-depth look at the consequencesfor humanitarian action of the dramatic surge in the numbersof people living in cities and towns which will be the hallmark of the21st century. It examines the issues around this irreversible trend as theworld comes to terms with the fact that more people now live in citiesand towns than in the countryside for the first time in human history.Has development aid kept pace with this dramatic shift? Why arealmost a billion people worldwide still living in slums? How can vulnerablecities protect themselves from climate change? What are theemerging health issues of rapid urbanization? Can anything be doneto turn back the tide of violence sweeping many inner cities andghettos?The World Disasters Report 2010 features: Avoiding the urbanization of disasters Urban disaster trends Starting over:Community rights and post-disaster response Urban violence Urban risk to health Urbanization and climate change risk Urban governance and disaster risk reductionPlus: photos, tables, graphics and indexPublished annually since 1993, the WorldDisasters Report brings together the latesttrends, facts and analysis of contemporarycrises – whether ‘natural’ or man-made,quick onset or chronic.”