
Create successful ePaper yourself
Turn your PDF publications into a flip-book with our unique Google optimized e-Paper software.
Final report<br />
<strong>BB</strong> <strong>Centrum</strong> survey of<br />
tenant satisfaction 2012<br />
completed by NMS Market Research agency for company<br />
Prague, 30 September 2012
� Information about the research<br />
� Main findings<br />
� <strong>BB</strong> <strong>Centrum</strong> image<br />
� Transport and parking<br />
� Catering<br />
� Services in the <strong>BB</strong> <strong>Centrum</strong><br />
� Messages to <strong>BB</strong> <strong>Centrum</strong><br />
� Contact<br />
CONTENTS<br />
Slide 2
INFORMATION ABOUT THE<br />
RESEARCH<br />
Slide 3
INFORMATION ABOUT THE RESEARCH<br />
� This research relates to previous satisfaction surveys of <strong>BB</strong> <strong>Centrum</strong> tenants, completed in the years 2001, 2004<br />
and 2008.<br />
� The research took place on 4 – 17 June 2012.<br />
� Data collection method: online questionnaire.<br />
� 10 040 employees of companies residing in <strong>BB</strong> <strong>Centrum</strong> were invited to take part in the research.<br />
� At least 80% of the questionnaire was filled out by 2225 respondents, which is 22% of the overall number invited.<br />
� The data analysis used respondents who answered at least one question in the questionnaire – the analysis makes<br />
use of the answers of 2345 respondents.<br />
Otevřeli stránku, ale nic<br />
nevyplnili<br />
Vyplnili 1-79%<br />
Vyplnili 80-99%<br />
Vyplnili 100%<br />
6%<br />
4%<br />
20%<br />
17%<br />
24%<br />
29%<br />
47%<br />
54%<br />
0% 20% 40% 60%<br />
2012 (Celkové N=2919) 2008 (Celkové N=2634)<br />
Respondents in analysis:<br />
� 2012 N=2345<br />
� 2008 N=2488<br />
Slide 4
100%<br />
80%<br />
60%<br />
40%<br />
20%<br />
0%<br />
INFORMATION ABOUT THE RESEARCH<br />
Participation of companies renting spaces in <strong>BB</strong> <strong>Centrum</strong>:<br />
100%<br />
75%<br />
64% 63% 61% 61%<br />
50%<br />
48%<br />
43%<br />
41% 40% 38%<br />
35%<br />
30%<br />
28% 27% 25% 25%<br />
20%<br />
17% 15%<br />
8% 7% 7% 5% 3%<br />
Slide 5
INFORMATION ABOUT THE RESEARCH<br />
Representation of buildings in <strong>BB</strong> <strong>Centrum</strong>:<br />
Filadelfie<br />
Building B<br />
Building A & GAMMA<br />
Building C<br />
Building Alpha<br />
Building Beta<br />
Office Park I,II<br />
Building E<br />
Building D<br />
1%<br />
3%<br />
3%<br />
2%<br />
5%<br />
8%<br />
20%<br />
23%<br />
36%<br />
0% 10% 20% 30% 40% 50%<br />
Slide 6
<strong>BB</strong> CENTRUM EMPLOYEES<br />
� The typical employee of <strong>BB</strong> <strong>Centrum</strong> is 30 - 35 years old and childless (55%).<br />
� Comes from a household with a 21 – 50 000 monthly income (53%).<br />
� Has worked at <strong>BB</strong> <strong>Centrum</strong> almost a year (40%) – his or her company has moved into<br />
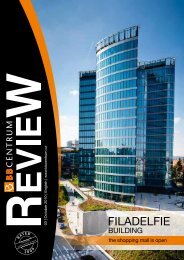
the Filadelfie building (36%).<br />
� Works as an IT specialist (18%), administrator (17%) or middle management (16%).<br />
� Commutes to work exclusively or mostly on public transport including the <strong>BB</strong><br />
<strong>Centrum</strong> shuttle service.<br />
� Eats at the canteen daily (24%) or at least 3 times a week (32%). Several times a year<br />
he or she visits one of the restaurants in the complex, most likely Mango or Pizzeria<br />
Grosseto.<br />
� Of the services in the complex, he or she most often makes use of Albert<br />
supermarket, dm drug store and post office, also visits Baar’s park.<br />
� Has never been to Balance Club Brumlovka.<br />
Slide 7
Woman<br />
50%<br />
I do not<br />
wish to<br />
say<br />
28%<br />
Nonbeliever<br />
10%<br />
Believer<br />
62%<br />
Men<br />
50%<br />
SOCIODEMOGRAPHICS<br />
Respondent gender Age distribution<br />
36-39<br />
19%<br />
To which church or religion do you subscribe?<br />
40 or<br />
more<br />
24%<br />
30-35<br />
33%<br />
21-29<br />
24%<br />
None<br />
55%<br />
The graph is based on all respondents (N=min.1148).<br />
How many children do you have?<br />
4 or<br />
more<br />
1%<br />
1 child<br />
17%<br />
3<br />
children<br />
3%<br />
Number of<br />
<strong>comments</strong><br />
2<br />
children<br />
24%<br />
Percentage<br />
of<br />
<strong>comments</strong><br />
Catholic, Roman Catholic 115 49%<br />
Protestant, Husite, Czech brothers and<br />
other Reformation movements<br />
30 13%<br />
Christian, non-specified, orthodox 30 13%<br />
Seventh day Adventists 6 3%<br />
Islam 4 2%<br />
Other, non-believer 32 14%<br />
Other 17 7%<br />
Total 234 100%<br />
Slide 8
SOCIODEMOGRAPHICS<br />
What is the total monthly income of your whole household?<br />
up to 15 thousand CZK<br />
16 to 20 thousand CZK<br />
21 to 30 thousand CZK<br />
31 to 40 thousand CZK<br />
41 to 50 thousand CZK<br />
51 to 71 thousand CZK<br />
72 až 82 thousand CZK<br />
83 až 101 thousand CZK<br />
102 tis. Kč až více<br />
1%<br />
3%<br />
5%<br />
7%<br />
8%<br />
16%<br />
18%<br />
19%<br />
53%<br />
23%<br />
0% 10% 20% 30%<br />
The graph is based on all respondents (N=1148).<br />
Slide 9
What is your work position at your place of employment?<br />
IT specialist<br />
clerk/administration<br />
intermediate management<br />
accountant, financial specialist<br />
marketing<br />
business or commercial representative<br />
consultant<br />
secretary / assistant<br />
client services<br />
human resources<br />
lawyer<br />
other<br />
3%<br />
2%<br />
1%<br />
SOCIODEMOGRAPHICS<br />
5%<br />
5%<br />
4%<br />
6%<br />
12%<br />
12%<br />
18%<br />
17%<br />
16%<br />
0% 10% 20% 30%<br />
The graph is based on all respondents (N=1148).<br />
How many years have you been working at <strong>BB</strong> <strong>Centrum</strong>?<br />
less than 1 year<br />
1 to 2 years<br />
3 to 4 years<br />
5 to 6 years<br />
7 to 8 years<br />
9 to 10 years<br />
7%<br />
10%<br />
13%<br />
15%<br />
15%<br />
40%<br />
0% 10% 20% 30% 40% 50%<br />
Slide 10
MAIN FINDINGS<br />
Slide 11
POSITIVELY<br />
EVALUATED<br />
<strong>BB</strong> CENTRUM EVALUATION IMPROVED IN ALL ASPECTS<br />
WHEN COMPARED TO 2008.<br />
� Locale<br />
� Transport availability<br />
� Complex cleanliness<br />
� Canteen atmosphere,<br />
staff and opening hours<br />
� Building entrance<br />
interior<br />
� Shuttle transport<br />
� Baar’s park<br />
VS.<br />
� Availability of public parking<br />
� Breadth of stores and<br />
services<br />
� Building utilities<br />
� Price level of services<br />
(parking, canteen prices,<br />
restaurants, Balance Club)<br />
� Quality of canteen food<br />
WORSE<br />
EVALUATION<br />
Slide 12
USAGE OF STORES AND SERVICE POTENTIAL<br />
MOST COMMONLY USED<br />
SERVICES<br />
Albert<br />
dm drug store<br />
Czech post office<br />
<strong>BB</strong> <strong>Centrum</strong> pharmacy<br />
Mango Chinese<br />
restaurant<br />
Baar's park<br />
POTENTIAL FOR NEW SERVICES<br />
New food services: modern<br />
Czech cuisine<br />
Day-care/Kindergarten*<br />
Balance Club*<br />
Shoe shop, shoe<br />
repairs<br />
* if the price level were lower<br />
Slide 13
OVERALL <strong>BB</strong> <strong>Centrum</strong> image - summary<br />
MAIN FINDINGS<br />
� The overall evaluation of <strong>BB</strong> <strong>Centrum</strong> improved in all parameters in comparison to the last<br />
wave. A positive evaluation was foremost given for complex cleanliness, entrance interiors of<br />
buildings and the locale.<br />
� Worse evaluated were primarily:<br />
� Availability of public parking – the employees miss more free parking spaces, the price of<br />
the paid parking seems too high to them.<br />
� Availability of shops and services – they miss a broader range of shops and services, but at<br />
the same time employees are noticing that the situation is improving (newly opened<br />
shops).<br />
� The level of the buildings’ utilities and office spaces – employees complain mostly about<br />
the operation of the lifts (buildings Filadelfie, Gamma) and air conditioning.<br />
� The best evaluated building is Alpha, the worst evaluation was gained by Filadelfie, which was<br />
at the same time evaluated by the most employees.<br />
� There were often complaints about the price levels of individual services (parking, canteen,<br />
restaurants, Balance Club Brumlovka), at times of worsened finances they would like cheaper<br />
equivalents of the services offered.<br />
� Part of the employees is not convinced there is general knowledge of <strong>BB</strong> <strong>Centrum</strong>.<br />
Slide 14
TRANSPORT TO <strong>BB</strong> CENTRUM<br />
MAIN FINDINGS<br />
� Most employees travel to <strong>BB</strong> <strong>Centrum</strong> using public transport, while half of employees make<br />
use of the <strong>BB</strong> <strong>Centrum</strong> shuttle transport several times a week. 85% of those making use of<br />
the <strong>BB</strong> <strong>Centrum</strong> bus transport, consider it satisfactory. The frequency of <strong>BB</strong> <strong>Centrum</strong> buses<br />
during the morning rush hours could be higher, or better coordinated with Prague Integrated<br />
Transport, this would solve the problem of buses overfilling.<br />
� Developer feedback:<br />
Due to the new changes in the timetables of Prague Integrated Transport starting in early September, we will<br />
be trying our best to coordinate the times of our shuttle transport to the new conditions and adjust the periods<br />
between trips. Sadly we are unable to influence cases where the municipal transport buses arrive late, which<br />
then has the consequence of occasional discordance between municipal lines and the <strong>BB</strong> <strong>Centrum</strong> buses. We<br />
believe however that with the new timetable of the shuttle transport, these situations will happen only rarely.<br />
Slide 15
PARKING IN THE <strong>BB</strong> CENTRUM<br />
MAIN FINDINGS<br />
� Parking remains a sensitive issue, employees draw attention to insufficient free parking lots<br />
and they find the prices of paid parking too high. According to employees, even their clients<br />
have problems with parking in the area around <strong>BB</strong> <strong>Centrum</strong> – they search for available free<br />
parking spaces in the surrounding area.<br />
� Developer feedback:<br />
The problem of transport in this locale can be divided into two basic levels, that is mobile transport and static transport.<br />
Concerning mobile transport we are concerned about the problems of comfortable transport availability into the complex<br />
and out, tied in with the overall transport system and further free-moving transport flow, i.e. throughput capacity of the<br />
crossroads within the complex itself. Regarding connectivity of the complex to key roads we think this satisfies all the<br />
criteria of a quality connection to all transport avenues. The last task in this area is ensuring a direct connection in<br />
Vyskočilova st. towards Brno by creating a return ramp behind the highway underpass. In this regard we have succeeded<br />
in convincing the Prague Highways Authority (responsible for the highway) of the necessity and feasibility of this structure<br />
and currently area and zoning proceedings have been concluded and a final decision regarding the placement of the<br />
structure has been issued. Work now continues on the level of construction proceedings.<br />
Concerning capacity throughput of the crossroads as well as the overall flow of transport in the area, in the past years we<br />
have completed several major modifications to the crossroads of Vyskočilova and Michelská and Vyskočilova at the 5.<br />
května ramp in cooperation with the Municipal Authority for Prague 4 as well as the Czech Police Department. At the<br />
same time we have provided financial support towards reconstruction of Michelská street, where works should be<br />
concluded in November of this year. Together with this reconstruction, all major construction work and modifications to<br />
the transport frame surrounding the <strong>BB</strong> <strong>Centrum</strong> area and the immediate surroundings should be complete.<br />
Slide 16
MAIN FINDINGS<br />
At the same time, after Michelská street is once more reopened and traffic resumes along with a stabilising of all<br />
transport avenues, our company will, in cooperation with the Prague City Hall and Transport Authority, ensure a complex<br />
evaluation of optimal traffic light settings on all three key crossroads in Vyskočilova street, that is Vyskočilova and<br />
Michelská; Vyskočilova and Václava Sedláčka; Vyskočilova and the 5. května ramp. Within static transport we are<br />
concerned with the problem of parking, both in above-ground parking lots as well as parking underneath the individual<br />
structures.<br />
From a legal standpoint we are required to create a minimum number of parking spaces to go with each structure, and<br />
this calculation is strictly determined by the appropriate ordinance. Here we should emphasize that we always provide at<br />
least 10 – 15% more parking spaces over this minimum amount. Apart from that we are working on independent parking<br />
spaces, such as public parking in the Balance Club structure or Filadelfie, and are further working on public parking spaces<br />
in the Baar’s residential park structure. At the same time we operate and offer further parking spaces in several aboveground<br />
lots. From this viewpoint and especially considering our knowledge of the to-capacity utilization of these spaces<br />
we can say that the parking reserves are sufficient. The basic problem is the financial burden of acquiring and operating<br />
these services, especially the payment of this service. Here we have remained barely at the level of our acquirement and<br />
operational costs and don’t consider ourselves to be above the surrounding parking price levels, including those spaces<br />
belonging to the city, whose investment costs were footed by the taxpayer. We are currently unable to function according<br />
to the shopping mall model, where “free” parking for multiple hours is refunded through the prices of goods and services<br />
within the complex. Here we have to emphasize that we are a purely commercial company, similarly to your employers<br />
and we provide standard services which have their cost burden, nevertheless this services is provided on a not-for profit<br />
basis. We of course are aware of the unpleasant nature of the problem and taking into account the aforementioned facts<br />
we continue to look for ways to increase the availability of this service to more customers.<br />
One point concerning satisfaction with the manner of operating the parking lots is staff behaviour. We are aware that the<br />
human factor plays a crucial role here, and that there may sometimes be minor conflicts, which is why we are<br />
continuously trying to resolve this issue with the operator. Parking lot employees have been trained to address these<br />
concerns, but we will definitely re-evaluate the activities of individual staff members with the operator once more based<br />
on this survey.<br />
Slide 17
BUILDING UTILITIES<br />
MAIN FINDINGS<br />
� Employees are above-all complaining about lift operation (FILADELFIE and Gamma<br />
buildings) and air-conditioning. The best evaluated building is Alpha, the worst<br />
evaluation was for FILADELFIE, which was at the same time evaluated by the most<br />
employees.<br />
�Developer feedback:<br />
In the Filadelfie building there were changes in software to increase the transport capacity of the lifts,<br />
originally programmed to transport six persons. Currently the lifts transport nine persons. In the immediate<br />
future we will have also completed the preparation of office space for new tenants. This will increase the<br />
number of lifts conveying persons to a total of six. The empty buttons on the control panel have been<br />
reprogrammed to use double digits and it is now enough to press a single button when calling a lift to floors<br />
17, 16, 15 and 14, instead of two, improving lift operation. We have also added floor announcement for the<br />
floor the lift is currently in. Concerning the other buildings in the complex, we will provide detailed<br />
information including <strong>comments</strong> to the <strong>BB</strong> <strong>Centrum</strong> building owners and administrators.<br />
Slide 18
CANTEEN MEALS<br />
MAIN FINDINGS<br />
� ¾ of employees visit a canteen at least once a week. Employees are satisfied with<br />
the canteen environment, staff and opening hours, but in comparison to 2008,<br />
the number of daily visitors to the canteens has reduced (by 22%), which may<br />
have something to do with a dissatisfaction with the price level and food quality.<br />
�Developer feedback:<br />
As a matter of course we will hand over the detailed results of the research and <strong>comments</strong> concerning each<br />
individual canteen to the management of the separate premises and building owners. We trust that in cases<br />
where people noted negative occurrences, things diners miss and things they appreciate, this will lead to<br />
appropriate reflexion and improvement.<br />
Slide 19
SERVICES IN <strong>BB</strong> CENTRUM<br />
MAIN FINDINGS<br />
� Employees most often gain information concerning services/shops in <strong>BB</strong> <strong>Centrum</strong> from colleagues or the<br />
company intranet. Almost a third also read the <strong>BB</strong> <strong>Centrum</strong> Review or e-Review.<br />
� Most commonly used are the general goods shops: Albert supermarket, dm drug store, Czech post office and<br />
pharmacy, their opening hours are sufficient for most employees.<br />
� 90% of the research participants have visited one of the restaurants in the <strong>BB</strong> <strong>Centrum</strong> complex. The most<br />
commonly visited are the Chinese restaurant Mango and the vegetarian restaurant Maranatha.<br />
� The newly opened businesses such as Spar City and Hájek – Hájková cake shop meet the employees demands.<br />
These would also welcome a broader range of restaurants, they miss traditional Czech cuisine (30%). Thirteen<br />
per cent of the survey participants would prefer to go to a cheap restaurant, irrespective of the type of food<br />
served. Higher prices of meals were noted by people in most of the restaurants in the <strong>BB</strong> <strong>Centrum</strong> complex. Out<br />
of possible services, there would be room for a shoe repair shop.<br />
�Developer feedback:<br />
From September in the shopping passage of the Filadelfie building, more specifically in the Net Industry laundry<br />
and cleaning store, we have opened a shoe collection service. Further if possible we are trying to meet the wishes of<br />
our tenants and so are negotiating with restaurant providers the tenants would like. Currently there are two more<br />
administrative buildings being built (building G and building Delta), where there is potential for Czech cuisine.<br />
Concerning the prices of meals served in the <strong>BB</strong> <strong>Centrum</strong> restaurants – due to the fact that the operators of these<br />
restaurants have to pay rent for their spaces and have invested quite significant resources into the furnishing and<br />
utilities, it is not possible for them to have lower prices than in the canteens, which are free of such costs.<br />
Slide 20
SERVICES IN <strong>BB</strong> CENTRUM<br />
MAIN FINDINGS<br />
� 2/3 of employees visit Baar’s park, which they evaluate very positively as a pleasant place to rest. Only a small<br />
number of respondents have ever visited the Community centre (14%). The multifunctional sports-ground is<br />
mainly popular among respondents under 30 years. 12% of employees have visited it at some time.<br />
� 24% of employees have visited Balance Club Brumlovka at one time or another. Balance Club Brumlovka<br />
garnered a high number of <strong>comments</strong> – interest in making use of the services of Balance Club, the advantage of<br />
its location close to the workplace as well as the offer of services. But most employees find the yearly<br />
membership too expensive and miss the possibility of one-off entrance. Members of the Balance Club are most<br />
often employees aged 30 – 35 years. Members of the club praise the level of services, but even they mention the<br />
high price of membership.<br />
�Developer feedback:<br />
Significant reductions in prices would without a doubt attract a number of new people to Balance club. The overall<br />
reduction in income of the club however – a direct result of such – would necessarily come with a number of crucial<br />
(in my opinion) negative changes. To avoid the red ink it would be necessary to severely restrict services, equipment<br />
quality, hygiene standards and overall change the club’s orientation. This would assuredly lead to the<br />
disappointment and departure of a number of current members. This is all a question of the ratio between the<br />
quality of services provided and the prices asked. <strong>BB</strong> <strong>Centrum</strong> attempts to provide the highest possible quality<br />
standards for services in our area. Balance Club Brumlovka is an integral part of this effort. This doesn’t mean to<br />
say that a different kind of club with “popular prices” wouldn’t attract patrons.<br />
� Of the new projects, employees would welcome above all a nursery school (93%, depending on the prices),<br />
conference rooms (83%) and hotel (61%) which could be used to accommodate company clients. Most consider<br />
new flats as less appropriate (55%).<br />
Slide 21
<strong>BB</strong> CENTRUM IMAGE<br />
Slide 22
EVALUATION OF <strong>BB</strong> CENTRUM HAS IMPROVED IN ALL PARAMETERS IN COMPARISON TO LAST WAVE.<br />
THE BEST EVALUATION OF <strong>BB</strong> CENTRUM WAS CONCERNING CLEANLINESS, THE QUALITY OF THE<br />
BUILDING INTERIORS AND WAS FURTHER POSITIVELY EVALUATED DUE TO ITS LOCALITY.<br />
�The worst evaluation is still the availability of public parking.<br />
Q01: What is your overall evaluation of <strong>BB</strong> <strong>Centrum</strong> in the following parameters?<br />
complex cleanliness<br />
quality of interior entrance areas<br />
locality<br />
transport availability<br />
architecture of the <strong>BB</strong> <strong>Centrum</strong> complex<br />
level of social services<br />
building surroundings<br />
public knowledge of the position of <strong>BB</strong> <strong>Centrum</strong><br />
quality of office space<br />
availability of services<br />
technical qualities of the buildings (lifts, entrance …<br />
availability of public parking spaces<br />
19%<br />
39%<br />
39%<br />
37%<br />
37%<br />
59%<br />
55%<br />
54%<br />
48%<br />
50%<br />
47%<br />
19%<br />
73%<br />
36%<br />
30%<br />
34%<br />
30%<br />
23%<br />
24%<br />
33%<br />
27%<br />
32%<br />
62%<br />
30%<br />
21%<br />
22%<br />
22%<br />
19%<br />
22%<br />
21%<br />
25%<br />
31%<br />
29%<br />
33%<br />
The graph is based on all respondents (N=min. 2237).<br />
6%<br />
11%<br />
0% 20% 40% 60% 80% 100%<br />
really satisfied (1,2) neutral(3,4) dissatisfied(5-10)<br />
Change<br />
compared to<br />
2008<br />
Skóre Skóre<br />
68% +27%<br />
49% +30%<br />
33% +17%<br />
32% +2%<br />
30% +16%<br />
28% +16%<br />
26% +33%<br />
14% +10%<br />
8% +12%<br />
8% +4%<br />
4% +4%<br />
-44% +7%<br />
Slide 23
THE OVERALL BEST EVALUATED BUILDING IS ALPHA, THEIR EMPLOYEES ARE MOST SATISFIED WITH THE CLEANLINESS OF<br />
THE COMPLEX AND THE LOCALE. LEAST SATISFIED ARE THE EMPLOYEES IN THE FILADELFIE BUILDING - THEY EVALUATE AS<br />
WORSE MAINLY THE AVAILABILITY OF PUBLIC PARKING, SHOPS, SERVICES AND BUILDING UTILITIES.<br />
Q01: How to you evaluate <strong>BB</strong> <strong>Centrum</strong> overall in the following parameters? – TŘÍDĚNÍ PODLE BUDOV<br />
Budova Alpha<br />
(N=min.96)<br />
Budova D<br />
(N=min.17)<br />
Office Park I,II<br />
(N=min.53)<br />
Budova A &<br />
GAMMA<br />
(N=min.439)<br />
Budova E<br />
(N=min.51)<br />
Budova C<br />
(N=min.176)<br />
Budova Beta<br />
(N=min.58)<br />
Budova B<br />
(N=min.517)<br />
Filadelfie<br />
(N=min.748)<br />
Average evaluation<br />
of building in all<br />
categories followed.<br />
Index<br />
Čistota<br />
areálu<br />
Úroveň<br />
vstupních<br />
interiérů<br />
budov<br />
Index values:<br />
10 = VERY SATISFIED<br />
1 = VERY DISSATISFIED<br />
Lokalita<br />
Dopravní<br />
dostupnost<br />
Architektonické<br />
řešení<br />
komplexu <strong>BB</strong><br />
Centra<br />
Úroveň<br />
sociálního<br />
zařízení<br />
Okolí budov<br />
Veřejné<br />
povědomí o<br />
umístění <strong>BB</strong><br />
Centra<br />
Úroveň<br />
kancelářských<br />
prostor<br />
Dostupnost<br />
obchodů a<br />
služeb<br />
Technické<br />
vybavení<br />
budov<br />
8,3 9,1 8,8 9,0 8,7 8,7 8,0 8,4 8,3 8,1 7,9 7,7 6,9<br />
8,2 9,2 8,7 8,3 8,8 8,4 8,1 8,2 8,8 8,3 8,3 8,4 5,0<br />
8,1 9,0 8,5 8,8 8,8 8,6 7,5 8,3 7,8 7,7 7,9 8,5 5,6<br />
8,0 9,0 8,7 8,8 8,3 8,4 8,3 8,2 8,1 7,8 8,2 6,9 5,8<br />
8,0 9,1 8,9 8,3 8,5 8,3 8,1 8,1 8,2 7,2 7,5 8,7 5,4<br />
7,9 8,6 8,0 8,9 8,6 8,2 7,3 8,0 8,1 7,0 8,1 7,5 7,0<br />
7,8 9,1 8,4 8,5 8,3 7,7 8,0 7,8 7,4 8,1 7,8 7,6 5,5<br />
7,5 8,7 8,1 8,7 8,6 8,0 6,9 7,8 7,9 6,4 7,7 7,6 4,0<br />
7,2 8,9 8,5 6,3 6,7 7,5 8,2 7,5 6,9 7,3 6,4 6,4 5,6<br />
Slide 24<br />
Dostupnost<br />
veřejných<br />
parkovišť
HOW TO YOU EVALUATE <strong>BB</strong> CENTRUM OVERALL IN THE FOLLOWING PARAMETERS? -<br />
COMMENTS<br />
Q01. Comments - Locality<br />
Number of Percentage of<br />
<strong>comments</strong> <strong>comments</strong><br />
Bad availability, far from Underground (Metro) 61 46%<br />
Far from home 22 16%<br />
Busy and dirty area, close to the highway 18 13%<br />
Good availability from the city centre 18 13%<br />
Other <strong>comments</strong> 15 11%<br />
Total 134 100%<br />
Q01. Comments – Architectonic solutions for the <strong>BB</strong> <strong>Centrum</strong> complex<br />
Technical problems with lifts and stairways, inability<br />
of opening windows, inappropriate route to building<br />
Number of<br />
<strong>comments</strong><br />
Percentage of<br />
<strong>comments</strong><br />
23 22%<br />
Unorganised, overfilled 19 18%<br />
Nothing special, usual standard, boring 17 16%<br />
Praise - unique, interesting 13 12%<br />
Too much class, impersonal, sterile, too much metal and concrete 12 11%<br />
Other <strong>comments</strong> 21 20%<br />
Total 105 100%<br />
Slide 25
HOW TO YOU EVALUATE <strong>BB</strong> CENTRUM OVERALL IN THE FOLLOWING PARAMETERS? -<br />
COMMENTS<br />
Q01. Comments – Building surroundings<br />
Number of Percentage of<br />
<strong>comments</strong> <strong>comments</strong><br />
Missing greenery, parks with seats 54 47%<br />
Too much traffic congestion 13 11%<br />
Annoying cigarette butts, restricting smoking at the<br />
entrances welcome<br />
10 9%<br />
Buildings cramped together 10 9%<br />
Construction site close, noise levels 7 6%<br />
Disgusting, the park isn't clean, noise and smell 6 5%<br />
Other <strong>comments</strong> 14 12%<br />
Total 114 98%<br />
Q01. Comments – Complex cleanliness<br />
Number of<br />
<strong>comments</strong><br />
Percentage of<br />
<strong>comments</strong><br />
Mess is annoying, smoker smells 14 30%<br />
No problems, satisfaction 12 26%<br />
Mess around the buildings, homeless 11 24%<br />
Other <strong>comments</strong> 9 20%<br />
Total 46 100%<br />
Slide 26
HOW TO YOU EVALUATE <strong>BB</strong> CENTRUM OVERALL IN THE FOLLOWING PARAMETERS? -<br />
COMMENTS<br />
Q01. Comments – Availability of public parking<br />
Number of Percentage of<br />
<strong>comments</strong> <strong>comments</strong><br />
Parking space is expensive, don't want to pay 120 38%<br />
Marked shortage of parking spaces 99 31%<br />
Doesn't use 76 24%<br />
Cheap short-term parking 10 3%<br />
Other <strong>comments</strong> 11 3%<br />
Total 316 100%<br />
Q01. Comments – Transport availability<br />
Number of Percentage of<br />
<strong>comments</strong> <strong>comments</strong><br />
Insufficient bus transport, waiting times, overfilling 128 63%<br />
When commuting it is very important where you are<br />
commuting from<br />
15 7%<br />
Bad in-roads and off-roads from the motorway 11 5%<br />
Too few parking spaces, expensive parking 7 3%<br />
Appreciation of <strong>BB</strong>C buses, overall praise 6 3%<br />
Other <strong>comments</strong> 34 17%<br />
Total 201 99%<br />
Slide 27
HOW TO YOU EVALUATE <strong>BB</strong> CENTRUM OVERALL IN THE FOLLOWING PARAMETERS? -<br />
COMMENTS<br />
Q01. Comments – Availability of shops and services<br />
Number of Percentage of<br />
<strong>comments</strong> <strong>comments</strong><br />
Missing other services, more shops 51 33%<br />
Satisfaction, it's getting better 30 19%<br />
Missing ordinary restaurants, insufficient capacities,<br />
larger offer<br />
27 17%<br />
Everything pointlessly luxury, prices exaggerated 17 11%<br />
Bad availability, opening hours 12 8%<br />
Other <strong>comments</strong> 18 12%<br />
Total 155 100%<br />
Q01. Comments – Level of the building entrance interiors<br />
Number of Percentage of<br />
<strong>comments</strong> <strong>comments</strong><br />
Insufficient technical utilities, stairways or bad solutions 15 29%<br />
Not problem, satisfaction, wonderful 11 21%<br />
Bad flower display 5 10%<br />
Smell 5 10%<br />
An older building 4 8%<br />
Other <strong>comments</strong> 9 17%<br />
Total 49 94%<br />
Slide 28
HOW TO YOU EVALUATE <strong>BB</strong> CENTRUM OVERALL IN THE FOLLOWING PARAMETERS? -<br />
COMMENTS<br />
Q01. Comments – Level of the office spaces<br />
Number of<br />
<strong>comments</strong><br />
Percentage of<br />
<strong>comments</strong><br />
Problems with air-conditioning (bad air, unable to<br />
open windows, heat)<br />
104 42%<br />
Don't like open space 61 25%<br />
Overall worse standard of some of the buildings, old<br />
furniture, equipment failures<br />
35 14%<br />
Problems with lighting 10 4%<br />
Breaking hygiene norms (for instance too few toilets,<br />
mess, presence of beetles)<br />
9 4%<br />
Nice offices, good use of space 7 3%<br />
Impersonal surroundings (too few flowers, rest areas) 6 2%<br />
Other <strong>comments</strong> 16 6%<br />
Total 248 100%<br />
Slide 29
HOW TO YOU EVALUATE <strong>BB</strong> CENTRUM OVERALL IN THE FOLLOWING PARAMETERS? -<br />
COMMENTS<br />
Q01. Comments – Level of utilities in buildings<br />
Number of Percentage of<br />
<strong>comments</strong> <strong>comments</strong><br />
Not enough toilets 56 33%<br />
Annoying smell, air-conditioning switched off 23 13%<br />
Old, rundown and non-functioning equipment, bad<br />
lighting<br />
22 13%<br />
Showers missing 20 12%<br />
Needs more frequent cleaning and filling up of<br />
sanitary utensils<br />
19 11%<br />
Satisfaction, the toilets are clean 11 6%<br />
Other <strong>comments</strong> 21 12%<br />
Total 172 100%<br />
Q01. Comments – Public knowledge about the placement of <strong>BB</strong> <strong>Centrum</strong><br />
Number of<br />
<strong>comments</strong><br />
Percentage of<br />
<strong>comments</strong><br />
Not many people know where <strong>BB</strong> <strong>Centrum</strong> is, or that<br />
such a thing as <strong>BB</strong> <strong>Centrum</strong> even exists<br />
17 40%<br />
General knowledge is good or even amazing 15 35%<br />
It's hard to explain where we work and which building<br />
is which<br />
4 9%<br />
Other <strong>comments</strong> 5 12%<br />
Total 41 95%<br />
Slide 30
HOW TO YOU EVALUATE <strong>BB</strong> CENTRUM OVERALL IN THE FOLLOWING PARAMETERS? -<br />
COMMENTS<br />
Q01. Comments – BUILDING UTILITIES<br />
Number of<br />
<strong>comments</strong><br />
Percentage of<br />
<strong>comments</strong><br />
Problems with lifts (overloading, faults, programming,<br />
speed)<br />
295 73%<br />
Problems with air-conditioning 43 11%<br />
Missing stairwells, or badly secured (building Gamma) 26 6%<br />
Problems with turnstiles at entrance 9 2%<br />
Old furnishings 7 2%<br />
Problematic accessibility of fire escapes, bad escape<br />
routes, problematic fire alarms<br />
5 1%<br />
Other <strong>comments</strong> 22 5%<br />
Total 407 100%<br />
Concerns primarily buildings<br />
Filadelfie and Gamma.<br />
Slide 31
TRANSPORT AND PARKING<br />
Slide 32
MOST EMPLOYEES COMMUTE TO <strong>BB</strong> CENTRUM BY PUBLIC TRANSPORT.<br />
�The number of employees commuting to work only by car has dropped.<br />
Q02: How do you commute to work?<br />
only public transport<br />
by car and public transport,<br />
mostly public transport<br />
by car and public transport,<br />
mostly car<br />
only by car<br />
I walk to work<br />
5%<br />
3%<br />
15%<br />
16%<br />
14%<br />
25%<br />
23%<br />
24%<br />
41%<br />
34%<br />
0% 10% 20% 30% 40% 50%<br />
2012 2008<br />
The graph is based on all respondents (N=2325).<br />
Slide 33
MOST EMPLOYEES OF THE FILADELFIE BUILDING COMMUTE TO <strong>BB</strong> CENTRUM BY PUBLIC<br />
TRANSPORT. IN THE OTHER BUILDINGS THERE IS A HIGHER RATIO OF THOSE GOING BY CAR.<br />
�Despite the differences between Filadelfie and the rest of the <strong>BB</strong> <strong>Centrum</strong>, the number of<br />
employees who only go to work by car has dropped (on average 14% in 2012).<br />
Q02: How do you get to work?<br />
only public transport<br />
by car and public transport,<br />
mostly public transport<br />
by car and public transport,<br />
mostly car<br />
only by car<br />
I walk to work<br />
4%<br />
5%<br />
3%<br />
10%<br />
17%<br />
16%<br />
9%<br />
25%<br />
26%<br />
23%<br />
17%<br />
24%<br />
36%<br />
34%<br />
0% 25% 50%<br />
52%<br />
2012 Filadelfie 2012 Other buildings 2008 Total<br />
The graph is based on all respondents (Filadelfie N=797; others N=1528).<br />
Slide 34
THE AVAILABILITY OF <strong>BB</strong> CENTRUM BY CAR IS EVALUATED AS BETTER THAN IN 2008.<br />
Q03: Do you consider the availability of <strong>BB</strong> <strong>Centrum</strong> by car sufficient?<br />
100%<br />
80%<br />
60%<br />
40%<br />
20%<br />
0%<br />
5% 4%<br />
11% 14%<br />
53%<br />
32%<br />
60%<br />
22%<br />
2012 2008<br />
definitely yes rather yes<br />
rather not definitely not<br />
Building Beta<br />
Building D<br />
Building Alpha<br />
Office Park I,II<br />
Building C<br />
Building A & GAMMA<br />
Building E<br />
Building B<br />
Filadelfie<br />
44%<br />
43%<br />
42%<br />
39%<br />
37%<br />
34%<br />
33%<br />
29%<br />
23%<br />
The graph is based on respondents who at least sometimes travel<br />
to <strong>BB</strong> <strong>Centrum</strong> by car (N=min. 1248).<br />
52%<br />
52%<br />
52%<br />
43%<br />
50%<br />
54%<br />
55%<br />
56%<br />
58%<br />
7%<br />
9%<br />
12%<br />
17%<br />
6%<br />
7%<br />
4%<br />
3% 3%<br />
6% 1%<br />
5% 3%<br />
0% 20% 40% 60% 80% 100%<br />
definitely yes rather yes rather not definitely not<br />
6%<br />
7%<br />
7%<br />
Slide 35
SATISFACTION WITH PARKING HAS DROPPED SLIGHTLY COMPARED TO 2008. MOST OF THE<br />
COMPLAINTS ARE ONLY CONCERNING PARKING PRICES.<br />
Q04: How are you satisfied with parking in <strong>BB</strong> <strong>Centrum</strong>?<br />
100%<br />
80%<br />
60%<br />
40%<br />
20%<br />
0%<br />
29%<br />
24%<br />
33%<br />
14%<br />
26%<br />
23%<br />
35%<br />
16%<br />
2012 2008<br />
very satisfied rather satisfied<br />
rather dissatisfied very dissatisfied<br />
Building C<br />
Building D<br />
Building Alpha<br />
Filadelfie<br />
Office Park I,II<br />
Building E<br />
Building Beta<br />
Building A & GAMMA<br />
Building B<br />
13%<br />
13%<br />
13%<br />
10%<br />
34%<br />
31%<br />
30%<br />
51% of dissatisfied employees complained about parking<br />
prices (N=151), 37% of employees complain about<br />
insufficient free parking places (N=109).<br />
The graph is based on respondents who at least sometimes travel<br />
to <strong>BB</strong> <strong>Centrum</strong> by car (N=min. 1248).<br />
9%<br />
5%<br />
10%<br />
16%<br />
33%<br />
29%<br />
31%<br />
41%<br />
23%<br />
15%<br />
26%<br />
23%<br />
55%<br />
29%<br />
56%<br />
29%<br />
35%<br />
28%<br />
61%<br />
45%<br />
31%<br />
7% 3%<br />
11% 5%<br />
24%<br />
29%<br />
24%<br />
22%<br />
0% 20% 40% 60% 80% 100%<br />
very satisfied rather satisfied<br />
rather dissatisfied very dissatisfied<br />
Slide 36
EMPLOYEES IN THE FILADELFIE BUILDING HAVE A WORSE EVALUATION OF THE AVAILABILITY<br />
OF <strong>BB</strong> CENTRUM BY CAR, THAN THE EMPLOYEES IN THE OTHER BUILDINGS.<br />
� When evaluating parking the differences aren’t visible, it is<br />
only that the employees of other buildings are more critical.<br />
Q03: Do you consider the availability of <strong>BB</strong> <strong>Centrum</strong> by car satisfactory?<br />
2012 Filadelfie<br />
2012 Other buildings<br />
2008 Total<br />
23%<br />
22%<br />
35%<br />
52%<br />
60%<br />
53%<br />
17%<br />
8% 4%<br />
14%<br />
7%<br />
4%<br />
0% 20% 40% 60% 80% 100%<br />
definitely yes rather yes rather not definitely not<br />
2012 Filadelfie<br />
2012 Other buildings<br />
Q04: How are you satisfied with parking in <strong>BB</strong> <strong>Centrum</strong>?<br />
2008 Total<br />
The graph is based on respondents who at least sometimes travel to <strong>BB</strong> <strong>Centrum</strong> by car (Filadelfie N=350;<br />
13%<br />
15%<br />
16%<br />
33%<br />
32%<br />
35%<br />
29%<br />
22%<br />
23%<br />
24%<br />
31%<br />
26%<br />
0% 20% 40% 60% 80% 100%<br />
very satisfied rather satisfied<br />
rather dissatisfied very dissatisfied<br />
Slide 37
Q04. Comments –Satisfied<br />
PARKING IN <strong>BB</strong> CENTRUM - COMMENTS<br />
Number of<br />
<strong>comments</strong><br />
Percentage<br />
of<br />
<strong>comments</strong><br />
I park on a space reserved for my<br />
company<br />
52 25%<br />
Parking is expensive 44 21%<br />
Bad technical and space solutions,<br />
sensors<br />
25 12%<br />
Too few parking spaces (mainly free<br />
ones)<br />
23 11%<br />
I have my own assigned space 13 6%<br />
Satisfaction, everything is fine 12 6%<br />
For employees it's fine, there is a<br />
problem for visitors or employees<br />
without an assigned space<br />
9 4%<br />
A sufficient number of parking spaces<br />
inside and outside<br />
7 3%<br />
Other <strong>comments</strong> 22 11%<br />
Total 207 100%<br />
Q04. Comments – Dissatisfied<br />
Number of<br />
<strong>comments</strong><br />
Percentage<br />
of<br />
<strong>comments</strong><br />
Parking is expensive and not paid by<br />
the employer<br />
151 51%<br />
Too few parking spaces (mainly free<br />
ones)<br />
109 37%<br />
For employees it's fine, there is a<br />
problem for visitors<br />
14 5%<br />
Bad technical and space solutions,<br />
sensors<br />
12 4%<br />
Other <strong>comments</strong> 9 3%<br />
Total 295 100%<br />
Slide 38
Q04. Comments – No experience<br />
Number of Percentage<br />
<strong>comments</strong> of <strong>comments</strong><br />
Don't use, don't commute by car 11 29%<br />
I park on an assigned company space 9 24%<br />
Parking is expensive 6 16%<br />
I park elsewhere 6 16%<br />
I park for free, outside the paid<br />
parking<br />
3 8%<br />
Other <strong>comments</strong> 3 8%<br />
Total 38 100%<br />
PARKING IN <strong>BB</strong> CENTRUM - COMMENTS<br />
Slide 39
<strong>BB</strong> CENTRUM IS THE BEST EVALUATED CONCERNING THE QUALITY OF PAID PARKING, THE<br />
WORST CONCERNING PARKING SPACE CAPACITY.<br />
� The employees miss more free parking in the complex, the current spaces<br />
are filled up early in the morning. The disadvantage of the paid parking is<br />
the high price. The staff should also be more approachable.<br />
Q05: How to you evaluate <strong>BB</strong> <strong>Centrum</strong> parking overall in the<br />
following parameters?<br />
Quality of paid<br />
parking lots<br />
Attendance at paid<br />
parking lots<br />
Parking space<br />
capacity at <strong>BB</strong><br />
<strong>Centrum</strong>.<br />
20%<br />
17%<br />
14%<br />
35%<br />
58%<br />
58%<br />
27%<br />
15%<br />
18%<br />
25%<br />
0% 20% 40% 60% 80% 100%<br />
very satisfied rather satisfied<br />
rather dissatisfied very dissatisfied<br />
The graph is based on respondents who at least sometimes<br />
travel to <strong>BB</strong> <strong>Centrum</strong> by car (N=min. 776).<br />
7%<br />
8%<br />
88 employees expressed opinions concerning paid parking.<br />
44% think the paid parking is too expensive.<br />
65 employees expressed opinions about the staff at the paid<br />
parking. 47% said the staff members behave arrogantly and<br />
unpleasantly and that their behaviour gives a bad impression.<br />
The question was commented on by 131 employees. 30%<br />
stated that there is an insufficient number of free parking<br />
lots in the area surrounding <strong>BB</strong> <strong>Centrum</strong>. There is low<br />
parking capacity in the surrounding area.<br />
“Paying 300 CZK a day<br />
is really a lot.”<br />
“We would welcome 1-2 parking<br />
spaces in front of the building<br />
for short visits, loading /<br />
unloading goods.”<br />
Slide 40
THE LOWEST PARKING SATISFACTION IS FOR BUILDING B, ESPECIALLY CONCERNING PARKING<br />
SPACE CAPACITY.<br />
Q04: How are you satisfied with parking in <strong>BB</strong> <strong>Centrum</strong>? (OVERALL SATISFACTION)<br />
Q05: How to you evaluate <strong>BB</strong> <strong>Centrum</strong> parking overall in the following parameters?<br />
Building C<br />
(N=min. 67)<br />
Building Alpha<br />
(N=min. 46)<br />
Other visitors<br />
(N=min. 34)<br />
Building D<br />
(N=min. 11)<br />
Building A & GAMMA<br />
(N=min. 169)<br />
Filadelfie<br />
(N=min. 234)<br />
Building Beta<br />
(N=min. 19)<br />
Office Park I,II<br />
(N=min. 23)<br />
Building E<br />
(N=min. 13)<br />
Building B<br />
(N=min. 154)<br />
Overall<br />
satisfaction<br />
with parking<br />
lots<br />
Quality of<br />
paid parking<br />
lots<br />
Attendance<br />
at paid<br />
parking lots<br />
Parking space<br />
capacity at <strong>BB</strong><br />
<strong>Centrum</strong><br />
7,62 7,21 7,05 6,86 7,19<br />
7,32 7,19 7,33 5,93 6,94<br />
6,27 7,58 6,82 5,35 6,51<br />
5,39 7,00 7,25 4,46 6,02<br />
5,15 6,84 6,60 4,92 5,88<br />
5,07 7,08 6,48 6,72 6,34<br />
4,83 5,29 5,90 4,69 5,18<br />
4,77 5,75 6,61 4,00 5,28<br />
3,90 5,80 5,85 3,74 4,82<br />
2,79 5,82 6,10 2,97 4,42<br />
The graph is based on respondents who at least sometimes travel to <strong>BB</strong> <strong>Centrum</strong> by car.<br />
Index values:<br />
10 = VERY SATISFIED<br />
1 = VERY DISSATISFIED<br />
Slide 41
HALF OF THE VISITORS OF <strong>BB</strong> CENTRUM ARE SATISFIED WITH PARKING. THE LESS SATISFIED<br />
MISS LARGER PARKING LOT CAPACITY OR THE POSSIBILITY OF FREE PARKING FOR VISITORS.<br />
Q06: How are visitors to your company satisfied with the parking in<br />
<strong>BB</strong> <strong>Centrum</strong>?<br />
100%<br />
5%<br />
166 employees answered this question. The<br />
15% biggest problem is parking lot capacity. 46% of<br />
80%<br />
employees said that their visitors don’t have<br />
anywhere to park and spend a long time<br />
looking for a free parking spot. 30% stated<br />
60%<br />
34% that their visitors are dissatisfied with the<br />
paid parking in the area – they are too<br />
expensive (12%).<br />
40%<br />
20%<br />
0%<br />
41%<br />
6%<br />
very satisfied<br />
rather satisfied<br />
rather dissatisfied<br />
very dissatisfied<br />
they do not park<br />
The graph is based on all respondents (N=1143).<br />
“If I want to have visitors<br />
for instance for several<br />
hours, the parking is<br />
expensive and it’s<br />
impossible to find any free<br />
parking in the surrounding<br />
area.”<br />
“If visitors aren’t able to park in the<br />
company building they have<br />
difficulties in the morning trying to<br />
find a free spot nearby.”<br />
Slide 42
Q06. Comments – Satisfied<br />
SATISFACTION OF VISITORS WITH <strong>BB</strong> CENTRUM PARKING - COMMENTS<br />
They appreciate the parking, nonproblematic,<br />
they don't mind<br />
paying<br />
They park on paid parking spaces,<br />
expensive parking, don't like to<br />
pay<br />
Sufficient parking spaces, parking<br />
appropriate<br />
Number of<br />
<strong>comments</strong><br />
Percentage<br />
of<br />
<strong>comments</strong><br />
9 14%<br />
8 12%<br />
7 11%<br />
Often have problems parking 7 11%<br />
Satisfaction 6 9%<br />
Parking prices appropriate or free 4 6%<br />
Difficult journey to the building 3 5%<br />
Complaints about staff 3 5%<br />
Other <strong>comments</strong> 19 29%<br />
Total 66 100%<br />
Q06. Comments – Dissatisfied<br />
Number of<br />
<strong>comments</strong><br />
Percentage<br />
of<br />
<strong>comments</strong><br />
Too few spaces, problems parking 93 46%<br />
Only paid parking 60 30%<br />
Paid parking is expensive 24 12%<br />
Bad navigation, signs 6 3%<br />
Unpleasant staff 3 1%<br />
Other <strong>comments</strong> 16 8%<br />
Total 202 100%<br />
Slide 43
SATISFACTION OF VISITORS WITH <strong>BB</strong> CENTRUM PARKING - COMMENTS<br />
Q06. Comments – I don't park<br />
Number of<br />
<strong>comments</strong><br />
Percentage of<br />
<strong>comments</strong><br />
Park on paid parking spaces,<br />
expensive parking, don't want<br />
to pay<br />
4 31%<br />
Take taxis, don't have a car 2 15%<br />
Look for spaces elsewhere in<br />
the vicinity<br />
2 15%<br />
Other <strong>comments</strong> 5 39%<br />
Total 13 100%<br />
Slide 44
MORE THAN HALF THE EMPLOYEES WHO USE PUBLIC TRANSPORT, MAKE USE OF THE<br />
SHUTTLE TRANSPORT DAILY OR SEVERAL TIMES A WEEK.<br />
� Most employees are satisfied with the shuttle transport. Complaints are mainly concerning<br />
overfilling buses and long morning waiting periods.<br />
Q07: Do you use shuttle transport to get to work in <strong>BB</strong> <strong>Centrum</strong>?<br />
23% 31% 17% 24% 6%<br />
0% 20% 40% 60% 80% 100%<br />
Yes, daily Yes, several times a week<br />
Yes, several times a month Yes, but very rarely<br />
Q08: How are you satisfied with the shuttle transport to <strong>BB</strong> <strong>Centrum</strong>?<br />
26% 50% 19% 6%<br />
0% 20% 40% 60% 80% 100%<br />
very satisfied rather satisfied rather dissatisfied very dissatisfied<br />
.<br />
The graph is based on respondents who<br />
at least sometimes use public transport<br />
when commuting to <strong>BB</strong> <strong>Centrum</strong><br />
(N=1869).<br />
48% of dissatisfied employees<br />
would welcome shorter waiting<br />
periods for the buses (N=193). 39%<br />
stated that the buses are overfilled<br />
(N=157).<br />
The graph is based on respondents who<br />
at least sometimes use the shuttle<br />
transport(N=1753).<br />
Slide 45
SATISFACTION WITH SHUTTLE TRANSPORT TO THE <strong>BB</strong> CENTRUM - COMMENTS<br />
Q08. Comments – Satisfied<br />
Bad waiting periods during rush<br />
hours, doesn't drive before 7,<br />
masks public transport<br />
Overfilled routes, don't keep to<br />
timetables, bus driver<br />
irresponsible driving, bus<br />
quality<br />
Feels an improvement,<br />
everything OK<br />
Number of<br />
<strong>comments</strong><br />
Percentage<br />
of<br />
<strong>comments</strong><br />
172 45%<br />
81 21%<br />
29 8%<br />
Appropriate waiting times, fast<br />
connection<br />
24 6%<br />
Reliable connection, don't skip,<br />
driver behaviour, bus quality<br />
22 6%<br />
Clean transport 7 2%<br />
Inconvenient routes 5 1%<br />
Good route 4 1%<br />
Well coordinated with public<br />
transport<br />
3 1%<br />
Other <strong>comments</strong> 32 8%<br />
Total 382 100%<br />
Q08. Comments – Dissatisfied<br />
Number of<br />
<strong>comments</strong><br />
Percentage<br />
of<br />
<strong>comments</strong><br />
Long waiting periods 193 48%<br />
Overfilled lines 157 39%<br />
Not keeping to timetables 32 8%<br />
A bit better than before 4 1%<br />
Other <strong>comments</strong> 18 4%<br />
Total 404 100%<br />
Slide 46
41% OF THE EMPLOYEES THINK THE WAITING PERIODS ARE SATISFACTORY. A SIMILAR PORTION OF EMPLOYEES ON THE<br />
OTHER HAND MENTION, THAT THERE IS A PROBLEM WITH THE LONG WAITING PERIODS BETWEEN BUSES ESPECIALLY<br />
DURING THE MORNING RUSH HOURS, WHEN BUSES ARE OFTEN OVERFILLED.<br />
Q09. Do you think the periods between <strong>BB</strong> <strong>Centrum</strong> shuttle transport buses are<br />
satisfactory?<br />
Satisfactory intervals<br />
Buses do not run often enough<br />
Buses are crowded<br />
Lines overlap, run simultaneously<br />
Buses do not comply with the timetable<br />
Other <strong>comments</strong><br />
13%<br />
10%<br />
41%<br />
42%<br />
The graph is based on respondents who addressed the question (N=1587).<br />
4%<br />
9%<br />
0% 20% 40% 60%<br />
� This situation could be improved<br />
by a better adjustment of the<br />
timetable, where the bus lines<br />
would better complement the<br />
Prague Integrated Transport buses.<br />
“I think the bus times are<br />
satisfactory. Maybe during rush<br />
hours (8-9 am) there could be<br />
more of them.”<br />
“Why do <strong>BB</strong>1 and <strong>BB</strong>2 leave from<br />
Budějovická straight after the<br />
121 and 118, then threes a large<br />
waiting period between the lines<br />
and the 2 buses usually leave at<br />
once.”<br />
Slide 47
CATERING – EVALUATION AND POTENTIAL<br />
Slide 48
REPRESENTATION OF CANTEENS IN <strong>BB</strong> CENTRUM<br />
Aramark (Buildings A, B,<br />
Gamma, Filadelfie)<br />
Sodexo (Building C)<br />
Eurest (Buildings Alpha,<br />
E)<br />
GTH Catering (Building<br />
Beta)<br />
No canteen<br />
3%<br />
3%<br />
8%<br />
7%<br />
79%<br />
0% 20% 40% 60% 80% 100%<br />
The graph is based on all respondents<br />
(N=2268).<br />
Slide 49
MORE THAN HALF THE EMPLOYEES EAT AT A CANTEEN AT LEAST 3 TIMES A WEEK, BUT THE<br />
NUMBER OF REGULAR EVERYDAY DINERS HAS DROPPED.<br />
� 40% of those answering visits one of the restaurants at least once a week.<br />
Q10: How many times a week do you eat at the individual dining establishments in <strong>BB</strong> <strong>Centrum</strong>?<br />
daily<br />
at least 3x a week<br />
at least 1x a week<br />
2x or 3x a month<br />
Less often<br />
Never<br />
3%<br />
CANTEENS RESTAURANTS<br />
7%<br />
5%<br />
3%<br />
9%<br />
9%<br />
8%<br />
18%<br />
27%<br />
32%<br />
30%<br />
49%<br />
The reason for the low attendance at<br />
canteens is foremost the bad quality<br />
of the food (58%) and high prices<br />
(22%). A bad price-to-quality ratio.<br />
0% 20% 40% 60%<br />
2012 2008<br />
daily<br />
at least 3x a week<br />
at least 1x a week<br />
2x or 3x a month<br />
less often<br />
never<br />
The graph is based on all respondents<br />
(N=min. 1981).<br />
4%<br />
3%<br />
10%<br />
8%<br />
10%<br />
9%<br />
22%<br />
23%<br />
26%<br />
25%<br />
27%<br />
33%<br />
Employees go to<br />
restaurants less,<br />
mainly due to prices<br />
(31%). In the <strong>BB</strong><br />
<strong>Centrum</strong> complex<br />
there is at the same<br />
an insufficient number<br />
of restaurants (20%).<br />
There is no restaurant<br />
service traditional<br />
Czech cuisine.<br />
0% 20% 40% 60%<br />
2012 2008<br />
Slide 50
CUSTOMERS MORE OFTEN EAT AT CANTEENS – ABOVE ALL MEN AND EMPLOYEES OF<br />
BUILDINGS D AND E.<br />
Q10: How many times a week do you eat at the individual dining establishments in <strong>BB</strong> <strong>Centrum</strong>?<br />
(The lower the average, the more often the given group uses the canteens, 1=100% dines every day, 6=100% never dine there).<br />
gender<br />
bulding<br />
incom<br />
men<br />
woman<br />
Filadelfie<br />
Building A & GAMMA<br />
Building B<br />
Building C<br />
Building D<br />
Office Park I,II<br />
Building Alpha<br />
Building Beta<br />
Building E<br />
up to 30 thousand CZK<br />
31 to 40 thousand CZK<br />
41 to 50 thousand CZK<br />
51 to 71 thousand CZK<br />
72 thousand CZK or more<br />
I do not wish to say<br />
1,58<br />
1,67<br />
2,46<br />
2,36<br />
2,33<br />
2,77<br />
2,71<br />
2,62<br />
2,49<br />
2,76<br />
2,73<br />
2,69<br />
2,56<br />
2,85<br />
2,60<br />
3,22<br />
3,36<br />
3,47<br />
3,46<br />
3,46<br />
3,92<br />
3,86<br />
3,97<br />
3,92<br />
3,82<br />
4,01<br />
4,00<br />
3,92<br />
4,09<br />
3,95<br />
3,97<br />
3,84<br />
3,94<br />
4,26<br />
1 2 3 4 5 6<br />
canteens restaurants<br />
The graph is based on all respondents<br />
(N=min. 1981).<br />
Slide 51
CANTEENS<br />
CANTEEN - COMMENTS<br />
Number of Percentage of<br />
<strong>comments</strong> <strong>comments</strong><br />
Low food quality 232 28%<br />
Canteen name specified 150 18%<br />
It's expensive 138 17%<br />
Bad experiences,<br />
dissatisfaction, low standards<br />
61 7%<br />
Everything OK, no complaints,<br />
no problems<br />
38 5%<br />
Small size portions 30 4%<br />
Unsatisfactory choice of meals 29 4%<br />
Fast-food, time-saving 18 2%<br />
Only go because I have to, no<br />
other option<br />
Go to restaurants outside the<br />
16 2%<br />
complex, the competitions is<br />
better<br />
14 2%<br />
Food is good and good quality 13 2%<br />
Cook at home, eat own food 9 1%<br />
Small choice 9 1%<br />
Unpleasant staff 7 1%<br />
Good standard, pleasant 7 1%<br />
Cheap and affordable price 6 1%<br />
Other <strong>comments</strong> 60 7%<br />
Total 837 100%<br />
Slide 52
RESTAURANTS<br />
Number of<br />
<strong>comments</strong><br />
RESTAURANTS - COMMENTS<br />
Percentage<br />
of<br />
<strong>comments</strong><br />
It's expensive 78 22%<br />
Too few restaurants 70 20%<br />
Unsatisfactory choice of meals<br />
Go to restaurants outside the<br />
32 9%<br />
complex, the competitions is<br />
better<br />
25 7%<br />
Restaurants are often full, small<br />
capacity, queues<br />
24 7%<br />
Eating there takes too long, don't<br />
have the time<br />
15 4%<br />
Low food quality 14 4%<br />
Overall satisfaction, no <strong>comments</strong> 13 4%<br />
Bad staff 8 2%<br />
Restaurants are too far away 8 2%<br />
Good and good quality food 8 2%<br />
Good price 5 1%<br />
I cook at home 4 1%<br />
Pleasant staff and service 4 1%<br />
Sufficient or good offer 3 1%<br />
Don't go to, bad experience 3 1%<br />
Other <strong>comments</strong> 42 12%<br />
Total 356 100%<br />
Slide 53
EMPLOYEES ARE MOST SATISFIED WITH HYGIENE AND SPEED OF SERVICE, VARIETY AND QUALITY OF<br />
MEALS IS EVALUATED WORSE AS WELL AS THE RATIO OF PRICE TO QUALITY.<br />
Q12: How are you satisfied with the canteen services in the<br />
following parameters?<br />
hygiene and<br />
cleanliness of<br />
promptness of<br />
service<br />
overall personnel<br />
excellence<br />
variety of<br />
offered foods<br />
food quality<br />
comparison of<br />
price versus<br />
R<br />
C<br />
P<br />
Kvalita<br />
S<br />
2012<br />
2008<br />
2012<br />
2008<br />
2012<br />
2008<br />
2012<br />
2008<br />
2012<br />
2008<br />
2012<br />
2008<br />
10%<br />
9%<br />
7%<br />
5%<br />
5%<br />
5%<br />
4%<br />
3%<br />
16%<br />
23%<br />
19%<br />
18%<br />
27%<br />
37%<br />
32%<br />
34%<br />
37%<br />
40%<br />
63%<br />
67%<br />
60%<br />
34%<br />
61%<br />
70%<br />
64%<br />
33%<br />
38%<br />
37%<br />
36%<br />
37%<br />
The graph is based on respondents who at least sometimes eat at a canteen (N=min.<br />
2045).<br />
23%<br />
19%<br />
17%<br />
30%<br />
35%<br />
13%<br />
11%<br />
13%<br />
17%<br />
21%<br />
22%<br />
25%<br />
0% 20% 40% 60% 80% 100%<br />
very satisfied rather satisfied rather dissatisfied very dissatisfied<br />
3%<br />
3%<br />
4%<br />
4%<br />
5%<br />
5%<br />
The question was commented on by 110 employees.<br />
The most common problem was dirty cutlery (35%).<br />
Employees are further dissatisfied with the airconditioning<br />
(10%) and the smell of food (10%).<br />
The question was commented on by 92<br />
respondents. There are too long queues at the<br />
counters (26%). During lunch hours there are too<br />
many people for the number of staff to manage<br />
(15%).<br />
32% of employees negatively evaluated the canteen<br />
staff (are not helpful, cashiers are unpleasant). 45%<br />
are on the other hand satisfied with the staff.<br />
There are only several types of food on offer, and these<br />
are always repeated (34% of employees out of 187).<br />
The food isn’t seen as quality (12%) and healthy foods<br />
are missing from the offer (10%).<br />
The question was commented on by 279 employees. 31%<br />
consider the food to be of low quality, doesn’t taste good<br />
(15%). It is cooked from low-quality ingredients.<br />
The question was commented on by 259 employees.<br />
They think the meals are too expensive (45%) and<br />
from low-quality ingredients (23%). The canteens give<br />
small portions.<br />
Slide 54
EUREST IN BUILDING E HAD THE BEST EVALUATION – THEIR EMPLOYEES POSITIVELY EVALUATED<br />
PRIMARILY THE CLEANLINESS OF THE ENVIRONMENT. WORST OFF WAS ARAMARK IN BUILDING B –<br />
EMPLOYEES EVALUATED AS WORSE PRIMARILY FOOD QUALITY AND PRICE.<br />
Q12: How are you satisfied with the canteen services in the following parameters? – SORTED ACCORDING TO CANTEENS<br />
Building E -<br />
Eurest(N=min.50)<br />
Filadelfie - Aramark<br />
(N=min.689)<br />
Building A & GAMMA -<br />
Aramark (N=min.420)<br />
Building C - Sodexo<br />
(N=min.163)<br />
Building Alpha - Eurest<br />
(N=min.91)<br />
Building Beta - GTH<br />
Catering (N=min.43)<br />
Building B - Aramark<br />
(N=min.463)<br />
Index<br />
Index values:<br />
10 = VERY SATISFIED<br />
1 = VERY DISSATISFIED<br />
Average evaluation<br />
of building in all<br />
categories followed.<br />
hygiene and<br />
cleanliness<br />
of<br />
environment<br />
promptness<br />
of service<br />
overall<br />
personnel<br />
excellence<br />
variety of<br />
offered<br />
foods<br />
food<br />
quality<br />
comparison<br />
of price<br />
versus<br />
quality<br />
6,59 7,84 7,42 7,35 5,53 5,50 5,88<br />
6,14 7,90 7,09 7,49 5,59 5,00 3,78<br />
5,99 7,28 7,40 6,91 5,31 4,59 4,45<br />
5,52 6,95 6,95 6,74 4,71 3,78 3,98<br />
5,39 6,77 7,26 6,74 3,93 3,61 4,03<br />
5,37 6,40 6,11 6,07 4,77 4,39 4,46<br />
4,74 5,88 6,15 5,28 4,53 3,26 3,33<br />
Slide 55
CANTEEN SATISFACTION<br />
Q12: How are you satisfied with the canteen services in the following parameters? – SORTED ACCORDING TO COMPANY<br />
hygiene and<br />
cleanliness<br />
of<br />
environmen<br />
t<br />
promptn<br />
ess of<br />
service<br />
overall<br />
personnel<br />
excellenc<br />
e<br />
variety of<br />
offered<br />
foods<br />
food<br />
quality<br />
comparison<br />
of price<br />
versus<br />
quality<br />
number of<br />
employees<br />
UNICREDIT BANK 6,8 5,9 6,4 4,4 3,7 2,3 640<br />
GE Money Bank 4,9 5,2 4,3 3,5 2,3 2,3 528<br />
Telefónica 6,2 6,3 5,8 4,1 3,3 3,2 458<br />
Hewlett-Packard 5,9 5,9 5,7 3,7 2,6 2,9 172<br />
UNICREDIT LEASING 7,2 7,2 7,2 5,6 5,1 4,4 119<br />
Microsoft 5,5 6,1 5,3 2,6 2,4 2,9 60<br />
ČEZ 6,8 6,4 6,4 4,5 4,5 4,9 53<br />
PASSERINVEST GROUP, a. s. 6,9 6,1 6,0 5,3 5,2 5,0 40<br />
Marks and Spencer 5,5 4,7 4,7 3,5 3,4 3,6 38<br />
HUAWEI 5,9 6,2 5,9 2,3 1,6 2,2 28<br />
Tchibo 7,4 7,3 7,3 5,9 5,8 5,5 26<br />
FRESENIUS 7,2 7,0 6,8 5,3 5,5 5,8 20<br />
ARAMARK 7,3 7,8 7,4 7,0 6,5 6,5 19<br />
OTIS 6,3 6,6 5,7 4,5 4,5 3,3 18<br />
Good Year 4,4 4,9 4,9 3,0 2,2 2,2 14<br />
DKV ČESMAD sro 6,8 7,1 7,1 5,7 5,7 5,4 11<br />
Gemalto 6,0 6,3 5,7 3,8 5,3 4,3 9<br />
NextSoft 5,3 5,3 5,3 2,3 3,0 0,8 5<br />
Binta 7,0 7,0 7,0 6,0 6,0 6,0 4<br />
ALSTOM 5,3 6,8 6,0 5,3 3,8 3,0 4<br />
AkzoNobel Coatings CZ, as 9,0 4,5 7,5 7,5 7,5 6,0 3<br />
SANTÉ 6,0 6,0 6,0 3,0 3,0 5,0 3<br />
Frainkin ČR 6,0 6,0 7,0 3,0 1,0 6,0 3<br />
CSL Behring sro 6,0 7,5 9,0 4,5 4,5 6,0 2<br />
Online czech republic 6,0 7,5 6,0 3,0 4,5 6,0 2<br />
GTH catarign as 6,0 6,0 6,0 6,0 6,0 6,0 1<br />
Index values:<br />
10 = VERY<br />
SATISFIED<br />
1 = VERY<br />
DISSATISFIED<br />
Slide 56
Q12. Comments – Overall staff standards<br />
CANTEENS - COMMENTS<br />
Number of Percentage<br />
Pleasant, helpful staff <strong>comments</strong> 32 of <strong>comments</strong> 32%<br />
Bad staff behaviour 24 24%<br />
Satisfaction 13 13%<br />
Unprofessional staff 13 13%<br />
Dissatisfaction 8 8%<br />
Professional staff 3 3%<br />
Other <strong>comments</strong> 8 8%<br />
Total 101 100%<br />
Q12. Comments – hygiene and cleanliness of environment<br />
Number of<br />
<strong>comments</strong><br />
Percentage<br />
of <strong>comments</strong><br />
Dirty eating utensils 39 35%<br />
Smell of food 11 10%<br />
Air-conditioning 11 10%<br />
Everything OK 10 9%<br />
Staff hygiene 10 9%<br />
Noise 5 5%<br />
Dirty environment 4 4%<br />
Missing utensils & condiments 3 3%<br />
Other <strong>comments</strong> 18 16%<br />
Total 111 100%<br />
Slide 57
Q12. Comments – Variety of offered meals<br />
Q12. Comments – Comparison of price and quality<br />
CANTEENS - COMMENTS<br />
Number of<br />
<strong>comments</strong><br />
Percentage<br />
of <strong>comments</strong><br />
Offer is repetitive 69 34%<br />
Food is low quality 24 12%<br />
Missing healthy foods 20 10%<br />
Missing vegetarian foods 12 6%<br />
I'm satisfied 10 5%<br />
The offer is narrow 8 4%<br />
Missing fish 5 2%<br />
Don't eat there 4 2%<br />
Odd combinations of meat/side<br />
dish<br />
4 2%<br />
I like the thematic weeks 3 1%<br />
Other <strong>comments</strong> 46 22%<br />
Total 205 100%<br />
Number of Percentage<br />
<strong>comments</strong> of <strong>comments</strong><br />
High price 140 45%<br />
Low quality 71 23%<br />
Price doesn't fit quality 59 19%<br />
Small portions 19 6%<br />
I'm satisfied 5 2%<br />
I don't go there 5 2%<br />
Generally dissatisfied 5 2%<br />
Other <strong>comments</strong> 5 2%<br />
Total 309 100%<br />
Slide 58
Q12. Comments – Food quality<br />
Q12. Comments – Staff service speed<br />
CANTEENS - COMMENTS<br />
Number of Percentage<br />
<strong>comments</strong> of <strong>comments</strong><br />
Generally low quality 98 31%<br />
Bland taste overall 47 15%<br />
Badly seasoned food 21 7%<br />
Too cold food 19 6%<br />
Small portions 15 5%<br />
I'm satisfied 14 4%<br />
The quality has gone down 13 4%<br />
I don't go there 11 3%<br />
High prices 7 2%<br />
Not much to choose from 6 2%<br />
Missing healthy foods 6 2%<br />
Other <strong>comments</strong> 62 19%<br />
Total 319 100%<br />
Number of Percentage<br />
<strong>comments</strong> of <strong>comments</strong><br />
Queues at the counter 26 26%<br />
Slow service 15 15%<br />
I'm satisfied 13 13%<br />
General waiting 5 5%<br />
Pleasant staff 3 3%<br />
I don't go there 2 2%<br />
Staff not present 2 2%<br />
Other <strong>comments</strong> 33 33%<br />
Total 99 100%<br />
Slide 59
CANTEEN OPENING HOURS ARE SATISFACTORY FOR A VAST MAJORITY OF<br />
EMPLOYEES.<br />
� Employees suggest canteens should open earlier, around 7:30 am, so they<br />
could buy breakfast or a snack for work. Some of them would prolong the<br />
closing time until evening (5 – 6 pm)<br />
� Opening hours in canteens in Buildings Alpha and Beta is most often evaluated<br />
as insufficient.<br />
Q11: Do you find the canteen opening hours sufficient?<br />
Total (N=2052)<br />
Budova A & GAMMA (N=484)<br />
Budova C (N=175)<br />
Budova E (N=51)<br />
Filadelfie (N=718)<br />
Budova B (N=483)<br />
Budova Alpha (N=94)<br />
Budova Beta (N=47)<br />
36%<br />
36%<br />
59%<br />
55%<br />
55%<br />
53%<br />
73%<br />
70%<br />
The graph is based on respondents who at least sometimes eat at a canteen (N=2052).<br />
53%<br />
53%<br />
36%<br />
38%<br />
43%<br />
40%<br />
26%<br />
27%<br />
4% 1%<br />
1% 0%<br />
3%<br />
5% 2%<br />
2%<br />
6% 1%<br />
9% 2%<br />
9% 2%<br />
0% 20% 40% 60% 80% 100%<br />
zcela vyhovuje spíše vyhovuje spíše nevyhovuje zcela nevyhovuje<br />
“It would be ideal for Eurest to<br />
open a few minutes before eight,<br />
so you’d have time to get<br />
breakfast on the way to work.”<br />
Slide 60
EMPLOYEES MOST OFTEN VISIT THE CHINESE RESTAURANT MANGO AND RESTAURANT<br />
MARANATHA.<br />
� 3% of employees actually visit the restaurant Maranatha daily, most from the companies surrounding GE Money<br />
Bank and Telefónica.<br />
� The most popular restaurant is Pizzeria Grosseto, 71% of employees visit it several times a year. On the other<br />
hand almost 60% of employees who visit restaurants in <strong>BB</strong> <strong>Centrum</strong> have never been to sushi bar Baifu.<br />
Q13: How often do you visit these restaurants in <strong>BB</strong> <strong>Centrum</strong>?<br />
Chinesse restaurant Mango<br />
Vegetarian restaurant Maranatha<br />
Bageterie Boulevard<br />
Express Sandwich<br />
Italian restaurant Pizzeria Grosseto<br />
3%<br />
3% 7%<br />
3%<br />
4%<br />
2%<br />
18%<br />
12%<br />
10%<br />
11%<br />
Baifu – sushi bar 1% 10%<br />
9%<br />
12%<br />
12%<br />
8%<br />
15%<br />
19%<br />
20%<br />
18%<br />
21%<br />
24%<br />
27%<br />
The graph is based on respondents who at least sometimes eat at the restaurants (N=min.<br />
1994).<br />
27%<br />
39%<br />
59%<br />
52%<br />
51%<br />
43%<br />
33%<br />
29%<br />
0% 20% 40% 60% 80% 100%<br />
daily at least 2x a week 2 - 3x a month<br />
1x a month Several times a year Never<br />
Slide 61
Q13: How often do you visit these restaurants in<br />
100% <strong>BB</strong> <strong>Centrum</strong>? Maranatha<br />
100%<br />
80%<br />
80%<br />
60%<br />
60%<br />
40%<br />
40%<br />
20%<br />
20%<br />
0% 0%<br />
52%<br />
33%<br />
21%<br />
8%<br />
9%<br />
7%<br />
3%<br />
daily Denně<br />
at Alespoň least 2x 2x a week týdně<br />
2 -2 3x - 3x a month za měsíc<br />
1x 1x a month za měsíc<br />
Several Několikrát times za a rok year.<br />
Never Nikdy<br />
The graph is based on respondents who at<br />
least sometimes eat at the restaurants<br />
(N=2019).<br />
MARANATHA VEGETARIAN RESTAURANT<br />
Number of<br />
<strong>comments</strong><br />
Percentage of<br />
<strong>comments</strong><br />
High prices 23 21%<br />
I like it here 20 19%<br />
The food is good quality 20 19%<br />
I haven't been here yet 19 18%<br />
I come here regularly 7 7%<br />
Worse quality food than it used to 4 4%<br />
They don't serve meat 3 3%<br />
Other <strong>comments</strong> 12 11%<br />
Total 108 100%<br />
Slide 62
Q13: How often do you visit these restaurants in<br />
<strong>BB</strong> <strong>Centrum</strong>? Mango<br />
100%<br />
100%<br />
80%<br />
80%<br />
60%<br />
60%<br />
40%<br />
40%<br />
20% 20%<br />
0% 0%<br />
33%<br />
33% 27%<br />
20%<br />
18%<br />
3%<br />
daily Denně<br />
at Alespoň least 2x a 2x week týdně<br />
2 -2 3x - 3x a month za měsíc<br />
1x 1x a month za měsíc<br />
Several Několikrát times za a rok year.<br />
Never Nikdy<br />
The graph is based on respondents who at<br />
least sometimes eat at the restaurants<br />
(N=2014).<br />
CHINESE RESTAURANT MANGO<br />
Number of<br />
<strong>comments</strong><br />
Percentage of<br />
<strong>comments</strong><br />
Low food quality 23 22%<br />
General satisfaction 17 16%<br />
I haven't been here yet 11 11%<br />
General dissatisfaction 7 7%<br />
The service is slow 6 6%<br />
Worse quality food lately 5 5%<br />
Good food 3 3%<br />
Unpleasant staff 3 3%<br />
It's full 3 3%<br />
Other <strong>comments</strong> 26 25%<br />
Total 104 100%<br />
Slide 63
Q13: How often do you visit these restaurants in<br />
<strong>BB</strong> <strong>Centrum</strong>? Bageterie Boulevard<br />
100%<br />
100%<br />
80%<br />
80%<br />
60%<br />
60%<br />
40%<br />
40%<br />
20%<br />
20%<br />
0%<br />
43%<br />
33%<br />
27%<br />
15%<br />
12%<br />
3%<br />
daily Denně<br />
at Alespoň least 2x a 2x week týdně<br />
2 -2 3x - 3x a month za měsíc<br />
1x 1x a month za měsíc<br />
Several Několikrát times za a rok year.<br />
Never Nikdy<br />
The graph is based on respondents who at<br />
least sometimes eat at the restaurants<br />
(N=1996).<br />
BAGETERIE BOULEVARD<br />
Number of<br />
<strong>comments</strong><br />
Percentage of<br />
<strong>comments</strong><br />
Generally satisfied 19 31%<br />
I haven't been there yet 15 25%<br />
High prices 6 10%<br />
Canteen/restaurant 6 10%<br />
Low quality food 5 8%<br />
It's fast 4 7%<br />
Other <strong>comments</strong> 5 10%<br />
Total 61 110%<br />
Slide 64
Q13: How often do you visit these restaurants in<br />
<strong>BB</strong> <strong>Centrum</strong>? Express sandwich<br />
100%<br />
100%<br />
80%<br />
80%<br />
60%<br />
60%<br />
40% 40%<br />
20% 20%<br />
0% 0%<br />
daily Denně<br />
51%<br />
33%<br />
24%<br />
12%<br />
10%<br />
4%<br />
at least Alespoň 2x a 2x week týdně<br />
2 - 2 3x - 3x a month za měsíc<br />
1x a 1x month za měsíc<br />
Several Několikrát times za a year. rok<br />
Never Nikdy<br />
The graph is based on respondents who at<br />
least sometimes eat at the restaurants<br />
(N=2000).<br />
EXPRESS SANDWICH<br />
Number of<br />
<strong>comments</strong><br />
Percentage<br />
of <strong>comments</strong><br />
I haven't been there yet 17 20%<br />
General satisfaction 14 16%<br />
Quality food 12 14%<br />
High price 10 12%<br />
General dissatisfaction 9 11%<br />
Pleasant staff 6 7%<br />
Insufficient opening hours 3 4%<br />
Other <strong>comments</strong> 15 18%<br />
Total 86 100%<br />
Slide 65
Q13: How often do you visit these restaurants in<br />
<strong>BB</strong> <strong>Centrum</strong>? Pizzeria Grosseto<br />
100%<br />
100%<br />
80%<br />
80%<br />
60%<br />
60%<br />
40%<br />
40%<br />
20% 20%<br />
0% 0%<br />
29%<br />
33% 39%<br />
19%<br />
11%<br />
2%<br />
daily Denně<br />
at least Alespoň 2x a 2x week týdně<br />
2 -2 3x - 3x a month za měsíc<br />
1x 1x a month za měsíc<br />
Several Několikrát times za a year. rok<br />
Never Nikdy<br />
The graph is based on respondents who at<br />
least sometimes eat at the restaurants<br />
(N=2033).<br />
ITALIAN RESTAURANT PIZZERIA GROSSETO<br />
Number of<br />
<strong>comments</strong><br />
Percentag<br />
e of<br />
comment<br />
High prices 33 25%<br />
Long waiting 20 15%<br />
The food is good quality 15 11%<br />
Missing a midday menu 12 9%<br />
General satisfaction 11 8%<br />
I haven't been there yet 10 8%<br />
Bad staff 9 7%<br />
It tends to be full 4 3%<br />
Other <strong>comments</strong> 20 15%<br />
Total 134 100%<br />
Slide 66
Q13: How often do you visit these restaurants in<br />
<strong>BB</strong> <strong>Centrum</strong>? Baifu<br />
100%<br />
100%<br />
80%<br />
80%<br />
60%<br />
60%<br />
40%<br />
40%<br />
20%<br />
0%<br />
daily Denně<br />
59%<br />
33%<br />
18%<br />
12%<br />
10%<br />
1%<br />
at Alespoň least 2x 2x a week týdně<br />
2 2 - 3x - 3x a za month měsíc<br />
1x 1x a za month měsíc<br />
Several Několikrát times za a rok year.<br />
Never Nikdy<br />
The graph is based on respondents who at<br />
least sometimes eat at the restaurants<br />
(N=1994).<br />
SUSHI BAR BAIFU<br />
Number of<br />
<strong>comments</strong><br />
Percentage<br />
of <strong>comments</strong><br />
I haven't been there yet 18 23%<br />
General satisfaction 13 17%<br />
Good quality food 11 14%<br />
Often full, needs reservation 9 12%<br />
Rise in prices 7 9%<br />
Pleasant environment 4 5%<br />
I don't like the taste of the food<br />
there 3 4%<br />
Other <strong>comments</strong> 12 16%<br />
Total 77 100%<br />
Slide 67
EMPLOYEES WOULD PREFER ABOVE ALL A RESTAURANT WITH TRADITIONAL CZECH<br />
CUISINE.<br />
Q14: What kind of cuisine / type of restaurant would you like to see in <strong>BB</strong> <strong>Centrum</strong>?<br />
Czech restaurant<br />
Italian restaurant<br />
Indian, Pakistani<br />
Fast-food<br />
Mexican, Spanish, South American<br />
Ordinary restaurant with international cuisine<br />
Healthy food<br />
Thai restaurant<br />
Greek restaurant<br />
Salad bar, vegetable restaurant<br />
Steakhouse<br />
Self-service<br />
Turkish, Arab, other<br />
Bakery, cake shop, delicatessen<br />
5%<br />
4%<br />
3%<br />
3%<br />
3%<br />
3%<br />
3%<br />
6%<br />
8%<br />
8%<br />
7%<br />
10%<br />
13%<br />
N=404<br />
30%<br />
0% 10% 20% 30% 40%<br />
The graph is based on all respondents (N=1336).<br />
� Employees would welcome a restaurant with<br />
Czech foods and a daily menu similar in style to<br />
Potrefená husa restaurant or Kolkovna.<br />
� 13% of employees would welcome a “cheap”<br />
restaurant, irrespective of type.<br />
“I would like to see traditional<br />
Czech cuisine with pre-cooked<br />
meals and fast service for<br />
affordable prices.”<br />
Slide 68
SERVICES IN <strong>BB</strong> CENTRUM – EVALUATION AND POTENTIAL<br />
Slide 69
EMPLOYEES GAIN INFORMATION ABOUT SHOPS AND SERVICES IN <strong>BB</strong> CENTRUM PRIMARILY FROM<br />
COLLEAGUES AND THEIR COMPANY INTRANET. ALMOST A THIRD OF EMPLOYEES MAKE USE OF THE <strong>BB</strong><br />
CENTRUM REVIEW OR E-REVIEW MAGAZINES.<br />
Q18: Where do you get information about shops or services in <strong>BB</strong> <strong>Centrum</strong>?<br />
from colleagues<br />
Intranet<br />
www. bbcentrum.cz<br />
catalogue of services<br />
<strong>BB</strong> <strong>Centrum</strong> Review magazine<br />
e-Review electronic monthly<br />
www.brumlovka.com<br />
elsewhere<br />
7%<br />
16%<br />
15%<br />
15%<br />
14%<br />
10%<br />
41%<br />
68%<br />
0% 20% 40% 60% 80%<br />
I read it<br />
occasionally.<br />
71%<br />
I read it<br />
occasionally.<br />
52%<br />
The graph is based on all respondents (N=2345).<br />
<strong>BB</strong> <strong>Centrum</strong> Review<br />
e-Review<br />
I read it<br />
regularly<br />
29%<br />
I read it<br />
regularly<br />
48%<br />
Employees had the option to give<br />
their e-mail during the research,<br />
where they will be sent e-Review<br />
directly. 23% of employees made<br />
use of this option (N = 521). 11% of<br />
those queried said they already<br />
receive e-Review this way.<br />
Slide 70
THE MOST EMPLOYEES VISITED BAAR’S PARK. THE COMMUNITY CENTRE AND<br />
MULTIFUNCTIONAL SPORTS-GROUND ARE NOT TOO WELL KNOWN.<br />
Q15: Have you visited these facilities in the <strong>BB</strong> <strong>Centrum</strong> complex?<br />
Baar Park<br />
Playground<br />
Community Centre<br />
14%<br />
12%<br />
67%<br />
“Very beautiful,<br />
appropriate for<br />
lunchtime relaxation.”<br />
21-29<br />
30-35<br />
36-39<br />
40 or more<br />
10%<br />
9%<br />
0% 20% 40% 60% 80%<br />
13%<br />
19%<br />
121 employees commented on<br />
Baar’s park – they evaluated it as a<br />
pleasant place, appropriate for<br />
resting. Employees appreciate the<br />
greenery within the complex.<br />
41 employees mentioned the<br />
community centre. 33% have been<br />
there before. A quarter of them have no<br />
interest in going there (don’t have time,<br />
are atheists). A portion of the<br />
employees have work meetings there.<br />
49 employees commented on the<br />
multifunctional sports-ground –<br />
they considered it a great idea,<br />
they go there for exercise, a<br />
number of them are only just<br />
planning on going.<br />
The graph is based on all respondents (N=min. 1522).<br />
Slide 71
EMPLOYEES ARE INTERESTED IN THE SERVICES OF BALANCE CLUB BRUMLOVKA, BUT THE HIGH<br />
ANNUAL MEMBERSHIP FEE IS A BARRIER. ¾ OF THOSE ANSWERING HAVE NEVER BEEN IN IT.<br />
� Balance Club Brumlovka garnered a large number of <strong>comments</strong><br />
from respondents, which points to large interest in this topic.<br />
� Brumlovka is seen as a very well equipped facility with the<br />
advantage of good availability from work.<br />
� Most of the <strong>comments</strong> (53%) however complain about the too<br />
expensive membership and lack of a one-off entrance fee to the<br />
club. For that reason some of them are members of other fitness<br />
centres.<br />
Q16: Have you ever visited the sports centre Balance Club<br />
Brumlovka, at least to have a look at this facility?<br />
2012<br />
2008<br />
9%<br />
16%<br />
15%<br />
21%<br />
0% 20% 40% 60% 80% 100%<br />
76%<br />
63%<br />
I am member As a guest No<br />
The graph is based on all respondents (N=2268).<br />
“I was thinking about it, if it<br />
were possible to go to some<br />
kind of exercises without<br />
having to be a member. That’s<br />
too expensive for me.”<br />
Slide 72
MEMBERS OF THE CLUB REGULARLY ATTEND AT LEAST ONCE A WEEK. THEY ARE MAINLY EMPLOYEES<br />
AGED 30 – 35 YEARS WITH A MONTHLY HOUSEHOLD INCOME ABOVE 72 000 CZK.<br />
� Comments from members of the Balance Club (47 in total) praise the level<br />
of service, but even they see the membership fee as high. A third of them have<br />
ended their membership for this reason.<br />
� Members of the club are primarily from companies GE Money Bank,<br />
Telefónica, Unicredit Bank and Microsoft.<br />
Age<br />
Household income<br />
Commute to work<br />
21-29<br />
30-35<br />
36-39<br />
40 or more<br />
Up to 30 thousand CZK<br />
31 to 40 thousand CZK<br />
41-50 tis. Kč<br />
51 to 71 thousand CZK<br />
72 thousand CZK or more<br />
I walk to work<br />
only by car<br />
by car and public transport, mostly car<br />
by car and public transport, mostly public<br />
transport<br />
only public transport<br />
8%<br />
11%<br />
13%<br />
12%<br />
17%<br />
23%<br />
21%<br />
20%<br />
23%<br />
24%<br />
23%<br />
24%<br />
39%<br />
“I’ve been a member since<br />
they started – for 5 years. I<br />
wont take any criticism of it,<br />
it’s the best thing we have<br />
here :-).”<br />
41%<br />
0% 10% 20% 30% 40% 50%<br />
“I was a member for almost 5<br />
years, but due to the very<br />
expensive membership, seeing<br />
as they haven’t done anything<br />
extra for long-term members,<br />
well I left.”<br />
Q17: How often do you visit the sports centre<br />
Balance Club Brumlovka?<br />
100%<br />
The graph is based on respondents who are members of Balance Club Brumlovka (N=209).<br />
80%<br />
60%<br />
40%<br />
20%<br />
0%<br />
daily<br />
6%<br />
3%<br />
2%<br />
10%<br />
60%<br />
18%<br />
at least 1x a week<br />
2, 3x a month<br />
1x a month<br />
several times a year<br />
Less often<br />
Slide 73
MEMBERS OF THE BALANCE CLUB<br />
BALANCE CLUB BRUMLOVKA– COMMENTS<br />
Number of<br />
<strong>comments</strong><br />
Percentage<br />
of<br />
<strong>comments</strong><br />
Satisfaction 22 39%<br />
I've cancelled membership 17 30%<br />
Too expensive<br />
You have to pay for the whole<br />
12 21%<br />
membership, no way to go for<br />
individual lessons<br />
2 4%<br />
Other <strong>comments</strong> 4 7%<br />
Total 57 100%<br />
Slide 74
VISITORS AT THE CLUB<br />
Number of<br />
<strong>comments</strong><br />
BALANCE CLUB BRUMLOVKA – COMMENTS<br />
Percentage<br />
of<br />
<strong>comments</strong><br />
Too expensive 24 37%<br />
I liked it there 19 29%<br />
I had a look 10 15%<br />
I used to be a member 7 11%<br />
Other <strong>comments</strong> 5 8%<br />
Total 65 100%<br />
HAVEN’T VISITED THE CLUB<br />
Number of<br />
<strong>comments</strong><br />
Percentage<br />
of <strong>comments</strong><br />
Too expensive 435 53%<br />
I go to another fitness club 97 12%<br />
I'm not interested 90 11%<br />
Don't have time 81 10%<br />
I don't like the conditional<br />
membership<br />
37 5%<br />
There was no reason to visit 34 4%<br />
I plan on going there 22 3%<br />
Insufficient information 14 2%<br />
Other <strong>comments</strong> 12 1%<br />
Total 822 100%<br />
Slide 75
EMPLOYEES MOST OFTEN VISIT THE ALBERT STORE AND DM DRUGSTORE IN BUILDING FILADELFIE. AN<br />
EQUAL THIRD OF RESPONDENTS USE BOTH THE POST OFFICE AND PHARMACY. THE NEWLY OPENED<br />
SPAR CITY MET RESPONDENTS’ REQUESTS FOR ANOTHER GROCERY STORE.<br />
Q20: Please enter 5 establishments (stores, services, restaurants) that you most often visit in <strong>BB</strong> <strong>Centrum</strong>.<br />
Showing the establishments mentioned by at least 10% of respondents.<br />
Albert<br />
DM Drogerie<br />
dm drugstore<br />
Česká pošta<br />
Lékárna <strong>BB</strong> <strong>Centrum</strong><br />
Čínská restaurace Mango<br />
Pizzeria Grosseto<br />
Restaurace Maranatha<br />
Spar city<br />
Bageterie Boulevard<br />
Restaurace Baifu<br />
Express Sandwich<br />
Aramark (Filadelfie)<br />
Obchod MARANATHA<br />
13%<br />
12%<br />
11%<br />
11%<br />
10%<br />
20%<br />
19%<br />
19%<br />
19%<br />
36%<br />
35%<br />
0% 20% 40% 60% 80%<br />
48%<br />
The graph is based on all respondents (N=min.1289).<br />
68%<br />
Among the other services<br />
used are (mentioned by less<br />
than 10% of employees):<br />
Mangaloo, Česká spořitelna,<br />
TEĎ &HNED newsagents,<br />
laundry and cleaning, COSTA<br />
CAFFEE, Balance Club<br />
Brumlovka, O2 Cafe coffee<br />
shop.<br />
Slide 76
THE LOW NUMBER OF COMMENTS POINTS TO EMPLOYEE SATISFACTION WITH OPENING HOURS. PART OF THE<br />
EMPLOYEES WOULD LIKE IT IF THE OPENING HOURS DIDN’T COINCIDE WITH THEIR WORK HOURS – THEY WOULD LIKE TO<br />
BE ABLE TO USE THESE SERVICES IN THE MORNING BEFORE WORK OR IN THE AFTERNOON AFTER LEAVING WORK.<br />
Q21: For which shop / service provider are you dissatisfied with the opening hours?<br />
Showing the establishments mentioned by at least 5% of respondents.<br />
Czech post<br />
Canteen Aramark (Filadelfie)<br />
Albert<br />
Pharmacy <strong>BB</strong> <strong>Centrum</strong><br />
Express Sandwich<br />
DM drogerie<br />
Dry cleaning and laundry<br />
Česká spořitelna<br />
Restaurant Maranatha<br />
5%<br />
5%<br />
5%<br />
8%<br />
8%<br />
11%<br />
12%<br />
15%<br />
22%<br />
0% 10% 20% 30%<br />
The graph is based on all respondents (N=199).<br />
� The <strong>comments</strong> for the three most often<br />
mentioned establishments (most 47) are<br />
repetitive:<br />
� Employees would like it if the<br />
establishments opened earlier – before<br />
their workday starts (7 to 7:30 am) and<br />
would extend the opening hours into the<br />
evening (7 to 8 pm).<br />
� Some of those going to Albert<br />
supermarket would like it to be open on<br />
Sunday as well.<br />
Slide 77
EMPLOYEES WOULD WELCOME A BROADER OFFER OF RESTAURANTS, A SHOE<br />
REPAIR/SALES SHOP AND PERHAPS ANOTHER GROCERY STORE.<br />
� The newly opened premises in <strong>BB</strong> <strong>Centrum</strong> such as Spar City and the Hájek-Hájková coffee shop are a reaction<br />
to employee requests – 13% of them in the research asked for a new groceries store, 8% mentioned a coffee /cake<br />
shop. Not all of them necessarily knew about these new services at the time of research.<br />
Q22: Which shops or services are you completely missing in the <strong>BB</strong> <strong>Centrum</strong> complex, or would welcome?<br />
Showing the establishments mentioned by at least 5% of respondents.<br />
More varied food on offer - restaurants<br />
Shoes, repair<br />
Groceries, vegetables, fruit, other supermarket<br />
Clothes shops, accessories<br />
Stationary's, office supplies<br />
Coffee shop, cake shop<br />
Sports opportunities, sports equipment<br />
Bakery<br />
Barber's, cosmetic salon, massage<br />
Bookshop, second hand books<br />
Some bank machines or bank outlets<br />
5%<br />
5%<br />
6%<br />
8%<br />
7%<br />
9%<br />
9%<br />
8%<br />
13%<br />
16%<br />
20%<br />
The graph is based on all respondents (N=998).<br />
The shoe repair in<br />
building Filadelfie is<br />
planned for September<br />
2012.<br />
Among the further missed services are (mentioned by<br />
less than 5% of employees): Parking spaces, drugstore and<br />
pet shop, electronics store and IT supplies, flower shop,<br />
day-care, nursery school.<br />
0% 5% 10% 15% 20% 25% 30%<br />
Slide 78
OF THE PLANNED PROJECTS, EMPLOYEES ARE MOST INTERESTED IN THE NEW NURSERY<br />
SCHOOL. THE CONFERENCE ROOM IS ALSO SEEN AS AN ADVANTAGEOUS PART OF <strong>BB</strong> CENTRUM.<br />
Q23: How much of an advantage would it be to you if the following projects became part of <strong>BB</strong> <strong>Centrum</strong>?<br />
new basic school<br />
hotel<br />
conference facilities<br />
apartments<br />
13%<br />
9%<br />
21%<br />
54%<br />
35%<br />
48%<br />
62%<br />
36%<br />
39%<br />
25%<br />
13%<br />
4% 3%<br />
14%<br />
19%<br />
0% 20% 40% 60% 80% 100%<br />
definitely appropriate rather appropriate<br />
rather inappropriate definitely inappropriate<br />
4%<br />
The graph is based on all respondents (N=min. 1372).<br />
Comments concerning the nursery school are on the<br />
following slide.<br />
63 Employees mentioned the conference space. Half of<br />
them think there are not enough places like that. 35% of<br />
employees would make use of such a service (N=22).<br />
83 employees expressed opinions concerning the hotel<br />
project. Half of them saw this as a benefit – especially for<br />
accommodating various business clients and foreign<br />
guests, although this would depend on the price and<br />
quality of services.<br />
83 employees mentioned the construction of new flats.<br />
More than half of those asked would not make use of<br />
these flats (flat capacity is sufficient, the locale close to<br />
the highway is inappropriate, they don’t want to live in<br />
the complex they work in). 23% wrote that this would<br />
depend on the flat prices.<br />
Slide 79
EMPLOYEES THINK THE NURSERY SCHOOL PROJECT HAS GREAT POTENTIAL, IT<br />
DEPENDS HOWEVER ON THE PRICE OF SERVICES.<br />
Q23: How much of an advantage would it be to you if the following projects became part of<br />
<strong>BB</strong> <strong>Centrum</strong>? New nursery school<br />
Total<br />
21-29<br />
30-35<br />
36-39<br />
40 or more<br />
1 child<br />
2 children<br />
3 children …<br />
childless<br />
54%<br />
52%<br />
45%<br />
61%<br />
55%<br />
48%<br />
60%<br />
54%<br />
55%<br />
39%<br />
39%<br />
48%<br />
35%<br />
38%<br />
45%<br />
39%<br />
37%<br />
38%<br />
4% 3%<br />
7% 2%<br />
3% 2%<br />
3% 4%<br />
4% 2%<br />
5% 2%<br />
4% 4%<br />
5% 3%<br />
0% 20% 40% 60% 80% 100%<br />
definitely appropriate rather appropriate<br />
rather inappropriate definitely inappropriate<br />
The graph is based on all respondents (N=min. 1372).<br />
112 employees gave their opinions on<br />
a new nursery project in <strong>comments</strong>.<br />
39% of them would make use of this<br />
service.<br />
“Very desirable, but it<br />
would have to be<br />
affordable.”<br />
“First and foremost it<br />
would have to have a<br />
large capacity and<br />
extended opening<br />
hours.”<br />
Slide 80
MESSAGES TO <strong>BB</strong> CENTRUM<br />
Slide 81
REMINDERS FROM EMPLOYEES WERE MOST OFTEN CONCERNING THE SURROUNDING<br />
DEVELOPMENT, TECHNICAL DIFFICULTIES AND PARKING IN THE AREA.<br />
Q31: Do you have any reminders, suggestions, <strong>comments</strong> for <strong>BB</strong> <strong>Centrum</strong>? Would you like to send any<br />
message to <strong>BB</strong> <strong>Centrum</strong>?<br />
Nothing to say, satisfaction<br />
Complaints about development, architecture, further construction<br />
Technical problems (air-conditioning, lifts), rubbish bins<br />
Solve parking problems, more free parking ,etc.<br />
Problems with transportation (apart from parking, including public transport)<br />
Thanks<br />
Improve/extend the network of shops, services, restaurants<br />
Improve the quality of food in the canteens<br />
Lower prices, implement discounts (mainly for the Balance club)<br />
Ban smoking, create smoker spaces<br />
Complaints about the questionnaire and its length<br />
Other<br />
The graph is based on all respondents, who left a message (N= 596).<br />
1%<br />
4%<br />
4%<br />
5%<br />
9%<br />
10%<br />
12%<br />
13%<br />
13%<br />
15%<br />
0% 5% 10% 15% 20% 25% 30%<br />
17%<br />
16%<br />
Slide 82
SOME OF THE PARTICIPANTS’ MESSAGES<br />
“A wonderful project, we<br />
enjoy working here very<br />
much and definitely<br />
welcome further<br />
development.”<br />
“I would recommend not<br />
increasing the capacity of<br />
the office space. The<br />
incoming roads are at<br />
capacity limits and even the<br />
parking is insufficient to<br />
employees’ needs.”<br />
“The Filadelfie project is<br />
top notch. I’m rooting for<br />
Mr Passer, he’s doing it<br />
right.”<br />
“Thanks for the<br />
questionnaire, it’s clear<br />
that you want to work on<br />
yourself more.”<br />
“Create <strong>BB</strong> <strong>Centrum</strong><br />
spaces for the common<br />
employees more, not just<br />
for the managers.”<br />
“<strong>BB</strong> <strong>Centrum</strong> is a<br />
wonderful microcosm,<br />
where practically nothing<br />
is missing.”<br />
“<strong>BB</strong> <strong>Centrum</strong> is clearly a singular<br />
project, in my opinion however<br />
there is quite a large<br />
concentration of employees and<br />
this is reflected in the insufficient<br />
services in the area, especially<br />
restaurants. Furthermore I think<br />
most of the services here are<br />
more expensive than appropriate<br />
for the quality...”<br />
Slide 83
Who to contact:<br />
Ondřej Veis, key account manager<br />
e-mail: ondrej.veis@nms.cz<br />
gsm: (+420) 603 450 979<br />
General contact:<br />
NMS Market Research<br />
Norbertov 5, 162 00 Praha 6<br />
tel.: (+420) 222 351 611<br />
e-mail: info@nms.cz<br />
web: www.nms.cz<br />
CONTACT<br />
Who to contact:<br />
Jana Kotrbová, Project Manager<br />
e-mail: jana.kotrbova@nms.cz<br />
gsm: (+420) 721 859 664<br />
For 12 years, NMS Market Research has been helping the biggest<br />
players on the market improve customer service, offer better products<br />
and gain new customers.<br />
Thanks to clever solutions for market research we help our clients<br />
better understand their customers and translate this understanding<br />
into good business decisions.<br />
Slide 84