weather data including solar radiation - NARI
weather data including solar radiation - NARI weather data including solar radiation - NARI
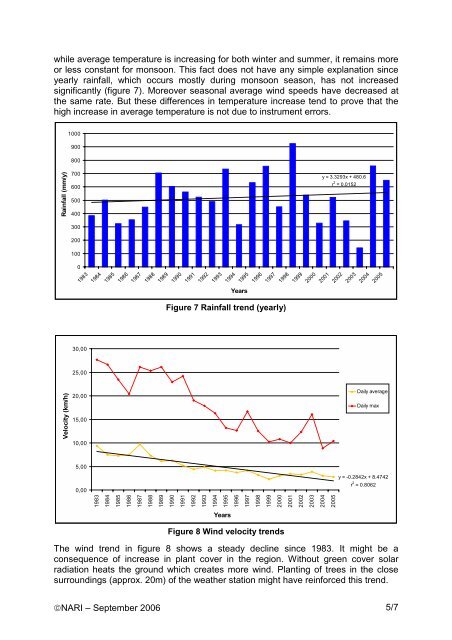
while average temperature is increasing for both winter and summer, it remains moreor less constant for monsoon. This fact does not have any simple explanation sinceyearly rainfall, which occurs mostly during monsoon season, has not increasedsignificantly (figure 7). Moreover seasonal average wind speeds have decreased atthe same rate. But these differences in temperature increase tend to prove that thehigh increase in average temperature is not due to instrument errors.1000900800Rainfall (mm/y)700600500400300200y = 3.3293x + 480.6r 2 = 0.0152100019831984198519861987198819891990199119921993199419951996199719981999200020012002200320042005YearsFigure 7 Rainfall trend (yearly)30,0025,00Velocity (km/h)20,0015,0010,00Daily averageDaily max5,000,00y = -0.2842x + 8.4742r 2 = 0.806219831984198519861987198819891990199119921993199419951996199719981999200020012002200320042005YearsFigure 8 Wind velocity trendsThe wind trend in figure 8 shows a steady decline since 1983. It might be aconsequence of increase in plant cover in the region. Without green cover solarradiation heats the ground which creates more wind. Planting of trees in the closesurroundings (approx. 20m) of the weather station might have reinforced this trend.©NARI – September 2006 5/7
- Page 1 and 2: Long term weather trends in western
- Page 3: 1488%Rainfall (mm/d)12108641%14% 45
- Page 7: the increase in temperature should
while average temperature is increasing for both winter and summer, it remains moreor less constant for monsoon. This fact does not have any simple explanation sinceyearly rainfall, which occurs mostly during monsoon season, has not increasedsignificantly (figure 7). Moreover seasonal average wind speeds have decreased atthe same rate. But these differences in temperature increase tend to prove that thehigh increase in average temperature is not due to instrument errors.1000900800Rainfall (mm/y)700600500400300200y = 3.3293x + 480.6r 2 = 0.0152100019831984198519861987198819891990199119921993199419951996199719981999200020012002200320042005YearsFigure 7 Rainfall trend (yearly)30,0025,00Velocity (km/h)20,0015,0010,00Daily averageDaily max5,000,00y = -0.2842x + 8.4742r 2 = 0.806219831984198519861987198819891990199119921993199419951996199719981999200020012002200320042005YearsFigure 8 Wind velocity trendsThe wind trend in figure 8 shows a steady decline since 1983. It might be aconsequence of increase in plant cover in the region. Without green cover <strong>solar</strong><strong>radiation</strong> heats the ground which creates more wind. Planting of trees in the closesurroundings (approx. 20m) of the <strong>weather</strong> station might have reinforced this trend.©<strong>NARI</strong> – September 2006 5/7


