Appendix A, JSC report - TWA Flight 800 Investigation
Appendix A, JSC report - TWA Flight 800 Investigation
Appendix A, JSC report - TWA Flight 800 Investigation
- No tags were found...

Create successful ePaper yourself
Turn your PDF publications into a flip-book with our unique Google optimized e-Paper software.
APPENDIX A<strong>TWA</strong> FLIGHT <strong>800</strong> ELECTROMAGNETIC ENVRONMENTReport Prepared byDepartment of DefenseJoint Spectrum Center
<strong>JSC</strong>-CR-99-006DEPARTMENT OF DEFENSEJOINT SPECTRUM CENTERANNAPOLIS, MARYLAND21402-5064<strong>TWA</strong> FLIGHT <strong>800</strong>ELECTROMAGNETIC ENVIRONMENTPrepared forNational Transportation Safety BoardWashington, DC<strong>JSC</strong> Project EngineerRichard DeSalvoJanuary 1999CONSULTING REPORTPrepared byMartin Macrae and Douglas HughesIIT Research InstituteUnder Contract toDepartment of DefenseApproved for public release; distribution unlimited.
<strong>JSC</strong>-CR-99-006This <strong>report</strong> was prepared by the IIT Research Institute under contract F19628-95-C-0060 in supportof the DoD Joint Spectrum Center in Annapolis, Maryland.This <strong>report</strong> has been reviewed and is approved for publication.Reviewed by:MARTIN MACRAEProject Manager, IITRIALAN W. FITCHDivision ManagerApproved by:RICHARD B. LARSONTechnical DirectorORVILLE A. EARL, JR., Lt Col, USAFJ8 Department Head
R E P O R T D O C U M E N T A T I O N P A G EFORM APPROVEDOMB No. 0704-0188Public <strong>report</strong>ing burden for this collection of information is estimated to average 1 hour per response, including the time for reviewing instructions, searchingexisting data sources, gathering and maintaining the data needed, and completing and reviewing the collection of information. Send comments regardingthis burden estimate or any other aspect of this collection of information, including suggestions for reducing this burden to Washington Headquarters Services,Directorate for Information Operations and Reports, 1215 Jefferson Davis Highway, Suite 1204, Arlington VA, 22202-4302, and to the Office of Management andBudget, Paperwork Reduction Project (0704-0188), Washington, DC 205031. AGENCY USE ONLY (Leave blank) 2. REPORT DATE 3. REPORT TYPE AND DATES COVEREDJanuary 1999Consulting Report (CR)4. TITLE AND SUBTITLE (Include Security Classification) 5. FUNDING NUMBERS<strong>TWA</strong> <strong>Flight</strong> <strong>800</strong> Electromagnetic Environment6. AUTHOR(S)Martin Macrae and Douglas HughesC – F19628-95-C-0060CDRL – B012PR – P16257. PERFORMING ORGANIZATION NAMES(S) AND ADDRESS(ES) 8. PERFORMING ORGANIZATION REPORTNUMBERS<strong>JSC</strong>/J8<strong>JSC</strong>-CR-99-006Richard DeSalvo (410-293-2681, DSN 281-2681)120 Worthington BasinAnnapolis, MD 21402-50649. SPONSORING/MONITORING AGENCY NAME(S) AND ADDRESS(ES) 10. SPONSORING/MONITORING AGENCY REPORTNUMBERNational Transportation Safety Board (NTSB)490 E L’Enfant Plaza, SWWashington, DC 2059411. SUPPLEMENTARY NOTES12a. DISTRIBUTION/AVAILABILITY STATEMENT 12b. DISTRIBUTION CODEApproved for public release; distribution unlimited.13. ABSTRACT (Maximum 200 words)The National Transportation Safety Board (NTSB) requested the Joint Spectrum Center (<strong>JSC</strong>) to determine theelectromagnetic environment (EME) at the Trans World Airlines (<strong>TWA</strong>) <strong>Flight</strong> <strong>800</strong> aircraft location south of Long Island,New York, at approximately 8:30 in the evening on 17 July 1996. Air and sea traffic data from the NTSB accidentinvestigation docket was combined with data from <strong>JSC</strong>-maintained frequency assignment databases, equipmentcharacteristics file, and engineering models to calculate the accident location EME.14. SUBJECT TERMS 15. NUMBER OF PAGESElectric Field Strength, Power Density, Environment Emitters3016. PRICE CODE17. SECURITY CLASSIFICATION 18. SECURITY CLASSIFICATION OFTHIS PAGE19. SECURITY CLASSIFICATION OFABSTRACT20. LIMITATION OF ABSTRACTUnclassified Unclassified Unclassified Same As Report (SAR)NSN 7540-01-280-5500Standard Form 298 (Rev.2-89) Prescribed by ANSI/NISO Std.Z39.18 298-102i/ii
<strong>JSC</strong>-CR-99-006EXECUTIVE SUMMARYThe National Transportation Safety Board (NTSB) requested that the Joint Spectrum Center (<strong>JSC</strong>)calculate the electromagnetic environment (EME) at the Trans World Airlines <strong>Flight</strong> <strong>800</strong> aircraftaccident location. This study defines the peak and average electric field strength levels that couldhave been present at the <strong>TWA</strong> <strong>Flight</strong> <strong>800</strong> airframe due to emitters in the environment at the time ofthe accident.The emitters in the <strong>TWA</strong> <strong>800</strong> environment were categorized as either fixed or mobile. For fixedemitters the <strong>JSC</strong> examined database selects created over the past two years to identify a select thatboth included the area of interest and was closest to the time of the accident. The radio frequency(RF) characteristics of the emitters were subsequently collected and used to calculate the strength ofthe signals these emitters could have generated at the <strong>TWA</strong> <strong>800</strong> accident location. The identity andlocations of the mobile air and sea platforms were provided by the NTSB. Once the mobile platformswere identified, the platform equipment complements and the equipment RF characteristics weredetermined.These assumptions with regard to the analysis were made during consultations with the NTSB:• All fixed and mobile transmitters were assumed to be emitting except commercial airline highfrequency communications equipment.• A conservative electric field strength threshold of 1 V/m at the accident location was to beused to identify emitters-of-interest.• Maximum values of peak power, duty cycle, and antenna mainbeam gain were to be used toidentify emitters-of-interest.• The electric field strength predictions due to the emitters onboard US Air <strong>Flight</strong> 217 wereassumed to represent the worst case for the EME due to commercial aircraft emitters.• Refining calculations would be made for emitters identified as emitters-of-interest, taking intoaccount antenna gain in the direction of the accident location, non-line-of-sight propagationconditions and terrain blockage effects.iii
<strong>JSC</strong>-CR-99-006Once terrain and antenna pattern data were included in the field strength calculations, two groundbasedemitters were found to have the potential to generate an average electric field strength greaterthan 1 V/m at the accident location. Thirty-eight ground-based emitters were found to have thepotential to generate peak electric field strengths greater than 1 V/m. Seven mobile emitters werefound to have the potential to generate peak electric field strengths above 1 V/m at the accidentlocation. No mobile emitters were capable of generating an average field strength above 1 V/m.iv
<strong>JSC</strong>-CR-99-006TABLE OF CONTENTSGLOSSARY .......................................................................................................................viiSECTION 1 - INTRODUCTIONBACKGROUND......................................................................................................................1-1OBJECTIVE............................................................................................................................1-1APPROACH ............................................................................................................................1-1Overview............................................................................................................................1-1Environment Definition ......................................................................................................1-1Fixed Emitters.............................................................................................................1-2Mobile Emitters...........................................................................................................1-2Terms, Equations, and Units...............................................................................................1-3Power Density.............................................................................................................1-4Electric Field Strength.................................................................................................1-6Peak and Average Power.............................................................................................1-6Assumptions.......................................................................................................................1-7SECTION 2 – ANALYSISOVERVIEW............................................................................................................................2-1GROUND-BASED EMITTERS ..............................................................................................2-1AIRBORNE EMITTERS.........................................................................................................2-4SHIPBOARD EMITTERS.......................................................................................................2-7SECTION 3 - RESULTSv
<strong>JSC</strong>-CR-99-006TABLE OF CONTENTS – ContinuedILLUSTRATIONS2-1 Composite Radar Data Plot (Reference 1-1)......................................................................2-4TABLES2-1 <strong>TWA</strong> <strong>Flight</strong> <strong>800</strong> High Power Ground-Based Emitter Environment....................................2-22-2 Dominant Ground-Based Emitters ....................................................................................2-32-3 <strong>TWA</strong> <strong>Flight</strong> <strong>800</strong> Aircraft Environment..............................................................................2-52-4 Number and Frequencies of Airborne Navigation Emitters ................................................2-52-5 Number and Frequencies of Airborne Communication Emitters.........................................2-62-6 Number and Frequencies of Airborne Transponders and Interrogators...............................2-62-7 Number and Frequencies of Altimeters..............................................................................2-62-8 Number and Frequencies of Airborne Radars ....................................................................2-72-9 Ship Platforms Considered for EME Determination...........................................................2-82-10 Number and Frequencies of Shipboard Navigation Emitters ............................................2-82-11 Number and Frequencies of Shipboard Communication Emitters.....................................2-92-12 Number and Frequencies of Shipboard Transponders and Interrogators...........................2-92-13 Shipboard Electronic Warfare Emitters ...........................................................................2-92-14 Number and Frequencies of Shipboard Radars ..............................................................2-103-1 Functions and Locations of Fixed Emitters Generating Peak Field Strengths>1 V/m .............................................................................................................................3-23-2 Functions and Locations of Fixed Emitters Generating Average Field Strengths >1 V/m ...3-33-3 Functions of Mobile Emitters Generating Peak Electric Field Strengths >1 V/m ................3-3vi
<strong>JSC</strong>-CR-99-006GLOSSARYCIWS - Close-In Weapon SystemCOTS - Commercial Off-the-shelfDC - Duty CycleEIRP - Effective Isotropic Radiated PowerEME - Electromagnetic EnvironmentFAA - Federal Aviation AdministrationFCC - Federal Communications CommissionFRRS - Frequency Resource Record SystemGMF - Government Master FileGSORTS - Global Command and Control System/Status of Resources and TrainingSystemHF - High Frequency<strong>JSC</strong> - Joint Spectrum CenterLOS - Line-of-SightNAVSEA - Naval Sea Systems CommandNTSB - National Transportation Safety BoardRF - Radio Frequency<strong>TWA</strong> - Trans World AirlinesUSAF - United States Air ForceUSCG - United States Coast GuardUSN - United States NavyVHF - Very High Frequencyvii/viii
<strong>JSC</strong>-CR-99-006vi
<strong>JSC</strong>-CR-99-006SECTION 1 - INTRODUCTIONBACKGROUNDThe National Transportation Safety Board (NTSB) requested that the Joint Spectrum Center (<strong>JSC</strong>)calculate the electromagnetic environment (EME) at the Trans World Airlines (<strong>TWA</strong>) <strong>Flight</strong> <strong>800</strong>aircraft accident location south of Long Island, NY, at approximately 8:30 in the evening on 17 July1996. The latitude and longitude of the <strong>TWA</strong> <strong>Flight</strong> <strong>800</strong> aircraft, at the time of the accident, were 40°39’ 52” N and 72° 37’ 46” W, respectively. 1-1 The aircraft altitude was approximately 13,750 feet,and the aircraft heading was 69° from True North.OBJECTIVEThe objective of this study was to define the peak and average field strength levels that could havebeen present at the <strong>TWA</strong> <strong>Flight</strong> <strong>800</strong> airframe due to individual electromagnetic emitters in theenvironment at the time of the accident.APPROACHOverviewThe electromagnetic emitters in the <strong>TWA</strong> <strong>800</strong> environment were categorized as being either fixed ormobile emitters. The <strong>JSC</strong>-maintained frequency assignment databases were used to identify fixedemitters. The NTSB, US Navy, Air National Guard, and US Coast Guard supplied informationidentifying the mobile platforms.Environment DefinitionThe radio frequency (RF) emitters in the <strong>TWA</strong> <strong>Flight</strong> <strong>800</strong> environment were identified as being eitherfixed or mobile. Ground-based emitters with frequency assignments for the eastern US comprised the1-1 <strong>TWA</strong> <strong>800</strong> Accident <strong>Investigation</strong>, Baltimore, MD: National Transportation Safety Board, 12 December 1997, CD-ROM containing the exhibits presented under Docket Number SA-516.1-1
<strong>JSC</strong>-CR-99-006fixed emitters. The RF equipment onboard air and sea platforms in the vicinity of <strong>TWA</strong> <strong>Flight</strong> <strong>800</strong>comprised the mobile emitters.Fixed EmittersThe <strong>JSC</strong> maintains a number of frequency assignment databases. These frequency assignmentdatabases provide a record of the ground- and space-based commercial, military, government, andscientific RF equipment that are operated in the US and overseas. Some databases are updated daily,others are updated yearly. Due to the size of the databases and the expense of routinely storingcopies of the databases, there are no formal permanent archives. This analysis was requested twoyears after the accident, and consequently the current fixed emitter frequency assignment databasesdo not reflect the fixed emitter environment for the time of the accident. The <strong>JSC</strong> reviewed databaseselects created over the last two years to identify a fixed US emitter file created closest to the time ofthe accident.A frequency assignment database select previously performed in 1997 to identify high-poweredemitters in the United States, was located. A comparison between the records in this 1997 select anda similar 1994 database select, prepared for the Federal Aviation Administration (FAA), indicatedalmost no change in the high-power emitter environment for the Eastern US. Consequently, the 1997database select was considered the most accurate description of the high-power fixed emittersoperating at the time of the accident.The RF characteristics of the fixed emitters were collected and the electric field strengths theseemitters could generate at the accident location were calculated on the basis of their RFcharacteristics, their separation distances from the accident location, and the propagation path lossesassociated with the respective separation distances. Those emitters that generated field strengths ofinterest were identified.Mobile EmittersLocations of the air and sea platforms in the vicinity of <strong>TWA</strong> <strong>Flight</strong> <strong>800</strong> at the time of the accidentwere provided by the NTSB. Aircraft near the accident location were identified through the air trafficradar composites prepared for one phase of the accident investigation. US Coast Guard (USCG) and1-2
<strong>JSC</strong>-CR-99-006US Navy (USN) vessels near the accident location were identified through GSORTS 1-2 recordsprovided to the NTSB. While air and sea platform locations were readily extracted from thesesources, the specific headings were only partially available.Once the mobile platforms were identified, the platform equipment complements were identified.Military aircraft avionics suites were extracted from US Air Force (USAF) and USN documentation.The naval shipboard equipment complements were obtained from Naval Sea Systems Command(NAVSEA) documents. The equipment complements of the commercial aircraft and USCG vesselwere obtained from the technical literature available at the <strong>JSC</strong>, NTSB, and direct contact with theUSCG. Subsequently, the RF characteristics of the mobile emitters were collected and examined todetermine the strength of the signals these emitters could have generated at the accident location.Terms, Equations, and UnitsA two-step approach was employed in calculating the field strengths of interest. The power densitiesat the accident location generated by each emitter were calculated and then were converted to electricfield strength levels. Decibel units were chosen to simplify the power density calculations. Power,gain, and loss values may be stated in terms of decibels (dB), the logarithm of the ratio of twonumbers. The general expression for the decibel ratio of two powers, A and B, is as follows:The Ratio of Power A/Power B, in dB = 10 log 10 (Power A/Power B)= 10 log 10 (Power A) – 10 log 10 (Power B)In particular, transmitter power is often expressed in terms of decibels relative to a milliwatt (dBm);the decibel ratio of the transmitter power to a reference level of one thousandth of a watt, or:10 log 10 (transmitter power in watts/0.001 watts)When antenna gain (a unitless ratio) is expressed in decibels, the units term ‘dBi’ is employed toindicate the gain of the antenna is referenced to an isotropic (equal gain in all directions) antenna.Decibels are added or subtracted where the original units are multiplied or divided. For instance,effective isotropic radiated power (EIRP), which is defined as the product of transmitter power and1-2 G (Global Command and Control System) SORTS (Status of Resources and Training System), Washington, DC: JointData Systems Support Center, April 1998.1-3
<strong>JSC</strong>-CR-99-006antenna gain, is expressed in decibels as the sum of the transmitter power, in dBm, and the antennagain, in dBi, as follows:whereEIRP = P T + G TEIRP = effective isotropic radiated power, in dBmP T = peak transmitter power, in dBmG T = gain of the transmit antenna, in dBi.(1-1)Power DensityThe power density calculation is based upon the expression for the power density flowing outwardfrom a point charge source through a specified area on the surface of an imaginary sphere whoseradius is the distance from the point charge. If transmitter power and antenna gain are substituted forthe point charge source, the power density generated by an emitter in free space can be expressed asfollows:whereP d = (10 EIRP/10 )/(4 Br 2 )P d = power density, in milliwatts/m 2r = distance from the emitter, in meters4 B r 2 = surface area of a sphere of radius r, in square metersB = 3.14, ratio of the circumference to the diameter of a circle.(1-2)When expressed in decibels the power density equation for free space path loss is:wherePD = EIRP – 20 log 10 r m – 10.99PD = power density, in dBm/m 2r m = distance from the emitter, in meters.(1-3)1-4
<strong>JSC</strong>-CR-99-006When the units of distance are changed to nautical miles (nmi), the power density equation indecibels is written as:wherePD = EIRP – 20 log 10 r nmi – 76.34r nmi = distance from the emitter, in nmi.(1-4)The following equation was used to determine radio line of sight (LOS) from the aircraft to emittersin the environment.whereLOS = 2h 1+ 2h 2LOS = radio LOS distance, in statute milesh 1 = height of the emitter antenna, in feeth 2 = altitude of the aircraft, in feet.(1-5)Radio LOS was approximately 150 nmi from the <strong>TWA</strong> <strong>Flight</strong> <strong>800</strong> altitude of 13,750 ft to groundbasedor shipboard emitters with antenna heights of 50 ft. Free space path loss calculations wereemployed for fixed and mobile emitters within radio LOS of <strong>TWA</strong> <strong>Flight</strong> <strong>800</strong>. For emitters locatedbeyond radio LOS, either a smooth-earth model, a smooth-earth-over-seawater model, or a terraindependentmodel was used to calculate propagation path loss.Equation 1-2 applies for the LOS case. For the beyond LOS case:whereP d = F 2 B 10 (EIRP/10) /(22,500 λ p )(1-6)λ p = 10 Lp/10 , path loss as a unitless ratioL p = path loss predicted using the appropriate path loss model, in dBF = frequency of transmission, in MHz.1-5
<strong>JSC</strong>-CR-99-006Electric Field StrengthOnce the power density is calculated, the electric field strength in free space can be determined.Power density is converted to electric field strength according to the following relationship:whereFS = (P d 120B/1000) 1/2FS = electric field strength in volts/m120B = impedance of free space, in ohms.(1-7)The conversion from power density in dBm/m 2 to electric field strength becomes:[(PD - 4.24)/20]FS =10(1-8)Electric fields generated by multiple emitters on the same frequency were not summed in the results.Peak and Average PowerUnless otherwise stated all calculations refer to peak power and field strength. When it wasnecessary to determine the power density based upon the average power of an emitter, the duty cycle(DC) of the emitter was factored into the EIRP, as follows:whereP Tave = P T DCP Tave = average transmitter power, in milliwattsP T = peak transmitter power, in milliwattsDC = (PW) (PRF), unitlessPW = pulsewidth, in secondsPRF = pulse repetition rate, in pulses/second.(1-9)The calculation of average EIRP in dBm is simply:EIRP avg = EIRP + 10 Log 10 (DC)(1-10)1-6
<strong>JSC</strong>-CR-99-006AssumptionsThe following assumptions were used in calculating the potential electric field strengths at the <strong>TWA</strong><strong>Flight</strong> <strong>800</strong> accident location. These assumptions were developed in consultation with the NTSB.All fixed and mobile transmitters were assumed to be emitting except commercial airline highfrequency (HF) communications (comm) equipment. Commercial airline HF comm equipment aretypically not employed when very high frequency (VHF) air traffic control is available. Military HFcomm transmitters were assumed to be active at the time of the accident.In calculating the peak and average electric field strengths generated at <strong>TWA</strong> <strong>Flight</strong> <strong>800</strong>, maximumvalues of peak power, duty cycle, and antenna mainbeam gain were assumed. Where the duty cyclesof pulsed emitters were unavailable, the <strong>JSC</strong> compared combinations of pulsewidths and pulserepetition rates to determine the highest duty cycle. Where mainbeam illumination of the <strong>TWA</strong><strong>Flight</strong> <strong>800</strong> aircraft by fixed or mobile emitter antennas was determined not to have occurred, sidelobeantenna gain values were used to calculate electric field strength.The avionics onboard US Air <strong>Flight</strong> 217 were assumed to be representative of the commercial aircraftin the vicinity of <strong>TWA</strong> <strong>Flight</strong> <strong>800</strong>. Since US Air <strong>Flight</strong> 217 was the closest commercial aircraft to<strong>TWA</strong> <strong>Flight</strong> <strong>800</strong>, the electric field strength predictions due to the emitters onboard US Air <strong>Flight</strong> 217were assumed to represent the worst case for the EME due to commercial aircraft emitters.An electric field strength of 1 V/m at the accident location was selected as a conservative threshold ofinterest. Fixed emitters that did not exceed the 1 V/m threshold were not identified. Mobile emittersthat did not exceed the 1 V/m threshold were not identified in Section 3 but were <strong>report</strong>ed inSection 2.1-7/1-8
<strong>JSC</strong>-CR-99-006SECTION 2 - ANALYSISOVERVIEWThe electric field strength calculations for each emitter were performed using a commercial-off-theshelf(COTS) software spreadsheet. The decibel versions of the power density and electric fieldstrength equations, described in Section 1, were used in the spreadsheets. Various <strong>JSC</strong> automatedprograms were employed to calculate smooth earth and terrain losses where free space LOSpropagation paths did not exist.GROUND-BASED EMITTERSThe fixed ground-based emitters in the accident environment were identified through the frequencyassignment records in the <strong>JSC</strong>-maintained databases. The Frequency Resource Record System(FRRS), the Government Master File (GMF), and the Federal Communications Commission (FCC)databases were the sources for the emitter records that were analyzed. The FRRS database is therepository for all military equipment frequency assignments. The GMF database contains nonmilitarygovernment frequency assignments. The FCC database is comprised of the frequencyassignments provided to commercial and public frequency spectrum users.Map inspection indicates a 10-nmi slant range between <strong>TWA</strong> <strong>Flight</strong> <strong>800</strong> and the closest point on theLong Island shore. An EIRP of 100.6 dBm is the minimum effective isotropic radiated power levelrequired by a ground-based emitter, at the closest point to the accident location, to generate anelectric field strength of 1 V/m at the accident location. In selecting records for further analysis, aconservative EIRP cull level of 88 dBm was employed. Of the emitter records in the 1997 databaseselect, 3,403 had EIRPs greater than 88 dBm. This number of emitter records was considered toolarge to list in this <strong>report</strong>.Power density values were calculated for the separation distance between the accident location andeach of the emitters identified. After converting power density to electric field strength (seeSection 1), 144 ground-based emitter records indicated the associated emitter had the potential togenerate field strengths above 1 V/m at the accident location. Table 2-1 lists the equipment typesfound in the 144 emitter records.2-1
<strong>JSC</strong>-CR-99-006Table 2-1. <strong>TWA</strong> <strong>Flight</strong> <strong>800</strong> High Power Ground-Based Emitter EnvironmentEmitter TypeAirport Surveillance RadarAir Route Surveillance RadarAirport Surface Detection EquipmentMilitary Navigation RadarWeather RadarTerminal Doppler Weather RadarLong Range Tracking RadarNavy Radar Shore InstallationsSpace Object Tracking RadarOver-The-Horizon RadarResearch and Development EmittersPropagation path losses were calculated for the signal paths associated with the 144 culled emitterrecords. All the ground-based emitters beyond radio LOS (see Section 1) from the accident locationwere found to lack the EIRP required to generate peak electric field strengths greater than 1 V/m atthe accident location, once terrain effects were factored into the path loss. When antenna patterninformation was available, the elevation and horizontal scan patterns of the remaining groundemitters were also investigated. In many cases minimum antenna elevation angles precludedmainbeam illumination of the accident location. Once terrain and antenna pattern data was includedin the field strength calculations, only 40 emitter records indicated the associated emitter had thepotential to generate peak electric field strengths above 1 V/m at the accident location.Through a similar procedure, only two ground-based emitters were found to generate an averageelectric field strength greater than 1 V/m. The 40 emitter records that describe the 38 emitterscapable of generating peak or average electric field strengths above 1 V/m are identified in Table 2-2.One of the 38 emitters, the tracking radar at Westford, has three emitter records due to variations inemission type. The Westford tracking radar was also one of the two ground-based emitters capableof generating an average electric field strength greater than 1 V/m. The other ground-based emitterfound to be capable of generating average electric field strengths above 1 V/m at the accidentlocation was the weather radar at Brookhaven.2-2
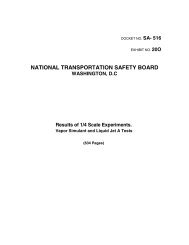
<strong>JSC</strong>-CR-99-006Figure 2-1. Composite Radar Data Plot (Reference 1-1)AIRBORNE EMITTERSAircraft in the immediate vicinity of <strong>TWA</strong> <strong>Flight</strong> <strong>800</strong> at the time of the accident were identified byprimary (skin reflection) and secondary (transponder) radar return plots presented at the accidentinvestigation public hearing (Exhibit 13A, Reference 1-1) and through NTSB discussions with theUSAF and USN. Figure 2-1, taken from Exhibit 13A, identifies the craft that were tracked between8:28 and 8:32 p.m. on 17 July 1996. The aircraft identified from Figure 2-1, and other aircraftidentified by the NTSB staff, are listed in Table 2-3.The actual number and the operating frequencies of the navigation and communication equipments inthe vicinity of the accident location are identified in Table 2-4 and 2-5, respectively. The number and2-4
<strong>JSC</strong>-CR-99-006operating frequencies of the airborne transponders and interrogators, altimeters, and radars, in thevicinity of the accident location, are identified in Tables 2-6, 2-7, and 2-8, respectively.Table 2-3. <strong>TWA</strong> <strong>Flight</strong> <strong>800</strong> Aircraft EnvironmentFrom <strong>TWA</strong> <strong>800</strong>Distance Bearing Altitude<strong>Flight</strong>Aircraft (nmi) (degrees true) (ft)US Air 217 B-737-400 (4B7) 2.5 218 17,000AT 450 P-3C 2.9 207 20,000<strong>TWA</strong> 900 B-747 8.7 270 19,000AMTRANS 493 L-1011 9 340 30,000JOLLY 14 HH-60G 10.5 359 300KING 74 HC-130P 13 57 1,000N1182J AC-12 17 UNKNOWN 8,000VIR 009 B-747 20.5 UNKNOWN 17,500PDE 3112 MD-80 21.5 UNKNOWN 11,000BBE 507 UNKNOWN 22 UNKNOWN 18,000AZ 609 UNKNOWN 25 UNKNOWN 18,500GRA 507 UNKNOWN 51.5 UNKNOWN 24,000USAF KC-10A 25* UNKNOWN UNKNOWNUSAF C-141B 25* UNKNOWN UNKNOWN* Note: Assumed distance separationTable 2-4. Number and Frequencies of Airborne Navigation EmittersNumberinFrequency(MHz)Environment Low High5 1025 11501 3390 35101 13320 133301 13325 13325Table 2-5. Number and Frequencies of Airborne Communication EmittersFrequencyNumber(MHz)inEnvironment Low High2-5
<strong>JSC</strong>-CR-99-0065 2 304 30 882 116 1492 116 1521 118 1361 118 155.9751 150 1731 156 173.9757 225 399.9753 294.2 317.211 1626.5 1661Table 2-6. Number and Frequencies of Airborne Transponders and InterrogatorsNumberinFrequency(MHz)Environment Low High2 1030 10306 1090 10901 8<strong>800</strong> 9500Table 2-7. Number and Frequencies of AltimetersNumberinFrequency(MHz)Environment Low High5 4200 44002-6
<strong>JSC</strong>-CR-99-006Table 2-8. Number and Frequencies of Airborne RadarsNumberinFrequency(MHz)Environment Low High2 8500 96001 9315 93751 9335 94152 9374 93761 9375 9375SHIPBOARD EMITTERSUSCG and USN ships <strong>report</strong>ed to NTSB staff as being in the accident area are listed in Table 2-9.Exact location (latitude and longitude) details are available for only the USCG ship. The mobileemitter slant ranges and bearing were determined from the NTSB accident investigation <strong>report</strong>s(Exhibit No. 13A, Reference 1-1) and the GSORTS file data (Reference 1-2). For those caseswhere bearings were provided as compass directions, the compass directions were converted intodegrees for this <strong>report</strong> (i.e. NE, E, S, and SW were presented as 45, 90, 180, and 225 degrees,respectively).The shipboard navigation emitters are identified by function and operating frequency in Table 2-10.Tables 2-11 and 2-12 provide the number and operating frequencies of the shipboard environmentcommunications emitters and transponders/interrogators, respectively. The three shipboard systemswith classified RF characteristics are identified in Table 2-13. The emissions of the three classifiedsystems did not result in electric field strengths above 1 V/m at the <strong>TWA</strong> <strong>800</strong> accident location. Thenumber and operating frequencies of the shipboard radars are identified in Table 2-14.2-7
<strong>JSC</strong>-CR-99-006Table 2-11. Number and Frequencies of Shipboard Communication EmittersNumberinFrequency(MHz)Environment Low High5 2 301 30 75.951 30 87.9751 116 1492 116 1522 156.025 157.4254 225 4002 824 8942 1636.5 1644.91 4945 49607 43500 45500Table 2-12. Number and Frequencies of Shipboard Transponders and InterrogatorsNumberinFrequency(MHz)Environment Low High2 1030 10303 1090 1090Table 2-13. Shipboard Electronic Warfare EmittersFrequencyEmitter(MHz)Function Low HighElectronic WarfareSystemClassified ClassifiedIlluminator Classified ClassifiedClose In WeaponSystem (CIWS)Classified Classified2-9
<strong>JSC</strong>-CR-99-006Table 2-14. Number and Frequencies of Shipboard RadarsNumberinFrequency(MHz)Environment Low High2 850 9421 3100 35001 5450 58251 8795 88552 9345 94272-10
<strong>JSC</strong>-CR-99-0062-11
<strong>JSC</strong>-CR-99-0062-13/2-14
<strong>JSC</strong>-CR-99-006SECTION 3 - RESULTSThe emitters that were predicted to have the potential to generate peak and average electric fieldstrengths above 1 V/m are identified in the following tables. No mobile emitters, shipboard orairborne, could generate average electric field strengths above 1 V/m. Only two fixed emittersgenerated an average field strength above 1 V/m. Although many classified emitters were identifiedin the environment, none of them were close enough or powerful enough to generate peak or averageelectric field strengths above 1 V/m.The functions, locations, and field strength values of the fixed emitters capable of generating peakand average electric field strengths above 1 V/m are provided in Table 3-1 and Table 3-2,respectively. The mobile emitters capable of generating electric field strengths above 1 V/m areprovided in Table 3-3.3-1
<strong>JSC</strong>-CR-99-006Table 3-1. Functions and Locations of Fixed Emitters Generating Peak Field Strengths >1 V/mFUNC FRQ FRU LOC XSC FS VMNavail 420 435 MELVILLE CT 1.7Search 1294.6 0 RIVERHEAD NY 17.9Track 1295 0 WESTFORD MA 11.6Search 1326.92 0 RIVERHEAD NY 3.5GCA 2715 0 NEWARK NJ 2.4Search 2715 0 NEWARK NJ 1.5Search 2730 0 MCGUIRE NJ 1.1Search 2745 0 ISLIP NY 7.6GCA 2745 0 ISLIP NY 7.4GCA 2755 0 JAMAICA NY 3.1GCA 2765 0 NEWBURGH NY 2.3GCA 2780 0 WINDSOR LOCKS CT 2.2Search 2795 0 WHITE PLAINS NY 3.3ATC 2<strong>800</strong> 0 MCGUIRE NJ 1.0GCA 2830 0 COVENTRY RI 2.2Weather 2865 0 BLOOMFIELD CT 7.1Weather 2865 0 ALBANY NY 3.8Weather 2870 0 PHILADELPHIA PA 5.3Weather 2875 0 BROOKHAVEN NY 32.6Weather 2890 0 BOSTON MA 5.0Weather 2895 0 BLOOMFIELD CT 7.1Search 2900 3100 ORANGE CT 7.9Search 2900 3100 NORTH SMITHFIELD RI 3.8Search 2900 3100 WORCESTER MA 3.0Search 3100 3500 MOORESTOWN NJ 8.2Navail 3100 3500 MOORESTOWN NJ 4.1Weather 5603 0 LA GUARDIA NY 10.1Weather 5610 0 BOSTON MA 4.0Weather 5610 0 PENNSAUKEN NJ 3.9Weather 5620 0 WOODBRIDGE NJ 6.2Weather 5640 0 ATLANTIC CITY NJ 4.1Weather 5647 0 NEW YORK JFK NY 11.4Track 9100 0 CALVERTON NY 13.7Navail 9410 0 GOVERNORS ISLAND NY 1.0Navail 9475 0 SANDY HOOK NJ 1.0Search 23600 24470 NEWARK NJ 1.7Weather 34512 35208 OTIS MA 3.8Weather 34512 35208 HANSCOM MA 3.8FUNC – Function; GCA – Ground Control Approach; ATC – Air Traffic ControlFRQ – Lower Emitter Operating Frequency, in MHzFRU – Upper Frequency of Emitter, in MHz. Value of ‘0’ indicates the emitter opeates at the discrete frequencyof ‘FRQ’LOC – CityXSC – StateFS VM – Peak Electric Field Strength, in volts per meter3-2
Table 3-2. Functions and Locations of Fixed Emitters GeneratingAverage Field Strengths > 1 V/mFUNC FRQ FRU LOC XSC AVG FSTrack 1295 0 WESTFORD MA 2.0Weather 2875 0 BROOKHAVEN NY 1.2AVG FS – Average Electric Field Strength, in volts per meter<strong>JSC</strong>-CR-99-006Table 3-3. Functions of Mobile Emitters Generating PeakElectric Field Strengths > 1 V/mFUNC FRQ FRU FS VMShipboard Radar 3100 3500 3.8Shipboard Radar 5450 5825 1.2Airborne Radar 8500 9600 23.8Airborne Radar 9335 9415 1.7Shipboard Radar 9345 9427 2.1Airborne Radar 9374 9376 1.4Airborne Radar 9374 9376 1.43-3/3-4