2010 Report - Pennsylvania Public Utility Commission
2010 Report - Pennsylvania Public Utility Commission
2010 Report - Pennsylvania Public Utility Commission

You also want an ePaper? Increase the reach of your titles
YUMPU automatically turns print PDFs into web optimized ePapers that Google loves.
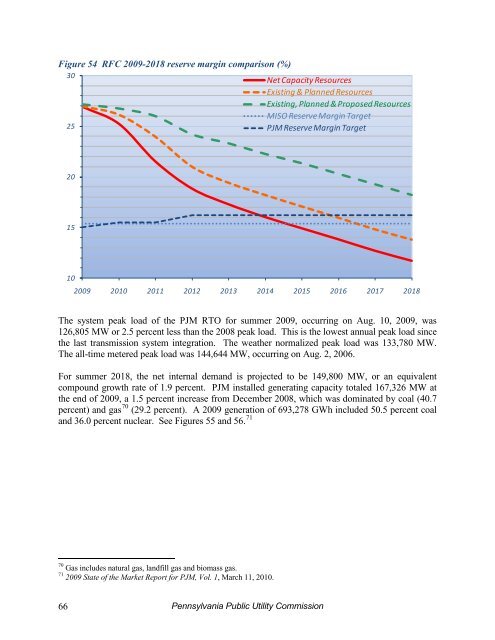
Figure 54 RFC 2009-2018 reserve margin comparison (%)3025Net Capacity ResourcesExisting & Planned ResourcesExisting, Planned & Proposed ResourcesMISO Reserve Margin TargetPJM Reserve Margin Target2015102009 <strong>2010</strong> 2011 2012 2013 2014 2015 2016 2017 2018The system peak load of the PJM RTO for summer 2009, occurring on Aug. 10, 2009, was126,805 MW or 2.5 percent less than the 2008 peak load. This is the lowest annual peak load sincethe last transmission system integration. The weather normalized peak load was 133,780 MW.The all-time metered peak load was 144,644 MW, occurring on Aug. 2, 2006.For summer 2018, the net internal demand is projected to be 149,800 MW, or an equivalentcompound growth rate of 1.9 percent. PJM installed generating capacity totaled 167,326 MW atthe end of 2009, a 1.5 percent increase from December 2008, which was dominated by coal (40.7percent) and gas 70 (29.2 percent). A 2009 generation of 693,278 GWh included 50.5 percent coaland 36.0 percent nuclear. See Figures 55 and 56. 7170 Gas includes natural gas, landfill gas and biomass gas.71 2009 State of the Market <strong>Report</strong> for PJM, Vol. 1, March 11, <strong>2010</strong>.66<strong>Pennsylvania</strong> <strong>Public</strong> <strong>Utility</strong> <strong>Commission</strong>