2010 Report - Pennsylvania Public Utility Commission
2010 Report - Pennsylvania Public Utility Commission
2010 Report - Pennsylvania Public Utility Commission

Create successful ePaper yourself
Turn your PDF publications into a flip-book with our unique Google optimized e-Paper software.
ELECTRIC POWER OUTLOOKFOR PENNSYLVANIA2009–2014July <strong>2010</strong>Published annually by:<strong>Pennsylvania</strong> <strong>Public</strong> <strong>Utility</strong> <strong>Commission</strong>P.O. Box 3265Harrisburg, PA 17105-3265www.puc.state.pa.usPrepared by Blaine J. LoperBureau of Conservation, Economics and Energy PlanningWayne Williams, Ph.D., Director
Executive SummaryIntroductionSection 524(a) of the <strong>Public</strong> <strong>Utility</strong> Code (Code) requires jurisdictional electric distributioncompanies to submit to the <strong>Commission</strong> information concerning plans and projections for meetingfuture customer demand. 1 The <strong>Commission</strong>’s regulations set forth the form and content of suchinformation, which is to be filed on or before May 1 of each year. 2 Section 524(b) of the Coderequires that the <strong>Commission</strong> prepare an annual report summarizing and discussing the dataprovided, on or before Sept. 1. This report is to be submitted to the General Assembly, theGovernor, the Office of Consumer Advocate and each affected public utility. 3Since the enactment of the Electricity Generation Customer Choice and Competition Act, 4 the<strong>Commission</strong>’s regulations have been modified to reflect the competitive market. Thus, projectionsof generating capability and overall system reliability have been obtained from regionalassessments.OverviewThis report concludes that there is sufficient generation, transmission and distribution capacity toreasonably meet the needs of <strong>Pennsylvania</strong>’s electricity consumers for the near future. Additionalgenerating capacity will likely be needed by 2015.Regional generation adequacy and reserve margins of the Mid-Atlantic area have been maintained.While sufficient generation capacity is expected through 2014, the <strong>Commission</strong> will continue itscurrent policy of encouraging generation adequacy within the region.With respect to transmission adequacy, the transmission system in the Mid-Atlantic Region hassufficient capacity to meet demand. Transmission expansions and upgrades are being planned forthe next five years to reinforce the bulk power grid.To summarize the relevant statistics in this report, electricity demand in <strong>Pennsylvania</strong> has grown atan average annual rate of 1.0 percent over the past 15 years. This is an aggregate figure for allsectors, including industrial, commercial and residential. Average total sales growth from 2004 to2009 was 0.1 percent. Aggregate sales in 2009 totaled 142,161 GWh, a 4.2 percent decrease fromthat of 2008. The current projections for 2009-14 show electricity demand growth at 1.4 percentannually. This includes a residential growth rate of 0.9 percent, a commercial growth rate of 1.9percent and an industrial growth rate of 1.6 percent.Regionally, generating resources are projected to be adequate for the next several years.ReliabilityFirst Corporation’s net internal demand forecast shows it increasing from 169,900 MWin 2009 to 193,100 MW in 2018 at an average annual growth rate of 1.4 percent. The need foradditional capacity resources ranges from 929 MW in 2015 to 7,160 MW in 2018 to maintain an1 66 Pa. C.S. § 524(a).2 52 Pa. Code §§ 57.141—57.154.3 66 Pa.C.S. § 524(b).4 66 Pa.C.S. §§ 2801—2812.Electric Power Outlook for <strong>Pennsylvania</strong> 2009-2014i
adequate reserve margin. Net capacity resources are projected to be 219,755 MW by 2018,resulting in a reserve margin of 13.8 percent, not including conceptual resources.<strong>Pennsylvania</strong> must maintain its commitment to the basics of energy production and to encouragenew initiatives in demand side response, energy efficiency, renewable energy, and other newtechnologies so we can continue as a national leader in these areas. We also need to continueproviding assistance to low-income customers to reduce their energy consumption.Alternative Energy Portfolio Standards (Act 213)The <strong>Commission</strong> continues to implement procedures and guidelines necessary to carry out therequirements of Act 213. 5 Act 213 requires that an annually increasing percentage of electricitysold to retail customers be derived from alternative energy resources, including solar, wind, lowimpacthydropower, geothermal, biologically derived methane gas, fuel cells, biomass, coal minemethane, waste coal, demand side management, distributed generation, large-scale hydropower,by-products of wood pulping and wood manufacturing, municipal solid waste, and integratedcombined coal gasification technology. The amount of electricity to be supplied by alternativeresources increases to a total of 18 percent by 2021. A subsequent amendment to Act 213 requiredthe <strong>Commission</strong> to update its net-metering regulations. Among other things, this allows netmeteredcustomer-generators to receive full retail value for all energy produced in excess ofinternal use.The <strong>Commission</strong> issued a Final Order governing the participation of demand side management,energy efficiency and load management programs and technologies in the alternative energymarket. The <strong>Commission</strong> also issued Final Orders governing net metering and interconnection forcustomer-generators using renewable resources, consistent with the goal of Act 213, andpromoting onsite generation by eliminating barriers, which may have previously existed regardingnet metering and interconnection.Energy Efficiency and Conservation Program (Act 129)Act 129 of 2008 6 added Section 2806.1 to the <strong>Public</strong> <strong>Utility</strong> Code which requires that the<strong>Commission</strong> adopt an energy efficiency and conservation program for the reduction of energydemand and consumption within the service territory of each electric distribution company with atleast 100,000 customers. 7 Sales are to be reduced by 1 percent by May 31, 2011, and 3 percent byMay 31, 2013. Peak demand is to be reduced by 4.5 percent by May 31, 2013. Based on forecastgrowth data, consumption reduction goals total 1,467 GWh in 2011 and 4,400 GWh in 2013. Peakdemand reduction goals total 1,193 MW for 2013. 8 Plans were filed on July 1, 2009.Act 129 also requires an increase in the percentage share of Tier I alternative energy resources tobe sold under the provisions of Act 213.5 Alternative Energy Portfolio Standards Act, effective Feb. 28, 2005; 73 P.S. §§ 1648.1—1648.8.6 Energy Efficiency and Conservation Program, signed by Gov. Rendell on Oct.15, 2008.7 66 Pa.C.S. § 2806.1.8 Docket No. M-2008-2069887.ii<strong>Pennsylvania</strong> <strong>Public</strong> <strong>Utility</strong> <strong>Commission</strong>
ContentsSection 1 - IntroductionPurpose .................................................................................................................................. 1Regional Reliability Organizations ...................................................................................... 2North American Electric Reliability Corporation .................................................... 2ReliabilityFirst Corporation ..................................................................................... 4Regional Transmission Organizations ................................................................................. 5PJM Interconnection ................................................................................................. 5Midwest Independent System Operator .................................................................... 7Transmission Line Expansion ............................................................................................... 7Trans-Allegheny Interstate Line ................................................................................ 10Susquehanna-Roseland 500 kV Line ......................................................................... 11Electric Distribution Companies .......................................................................................... 13Alternative Energy Portfolio Standards ............................................................................... 14Energy Efficiency and Conservation Program .................................................................... 17Act 129 ....................................................................................................................... 17Smart Meters and Time-of-Use Rates ....................................................................... 18PURPA .................................................................................................................................. 18Section 2 – Historic and Forecast Data2009: A Year in Review ......................................................................................................... 20Forecasting Trends ............................................................................................................... 22Introduction ............................................................................................................... 22Forecasting Methodologies ....................................................................................... 22Sectorial and Regional Trends .................................................................................. 25Trends in Forecast Accuracy .................................................................................... 29Summary of EDC Data ......................................................................................................... 32Duquesne Light Company ......................................................................................... 32Metropolitan Edison Company ................................................................................. 35<strong>Pennsylvania</strong> Electric Company ............................................................................... 38<strong>Pennsylvania</strong> Power Company ................................................................................. 41PPL Electric Utilities Corporation ........................................................................... 44PECO Energy Company ............................................................................................ 47West Penn Power Company ...................................................................................... 51UGI Utilities Inc.—Electric Division ........................................................................ 54Citizens’ Electric Company ....................................................................................... 56Pike County Light & Power Company ..................................................................... 57Wellsboro Electric Company .................................................................................... 59Electric Power Outlook for <strong>Pennsylvania</strong> 2009-2014iii
Section 3 – Regional ReliabilityRegional Reliability Assessments ......................................................................................... 61North American Electric Reliability Corporation ............................................................... 61Reliability Assessment ............................................................................................... 61ReliabilityFirst Corporation ................................................................................................. 65Compliance Standards .............................................................................................. 65Reliability Assessment ............................................................................................... 65<strong>Pennsylvania</strong> ......................................................................................................................... 70Section 4 - ConclusionsConclusions ........................................................................................................................... 73Appendix A – Data TablesActual and Forecast Data Tables ......................................................................................... 75Appendix B – Plant Additions and UpgradesStatus of <strong>Pennsylvania</strong>’s Plant Additions and Upgrades .................................................... 83Appendix C – Existing Generating Facilities<strong>Pennsylvania</strong>’s Existing Electric Generating Facilities ...................................................... 90iv<strong>Pennsylvania</strong> <strong>Public</strong> <strong>Utility</strong> <strong>Commission</strong>
Section 1 - IntroductionPurposeElectric Power Outlook for <strong>Pennsylvania</strong> 2009-2014 summarizes and discusses the current andfuture electric power supply and demand situation for the 11 investor-owned jurisdictional electricdistribution companies (EDCs) operating within the Commonwealth and the entities responsiblefor maintaining the reliability of the bulk electric supply system within the region whichencompasses the state.The Bureau of Conservation, Economics and Energy Planning prepared this report, pursuant toTitle 66, <strong>Pennsylvania</strong> Consolidated Statutes, Section 524(b). This report is submitted annually tothe General Assembly, the Governor, the Office of Consumer Advocate and each affected publicutility, and also is made available to the general public on the <strong>Commission</strong>’s website. 9The information contained in this report includes highlights of the past year, EDCs' projections ofenergy demand and peak load, and a discussion of historical trends in electric utility forecasting.Since the eight largest EDCs operating in <strong>Pennsylvania</strong> represent 99.8 percent of jurisdictionalelectricity sales, information regarding the three smaller EDCs has been limited in this report. Thereport also provides a regional perspective with statistical information on the projected resourcesand aggregate peak loads for the region, which impacts <strong>Pennsylvania</strong>.Under section 2809(e) of the <strong>Public</strong> <strong>Utility</strong> Code, the <strong>Commission</strong> has the authority to forbearfrom applying any requirements of the Code, including section 524 and existing regulationspromulgated thereto, which it found no longer to be necessary due to competition among electricgeneration suppliers. Thus, the <strong>Commission</strong> adopted revised regulations reflecting a reduction inreporting requirements and a reduction in the reporting horizon for energy demand, connected peakload and number of customers from 20 to 5 years. Information regarding capital investments,energy costs, new generating facilities and expansions of existing facilities are no longer required.With the divestiture of generating facilities by the EDCs, the <strong>Commission</strong> relies on reports andanalyses of regional entities, including the ReliabilityFirst Corporation and the PJMInterconnection, to obtain a more complete assessment of the current and future status of theelectric power supply within the region.Informational sources include data submitted by EDCs, which is filed annually pursuant to the<strong>Commission</strong>'s regulations. 10 Sources also include data submitted by regional reliability councilsto the North American Electric Reliability Corporation, which is subsequently forwarded to thefederal Energy Information Administration.Any comments or conclusions contained in this report do not necessarily reflect the views oropinions of the <strong>Commission</strong> or individual <strong>Commission</strong>ers. Although this report has been issued bythe <strong>Commission</strong>, it is not to be considered or construed as approval or acceptance by the<strong>Commission</strong> of any of the plans, assumptions or calculations made by the EDCs or regionalreliability entities and reflected in the information submitted.9 See http://www.puc.state.pa.us/general/publications_reports/pdf/EPO_<strong>2010</strong>.pdf.10 52 Pa. Code §§ 57.141—57.154.Electric Power Outlook for <strong>Pennsylvania</strong> 2009-2014 1
Regional Reliability OrganizationsIn <strong>Pennsylvania</strong>, all major electric distribution companies are interconnected with neighboringsystems extending beyond state boundaries. These systems are organized into regional entities –regional reliability councils – which are responsible for ensuring the reliability of the bulk electricsystem.North American Electric Reliability CorporationIn 1968, electric utilities formed the North American Electric Reliability Council (NERC) topromote the reliability of the electricity supply for North America. Since its formation, NERC hadoperated as a voluntary organization, dependent on reciprocity and mutual self-interest. Due to therestructuring of the electric utility industry, NERC was subsequently transformed from a voluntarysystem of reliability management to one that is mandatory, with the backing of U.S. and Canadiangovernments. The mission of the new organization is to develop, promote and enforce reliabilitystandards for the bulk electric system.On July 20, 2006, NERC was certified as the Electric Reliability Organization (ERO) in the UnitedStates, pursuant to Section 215 of the Federal Power Act of 2005. Included in this certificationwas a provision for the ERO to delegate authority for the purpose of proposing and enforcingreliability standards by entering into delegation agreements with regional entities.Effective Jan. 1, 2007, NERC and the North American Electric Reliability Corporation merged,with the latter being the surviving entity (also referred to as NERC). As of June 18, 2007, theFederal Energy Regulatory <strong>Commission</strong> (FERC) granted NERC the legal authority to enforcereliability standards, and made compliance with those standards mandatory.NERC oversees the reliability of a bulk power system that provides electricity to 350 millionpeople, has a total demand of 830,000 megawatts (MW), has 211,000 miles of high-voltagetransmission lines (230,000 volts and greater), and represents more than $1 trillion worth of assets.NERC’s members currently include eight regional reliability councils. Members of these regionalcouncils include investor-owned utilities, federal and provincial entities, rural electric cooperatives,state/municipal and provincial utilities, independent power producers, independent systemoperators, merchant electricity generators, power marketers, and end-use electricity customers, andaccount for virtually all the electricity supplied in the United States, Canada, and a portion of BajaCalifornia Norte, Mexico. The regional council operating in <strong>Pennsylvania</strong> is ReliabilityFirstCorporation, which is the successor organization to three former NERC Regional ReliabilityCouncils: MAAC, ECAR and MAIN.NERC’s North American Transmission Forum, formed in 2007 to improve the operations andreliability of the electric power systems in North America, has recently organized as anindependent non-profit corporation. The Forum’s membership has grown to 54 transmissionowning utilities in the United States and Canada, representing 70 percent of the countries’ totalelectricity demand. Members include Allegheny Power, Duquesne Light, Exelon, FirstEnergy,PJM Interconnection and PPL.2<strong>Pennsylvania</strong> <strong>Public</strong> <strong>Utility</strong> <strong>Commission</strong>
NERC establishes criteria, standards and requirements for its members and all control areas. Allcontrol areas must operate in a manner such that system instability, uncontrolled system separationand cascading outages will not occur as a result of the most severe single contingency.As of Dec. 31, 2009, NERC had 1,950 active violations, the majority of which were being assessedand validated; others were in settlement negotiations, or were being addressed in a Notice ofPenalty filing with FERC. During 2009, NERC filed 221 enforcement actions with FERC.Enforcement actions are designed to ensure and improve bulk power system reliability bymitigating risk; ensuring transparent, efficient and fair processing; and communicating lessonslearned to the industry. 11NERC defines the bulk electric system as follows:As defined by the Regional Reliability Organization, the electrical generationresources, transmission lines, interconnections with neighboring systems, andassociated equipment, generally operated at voltages of 100 kV or higher. Radialtransmission facilities serving only load with one transmission source are generallynot included in this definition. 12On March 18, <strong>2010</strong>, FERC issued a Notice of Proposed Rulemaking 13 directing NERC to includeall electric transmission facilities of 100,000 volts (100 kV) or more in its definition of whatconstitutes the “bulk electric system” subject to mandatory reliability standards under the EnergyPolicy Act of 2005. The proposal is intended to eliminate the discretion that regional entities haveto define the transmission facilities that comprise their “bulk electric systems,” but allow regionalcouncils to seek NERC and FERC approval if they wish to make variations from the 100 kVstandard. FERC notes that there is a strong technical justification for a standard 100 kV threshold,pointing out that facilities rated at 115 kV and 138 kV have either caused or contributed tosignificant bulk electric system disturbances and cascading outages. FERC has determined that thedefinition needs to be modified in order to protect the reliability of the Nation’s Bulk-PowerSystem.Figure 1 provides a map of the eight NERC Regions.11 NERC, Annual <strong>Report</strong> 2009, May <strong>2010</strong>.12 “Glossary of Terms Used in Reliability Standards,” adopted by NERC Board of Trustees: Feb. 12, 2008.13 Docket No. RM09-18-000.Electric Power Outlook for <strong>Pennsylvania</strong> 2009-2014 3
Figure 1 NERC regionsNote: The highlighted area between SPP and SERC denotes overlapping Regional area boundaries. For example,some load serving entities participate in one Region and their associated transmission owner/operators in another.ERCOTElectric Reliability Council of TexasFRCCFlorida Reliability Coordinating CouncilMROMidwest Reliability OrganizationNPCCNortheast Power Coordinating CouncilRFCReliabilityFirst CorporationSERCSoutheastern Electric Reliability CouncilSPPSouthwest Power PoolWECCWestern Electricity Coordinating CouncilReliabilityFirst CorporationThe regional reliability council covering <strong>Pennsylvania</strong> is the ReliabilityFirst Corporation (RFC),based in Akron, Ohio. RFC was formed by the merger of the Mid-Atlantic Area Council(MAAC), the East Central Area Reliability Coordination Agreement (ECAR) and the Mid-America Interconnected Network Inc. (MAIN). RFC is one of eight regional councils of NERCand serves the electrical requirements of more than 72 million people in a 238,000 square-mile areacovering all of the states of Delaware, Indiana, Maryland, Ohio, <strong>Pennsylvania</strong>, New Jersey andWest Virginia, plus the District of Columbia, and portions of Illinois, Kentucky, Michigan,4<strong>Pennsylvania</strong> <strong>Public</strong> <strong>Utility</strong> <strong>Commission</strong>
Tennessee, Virginia and Wisconsin. RFC became operational on Jan. 1, 2006. Its membershipincludes load serving entities, regional transmission organizations (RTOs), suppliers andtransmission companies. See Figure 2.Figure 2 RFC footprintRFC sets forth the criteria which individualutilities and systems must follow in planningadequate levels of generating capability.Among the factors which are considered inestablishing these levels are load characteristics,load forecast error, scheduled maintenancerequirements and the forced outage rates ofgenerating units. The RFC reliability standardsrequire that sufficient generating capacity beinstalled to ensure that the probability of systemload exceeding available capacity is no greaterthan one day in 10 years. Load serving entitiesthat are members of RFC have a capacityobligation determined by evaluating individualsystem load characteristics, unit size and operating characteristics.In addition to all NERC Standards, all heritage ECAR, MAAC, and MAIN standards that havenot yet been replaced by vote of the RFC Board remain in effect.There have been no enforcement actions against any <strong>Pennsylvania</strong> RFC members since theexpansion of NERC’s new authority. 14Regional Transmission OrganizationsThe two main control areas within the RFC footprint are the PJM Regional TransmissionOrganization (PJM RTO) and the Midwest Independent System Operator (MISO). Two-thirds ofthe RFC load is in the PJM RTO.PJM InterconnectionThe PJM Interconnection LLC (PJM) is a regional transmission organization that ensures thereliability of the largest centrally dispatched control area in North America. PJM coordinates theoperation of 163,500 MW of generating capacity and 56,350 miles of transmission lines. The PJMRTO coordinates the movement of electricity through all or parts of Delaware, Illinois, Indiana,Kentucky, Maryland, Michigan, New Jersey, North Carolina, Ohio, <strong>Pennsylvania</strong>, Tennessee,Virginia, West Virginia and the District of Columbia. See Figure 3.14 See http://www.nerc.com/filez/enforcement/index.html.Electric Power Outlook for <strong>Pennsylvania</strong> 2009-2014 5
Figure 3 PJM RTO service territoryOn April 1, 2002, PJM West becameoperational, broadening the regional scope ofthe electric grid operator for the Mid-AtlanticRegion, to include Allegheny Power andmarking the first time, nationally, that twoseparate control areas were operated under asingle energy market and a single governancestructure.On May 1, 2004, PJM began managing the flowof wholesale electricity over CommonwealthEdison’s 5,000 miles of transmission lines inIllinois, making PJM the world’s largest gridoperator, meeting a peak demand of 87,000 MW. On Oct. 1, 2004, PJM began managingAmerican Electric Power’s (AEP’s) eastern control area, including 22,300 miles of high-voltagetransmission lines within a seven-state area and 23,800 MW of generating capacity. At the sametime, Dayton Power and Light integrated into the PJM RTO with 1,000 miles of transmission linesand 4,450 MW of generation. Also, 20 municipal electric companies, cooperatives and generatorsin the AEP area joined PJM. On Jan. 1, 2005, PJM began managing the wholesale flow ofelectricity for Duquesne Light Company, with 3,400 MW of capacity and 620 miles oftransmission lines. These entities, including Allegheny, comprise PJM West.Virginia Electric and Power (Dominion) was integrated into the PJM RTO on May 1, 2005.Dominion’s control area, covering parts of Virginia and North Carolina, operates separately underthe single PJM energy market as PJM South, including an additional 6,100 miles of transmissionlines and 26,500 MW of generating capacity.On Aug. 17, 2009, FirstEnergy Service Company filed a request with FERC to consolidate all ofits ATSI 15 transmission assets, currently operated by MISO, into the PJM RTO. ATSI has 32interconnections with PJM, but only three with MISO. Moving ATSI into the PJM RTO isexpected to reduce congestion and increase efficiency across both RTOs. The integration, whichwas approved by FERC on Dec. 17, 2009, will become effective June 1, 2011.On May 20, <strong>2010</strong>, Duke Energy Corporation announced its desire to move its Ohio and Kentuckyutilities from MISO to the PJM RTO by Jan. 1, 2012, which would increase PJM’s generatingcapacity by 2,379 MW. The subsidiaries would also add 5,800 MW to PJM’s system peak load.PJM manages a sophisticated regional planning process for generation and transmission expansionto ensure the continued reliability of the electric system. PJM is responsible for maintaining theintegrity of the regional power grid and for managing changes and additions to the grid toaccommodate new generating plants, substations and transmission lines. In addition, PJManalyzes and forecasts the future electricity needs of the region. Its planning process ensures thatthe growth of the electric system takes place efficiently, in an orderly fashion, and that reliability15 American Transmission Systems Inc., a subsidiary of FirstEnergy Corporation, has assets located within the footprintof FirstEnergy’s Ohio and <strong>Pennsylvania</strong> (Penn Power) utilities, including 7,100 circuit miles of transmission lines withnominal voltages of 345 kV, 138 kV and 69 kV.6<strong>Pennsylvania</strong> <strong>Public</strong> <strong>Utility</strong> <strong>Commission</strong>
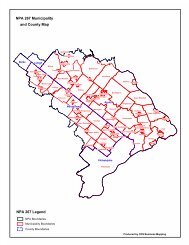
is maintained. PJM also develops innovative programs, such as demand response initiatives andefforts to support renewable energy, to help expand supply options and keep prices competitive.PJM coordinates the continuous buying, selling and delivery of wholesale electricity throughrobust, open and competitive spot markets. In operating the markets, PJM balances the needs ofsuppliers, wholesale customers and other market participants, and continuously monitors marketbehavior. PJM has administered more than $103 billion in energy and energy-service trades sincethe regional markets opened in 1997.PJM exercises a broader reliability role than that of a local electric utility. PJM system operatorsconduct dispatch operations and monitor the status of the grid over a wide area, using telemetereddata from 74,000 points on the grid. This gives PJM a big-picture view of regional conditions andreliability issues, including those in neighboring systems.Midwest Independent System OperatorThe Midwest Independent System Operator (MISO) is the nation’s first RTO approved by FERC.MISO, with control centers in Carmel, Indiana, and St. Paul, Minnesota, is responsible formonitoring the electric transmission system, ensuring equal access to the transmission system andmaintaining and improving electric system reliability in 13 Midwest states and the Canadianprovince of Manitoba. See Figure 4.Figure 4 MISO footprintUtilities with 93,600 miles of transmission linescovering 750,000 square miles from Manitoba,Canada, to Kentucky have committed toparticipate in MISO. <strong>Pennsylvania</strong> PowerCompany is currently the only <strong>Pennsylvania</strong> utilityin MISO; however, as previously indicated, allFirstEnergy companies will be integrated into thePJM RTO by June 2011.On Dec. 10, 2008, Duquesne Light Companyannounced that it will not transition to MISO, asindicated earlier. Duquesne has decided to remainwith PJM, a decision which was approved by FERC on Jan. 29, 2009.Transmission Line ExpansionEffective Oct. 5, 2007, the U.S. Department of Energy (DOE) designated all or major portions ofWest Virginia, <strong>Pennsylvania</strong>, Maryland, Delaware, the District of Columbia, New Jersey, NewYork and Virginia, as well as minor portions of Ohio, as the Mid-Atlantic Area National InterestElectric Transmission Corridor under Section 1221 of the Energy Policy Act of 2005. Thedesignation will remain in effect until Oct. 7, 2019. The corridor includes 52 out of <strong>Pennsylvania</strong>’s67 counties. Section 1221 gives FERC authority to approve the construction or modification ofelectric transmission facilities within a designated corridor if the state does not approve anapplication within one year. 16 See Figure 5.16 On Feb. 18, 2009, the U.S. Court of Appeals for the Fourth Circuit issued a decision reversing, vacating andremanding key elements of FERC’s final rule implementing its backstop siting authority under Section 216 of theElectric Power Outlook for <strong>Pennsylvania</strong> 2009-2014 7
Figure 5 Mid-Atlantic Area National Corridor and Critical Congestion AreaOn April 27, <strong>2010</strong>, DOE released its 2009 National Electric Transmission Congestion Study. 17Congestion occurs on electric transmission facilities when actual or scheduled flows of electricityacross a line or piece of equipment are restricted below desired levels. These restrictions may beimposed either by the physical or electrical capacity of the line, or by operational restrictionscreated and enforced to protect the security and reliability of the grid. The study concludes that theMid-Atlantic Critical Congestion Area is the only nationally significant congestion area in theEastern Interconnection, which continues to experience high and costly levels of congestion thataffect a significant portion of the nation’s population, and should be continue to be identified as aCritical Congestion Area. DOE made this identification because of the area’s importance as apopulation and economic center and because of the many known transmission constraints andchallenges to building new transmission and managing load growth. The study also points out thatslow development of new generation and new backbone transmission facilities could compromisecontinued reliability in the Washington, Baltimore, New Jersey and New York City areas.Federal Power Act. In essence, the Court rejected FERC’s interpretation that it may exercise its backstop authoritywhen a state commission has affirmatively denied a permit application within one year. Piedmont EnvironmentalCouncil v. FERC, No. 07-1651 (4 th Cir. Feb. 18, 2009).17 U.S. DOE, 2009 National Electric Transmission Congestion Study, December 2009.8<strong>Pennsylvania</strong> <strong>Public</strong> <strong>Utility</strong> <strong>Commission</strong>
According to a report issued by the National Council on Electricity Policy, <strong>Pennsylvania</strong> is one of11 states whose statutes do not address the topic of interstate transmission siting and interstatecoordination. 18 Participation in a regional organization, such as the PJM RTO, is one vehicle foraddressing interstate coordination on transmission development, including siting. The reportrecommends that states determine whether language in their statutes creates opportunities for orimpedes regional coordination, and consider reform, if necessary. States may also consider theenvironmental, economic, and health and safety benefits, in addition to the costs, that may resultfrom interstate transmission siting for consumers in their state and more broadly in theirrespective region. Having a vehicle such as an RTO may provide the basis for a long-termstrategy of equity in future decisions that share regional costs and benefits.On Jan. 28, <strong>2010</strong>, the <strong>Commission</strong> issued a Tentative Order 19 which sets forth specific InterimGuidelines to supplement the existing filing requirements, pending the conclusion of therulemaking process. The additional information to be included in the initial filing is intended tostreamline the application process by reducing the need for subsequent data requests, on a case-bycasebasis, to more completely develop the record necessary to process the application. Commentsto the Tentative Order were due March 30, <strong>2010</strong>.In recent transmission line siting proceedings, the <strong>Commission</strong> has given substantial weight toregional transmission studies conducted by PJM.The PJM Regional Transmission Expansion Plan (RTEP) identifies transmission system upgradesand enhancements to preserve grid reliability within the region, the foundation of competitivewholesale power markets. The RTEP five-year planning process enables PJM to assess andrecommend transmission upgrades to meet forecasted near-term load growth and to ensure the safeand reliable interconnection of new generation and merchant transmission projects seekinginterconnection within PJM. The 15-year planning horizon permits consideration of manytransmission options with longer lead times.PJM has addressed a number of critical issues in <strong>Pennsylvania</strong> having a bearing on reliabilitycriteria violations, which drive the need for regional transmission expansion plans. The RTEP hasidentified two major transmission line projects, approved by the PJM Board, which have an impacton <strong>Pennsylvania</strong>.18 The National Council on Electricity Policy, Coordinating Interstate Electric Transmission Siting: An Introduction tothe Debate, July 2008.19 Docket No. M-2009-2141293; 40 Pa.B. 953.Electric Power Outlook for <strong>Pennsylvania</strong> 2009-2014 9
Trans-Allegheny Interstate LineThe RTEP recommended that Allegheny Power build facilities constituting the Trans-AlleghenyInterstate Line (TrAIL). TrAIL was to extend from Southwestern <strong>Pennsylvania</strong> (37 miles) to WestVirginia (114 miles) to Northern Virginia (28 miles). In-service dates ranged from 2009 to mid-<strong>2010</strong>. The 2008 RTEP retool analysis of 2011 system conditions confirmed the need for this lineby June 1, 2011, to address reliability criteria violations on the Mt. Storm-Doubs 500 kV line.In support of the TrAIL project, Trans-Allegheny Interstate Line Company (TrAILCo), anAllegheny Energy subsidiary, filed an application 20 with the <strong>Commission</strong> on April 13, 2007,proposing the construction of one 500 kV and three 138 kV transmission lines in Washington andGreene counties. The project included a substation in Washington County (Prexy Substation), asubstation in Greene County (502 Junction Substation), three 138 kV transmission lines and a 36-mile 500 kV transmission line.Evidentiary hearings in all three states were concluded by April 2008. In a RecommendedDecision issued Aug. 21, 2008, the <strong>Commission</strong>’s ALJs recommended that the application bedenied because TrAILCo had failed to prove a need for the facilities. A Partial SettlementAgreement was reached for the <strong>Pennsylvania</strong> portion of the TrAIL Project, involving approval of a1.2-mile segment of the 500 kV line extending from a new substation in Greene County,<strong>Pennsylvania</strong> (the 502 Junction), to the West Virginia border. On Nov. 13, 2008, the <strong>Commission</strong>approved the Partial Settlement Agreement and stayed the application with regard to the Prexyfacilities pending the outcome of a collaborative set forth in the Partial Settlement Agreement andthe filing of a new or amended application. On July 13, 2009, a Joint Petition for Settlement wasfiled with the <strong>Commission</strong>, agreeing to an alternative, more cost-effective solution to NERCReliability Standard violations, including a set of local 138 kV transmission upgrades. By Order ofAug. 25, 2009, the record was reopened for the purpose of amending the application and approvingthe Settlement. An Amendment to Application was filed on Oct. 13, 2009.The 2009 RTEP stated that the alternative solution did not resolve several violations outside thecontested area of the settlement, requiring additional upgrades that the Prexy-502 Junction wouldhave otherwise resolved. The upgrades, including the construction of a new Osage-Whiteley 138kV line and a new 138 kV Braddock substation, are shown in Figure 6.20 Docket No. A-110172, et al.10<strong>Pennsylvania</strong> <strong>Public</strong> <strong>Utility</strong> <strong>Commission</strong>
Figure 6 Prexy replacement upgrades (in yellow)Susquehanna-Roseland 500 kV LineThe second major transmission project identified by the RTEP describes a new 500 kV circuitwhich is proposed to run 120 miles from the Susquehanna 500 kV substation in Salem Township,Luzerne County, near Berwick, through portions of Luzerne, Lackawanna, Wayne, Pike andMonroe counties to the Delaware River and then eastward to Roseland, New Jersey in the <strong>Public</strong>Service Electric & Gas Co. system.According to the 2008 RTEP, the Susquehanna-Roseland 500 kV project would resolve 21 of 23identified reliability criteria violations in Eastern <strong>Pennsylvania</strong> and New Jersey beginning in 2012.A March 2009 RTEP retool analysis included 13 potential overloads due to single contingencies,and 10 potential violations due to multiple contingencies. The 2009 RTEP, issued Feb. 26, <strong>2010</strong>,re-validated the required June 1, 2012, in-service date for the line. The estimated cost to designand construct the <strong>Pennsylvania</strong> portion of the line (101 miles) is $510 million.PPL conducted a multi-faceted analysis to determine the preferred route. Three alternative routeswere selected for detailed examination. Following an analysis of comments from the public,societal concerns, environmental impacts, engineering considerations and cost, PPL selected RouteB as the preferred route. See Figure 7.On Jan. 6, 2009, PPL filed its Application for authorization to construct the line and a newsubstation in Blakely Borough, Lackawanna County. 21 Evidentiary hearings were held in21 Docket No. A-2009-2082652.Electric Power Outlook for <strong>Pennsylvania</strong> 2009-2014 11
September 2009. A Recommended Decision, conditionally approving the application, was issuedon Nov. 12, 2009, and adopted on Jan. 14, <strong>2010</strong>. The New Jersey Board of <strong>Public</strong> Utilitiesapproved the New Jersey portion of the line (45 miles) on Feb. 11, <strong>2010</strong>.The National Park Service (NPS) is preparing an Environmental Impact Statement (EIS) to analyzethe potential impacts of the project on the Delaware Water Gap National Recreation Area, theMiddle Delaware Scenic and Recreational River and the Appalachian National Scenic Trail. TheEIS will compare the three alternative routes that had been originally considered to determine thealternative that would minimize impacts to the natural and human resources within the parks andsurrounding areas. NPS is also developing other alternatives which may include relocation of theproject partially outside of park boundaries, installation of portions of the entire upgraded lineunderground, installation of the line on the bottom of the Delaware River, an alternative that usesdirect current, or a denial of the request for permits.The <strong>Commission</strong>’s approval of construction of a portion of the line is contingent upon the receiptof the necessary NPS permit. On March 1, <strong>2010</strong>, the Office of Consumer Advocate (OCA) filed aPetition for Reconsideration or Clarification, which was granted on March 11, <strong>2010</strong>, pendingfurther review and consideration on the merits. On April 22, <strong>2010</strong>, the <strong>Commission</strong> denied OCA’spetition, thus reaffirming its previous approval of the application.Figure 7 Susquehanna-Roseland 500 kV line alternatives12<strong>Pennsylvania</strong> <strong>Public</strong> <strong>Utility</strong> <strong>Commission</strong>
Electric Distribution CompaniesEleven electric distribution companies (EDCs) currently serve the electrical energy needs of themajority of <strong>Pennsylvania</strong>'s homes, businesses and industries. Cooperatives and municipal systemsprovide service to several rural and urban areas. The 11 jurisdictional EDCs (nine systems) 22 are:1. Citizens' Electric Company2. Duquesne Light Company3. Metropolitan Edison Company (FirstEnergy)4. <strong>Pennsylvania</strong> Electric Company (FirstEnergy)5. <strong>Pennsylvania</strong> Power Company (FirstEnergy)6. PPL Electric Utilities Corporation7. PECO Energy Company (Exelon)8. Pike County Light & Power Company (Orange & Rockland Utilities Inc.)9. UGI Utilities Inc. – Electric Division10. Wellsboro Electric Company11. West Penn Power Company (Allegheny Energy Inc.)Figure 8 Map of EDC service territoriesDue to the deregulation of electric generation, local generating resources are now available to thecompetitive wholesale market. During their rate-cap or transition periods, the EDCs either enteredinto long-term contracts for power from traditional resources with affiliates or other generation22 On Feb. 11, <strong>2010</strong>, FirstEnergy and Allegheny Energy Inc. announced a merger of the two companies, which isconditioned on, among other things, approvals by federal and state authorities. The combined company will retain theFirstEnergy name and be headquartered in Akron, Ohio.Electric Power Outlook for <strong>Pennsylvania</strong> 2009-2014 13
suppliers or purchased power from the wholesale market to fulfill their provider of last resort(POLR) obligations. 23It is the responsibility of each load serving entity to make provisions for adequate generatingresources to serve its customers. Furthermore, Section 2807(e)(3) of the <strong>Public</strong> <strong>Utility</strong> Coderequires that, at the end of the transition period (the period in which the EDC recovers its strandedcosts), the local EDC or <strong>Commission</strong>-approved alternate supplier must acquire electric energy,pursuant to a <strong>Commission</strong>-approved competitive procurement process, for customers who contractfor power which is not delivered, or for customers who do not choose an alternate supplier. Theacquired electric power must include a prudent mix of spot market purchases, short-term contractsand long-term purchase contracts, designed to ensure adequate and reliable service at the least costto customers over time. EDCs must also assume the role of provider of last resort for customerschoosing to return to the EDC. 24On May 10, 2007, the <strong>Commission</strong> finalized the statewide default service rulemaking and policystatement which provides guidelines to default service providers regarding the acquisition ofelectric generation supply, the recovery of associated costs and the integration of default servicewith competitive retail electric markets. The regulations establish the criteria on how electricgeneration service is provided to customers who choose to obtain generation service from analternate supplier. In reviewing the comments and considering revisions to the proposed defaultservice rules, the <strong>Commission</strong> recognized that some elements of the default service rules should beaddressed in a policy statement that provides guidance to the industry rather than strict rules. 25The transition periods have expired for seven of the 11 EDCs, PPL being the latest EDC to end itsrecovery of stranded costs on Dec. 31, 2009.The electric generation supplier (EGS) market share for the fourth quarter of 2009 may beconsidered indicative of the overall current status of customer choice in <strong>Pennsylvania</strong>. In theaggregate, the EGS share of total megawatthour (MWh) sales was 11.7 percent, varying greatlyamong the individual EDC service territories. EGSs supplied 3.3 percent of residential sales; EGScommercial and industrial sales were substantially higher at 16.1 percent of total sales. As of April8, <strong>2010</strong>, there were 99 licensed EGS offering generation services to retail customers in<strong>Pennsylvania</strong>.Alternative Energy Portfolio StandardsAct 213 26 requires that EDCs and EGS acquire alternative energy credits (AECs) in quantitiesequal to an increasing percentage of electricity sold to retail customers. AECs are separate fromthe electricity that is sold to customers. An AEC represents one MWh of qualified alternativeelectric generation or conservation, whether self-generated, purchased along with the electriccommodity or separately through a tradable instrument. 2723 Also referred to as “obligation to serve” and “default service.”24 66 Pa.C.S. § 2807(e)(3).25 Docket Nos. L-00040169 and M-00072009; 52 Pa. Code §§ 54.4-54.6, 54.31-54.41, 54.123, 54.181-54.189, 57.178and 69.1801-69.1817.26 Alternative Energy Portfolio Standards Act, effective Feb. 28, 2005; 73 P.S. §§ 1648.1–1648.8.27 See 52 Pa. Code §§ 75.61—75.70.14<strong>Pennsylvania</strong> <strong>Public</strong> <strong>Utility</strong> <strong>Commission</strong>
Alternative energy resources are categorized as Tier I and Tier II resources. Tier I resourcesinclude solar, wind, low-impact hydropower, geothermal, biologically derived methane gas, fuelcells, biomass and coal mine methane. Tier II resources include waste coal, demand sidemanagement, distributed generation, large-scale hydropower, by-products of wood pulping andwood manufacturing, municipal solid waste, and integrated combined coal gasification technology.Act 213 requires that, within two years of the effective date, the Tier I requirement is 1.5 percent ofall retail sales. The percentage of electric energy derived from Tier 1 resources (including solar) isto increase by at least 0.5 percent each year so that, by the 15 th year, at least 8 percent of theelectric energy in each service territory will come from these resources. Energy derived from TierII resources is to increase to 10 percent (a total of 18 percent from both Tier I and Tier II). Act 213sets forth a 15-year schedule for complying with its mandates, as shown in Table 1.Table 1 Alternative Energy Portfolio StandardsTier I Tier II SolarYear Period (incl. Solar) PV1 June 1, 2006 through May 31, 2007 1.50% 4.20% 0.0013%2 June 1, 2007 through May 31, 2008 1.50% 4.20% 0.0030%3 June 1, 2008 through May 31, 2009 2.00% 4.20% 0.0063%4 June 1, 2009 through May 31, <strong>2010</strong> 2.50% 4.20% 0.0120%5 June 1, <strong>2010</strong> through May 31, 2011 3.00% 6.20% 0.0203%6 June 1, 2011 through May 31, 2012 3.50% 6.20% 0.0325%7 June 1, 2012 through May 31, 2013 4.00% 6.20% 0.0510%8 June 1, 2013 through May 31, 2014 4.50% 6.20% 0.0840%9 June 1, 2014 through May 31, 2015 5.00% 6.20% 0.1440%10 June 1, 2015 through May 31, 2016 5.50% 8.20% 0.2500%11 June 1, 2016 through May 31, 2017 6.00% 8.20% 0.2933%12 June 1, 2017 through May 31, 2018 6.50% 8.20% 0.3400%13 June 1, 2018 through May 31, 2019 7.00% 8.20% 0.3900%14 June 1, 2019 through May 31, 2020 7.50% 8.20% 0.4433%15 June 1, 2020 through May 31, 2021 8.00% 10.00% 0.5000%Companies are exempt from these requirements for the duration of their cost recovery periods.The current expiration dates for the cost recovery period in each EDC’s service territory and thecorresponding start dates for compliance are shown in Table 2.Table 2 AEPS compliance scheduleCompany Exemption Expires Compliance Begins<strong>Pennsylvania</strong> Power Company December 31, 2006 February 28, 2007UGI Utilities Inc. December 31, 2006 February 28, 2007Citizens' Electric Company December 31, 2007 January 1, 2008Duquesne Light Company December 31, 2007 January 1, 2008Pike County Power and Light December 31, 2007 January 1, 2008Wellsboro Electric Company December 31, 2007 January 1, 2008PPL Electric Utilities Corporation December 31, 2009 January 1, <strong>2010</strong>PECO Energy Company December 31, <strong>2010</strong> January 1, 2011<strong>Pennsylvania</strong> Electric Company December 31, <strong>2010</strong> January 1, 2011Metropolitan Edison Company December 31, <strong>2010</strong> January 1, 2011West Penn Power Company December 31, <strong>2010</strong> January 1, 2011Electric Power Outlook for <strong>Pennsylvania</strong> 2009-2014 15
AECs are earned when a qualified facility generates 1,000 kilowatthours (kWh) of electricitythrough either estimated or actual metered production. An AEC is a tradable certificate thatrepresents all the clean energy benefits of electricity generated from a facility. An AEC can besold or traded separately from the power. AECs are generally purchased by EDCs and EGSs inorder to meet the percentages required under AEPS for any given energy year. The AECs can betraded multiple times until they are retired for compliance purposes.On June 3, <strong>2010</strong>, the <strong>Commission</strong> approved Clean Power Markets (CPM) to be the AlternativeEnergy Credit Program Administrator through 2013. CPM, which had been the administratorsince 2007, verifies that EGSs and EDCs are complying with the minimum requirements of Act213. The <strong>Commission</strong> also has chosen PJM’s Generation Attribute Tracking System (GATS) toassist EDCs in their compliance with the requirements of Act 213, including registration ofprojects.On June 22, 2006, the <strong>Commission</strong> approved Final Regulations promoting onsite generation bycustomer-generators using renewable resources and eliminating barriers which may havepreviously existed regarding net metering. The regulations also provide for metering capabilitiesthat will be required and a compensation mechanism which reimburses customer-generators forsurplus energy supplied to the electric grid. 28The <strong>Commission</strong> also approved Final Regulations, on Aug. 17, 2006, which governinterconnection for customer-generators. The regulations promote onsite generation by customergeneratorsusing renewable resources, consistent with the goal of Act 213. The regulations striveto eliminate barriers which may have previously existed with regard to interconnection, whileensuring that interconnection by customer-generators will not pose unnecessary risks to the electricdistribution systems in the Commonwealth. 29On Sept. 25, 2008, the <strong>Commission</strong> adopted a Final Rulemaking Order pertaining to the AEPSobligations of the EDCs and EGSs. 30Act 35 became effective on July 17, 2007, and amends provisions of Act 213, including definitionsof customer-generators, the reconciliation mechanism for surplus energy supplied through netmetering and the price to be paid for such surplus energy. Pursuant to Act 35, on Feb. 26, 2009,the <strong>Commission</strong> approved standard Interconnection Application Forms and a Policy Statementaddressing Interconnection Application Fees. Act 35 also expanded the definition of Tier Ialternative energy sources to include solar thermal energy.As of May 18, <strong>2010</strong>, <strong>Pennsylvania</strong> had certified 1,458 alternate energy facilities, many of whichare located within the state. For additional information, visit the <strong>Commission</strong>’s AEPS website athttp://paaeps.com/credit/.28 Docket No. L-00050174; 52 Pa. Code §§ 75.11-75.15.29 Docket No. L-00050175; 52 Pa. Code §§ 75.21-75.40.30 Docket No. L-00060180; 52 Pa. Code §§ 75.61-75.70.16<strong>Pennsylvania</strong> <strong>Public</strong> <strong>Utility</strong> <strong>Commission</strong>
Energy Efficiency and ConservationAct 129Act 129 of 2008 31 added Section 2806.1 to the <strong>Public</strong> <strong>Utility</strong> Code requiring that the <strong>Commission</strong>adopt an energy efficiency and conservation program for the reduction of energy consumption andpeak demand within the service territory of each EDC with at least 100,000 customers. 32 Sales areto be reduced 1 percent by May 31, 2011, and 3 percent by May 31, 2013. Peak demand is to bereduced 4.5 percent by May 31, 2013.Based on forecast growth data, consumption reduction goals total 1.5 million MWh in 2011 and4.4 million MWh in 2013. Peak demand reduction goals total 1,193 MW for 2013. These goalswere adopted by the <strong>Commission</strong> on March 26, 2009. Total program costs are estimated at $1billion. 33 See Table 3.Table 3 Consumption and peak demand reduction goals and costCompany 1% (MWh) 3% (MWh) 4.5% (MW) Total Plan CostDuquesne 140,855 422,565 113 $78,183,806Met-Ed 148,650 445,951 119 $99,467,568Penelec 143,993 431,979 108 $91,898,976Penn Power 47,729 143,188 44 $26,639,136PPL 382,144 1,146,431 297 $246,005,504PECO 393,860 1,181,580 355 $341,580,634West Penn 209,387 628,160 157 $94,249,872Total 1,466,618 4,399,854 1,193 $978,025,496On Jan. 15, 2009, the <strong>Commission</strong> adopted an Implementation Order to establish the standardseach program must meet and provide guidance on the procedures to be followed for submittal,review and approval of all aspects of EDC plans. Programs are to be evaluated using a totalresource cost test, based on the California Manual, as modified by the <strong>Commission</strong>. 34 Each planmust include a proposed cost recovery tariff mechanism. Plans were filed on July 1, 2009. 35 The<strong>Commission</strong> approved the plans, with modifications, in late October 2009, requiring the filing ofrevised plans within 60 days, which were subsequently approved. 36Act 129 also requires an increase in the percentage share of Tier I alternative energy resources tobe sold under the provisions of Act 213. The types of alternative energy resources that qualify asTier I resources were expanded to include specific categories of low impact hydropower andbiomass energy. 37 A Final Order was adopted on May 28, 2009. 3831 Energy Efficiency and Conservation Program, signed by Gov. Rendell on Oct. 15, 2008.32 66 Pa.C.S. § 2806.1.33 Program costs are from individual plans and generally represent two percent of revenues as of Dec. 2006 multipliedby four to reflect the four-year duration of the plans.34 Docket No. M-2009-2108601.35 Docket No. M-2008-2069887.36 Docket Nos. M-2009-2093215, M-2009-2093216, M-2009-2093217, M-2009-2093218, M-2009-2092222, M-2009-2112952 and M-2009-2112956.37 See Act 129 of 2008, Section 5, codified in the <strong>Pennsylvania</strong> consolidated statutes as 66 Pa. C.S. § 2814.38 Docket No. M-2009-2093383.Electric Power Outlook for <strong>Pennsylvania</strong> 2009-2014 17
Smart Meters and Time-of-Use RatesSection 2807(f) of the <strong>Public</strong> <strong>Utility</strong> Code 39 requires that EDCs, with greater than 100,000customers, file a smart meter technology procurement and installation plan with the <strong>Commission</strong>for approval. Smart meters are to be furnished upon request from a customer that agrees to pay thecost of the meter, in new building construction, and in accordance with a depreciation schedule notto exceed 15 years.A Smart Meter Procurement and Installation Implementation Order was adopted by the<strong>Commission</strong> on June 18, 2009. 40 Each smart meter plan must include a summary of the EDC’scurrent deployment of smart meter technology, if any; a plan for future deployment, complete withdates for key milestones and measurable goals; and other pertinent information. The <strong>Commission</strong>granted a network development and installation grace period of up to 30 months following planapproval. The EDCs filed their Smart Meter Technology Procurement and Installation Plans onAug. 14, 2009. 41 The plans were approved in April/May <strong>2010</strong>.Smart meter technology includes metering technology and network communications technologycapable of bidirectional communication that records electricity usage on at least an hourly basis,including related electric distribution system upgrades to enable the technology. The technologymust provide customers with direct access to and use of price and consumption information.By Jan. 1, <strong>2010</strong>, or at the end of the applicable generation rate cap period, whichever is later,default service providers with more than 100,000 customers 42 must submit at least one proposedtime-of-use (TOU) rate and real-time pricing (RTP) plan. <strong>Commission</strong> approval is due within sixmonths of submittal. These pricing options must be offered to all customers that have beenprovided with smart meter technology.On Jan. 28, <strong>2010</strong>, the <strong>Commission</strong> approved a voluntary program where PPL Electric UtilitiesCorporation would offer a new, optional TOU rate for residential and small commercial andindustrial customers in order to satisfy a portion of the statutory obligation. 43 On June 16, <strong>2010</strong>,the <strong>Commission</strong> approved Duquesne Light Company’s TOU and RTP Plan, to be implemented infour phases over the <strong>2010</strong> to 2013 period. 44PURPASection 210 of the <strong>Public</strong> <strong>Utility</strong> Regulatory Policies Act of 1978 (PURPA) 45 was implementedto encourage the conservation of energy supplied by electric utilities, the optimization of theefficiency of use of facilities and resources by electric utilities, and equitable rates to electricconsumers. One of the ways PURPA set out to accomplish its goals was through theestablishment of a new class of generating facilities which would receive special rate and39 66 Pa. C.S. § 2807(f).40 Docket No. M-2009-209655.41 Docket Nos. M-2009-2123944 (PECO), M-2009-2123945 (PPL), M-2009-2123948 (Duquesne Light), M-2009-2123950 (Met-Ed, Penelec and Penn Power) and M-2009-2123951 (West Penn Power).42 Duquesne, Met-Ed, Penelec, Penn Power, PPL, PECO and West Penn.43 Docket No. R-2009-2122718.44 Docket No. P-2009-2149807.45 Pub. L. 95-617, Title II, § 210, 92 Stat. 3144 (16 U.S.C.A. § 824a-3(a)—(j)).18<strong>Pennsylvania</strong> <strong>Public</strong> <strong>Utility</strong> <strong>Commission</strong>
egulatory treatment. Generating facilities in this group are known as qualifying facilities (QFs),and fall into two categories: qualifying small power production facilities and qualifyingcogeneration facilities.A small power production facility is a generating facility of 80 MW or less whose primaryenergy source is renewable (hydro, wind or solar), biomass, waste, or geothermal resources. Acogeneration facility is a generating facility that sequentially produces electricity and anotherform of useful thermal energy (such as heat or steam) in a way that is more efficient than theseparate production of both forms of energy. With some limited exceptions, these facilities arealso limited in size to 80 MW.Although enacted more than 30 years ago, PURPA continues to have an impact on<strong>Pennsylvania</strong>’s EDCs. The <strong>Commission</strong>’s regulations govern the purchases and sales of energybetween QFs and electric utilities. It also governs the purchases and sales of capacity andassociated energy between suppliers of electric generation and electric utilities. 46Under the provisions of purchase power agreements, utilities are required to purchase any energywhich is made available from a qualifying facility. 47 In 2009, 8,400 GWh were purchased fromindependent power producers (IPPs) and QFs, representing 5.6 percent of net energy for load.See Table 4. Contract capacity refers to the amount of the facilities’ total capacity that the EDCcontracts for; some purchases are for energy only.Table 4 2009 purchases from IPPs and QFs by <strong>Pennsylvania</strong> EDCsPurchased Percent of Contract TotalEnergy Net Energy Capacity CapacityCompany (MWh) for Load (kW) (kW)Citizens' 3,296 1.97% 0 6,000Duquesne 0 0.00% 0 0Met-Ed 2,201,773 15.29% 295,000 354,900Penelec 3,082,343 21.47% 370,350 410,850Penn Power 2 0.00% 0 10,600PPL 1,091,468 2.72% 0 152,517PECO 1,033,939 2.54% 181,000 384,082West Penn 987,023 4.66% 136 151UGI 0 0.00% 0 0Total 8,399,843 5.59% 846,486 1,319,10046 52 Pa. Code §§ 57.31-57.39.47 Under PURPA Section 210(m)(1)(A), enacted in response to § 1253 of the Energy Policy Act of 2005, no electricutility shall be required to enter into a new contract or obligation to purchase electric energy from a QF underSection 210(m) if FERC finds that the QF has nondiscriminatory access to: “(i) independently administered,auction-based day ahead and real time wholesale markets for the sale of electric energy; and (ii) wholesale marketsfor long-term sales of capacity and electric energy.” FERC Docket No. RM06-10-001.Electric Power Outlook for <strong>Pennsylvania</strong> 2009-2014 19
Section 2 – Historic and Forecast Data2009: A Year in Review<strong>Pennsylvania</strong>’s aggregate electricity sales in 2009 totaled 142,161 gigawatthours (GWh), 48 a 4.2percent decrease from that of 2008, while the number of customers increased by 0.35 percent.This decrease was evident in all retail customer groups except “other” and follows a 0.5 percentdecrease in sales from 2007 to 2008. Industrial sales declined 9.2 percent. Residential salesrepresented 35.4 percent of the total sales, followed by commercial (31.7 percent) and industrial(30.3 percent). Aggregate non-coincident peak load 49 decreased to 27,597 MW in 2009, down 8.2percent from 2008. Tables 5 and 6 provide statistics for 2009, and 2008 for comparison.Table 5 PA EDCs' energy demand, peak load and customers served (2009)Total Sales For Total System Company Net Energy PeakCustomers Residential Commercial Industrial Other Resale Consumption Losses Use For Load LoadCompany Served (MWh) (MWh) (MWh) (MWh) (MWh) (MWh) (MWh) (MWh) (MWh) (MW)Duquesne 586,616 3,945,655 6,537,414 2,616,153 64,351 21,849 13,185,422 662,150 30,441 13,878,013 2,732Met-Ed 551,283 5,448,240 4,568,227 3,438,601 34,487 0 13,489,555 895,908 13,633 14,399,096 2,739Penelec 589,959 4,471,133 5,018,687 4,044,173 41,421 0 13,575,414 773,805 4,347 14,353,566 2,451Penn Power 159,692 1,634,012 1,366,828 1,228,844 6,464 1,018 4,237,166 128,641 1,970 4,367,777 901PPL 1,398,461 14,218,100 13,817,800 8,417,700 237,000 931,937 37,622,537 2,475,685 69,656 40,167,878 6,845PECO 1,564,433 12,893,426 8,404,059 15,888,955 927,616 587,586 38,701,642 2,010,187 45,420 40,757,249 7,994West Penn 714,974 7,100,611 4,880,026 7,285,694 49,114 739,915 20,055,360 1,118,642 -- 21,174,002 3,667UGI 62,166 518,028 328,583 102,981 5,603 92 955,287 53,569 1,912 1,010,768 193Citizens' 6,814 79,818 27,487 52,237 667 0 160,209 7,205 190 167,604 39Pike County 4,649 28,077 44,699 0 404 0 73,180 4,954 17 78,151 15Wellsboro 6,133 40,171 31,051 33,600 229 130 105,182 9,106 300 114,587 21Total 5,645,180 50,377,271 45,024,861 43,108,938 1,367,356 2,282,527 142,160,954 8,139,852 167,886 150,468,691 27,597% of Total 35.44% 31.67% 30.32% 0.96% 1.61% 100.00%2009 v 2008 0.35% -1.84% -1.86% -9.17% 1.82% -1.76% -4.16% -8.73% -2.76% -4.42% -8.16%Table 6 PA EDCs' energy demand, peak load and customers served (2008)Total Sales For Total System Company Net Energy PeakCustomers Residential Commercial Industrial Other Resale Consumption Losses Use For Load LoadCompany Served (MWh) (MWh) (MWh) (MWh) (MWh) (MWh) (MWh) (MWh) (MWh) (MW)Duquesne 586,804 4,060,410 6,631,217 3,079,488 66,811 22,708 13,860,634 963,150 30,222 14,854,006 2,822Met-Ed 549,486 5,597,600 4,776,548 3,831,118 35,467 0 14,240,733 961,231 13,270 15,215,234 3,045Penelec 589,552 4,557,862 5,185,820 4,593,995 41,574 0 14,379,251 881,122 4,804 15,265,177 2,880Penn Power 159,585 1,666,785 1,404,034 1,614,208 6,466 4,348 4,695,841 154,133 1,968 4,851,942 1,063PPL 1,394,202 14,418,614 13,912,558 9,551,368 225,891 981,726 39,090,157 2,665,912 72,806 41,828,875 7,316PECO 1,570,294 13,317,085 8,700,237 16,533,639 908,982 554,752 40,014,695 1,941,212 47,774 42,003,681 8,824West Penn 713,409 7,172,183 4,925,027 8,134,755 52,001 759,876 21,043,842 1,300,129 -- 22,343,971 3,823UGI 62,262 530,174 344,039 122,861 5,658 91 1,002,823 52,016 1,809 1,056,648 197Citizens' 6,791 82,710 29,015 55,820 713 0 168,258 4,411 190 172,859 41Pike County 4,642 29,321 47,765 0 208 0 77,293 300 9 77,602 19Wellsboro 6,014 41,382 33,377 35,304 231 152 110,446 7,726 277 118,449 21Total 5,625,594 51,320,713 45,879,480 47,461,432 1,342,850 2,323,501 148,327,976 8,918,905 172,653 157,419,534 30,050% of Total 34.60% 30.93% 32.00% 0.91% 1.57% 100.00%Between 1994 and 2009, the state’s energy demand grew at an average rate of 1.0 percentannually. Residential sales grew at an annual rate of 1.5 percent and commercial at 2.1 percent;48 A GWh is equivalent to 1,000 MWh or 1,000,000 kWh.49 Non-coincident peak load is the sum of EDCs’ annual peak loads regardless of their date or time of occurrence.20<strong>Pennsylvania</strong> <strong>Public</strong> <strong>Utility</strong> <strong>Commission</strong>
industrial sales declined at an average rate of 0.4 percent per year, due mainly to a 9.4 percent dropin 2009. Over the past five years, residential demand increased an average of 0.9 percent per yearand commercial at 1.0 percent; industrial sales decreased a total of 8.3 percent. Average annualtotal sales growth from 2004 to 2009 was 0.1 percent.The current aggregate five-year projection of growth in energy demand is 1.4 percent. Thisincludes a residential growth rate of 0.9 percent, a commercial rate of 1.9 percent and an industrialrate of 1.6 percent. See Figure 9, which depicts growth in retail energy demand by sector, in GWh.Figure 9 <strong>Pennsylvania</strong> aggregate energy demand (GWh)53,500HistoricForecasts51,50049,500CommercialResidential47,50045,50043,500Industrial41,50039,50037,5002000 2001 2002 2003 2004 2005 2006 2007 2008 2009 <strong>2010</strong> 2011 2012 2013 2014Over the past 15 years, the average aggregate non-coincident peak load for the major EDCsincreased 0.7 percent per year. From 2004 to 2009, the peak load increased by an average of 0.4percent per year. From 2008 to 2009, the aggregate peak load dropped 2,453 MW from 30,050MW to 27,597 MW, or an 8.2 percent decrease. The 2009 summer peaks occurred in August.The combined forecast of the EDCs’ peak load shows the load increasing from 27,597 MW in2009 to 29,550 MW in 2014 at an average annual growth rate of 1.4 percent. Actual peak loadsare weather adjusted to reflect normal weather conditions prior to applying forecastingmethodologies. Thus, the projected growth rates reflect the year-to-year fluctuations in energysales and peak load.Projections of energy demand and peak load reflect EDC compliance with the requirements of Act129 relating to energy efficiency and demand response options available for each customer class.See Figure 10.Electric Power Outlook for <strong>Pennsylvania</strong> 2009-2014 21
Figure 10 <strong>Pennsylvania</strong> aggregate non-coincident peak load (MW)32,000HistoricForecasts31,500200831,000200930,50030,00029,500<strong>2010</strong>29,00028,50028,00027,50027,00026,50026,00025,50025,0002000 2001 2002 2003 2004 2005 2006 2007 2008 2009 <strong>2010</strong> 2011 2012 2013 2014Forecasting TrendsIntroductionLoad forecasting is an imprecise science affected by many unpredictable factors. These factors canamplify minor inaccuracies into substantial errors when they are relied upon for the planning ofmajor construction projects, which take several years to design and build. During the 1960s andearly 1970s, rapidly increasing demand for electricity drove the need for additions of large, baseload generation facilities. The <strong>Commission</strong>’s aggressive action taken after the 1965 NortheastBlackout during a period of electric power deficiency also contributed to the increase in generatingresources. Subsequently, however, the interruption of this growth pattern by the Arab oil embargo,particularly in the industrial sector, distorted the historical capacity-load relationship, resulting inrelatively large reserve margins. Several years of relatively moderate growth were required tolower margins to a more acceptable level.While the overall growth rate has substantially declined and, although generation is no longerregulated by the <strong>Commission</strong>, utilities must continue to forecast future demand within a reasonablerange of accuracy that insures a reliable future supply of electric energy. In a deregulatedmarketplace, forecasting is important for applications such as energy purchasing, generation andinfrastructure development.Forecasting MethodologiesIn order to provide an adequate and reliable supply of electricity to the consuming public, EDCsmust continue to forecast customer demands. Although EDCs are no longer the sole providers of22<strong>Pennsylvania</strong> <strong>Public</strong> <strong>Utility</strong> <strong>Commission</strong>
energy within a competitive generation market, reasonably accurate projections are necessary toidentify new capacity requirements and stimulate capital investment. Accurate forecasts are alsoneeded to plan for future expansion of the transmission and distribution network.Prior to 1973, customer load growth patterns remained relatively consistent, permitting utilities toforecast growth using a straightforward method such as linear regression analysis. This approachbasically extrapolated future levels of demand from historical data. Although no one could foreseethe 1973-74 Arab oil embargo and the 1979 energy crisis, or reasonably predict the effects ofconservation and load management strategies and new technologies, the time trend approach failedto reflect the resultant dramatic changes in consumptive patterns, indicating a need for moresophisticated forecasting techniques.Between 1940 and 1970, residential demand rose at a nominal levelized (average) rate of 6.6percent per year, while the cost of electricity decreased at an annual average rate of 2.0 percent. 50Between 1970 and 2009, residential demand and cost increased at annual rates of 1.3 percent and4.1 percent, respectively. Between 1994 and 2009, the state’s energy demand grew an average of1.0 percent annually. Residential sales grew at an annual rate of 1.5 percent and commercial at 2.1percent; industrial sales declined an average of 0.4 percent per year. During this same period, theaverage residential cost of electricity increased at an annual rate of 1.1 percent, going from anaverage of 9.46 cents to 11.21 cents per kWh. Figure 11 compares the changes in residential costand usage from 1940 to 2009.Figure 11 Average residential cost and use (cents per kWh or MWh per year)1211<strong>Utility</strong> Restructuring109876kWh per year543Cost per kWh21050 Total Residential Account 440, FERC Form 1.Electric Power Outlook for <strong>Pennsylvania</strong> 2009-2014 23
Most utilities have employed a combination of econometric and end-use forecasting methodswhich, although more sensitive to economic and engineering variables, were slow in adjusting tothe overall decrease in load growth, since they are also based to a great extent on historical data.Econometrics is a statistical method combining the theories of economics and statistics for analysisof data, seasonal adjustment and model simulation. The end-use technique involves an explicitcount of various energy consuming appliances or processes to which an energy use per unit isassigned.Several factors affect the demand for electricity and among the most influential are economicgrowth, technological changes, energy supply, prices of electricity and other energy sources, andweather conditions. Industrial sales are more affected by economic conditions, whereas residentialand commercial sales are most sensitive to weather conditions. Some of the key variables used bymost large utilities in forecasting are: number of customers, appliance saturation, electricity price,population, per capita income, local employment, heating degree days, cooling degree days,appliance efficiencies, industrial output, natural gas prices and household size.To illustrate the relationship between input variables and electrical usage, Figure 12 compares theyearly changes from U.S. Gross Domestic Product (GDP), in constant 1995 dollars, with energydemand.Figure 12 Relationship between annual changes in GDP and energy demand10%8%6%4%2%0%-2%-4%-6%GDPEnergy Demand-8%1972 1974 1976 1978 1980 1982 1984 1986 1988 1990 1992 1994 1996 1998 2000In addition to these key variables, the relatively unknown impacts of recently approved EnergyEfficiency and Conservation Plans, pursuant to Act 129 of 2008, and the current economicdownturn will make accurate forecasting a challenging pursuit. Although the Act 129 targetreductions in energy consumption and peak demand are factored into the forecasts, the actual24<strong>Pennsylvania</strong> <strong>Public</strong> <strong>Utility</strong> <strong>Commission</strong>
esults of the EDCs’ efforts will not be known for some time. The recession has already shown itseffect on energy usage; forecasts generally reflect a recovery in <strong>2010</strong>.The EDCs’ residential load growth scenarios typically reflect such variables as weather, personalincome, electricity price (price elasticity), appliance saturation, consumer sentiment, mortgagerates and the number of new residential customers, based on population projections. Commercialsales forecasts relate historical sales to weather, non-manufacturing employment, personal income,real domestic product, the consumer price index and the number of residential customers.Industrial sales are primarily dependent on the level of economic activity within the service areaand in the nation, and reflect specific information concerning large customer plans to expand orclose their facilities. Forecasts of summer and winter peak demands are derived from econometricmodels which utilize the historic relationship of peak demand growth to the growth in the numberof customers, and the effects of weather conditions.PJM performs independent monthly and seasonal forecasts utilizing metered load data, loadmanagement, the PJM Load Forecast Model and Weather Normalization and Peak Allocation. 51After-the-fact hourly load data, provided by the EDCs, is used by PJM for deriving seasonal loadprofiles, weather normalization factors and zonal load contributions. Monthly and seasonal loadforecasts are prepared for each PJM zone, region, the RTO and selected combinations of zones.Weather normalization is employed to adjust historic loads for abnormal weather conditions. Aftereach season, the model results are re-estimated, adding the most recent historical load, weather andeconomic data, to arrive at the weather normalized seasonal peak. Finally, zonal weathernormalizedRTO-coincident summer peak loads are allocated to the wholesale and retail customersin the zones using EDC-specific methodologies that typically employ customer shares of RTOactual peaks.Sectorial and Regional TrendsIn the early 1970s, aggregate sales growth in the residential, commercial and industrial sectorsranged from 6 percent to 8 percent per year and rapidly declined thereafter. Industrial salesinitially peaked in 1979 at 47,636 GWh, dropped to 39,994 GWh in 1982, climbed back to 48,941GWh in 2000 and are currently 88.1 percent of the 2000 level. Over the past 40 years, total saleshave grown an average of 1.8 percent annually: residential at 2.5 percent, commercial at 3.4percent and industrial at 0.5 percent.Statewide residential consumption has increased from 56 GWh per day in 1970 to 138 GWh perday in 2009. Growth in total residential usage has averaged 787 GWh per year. Over the sameperiod, average annual usage per residential customer increased from 6,203 kWh to 10,217 kWh, a65 percent increase. Average usage dropped 3.5 percent from the 2007 high of 10,583 kWh.In 2009, residential usage dropped 1.8 percent, following a decrease of 0.7 percent the previousyear. The five-year aggregate residential forecast shows a growth of 470 GWh per year or anaverage annual growth of 0.9 percent. See Figure 13.51 PJM Manual 19: Load Forecasting and Analysis, Oct. 1, 2009.Electric Power Outlook for <strong>Pennsylvania</strong> 2009-2014 25
Figure 13 <strong>Pennsylvania</strong> residential usage and annual growth111098Annual GrowthForecast1501401307120Percent Change6543211101009080GWh Per Day070-1-2-3-4Usage605040Growth in commercial consumption has been relatively consistent, increasing at a levelized annualrate of 3.8 percent since 1970. Although year-to-year growth rates have been declining over theyears, demand continues to grow an average of 825 GWh per year.In 2009, commercial usage dropped 1.8 percent, following a decrease of 0.2 percent the previousyear. The five-year forecast shows annual growth averaging 897 GWh, or an average annualgrowth rate of 1.9 percent. See Figure 14.26<strong>Pennsylvania</strong> <strong>Public</strong> <strong>Utility</strong> <strong>Commission</strong>
Figure 14 <strong>Pennsylvania</strong> commercial usage and annual growth1110Usage9Annual Growth87Forecast1401301201106100Percent Change5432908070GWh Per Day1600-1-25040-330Industrial sales have fluctuated considerably, particularly during the 1970s and 1980s, as can beseen in Figure 15. Between 1970 and 2009, growth in aggregate industrial demand has averaged177 GWh per year, or an average annual rate of 0.4 percent.Since 2000, industrial sales have declined 12.1 percent. Last year’s sales decreased 9.2 percentfrom 2008, and the forecast for <strong>2010</strong> is 7.8 percent below the 2008 level. From 2009 to 2014,industrial growth is projected to average 1.6 percent.The recent drop in industrial sales has been, for the most part, the result of the economic recession.Prior to 2009, there were two other significant declines in the industrial energy market. Asignificant drop in sales (7.8 percent) followed the 1973 OPEC Oil Embargo, which quadrupledthe price of oil. 52 The 1979 energy crisis occurred in the wake of the Iranian Revolution; at thesame time, the Carter Administration began a phased deregulation of oil prices, and, within 12months, the price of crude oil increased 150 percent. 53 Shortly after, a substantial drop in Iran’s oilproduction, followed by a drop in Saudi Arabia’s output occurred. 54 In 1982, the largest drop inindustrial sales occurred (13.6 percent). Duquesne alone lost 40.7 percent of its industrial load thatyear.52 U.S. Department of State, Office of the Historian, OPEC Oil Embargo, 1973-1974.53 The New York Times, March 3, 2008.54 Energy Information Administration, Annual Energy Review 2008, Fig. 11.5, p. 314.Electric Power Outlook for <strong>Pennsylvania</strong> 2009-2014 27
Figure 15 <strong>Pennsylvania</strong> industrial usage and annual growth1210Annual GrowthUsage86Forecast1401351304125Percent Change20-2-4-6120115110GWh Per Day-8105-10100-12-1495-1690Growth in <strong>Pennsylvania</strong>’s total electric consumption is expected to increase by 1.8 percent in <strong>2010</strong>and 1.0 percent in 2011. In comparison, total U.S. consumption is projected to increase by 3.0percent in <strong>2010</strong> and grow by 1.2 percent in 2011. 55Aggregate non-coincident peak load increased from 14,812 MW in 1970 to 27,597 MW in 2009, atan annual average rate of 1.6 percent. Peak load is expected to increase to 29,550 MW by 2014,500 MW less than the 2008 load, at an average annual rate of 1.4 percent. See Figure 16.55 Short-Term Energy Outlook, Energy Information Administration, April <strong>2010</strong>.28<strong>Pennsylvania</strong> <strong>Public</strong> <strong>Utility</strong> <strong>Commission</strong>
Figure 16 <strong>Pennsylvania</strong> non-coincident peak load and annual growth10Annual Growth86Forecast33,00031,00029,000Percent Change420-2-4-6-8-10Peak Load27,00025,00023,00021,00019,00017,00015,000Megawatts-1213,000Trends in Forecast AccuracySince electricity use is a function of several forces outside the control of the utilities, forecasts offuture electricity requirements cannot be any more certain than the forecasts of those externalforces. Although all utilities have had some degree of difficulty in adjusting to the dramaticchanges in electricity use, some utilities have fared better than others. This may, in part, beattributable to the stability (or volatility) of each utility’s service territory.During the 1970s and early 1980s, forecast deviations from actual figures quickly becameexcessive. Forecasts of peak load made three years in advance were, on average, 10 percent higherthan actual demand. Forecasts made five years in advance were 20 percent higher. Over the lastfew years, however, forecast deviations have shown no appreciable difference as to whetherforecasts are made one, two or even five years in advance. Peak load forecast deviations havevaried only slightly, from 4.7 percent to 5.7 percent, based on the average of forecast deviations foreach company. Deviation magnitudes have diminished over time. See Figure 17. (Available datapoints decrease from 10 for forecasts made one year in advance to six for forecasts made five yearsin advance.)Energy demand forecast deviations have also diminished over time. Unlike the peak loadforecasts, however, there is a definite pattern of increasing forecast deviation magnitudes as theforecasts advance into the future. Figures 18-20 show the absolute deviations from actual for theresidential, commercial and industrial sectors, for forecasts made one to five years in advance.Electric Power Outlook for <strong>Pennsylvania</strong> 2009-2014 29
Figure 17 Average deviation in peak loadforecasts (%)6543210Figure 18 Average deviation in commercialforecasts (%)6543211 2 3 4 5Years Forecast in AdvanceFigure 19 Average deviation in residentialforecasts (%)6543210Figure 20 Average deviation in industrialforecasts (%)121086421 2 3 4 5Years Forecast in Advance01 2 3 4 5Years Forecast in Advance01 2 3 4 5Years Forecast in AdvanceMost utility forecasts have appreciably improved over time. There is, however, a significant rangein the magnitude of forecast deviations from company to company. At the extremes, PPL’s peakload forecast deviations have ranged from 2.6 percent to 4.7 percent, whereas Penn Power’sdeviations ranged from 7.6 percent to 9.2 percent. Figures 21-24 compare EDCs’ absolute averageforecast deviations from actual figures for peak load and residential, commercial and industrialenergy demand for forecasts made one to five years in advance.There has been little difference between the forecast accuracy of the residential and commercialsectors; however, forecasts for both of these sectors have, for the most part, been considerablymore accurate than those made for the industrial sector.Generally, residential and commercial energy demand has tended to be underestimated; whereasindustrial energy demand has been overestimated. This can be seen in Figure 25 where the averageshort-term forecast error (deviation) is examined for peak load and for each major customer class.30<strong>Pennsylvania</strong> <strong>Public</strong> <strong>Utility</strong> <strong>Commission</strong>
Figure 21 Comparison of peak loadforecast accuracy (%)109876543210DL ME PN PP PL PE WP1 2 3 4 5Years Forecast in AdvanceFigure 22 Comparison of residential energydemand forecast accuracy (%)9876543210DL ME PN PP PL PE WP1 2 3 4 5Years Forecast in AdvanceFigure 23 Comparison of commercialenergy demand forecast accuracy (%)876543210DL ME PN PP PL PE WP1 2 3 4 5Years Forecast in AdvanceFigure 24 Comparison of industrial energydemand forecast accuracy (%)20181614121086420DL ME PN PP PL PE WP1 2 3 4 5Years Forecast in AdvanceFigure 25 Average of deviations in forecasts made one to three years in advance (%)10Industrial8642CommercialPeak LoadResidential0-2-4-62000 2001 2002 2003 2004 2005 2006 2007Electric Power Outlook for <strong>Pennsylvania</strong> 2009-2014 31
Summary of EDC DataThe following sections provide, for each jurisdictional EDC, historic and projected energy salesand peak load; electric generation supplier sales statistics; purchases from cogeneration and smallpower production projects; planned transmission line additions; and conservation activities.Additional statistics on actual and forecast load and energy demand for the large EDCs areprovided in Appendix A.Duquesne Light CompanyDuquesne Light Company (Duquesne) is the principalsubsidiary of DQE Holdings 56 and provides electricservice to 586,616 electric utility customers in theCity of Pittsburgh and portions of Allegheny andBeaver counties in Southwestern <strong>Pennsylvania</strong>. In2009, Duquesne had energy sales totaling 13,185GWh -- down 4.9 percent from 2008. Commercialsales continued to dominate Duquesne's market with 49.6 percent of the total sales, followed byresidential (29.9 percent) and industrial (19.8 percent). Average annual use per residentialcustomer was 7,516 kWh at an average cost of 11.82 cents per kWh; operating revenues totaled$876.2 million.Between 1994 and 2009, Duquesne's total energy demand increased 0.6 percent per year:residential demand grew at an annual rate of 1.4 percent; commercial demand grew at 1.1 percent;and industrial demand decreased at an average annual rate of 1.5 percent. The current five-yearprojection of average increase in total energy consumption is 0.7 percent per year. This includes aresidential growth rate of 2.4 percent, a commercial rate of 0.6 percent and a major decline inindustrial sales of 2.1 percent per year. See Figure 26.Duquesne's summer peak load, occurring on Aug. 17, 2009, was 2,732 MW, representing adecrease of 3.2 percent from last year's peak of 2,822 MW. The 2009-10 winter peak load was2,122 MW or 5.5 percent lower than that of the previous year. The actual average annual peakload growth rate over the past 15 years was 0.5 percent. Duquesne’s forecast shows the peak loadincreasing from 2,732 MW in the summer of 2009 to 2,960 MW in 2014, or an average annualgrowth rate of 1.6 percent. The current forecast for <strong>2010</strong> is 0.6 percent above the previousforecast, filed in 2009. See Figure 27.Figure 28 depicts the average of deviations in forecasts made one to three years in advance. TablesA01-A04 in Appendix A provide Duquesne’s forecasts of peak load and residential, commercialand industrial energy demand, filed with the <strong>Commission</strong> in years 2000 through <strong>2010</strong>.Currently, PJM manages the flow of wholesale electricity for Duquesne. Duquesne’s integrationinto PJM involved transferring control of 670 miles of high-voltage transmission lines; however,ownership has remained with Duquesne. PJM is the regional reliability coordinator for Duquesne.56 On April 24, 2007, the <strong>Commission</strong> approved the acquisition of Duquesne Light Holdings Inc., by merger, with theMacquarie Consortium. Headquarters remain in Pittsburgh. See Docket No. A-110150F0035.32<strong>Pennsylvania</strong> <strong>Public</strong> <strong>Utility</strong> <strong>Commission</strong>
For Calendar Year 2009, 14 EGSs and one municipality sold a total of 7,956 GWh to retailcustomers in Duquesne’s service territory, or 60.3 percent of total consumption. There were noinstances in 2009 where EGSs failed to supply scheduled load. Since joining PJM in 2005, PJMhas provided energy imbalance service to all load serving entities, which includes the EGSs.Duquesne does not own any generating facilities.Duquesne has 120.7 miles of transmission line projects, including construction of new overheadand underground transmission, reconfiguration of existing transmission lines, and up-rates ofexisting lines, scheduled through 2013. These projects are planned to mitigate anticipated NERCreliability criteria violations identified by both Duquesne and PJM.Duquesne’s Energy Efficiency and Conservation Plan 57 includes 19 energy efficiency and threedemand response programs to reach cumulative reduction targets of 423 GWh and 113 MW at atotal cost of $78.2 million. The programs provide a full range of measures to assist residential,commercial and industrial customers of all sizes and in all key market segments. For furtherinformation, visit http://www.duquesnelight.com/wattchoices.Duquesne is a member of PJM and RFC.Figure 26 Duquesne Light Company energy demand (GWh)7,500Historic7,0006,5006,000ForecastsCommercial5,5005,0004,500Residential4,0003,5003,0002,500Industrial2,0002000 2001 2002 2003 2004 2005 2006 2007 2008 2009 <strong>2010</strong> 2011 2012 2013 201457 Docket No. M-2009-2093217.Electric Power Outlook for <strong>Pennsylvania</strong> 2009-2014 33
Figure 27 Duquesne Light Company peak load (MW)3,300HistoricForecasts3,20020083,1003,000<strong>2010</strong>2,9002,80020092,7002,6002,5002000 2001 2002 2003 2004 2005 2006 2007 2008 2009 <strong>2010</strong> 2011 2012 2013 2014Figure 28 Duquesne Light Company average of deviations in forecasts (%)14Industrial1210Peak Load8642CommercialResidential0-2-4-6-82000 2001 2002 2003 2004 2005 2006 2007Forecast Year34<strong>Pennsylvania</strong> <strong>Public</strong> <strong>Utility</strong> <strong>Commission</strong>
FirstEnergy CorporationFirstEnergy Corporation (FirstEnergy) is a holding company with seven electric utility operatingcompanies, comprising the nation's fifth largest investor-owned electric system, serving 4.5 millioncustomers within 36,100 square miles of Ohio, <strong>Pennsylvania</strong> and New Jersey. Its generationsubsidiaries control more than 14,200 MW of capacity (56 percent coal and 28 percent nuclear).The three operating companies in <strong>Pennsylvania</strong> include Metropolitan Edison Company,<strong>Pennsylvania</strong> Electric Company and <strong>Pennsylvania</strong> Power Company. See Figure 29.Figure 29 FirstEnergy service territoryOn May 14, <strong>2010</strong>, FirstEnergy, West Penn Power Company and TrailCo filed a joint applicationwith the <strong>Commission</strong>, at Docket No. A-<strong>2010</strong>-2176520, to obtain approval for the merger ofAllegheny Energy, Inc. with a wholly-owned subsidiary of First Energy. The combined companywill retain the FirstEnergy name and be headquartered in Akron, Ohio. If approved, thetransaction, expected to be completed early in 2011, will result in an energy provider with $16billion in annual revenues, 10 regulated EDCs operating in seven states, 20,000 miles of highvoltagetransmission lines, 24,000 MW of generating capacity and more than 2,200 MW ofrenewable energy.Metropolitan Edison CompanyMetropolitan Edison Company (Met-Ed), asubsidiary of FirstEnergy, provides service to551,283 electric utility customers in all or portionsof 14 counties in Eastern and Southcentral<strong>Pennsylvania</strong>. In 2009, Met-Ed had total energysales of 13,490 GWh—down 5.3 percent from2008. Residential sales dominated Met-Ed’smarket with 40.4 percent of total sales, followed by commercial (33.9 percent) and industrial (25.5percent). Declines in sales were seen in all customer segments, with the largest decline in theindustrial sector at 10.2 percent. Industrial sales were 77.9 percent of the highest level occurring inElectric Power Outlook for <strong>Pennsylvania</strong> 2009-2014 35
2000. Average annual use per residential customer was 1,218 kWh at an average cost of 11.38cents per kWh; operating revenues totaled $1.32 billion.Between 1994 and 2009, Met-Ed’s energy demand grew at an average rate of 2.1 percent per year.Residential and commercial sales have maintained relatively steady growth over the period (2.2percent for residential and 3.0 percent for commercial), while industrial sales have fluctuatedconsiderably. Industrial sales declined at an average rate of 0.8 percent, attributable to the steepdrop in 2009. The current five-year projection of growth in total energy demand is 1.9 percent.This includes a residential growth rate of 1.3 percent, a commercial growth rate of 1.7 percent andan industrial rate of 3.2 percent. See Figure 30.Met-Ed’s summer peak load, occurring on Aug. 10, 2009, was 2,739 MW, representing a decreaseof 10.0 percent from last year’s system peak of 3,045 MW. The 2009-10 winter peak load was2,342 MW or 10.7 percent lower than the previous year’s winter peak of 2,622 MW. The actualaverage annual peak load growth rate over the past 15 years was 2.1 percent. Met-Ed’s forecastshows its peak load dropping from 2,739 MW in 2009 to 2,630 MW in 2012 and increasingthereafter to 2,731 MW by 2014. The current forecast for <strong>2010</strong> is 245 MW or 8.4 percent belowthe previous forecast. See Figure 31.Figure 32 depicts the average of deviations in forecasts made one to three years in advance. TablesA05-A08 in Appendix A provide Met-Ed’s forecasts of peak load and residential, commercial andindustrial energy demand, filed with the <strong>Commission</strong> in years 2000 through <strong>2010</strong>.A restructuring settlement, approved by the <strong>Commission</strong> in 1998, provided for the transfer of 80percent of Met-Ed’s POLR responsibility to other generation suppliers by June 2003. Since thisdid not occur, Met-Ed retains POLR responsibility for those customers who do not choose analternate energy supplier and currently supplies nearly all of its POLR customers. Met-Ed does notown any generating facilities.In 2009, Met-Ed purchased 2,202 GWh from cogeneration and small power production projects,representing 15.3 percent of net energy for load. Contract capacity (defined as PJM installedcapacity credits) is 295 MW of a total capacity of 355 MW. For Calendar Year 2009, two EGSsold a total of 21 GWh to retail customers in Met-Ed’s service territory. There were nooccurrences where EGSs were unable to supply scheduled loads during 2009.Through 2013, Met-Ed’s transmission line projects include construction of new lines andreconductoring of existing lines to improve local service at a combined cost of $4.1 million.Projects include 11.1 miles of 69 kV, 115 kV and 230 kV circuits.Met-Ed’s Energy Efficiency and Conservation Plan 58 offers a suite of programs for all customersegments designed to reach cumulative reduction targets of 446 GWh and 119 MW at a total costof $99.5 million.Met-Ed is a member of PJM and RFC.58 Docket No. M-2009-2092222.36<strong>Pennsylvania</strong> <strong>Public</strong> <strong>Utility</strong> <strong>Commission</strong>
Figure 30 Metropolitan Edison Company energy demand (GWh)6,0005,800HistoricForecasts5,6005,400Residential5,2005,0004,8004,600Commercial4,4004,2004,000Industrial3,8003,6003,4003,2003,0002000 2001 2002 2003 2004 2005 2006 2007 2008 2009 <strong>2010</strong> 2011 2012 2013 2014Figure 31 Metropolitan Edison Company peak load (MW)3,200Historic3,1003,0002,9002,8002,7002,6002,5002,4002,300Forecasts20082009<strong>2010</strong>2,2002000 2001 2002 2003 2004 2005 2006 2007 2008 2009 <strong>2010</strong> 2011 2012 2013 2014Electric Power Outlook for <strong>Pennsylvania</strong> 2009-2014 37
Figure 32 Metropolitan Edison Company average of deviations in forecasts (%)12Industrial108642CommercialResidential0-2Peak Load-4-6-82000 2001 2002 2003 2004 2005 2006 2007Forecast Year<strong>Pennsylvania</strong> Electric Company<strong>Pennsylvania</strong> Electric Company (Penelec), asubsidiary of FirstEnergy, provides service to589,959 electric utility customers in all or portionsof 29 counties in Western and Northern<strong>Pennsylvania</strong>. In 2009, Penelec had energy salestotaling 13,575 GWh—down 5.6 percent from2008. Commercial sales led Penelec’s market with37.0 percent of the total sales, followed byresidential (32.9 percent) and industrial (29.8percent). Average annual use per residentialcustomer was 8,844 kWh at an average cost of 10.46 cents per kWh; operating revenues totaled$1.08 billion.Between 1994 and 2009, Penelec’s energy demand grew at an average rate of 0.8 percent per year.Residential and commercial sales have maintained relatively steady growth over the period (1.1percent for residential and 1.9 percent for commercial), while industrial sales have fluctuatedgreatly, with an average annual decrease of 0.6 percent, due mainly to the 12.0 percent drop insales last year. The current five-year projection of growth in total energy demand is 1.5 percent.38<strong>Pennsylvania</strong> <strong>Public</strong> <strong>Utility</strong> <strong>Commission</strong>
This includes a residential growth rate of 0.1 percent, a commercial growth rate of 1.6 percent andan industrial growth rate of 2.9 percent. See Figure 33.Penelec’s 2009 summer peak load, occurring on Aug. 17, 2009, was 2,451 MW, representing adecrease of 14.9 percent from last year’s summer peak of 2,880 MW. The 2009-10 winter peakload was 2,346 MW or 18.1 percent lower than the previous year’s winter peak of 2,866 MW. Theaverage change in the annual summer peak load over the past 15 years was -0.2 percent per year.Penelec’s forecast shows its summer peak load increasing at an average annual rate of 0.6 percent,rising to 2,531 MW by 2014, or 349 MW less than the 2008 all-time peak of 2,880 MW. Thecurrent forecast for <strong>2010</strong> is 6.3 percent below the previous forecast. See Figure 34.Figure 35 depicts the average of deviations in forecasts made one to three years in advance. TablesA09-A12 in Appendix A provide Penelec’s forecasts of peak load and residential, commercial andindustrial energy demand, filed with the <strong>Commission</strong> in years 2000 through <strong>2010</strong>.A restructuring settlement, approved by the <strong>Commission</strong> in 1998, provided for the transfer of 80percent of Penelec’s POLR responsibility to other generation suppliers by June 2003. Since thisdid not occur, Penelec retains POLR responsibility for those customers who do not choose analternate energy supplier and currently supplies nearly all of its POLR customers.Penelec divested all of its generation facilities in 1999.In 2009, Penelec purchased 3,082 GWh from cogeneration and small power production projects, or21.5 percent of net energy for load. Contract capacity (defined as PJM installed capacity credits) is370 MW out of a total capacity of 411 MW.For Calendar Year 2009, two licensed EGSs sold a total of 528 GWh to retail customers inPenelec’s service territory, or 3.9 percent of total consumption, up from 3.0 percent in 2008.Through 2012, Penelec’s transmission line projects include construction of new lines andreconductoring of existing lines to improve local service at a combined cost of $11.7 million.Projects include 9.4 miles of 115 kV, 230 kV and 500 kV circuits.Penelec’s Energy Efficiency and Conservation Plan 59 offers a suite of programs for all customersegments designed to reach cumulative reduction targets of 432 GWh and 108 MW at a total costof $91.9 million.Penelec is a member of PJM and RFC.59 Docket No. M-2009-2112952.Electric Power Outlook for <strong>Pennsylvania</strong> 2009-2014 39
Figure 33 <strong>Pennsylvania</strong> Electric Company energy demand (GWh)5,600Historic5,4005,200ForecastsCommercial5,0004,8004,6004,400ResidentialIndustrial4,2004,0003,8002000 2001 2002 2003 2004 2005 2006 2007 2008 2009 <strong>2010</strong> 2011 2012 2013 2014Figure 34 <strong>Pennsylvania</strong> Electric Company peak load (MW)3,000HistoricForecasts2,9002,8002,700200820092,6002,500<strong>2010</strong>2,4002,3002,2002000 2001 2002 2003 2004 2005 2006 2007 2008 2009 <strong>2010</strong> 2011 2012 2013 201440<strong>Pennsylvania</strong> <strong>Public</strong> <strong>Utility</strong> <strong>Commission</strong>
Figure 35 <strong>Pennsylvania</strong> Electric Company average of deviations in forecasts (%)18151310Industrial8530-3Peak LoadResidentialCommercial-5-82000 2001 2002 2003 2004 2005 2006 2007Forecast Year<strong>Pennsylvania</strong> Power Company<strong>Pennsylvania</strong> Power Company (Penn Power), asubsidiary of FirstEnergy, provides service to159,692 electric utility customers in all or portionsof six counties in Western <strong>Pennsylvania</strong>. In 2009,Penn Power had energy sales totaling 4,237GWh—a decrease of 9.8 percent from the 2008figure. Residential sales lead Penn Power’s marketwith 38.6 percent of the total sales, followed bycommercial (32.3 percent) and industrial (29.0 percent). Average annual use per residentialcustomer was 11,673 kWh at an average cost of 11.72 cents per kWh; operating revenues totaled$261.7 million.Between 1994 and 2009, Penn Power’s energy demand grew at an average rate of 1.5 percent peryear. Residential and commercial sales have maintained relatively steady growth over the periodat annual rates of 2.2 percent and 2.9 percent, respectively. Industrial sales have fluctuatedconsiderably, with an overall average annual decrease of 0.3 percent, due mainly to a 23.9 percentdrop in 2009 sales. The current five-year projection of growth in total energy demand is 2.9percent. This includes a residential growth rate of 1.3 percent, a commercial growth rate of 2.3Electric Power Outlook for <strong>Pennsylvania</strong> 2009-2014 41
percent and an industrial growth rate of 5.4 percent, expecting a return to the 2008 level by 2014.See Figure 36.Penn Power’s 2009 summer peak load, occurring on Aug. 10, 2009, was 901 MW, representing adecrease of 15.2 percent from last year’s peak of 1,063 MW. The 2009-10 winter peak load of 878MW was 1.5 percent lower than the previous year’s winter peak of 891 MW. The actual averageannual peak load growth rate over the past 15 years was 1.6 percent. Penn Power’s forecast showsits summer peak load decreasing from 901 MW in the summer of 2009 to 890 MW in 2011, andthen increasing to 977 MW by 2014, or an overall average annual growth rate of 1.6 percent. Thecurrent forecast for <strong>2010</strong> is 45 MW or 4.8 percent lower than the previous forecast. See Figure 37.Figure 38 depicts the average of deviations in forecasts made one to three years in advance. TablesA13-A16 in Appendix A provide Penn Power’s forecasts of peak load and residential, commercialand industrial energy demand, filed with the <strong>Commission</strong> in years 2000 through <strong>2010</strong>.The electrical systems of Penn Power and the Ohio FirstEnergy operating companies areinterconnected and fully integrated, and for planning purposes are treated as a single electricalsystem. All of Penn Power’s generating facility ownership (1,237 MW) was transferred in 2005.ATSI owns and operates the transmission assets of Penn Power and the Ohio FirstEnergycompanies.For Calendar Year 2009, seven EGSs sold 2,286 GWh to retail customers in Penn Power’s serviceterritory or 53.9 percent of total consumption. Penn Power purchased 2,002 kWh from anindependent power producer in 2009.Penn Power’s Energy Efficiency and Conservation Plan 60 offers a suite of programs for allcustomer segments designed to reach cumulative reduction targets of 143 GWh and 44 MW at atotal cost of $26.6 million.Penn Power is a subsidiary of FirstEnergy, which is a member of RFC and MISO.60 Docket No. M-2009-2112956.42<strong>Pennsylvania</strong> <strong>Public</strong> <strong>Utility</strong> <strong>Commission</strong>
Figure 36 <strong>Pennsylvania</strong> Power Company energy demand (GWh)1,900Historic1,800ForecastsResidential1,7001,6001,500Commercial1,4001,300Industrial1,2001,1002000 2001 2002 2003 2004 2005 2006 2007 2008 2009 <strong>2010</strong> 2011 2012 2013 2014Figure 37 <strong>Pennsylvania</strong> Power Company peak load (MW)1,100HistoricForecasts1,0501,00020082009950900<strong>2010</strong>8508002000 2001 2002 2003 2004 2005 2006 2007 2008 2009 <strong>2010</strong> 2011 2012 2013 2014Electric Power Outlook for <strong>Pennsylvania</strong> 2009-2014 43
Figure 38 <strong>Pennsylvania</strong> Power Company average of deviations in forecasts (%)18Industrial16141210864Commercial2Residential0-2-4-6Peak Load-8-10-122000 2001 2002 2003 2004 2005 2006 2007Forecast YearPPL Electric Utilities CorporationPPL Electric Utilities Corporation (PPL), asubsidiary of PPL Corporation, provides service to1,398,461 homes and businesses over a 10,000-square-mile area in all or portions of 29 counties inCentral Eastern <strong>Pennsylvania</strong>. In 2009, PPL hadenergy sales totaling 37,623 GWh—down 3.8percent from 2008. Residential sales continued todominate PPL's market with 37.8 percent of the totalsales, followed by commercial (36.7 percent) and industrial (22.4 percent). Average annual use perresidential customer was 11,641 kWh at an average cost of 10.33 cents per kWh; operatingrevenues totaled $3.43 billion.Between 1994 and 2009, PPL's energy demand grew an average of 1.1 percent per year.Residential energy sales grew at an annual rate of 1.5 percent, and commercial sales grew at a 2.4percent rate. Industrial sales decreased at a rate of 0.8 percent, due mainly to an 11.9 percent dropin 2009 sales. The current five-year projection of average growth in energy demand is 0.9 percent.This includes growth rates of 0.2 percent for residential and 2.8 percent for commercial. Industrialsales are expected to continue to fall at an average rate of 0.9 percent per year. See Figure 39.44<strong>Pennsylvania</strong> <strong>Public</strong> <strong>Utility</strong> <strong>Commission</strong>
PPL's 2009 summer peak load, occurring on Aug. 17, <strong>2010</strong>, was 6,845 MW compared to theprevious summer’s peak of 7,316 MW, or a 6.4 percent decrease. The 2009-10 winter peak loadwas 6,800 MW, representing a decrease of 8.3 percent from last year's winter peak of 7,414 MW.The actual average annual peak load growth rate over the past 15 years was 0.3 percent. PPL’sfive-year winter peak load forecast scenario shows the peak load increasing from 6,845 MW in2009 to 7,487 MW in 2014 at an overall average annual rate of 1.8 percent. The current forecastfor <strong>2010</strong> is 43 MW or 0.6 percent lower than the previous forecast. It is noted that PPL is normallywinter peaking, but in some years the summer peak has exceeded the previous winter peak; thecurrent forecast represents the annual peak load. See Figure 40.Figure 41 depicts the average of deviations in forecasts made one to three years in advance. TablesA17-A20 in Appendix A provide PPL’s forecasts of peak load and residential, commercial andindustrial energy demand, filed with the <strong>Commission</strong> in years 2000 through <strong>2010</strong>.Net operable generating capacity of 8,505 MW (summer rating) for 2009 included 40.6 percentcoal-fired capacity and 25.1 percent nuclear capacity. Natural gas and dual fuel units account for27.0 percent of the total. This capacity, previously owned by PPL, is now owned by a PPLaffiliate, PPL Generation LLC. Independent power producers also provided 6 MW to the system.In 2009, PPL purchased 1,091 GWh from cogeneration and independent power productionfacilities, or 2.7 percent of net energy for load.For Calendar Year 2009, no EGSs supplied energy to retail customers in PPL’s service territory.However, with the removal of rate caps on Jan. 1, <strong>2010</strong>, alternative suppliers were serving 47.5percent of customer load as of April 1, <strong>2010</strong>. 61PPL has identified several transmission projects, including new construction and rebuilding ofexisting lines, with in-service dates through 2020. The projects involve 562 circuit miles at a totalcost of $937.2 million. The single largest project is the Susquehanna-Roseland Project, describedin Section 1.PPL reported a 2009 peak load reduction of 81.8 MW and energy savings of 3,048 MWh resultingfrom its Interruptible Service – Economic Provisions tariff schedule. Customers reducing load foreconomic conditions receive significant rate discounts. The peak load reduction from this programrepresents 1.2 percent of the 2009 summer peak load. PPL’s Price Response Service permitscustomers to respond to market price signals by reducing a portion of their load. In 2009, a 14.6MW peak load reduction was achieved, with energy savings totaling 396 MWh.PPL’s Energy Efficiency and Conservation Plan 62 includes a range of energy efficiency anddemand response programs that include all customer segments, designed to reach cumulativereduction targets of 1,146 GWh and 297 MW at a total cost of $246 million.PPL is a member of PJM and RFC.61 <strong>Pennsylvania</strong> Office of Consumer Advocate.62 Docket No. M-2009-2093216.Electric Power Outlook for <strong>Pennsylvania</strong> 2009-2014 45
Figure 39 PPL Electric Utilities Corporation energy demand (GWh)16,000HistoricForecast15,000Commercial14,00013,000Residential12,00011,00010,0009,0008,000Industrial7,0002000 2001 2002 2003 2004 2005 2006 2007 2008 2009 <strong>2010</strong> 2011 2012 2013 2014Figure 40 PPL Electric Utilities Corporation peak load (MW)7,900Historic7,700Forecasts20087,50020097,300<strong>2010</strong>7,1006,9006,7006,5006,3002000 2001 2002 2003 2004 2005 2006 2007 2008 2009 <strong>2010</strong> 2011 2012 2013 201446<strong>Pennsylvania</strong> <strong>Public</strong> <strong>Utility</strong> <strong>Commission</strong>
Figure 41 PPL Electric Utilities Corporation average of deviations in forecasts (%)16141210Industrial86420-2-4Peak LoadResidentialCommercial-6-82000 2001 2002 2003 2004 2005 2006 2007Forecast YearPECO Energy CompanyPECO Energy Company (PECO), a subsidiary ofExelon Corporation, is the largest electric utility in<strong>Pennsylvania</strong>, providing service to 1,564,433electric utility customers in the City ofPhiladelphia and all or portions of six counties inSoutheastern <strong>Pennsylvania</strong>. In 2009, PECO hadtotal energy sales of 38,702 GWh—down 3.3percent from 2008. Industrial sales continued todominate PECO's market with 41.1 percent of the total sales, followed by residential (33.3 percent)and commercial (21.7 percent). Average annual use per residential customer was 9,183 kWh at anaverage cost of 14.42 cents per kWh; operating revenues totaled $4.55 billion.Between 1994 and 2009 PECO's energy demand grew an average of 1.0 percent per year.Residential energy sales grew at an annual rate of 1.4 percent, commercial at 2.3 percent andindustrial at 0.1 percent. The current five-year projection of growth in energy demand is 2.0percent. This includes an annual growth rate of 2.0 percent for the residential, commercial andindustrial sectors. See Figure 42.Electric Power Outlook for <strong>Pennsylvania</strong> 2009-2014 47
PECO's 2009 summer peak load, occurring on Aug. 10, 2009, was 7,994 MW, representing adecrease of 9.4 percent from last year's peak of 8,824 MW, and the lowest level since 2004. The2009-10 winter peak demand was 6,728 MW or 0.7 percent below the previous winter's peak of6,777 MW. The actual average annual peak demand growth rate over the past 15 years was 0.7percent. PECO's current forecast shows the peak load increasing from the actual 2009 summerpeak load of 7,994 MW to 8,612 MW in the summer of 2014, or an annual growth rate of 1.5percent. The current forecast for <strong>2010</strong> is 977 MW or 10.7 percent lower than the previous forecast.See Figure 43.Figure 44 depicts the average of deviations in forecasts made one to three years in advance. TablesA21-A24 in Appendix A provide PECO’s forecasts of peak load and residential, commercial andindustrial energy demand, filed with the <strong>Commission</strong> in years 2000 through <strong>2010</strong>.PECO has entered into a Purchased Power Agreement with Exelon Generation to provide energyand capacity for its POLR load throughout the forecast period. Other resources may be obtainedthrough purchases from the wholesale markets.In 2009, PECO purchased 1,034 GWh from cogeneration and independent power productionfacilities, or 2.5 percent of net energy for load. Contract capacity totaled 181 MW.For Calendar Year 2009, EGSs sold a total of 391 GWh to retail customers in PECO’s serviceterritory or 1.0 percent of total consumption, down from 1.5 percent in 2008. On the summer peakday, EGSs represented a load of 80 MW, or 1.0 percent of the total.PECO has identified 13 transmission projects involving reconductoring of existing lines, with inservicedates through 2013.PECO has developed commercial and industrial rate incentive programs to encourage customers tomanage their energy demands and usage consistent with system capabilities. In 2009, PECOcontracted 409 MW of customer load for participation in its curtailment programs. Only 118 MWwas called upon for a one-hour PJM mandatory testing event yielding 118 MWh of energy savings.PECO’s Energy Efficiency & Conservation Plan 63 includes 10 energy efficiency programs andeight demand reduction programs which are estimated to exceed the reduction targets of 1,186GWh and 355 MW at a total cost of $341.6 million.PECO is a member of PJM and RFC.63 Docket No. M-2009-2093215.48<strong>Pennsylvania</strong> <strong>Public</strong> <strong>Utility</strong> <strong>Commission</strong>
Figure 42 PECO Energy Company energy demand (GWh)19,000Historic18,00017,00016,000ForecastsIndustrial15,00014,00013,000Residential12,00011,00010,0009,0008,000Commercial7,0006,0002000 2001 2002 2003 2004 2005 2006 2007 2008 2009 <strong>2010</strong> 2011 2012 2013 2014Figure 43 PECO Energy Company peak load (MW)9,700Historic9,5009,3009,1008,9008,7008,5008,3008,1007,9007,7007,5007,3007,100Forecasts20082009<strong>2010</strong>2000 2001 2002 2003 2004 2005 2006 2007 2008 2009 <strong>2010</strong> 2011 2012 2013 2014Electric Power Outlook for <strong>Pennsylvania</strong> 2009-2014 49
Figure 44 PECO Energy Company average of deviations in forecasts (%)10Peak Load8Commercial642Industrial0Residential-2-4-6-8-10-12-142000 2001 2002 2003 2004 2005 2006 2007Forecast Year50<strong>Pennsylvania</strong> <strong>Public</strong> <strong>Utility</strong> <strong>Commission</strong>
Allegheny Energy Inc.Allegheny Energy Inc. is a holding company with three regulated electric utility operatingcompanies, doing business as Allegheny Power, including West Penn Power Company(<strong>Pennsylvania</strong>), Monongahela Power Company (West Virginia) and The Potomac EdisonCompany (Maryland, Virginia and West Virginia), serving more than 1.5 million customers. Thecompany owns 9,730 MW of generating capacity, 95 percent of which is coal fired. See Figure 45.Figure 45 Allegheny Energy service territoryOn May 14, <strong>2010</strong>, FirstEnergy, West Penn Power Company and TrailCo filed a joint applicationwith the <strong>Commission</strong>, at Docket No. A-<strong>2010</strong>-2176520, to obtain approval for the merger ofAllegheny Energy, Inc. with a wholly-owned subsidiary of First Energy. The combined companywill retain the FirstEnergy name and be headquartered in Akron, Ohio. If approved, thetransaction, expected to be completed early in 2011, will result in an energy provider with $16billion in annual revenues, 10 regulated EDCs operating in seven states, 20,000 miles of highvoltagetransmission lines, 24,000 MW of generating capacity and more than 2,200 MW ofrenewable energy.West Penn Power CompanyWest Penn Power Company (West Penn), doingbusiness as Allegheny Power, a subsidiary ofAllegheny Energy Inc., provides service to 714,974electric utility customers in all or portions of 24counties in Western, North and South Central<strong>Pennsylvania</strong>. In 2009, West Penn had total retailenergy sales of 20,055 GWh—down 4.7 percentfrom 2008. Industrial sales continued to dominateWest Penn's market with 36.3 percent of the total sales, followed by residential (35.4 percent) andElectric Power Outlook for <strong>Pennsylvania</strong> 2009-2014 51
commercial (24.3 percent). Average annual use per residential customer was 11,446 kWh at anaverage cost of 8.37 cents per kWh; operating revenues totaled $1.37 billion.Between 1994 and 2009, West Penn's energy demand grew an average of 0.9 percent per year.Sales for all sectors have maintained relatively steady growth during the period, except for the lasttwo years. Residential sales grew at an annual rate of 1.1 percent and commercial sales grew at arate of 2.0 percent. Industrial sales declined at an average rate of 0.1 percent, due mainly to a 10.4percent drop in sales for 2009. The current five-year projection of growth in energy demand is 1.3percent. This includes a commercial rate of 1.7 percent and an industrial rate of 2.4 percent.Residential sales are expected to decline at an overall annual rate of 0.3 percent. See Figure 46.West Penn's 2009 summer peak load, occurring on Aug. 10, 2009, was 3,667 MW, representing adecrease of 4.1 percent from last year's summer peak of 3,823 MW. The 2009-10 winter peak loadwas 3,513 MW or 4.3 percent lower than the previous year's winter peak of 3,671 MW. The actualaverage annual peak load growth rate over the past 15 years was 1.0 percent. West Penn's loadforecast scenario shows the peak load increasing from 3,667 MW in the summer of 2009 to 3,951MW in 2014, or an average annual growth rate of 1.5 percent. The current forecast for <strong>2010</strong> is 202MW or 5.1 percent lower than the previous forecast. See Figure 47.Figure 48 depicts the average of deviations in forecasts made one to three years in advance. TablesA25-A28 in Appendix A provide West Penn’s forecasts of peak load and residential, commercialand industrial energy demand, filed with the <strong>Commission</strong> in years 2000 through <strong>2010</strong>.In April 2002, Allegheny Power joined PJM Interconnection. As a PJM member, AlleghenyPower is responsible for following the reliability standards of the PJM markets. The company hasaccess to an increased amount of energy resources within the expanded PJM market. West Pennremains an EDC, providing transmission and distribution service to its customers and providingPOLR service for those customers who do not choose an alternate supplier. Effective Nov. 18,1999, West Penn transferred all of its remaining generation assets to its affiliate, Allegheny EnergySupply Company, LLC.In 2009, West Penn purchased 987 GWh from cogeneration and independent power productionfacilities, or 4.7 percent of net energy for load. Contract capacity for these facilities was 136 MW.West Penn and its affiliate, TrAILCo, have identified several transmission line projects underconstruction or planned from <strong>2010</strong> through 2015 totaling 190 miles of 138 kV and 500 kV circuitsat an estimated cost of $140.8 million.West Penn’s Energy Efficiency & Conservation Plan 64 includes 22 energy efficiency and demandresponse programs which are estimated to meet or exceed the reduction targets of 628 GWh and157 MW at a total cost of $94.2 million.West Penn is a member of PJM and RFC.64 Docket No. M-2009-2093218.52<strong>Pennsylvania</strong> <strong>Public</strong> <strong>Utility</strong> <strong>Commission</strong>
Figure 46 West Penn Power Company energy demand (GWh)9,000Historic8,5008,000ForecastsIndustrial7,5007,0006,500Residential6,0005,500Commercial5,0004,5004,0002000 2001 2002 2003 2004 2005 2006 2007 2008 2009 <strong>2010</strong> 2011 2012 2013 2014Figure 47 West Penn Power Company peak load (MW)4,200Historic4,1004,0003,9003,800Forecasts2008 2009<strong>2010</strong>3,7003,6003,5003,4003,3003,2002000 2001 2002 2003 2004 2005 2006 2007 2008 2009 <strong>2010</strong> 2011 2012 2013 2014Electric Power Outlook for <strong>Pennsylvania</strong> 2009-2014 53
Figure 48 West Penn Power Company average of deviations in forecasts (%)108642IndustrialCommercialResidentialPeak Load0-2-4-6-82000 2001 2002 2003 2004 2005 2006 2007Forecast YearUGI Utilities Inc.—Electric DivisionThe Electric Division of UGI Utilities Inc. (UGI),a subsidiary of UGI Corporation, provides electricservice to 62,166 customers in NorthwesternLuzerne and Southern Wyoming counties in<strong>Pennsylvania</strong>. In 2009, UGI had energy salestotaling 955 GWh—down 4.7 percent from 2008.Residential sales continued to dominate UGI’smarket with 54.2 percent of the total sales,followed by commercial (34.4 percent) and industrial (10.8 percent). Average annual use perresidential customer was 9,470 kWh at an average cost of 13.87 cents per kWh; operating revenuestotaled $136.6 million.Between 1994 and 2009, UGI experienced an average growth in total sales of 0.7 percent, whichincludes a residential growth rate of 0.7 percent, a commercial rate of 0.7 percent and an industrialrate of 0.4 percent. Over the five-year planning horizon, UGI expects energy demand to increaseat an average rate of 0.7 percent. This includes an average annual increase in residential sales of0.8 percent, and an average growth rate of 2.1 percent in industrial sales, following a 16.3 percentdrop in 2009. Commercial sales are expected to increase after 2009 and then return to the 2009level by 2014. See Figure 49.54<strong>Pennsylvania</strong> <strong>Public</strong> <strong>Utility</strong> <strong>Commission</strong>
UGI is basically a winter peaking utility, although the summer peak has exceeded the winter peakin some years. Peak load on the UGI system occurred on Dec. 29, 2009, and totaled 193 MW, or2.0 percent below the 2008-09 winter peak load of 197 MW. The 2009 summer peak load of 181MW was 7.2 percent lower than the peak load experienced during the summer of 2008. The actualaverage annual peak load growth rate over the past 10 years was 0.4 percent. The five-yearforecast indicates an average increase in peak load of 1.4 percent. Peak load is projected toincrease from 193 MW in 2009-10 to 207 MW in 2014-15. See Figure 50.For Calendar Year 2009, there was one EGS serving 17 customers. UGI does not own electricgeneration supply and acquires supply for its customers through a series of competitivesolicitations. Default service supply for customers with peak loads in excess of 500 kW ispurchased in the spot market.One transmission line project is scheduled to be completed in 2011 at a cost of $3.5 million.UGI offered a Voluntary Load Reduction Program to commercial and industrial customers in2009, and three customers enrolled. However, since no load reduction events were called, theprogram has been discontinued, in favor of PJM’s economic and emergency demand responseprograms. If called upon, the 13 participating customers can provide six MW in total demandresponse reduction.UGI is a member of PJM.Figure 49 UGI Utilities Inc. energy demand (GWh)650Historic600550ForecastsResidential500450400350Commercial300250200150100Industrial502000 2001 2002 2003 2004 2005 2006 2007 2008 2009 <strong>2010</strong> 2011 2012 2013 2014Electric Power Outlook for <strong>Pennsylvania</strong> 2009-2014 55
Figure 50 UGI Utilities Inc. peak load (MW)220HistoricForecast21521020520020082009<strong>2010</strong>1951901851802000 2001 2002 2003 2004 2005 2006 2007 2008 2009 <strong>2010</strong> 2011 2012 2013 2014Citizens’ Electric CompanyCitizens’ Electric Company (Citizens’) providesservice to 6,814 customers in Union County,<strong>Pennsylvania</strong>. In 2009, Citizens’ had retailenergy sales totaling 160 GWh, down 4.8 percentfrom 2008. Residential sales accounted for 49.8percent of Citizens’ total sales, followed byindustrial (32.6 percent) and commercial (17.2percent). Average annual use per residentialcustomer was 14,062 kWh at an average cost of11.45 cents per kWh; operating revenues totaled $18.7 million.Between 1994 and 2009, Citizens’ experienced a sales growth that has averaged 0.3 percentannually, due in part to a 4.8 percent drop in 2009. Residential and commercial sales haveincreased at annual rates of 1.0 percent and 2.7 percent, respectively. Industrial sales decreased atan average annual rate of 1.2 percent. Over the next five years, Citizens’ expects total energydemand growth to average 0.7 percent, following a slight decrease in <strong>2010</strong>. Growth rates are thesame (0.7 percent) for all three sectors. See Figure 51.Citizens’ 2009-10 winter peak load, occurring on Jan. 11, <strong>2010</strong>, was 38.7 MW, a 4.6 percentdecrease from the winter peak of 2008. The 2009 summer peak load was 34.4 MW. Peak load56<strong>Pennsylvania</strong> <strong>Public</strong> <strong>Utility</strong> <strong>Commission</strong>
growth is projected to average 5.2 percent over the next five years, with peak load going from 38.7MW to 49.9 MW in the winter of 2014-15.One of Citizens’ largest customers, Bucknell University, generated 39 GWh of which Citizens’purchased three GWh, which represents 2.0 percent of Citizens’ net energy for load.The extent of the company’s resource planning is to assure sufficient line and substation capacityto accommodate, in a reliable and economical manner, present requirements and future growth.Citizens’ is a small distribution company and does not own any generation facilities.Figure 51 Citizens' Electric Company energy demand (GWh)10090HistoricForecasts8070Residential605040Industrial3020Commercial1002000 2001 2002 2003 2004 2005 2006 2007 2008 2009 <strong>2010</strong> 2011 2012 2013 2014Pike County Light & Power CompanyPike County Light & Power Company (Pike),a subsidiary of Orange & Rockland UtilitiesInc. (O&R), provides service to 4,649customers in Eastern Pike County,Northeastern <strong>Pennsylvania</strong>. In 2009, Pike’sretail energy sales totaled 73 GWh, adecrease of 5.3 percent from 2008 sales.Commercial sales continued to dominatePike’s market with 61.1 percent of the totalElectric Power Outlook for <strong>Pennsylvania</strong> 2009-2014 57
sales, followed by residential with 38.4 percent. Pike has no industrial customers. Average annualuse per residential customer was 7,605 kWh at an average cost of 7.29 cents per kWh; operatingrevenues totaled $4.9 million.Between 1994 and 2009, Pike experienced an average increase of 2.2 percent in total sales.Residential sales grew at an average annual rate of 1.7 percent, and commercial sales increase at2.6 percent per year. Over the next five years, total energy demand is projected to increase at anaverage annual rate of 1.3 percent, which includes a residential growth rate of 1.5 percent and acommercial growth rate of 1.1 percent. See Figure 52.Over the next five years, Pike projects its system peak load to increase from 15.3 MW in thesummer of 2009 to 20.7 MW in 2014, or an average annual increase of 6.2 percent.For the purpose of regulation, Pike is a small distribution company with no generating capability.O&R does not own any generating facilities.O&R is a member of the Northeast Power Coordinating Council (NPCC).Figure 52 Pike County Light & Power energy demand (GWh)55HistoricForecasts5045Commercial403530Residential25202000 2001 2002 2003 2004 2005 2006 2007 2008 2009 <strong>2010</strong> 2011 2012 2013 201458<strong>Pennsylvania</strong> <strong>Public</strong> <strong>Utility</strong> <strong>Commission</strong>
Wellsboro Electric CompanyWellsboro Electric Company (Wellsboro)provides electric service to 6,133 customersin Tioga County, <strong>Pennsylvania</strong>. In 2009,Wellsboro’s energy sales totaled 105 GWh,down 4.8 percent from 2008. Residentialsales dominated Wellsboro’s market with38.2 percent of the total sales, followed byindustrial at 31.9 percent, and commercial at29.5 percent. Average annual use perresidential customer was 8,058 kWh at an average cost of 13.16 cents per kWh; operating revenuestotaled $13.0 million.Over the past 15 years, Wellsboro has experienced an average annual sales growth of 0.8 percent,peaking in 2005 at 121 GWh. Industrial sector sales have declined substantially, at an averageannual rate of 0.7 percent over the same period; industrial sales in 2009 were 61.5 percent of thepeak 2002 sales level. Residential and commercial sales increased at an average annual rate of 1.4percent and 2.1 percent, respectively. Over the next five years, Wellsboro expects total energyconsumption to grow at an average annual rate of 0.6 percent. This includes a residential growthrate of 0.7 percent, a commercial rate of 0.8 percent, and an industrial rate of 0.4 percent. SeeFigure 53.Wellsboro’s summer peak load is projected to grow from 21.4 MW in 2009 to 23 MW by the year2014, or a levelized annual growth rate of 1.5 percent.Wellsboro is a small distribution company and does not own any generation facilities. Wellsborohas no shopping customers.Wellsboro provides a detailed analysis of consumption patterns and load factors for its customers,and explains how energy usage affects the overall bill. In 2009, Wellsboro investigated strayvoltage complaints, and conducted residential and commercial energy audits and billing analyses.Electric Power Outlook for <strong>Pennsylvania</strong> 2009-2014 59
Figure 53 Wellsboro Electric Company energy demand (GWh)60HistoricForecasts555045Residential4035Industrial30Commercial25202000 2001 2002 2003 2004 2005 2006 2007 2008 2009 <strong>2010</strong> 2011 2012 2013 201460<strong>Pennsylvania</strong> <strong>Public</strong> <strong>Utility</strong> <strong>Commission</strong>
Section 3 – Regional ReliabilityRegional Reliability AssessmentsThe passage of the <strong>Pennsylvania</strong> Electricity Generation Customer Choice and Competition Actsubstantially changed the <strong>Commission</strong>'s jurisdiction as well as the <strong>Commission</strong>’s ability to compiledata from the generation sector. As a result, most information on generation and transmissioncapacity is regional. Therefore, this section summarizes the regional reliability assessments ofNERC, RFC and PJM for generation and transmission capability.The reliability of the interconnected bulk power system is defined in terms of two basic andfunctional aspects. Adequacy is the ability of the bulk power system to supply the aggregateelectrical demand and energy requirements of the customer at all times, taking into accountscheduled and reasonably expected unscheduled outages of system elements. OperatingReliability is the ability of the bulk power system to withstand sudden disturbances such as electricshort circuits or unanticipated loss of system elements from credible contingencies. Adequacy canbe expressed in terms of either reserve margin or capacity margin. Reserve margin is thedifference between available resources and net internal demand (total demand less dispatchable,controllable capacity demand response), expressed as a percentage of net internal demand.Capacity margin is the difference between available resources and net internal demand, expressedas a percentage of available resources.North American Electric Reliability CorporationThe North American Electric Reliability Corporation’s (NERC’s) mission is to ensure thereliability of the bulk power system in North America. To achieve this objective, NERC developsand enforces reliability standards; monitors the bulk power system; assesses and reports on futuretransmission and generation adequacy; and offers education and certification programs to industrypersonnel. NERC is a non-profit, self-regulatory organization that relies on the diverse andcollective expertise of industry participants that comprise its various committees and sub-groups. Itis subject to oversight by governmental authorities in Canada and the United States. NERCassesses and reports on the reliability and adequacy of the North American bulk power systemaccording to eight regional areas. The users, owners, and operators ofthe bulk power system within these areas account for virtually all theelectricity supplied in the United States, Canada, and a portion of BajaCalifornia Norte, Mexico.Reliability Assessment65 NERC, 2009 Long-Term Reliability Assessment, October 2009.The 2009 Long-Term Reliability Assessment 65 represents NERC’sindependent judgment of the reliability and adequacy of the bulkpower system in North America for the coming 10 years. NERC’sprimary purpose in preparing this assessment is to identify areas ofconcern regarding the reliability of the North American bulk powerElectric Power Outlook for <strong>Pennsylvania</strong> 2009-2014 61
system and to make recommendations for their remedy. Highlights of this recent assessment aresummarized below (pages 1-6, emphasis added):• Reduced economic activity and higher adoption of demand side management programshave led to decreased projected peak demand for electricity and, as a result, higherreserve margins throughout North America for much of the 10-year period. The increasein demand side management contributes to 20 percent of the total reduction in summerpeak demand for the 2017 forecast when compared to last year’s forecast, whileeconomic recession effects contribute 80 percent.• Over the next 10 years, 260,000 MW of new renewable nameplate capacity (biomass,geothermal, hydro, solar and wind) is projected, 96 percent of which is wind (229,000MW) and solar (20,000 MW). Wind power is projected to account for 18 percent of thetotal resource mix by 2018, but accounts for only 3 percent (or 38,000 MW) of the peakresource mix. Industry, policymakers and regulators have significant work ahead ofthem to ensure that sufficient transmission is sited and built to enable the integrationof projected renewable resources.• By 2011, natural gas is projected to overtake coal as the dominant fuel source for peakcapacity generation in North America. By 2018, natural gas is projected to account for32 percent of the on-peak resource mix. The projected growing reliance on natural gasincreases the potential for adverse reliability impacts due to fuel supply and storageand delivery infrastructure adequacy issues.• More than 11,000 miles, or 35 percent, of transmission (200 kV and above) proposed andprojected in this report must be developed on time to ensure reliability over the next fiveyears. Ranked as the No. 1 emerging issue in terms of likelihood and consequence,transmission siting remains a significant obstacle to meeting this goal. State andprovincial siting and permitting processes must be expedited to allow for thedevelopment of needed resources and ensure reliability.• Over the coming 10 years, the North American electric industry will face a number ofsignificant emerging reliability issues. The confluence of these issues will drive atransformational change for the industry, potentially resulting in a dramatically differentresource mix, a new global market for emissions trading, a new model for customerinteraction with their utility, and a new risk framework built to address growing cybersecurity concerns.NERC has also identified five emerging issues which could have a significant impact on reliability(pages 51-66):• Economic Recession. The economic recession has had an indelible impact on theelectric power industry. While there is currently substantial uncertainty on the time, rateand breadth of an economic recovery in the coming years, it is certain that its eventualarrival may present risks and challenges to the bulk power system on several levels: (1)the recession has caused significant impacts in demand forecasts; (2) economicdifficulties that drive new business opportunities and incent new resource programs maydrive steep increases in these programs (and accompanying reliance upon them) butvigilance will be required to ensure they are available when needed for reliability; (3) aneconomic recovery will occur (eventually), but it is uncertain when it will happen and62<strong>Pennsylvania</strong> <strong>Public</strong> <strong>Utility</strong> <strong>Commission</strong>
how fast it will occur—if the economy recovers quickly, the bulk power system must beready to balance supply and demand while maintaining bulk power system reliability;(4) project financing uncertainty—in addition to reduced revenues—may thwartnecessary infrastructure investments and impair long-term reliability.• Transmission Siting. Province and State Renewable Portfolio Standards (RPS) willincrease renewable resources located where wind power densities and solar developmentare favorable. Grid expansion is needed to support the dispersed nature of renewableresources. The limited timeframe provided to meet RPS mandates requires that thecurrent siting and approval processes be expedited to ensure meeting mandated energyrequirements. The inability to site and construct transmission can challenge bulk powersystem reliability in regions/subregions that are retiring generation or out-growing theirexisting generation, and are relying on new transmission to serve customers from remotegenerating resources.• Energy Storage. Energy storage systems can benefit bulk power system reliability bystoring energy capacity or to provide ancillary services. The introduction of significantamounts of variable generation resources, like wind and solar, can provide largeamounts of energy, while not necessarily at the time it is most needed. Further, thevariability and uncertainty of their fuel source (wind or sun), increases the need for moreflexibility in the bulk power system to maintain reliability.• Workforce Issues. Forty percent of senior electrical engineers and shift supervisors inthe electricity industry would be eligible to retire in 2009, while the demand forengineers with a power background and other utility professionals has increased. At thesame time, the number of students in the power engineering programs is dwindling inmost universities. Further, the need for line workers, power plant operators,maintenance/repair workers, and pipefitters/pipelayers has also increased. The demandfor power workers to plan, maintain and operate the bulk power system continued toincrease with the growing need for new infrastructure investments in electric generation,delivery and the rising need for technology innovation driven by a world beset by newchallenges.• Cyber Security. With the new era of ever-increasing digital reliance and systemcomplexity, there is an emergence of common vulnerabilities within the computationalbackbone of the power system that can result in credible, large-scale contingencies, dueto common modal failures or coordinated cyber attacks. This may significantly challengethe ability to rebalance the system. More understanding of the cyber security issues andimpacts that are possible on the electric grid is needed.In addition to these areas of concern, NERC has identified, in a separate 2008 report, someconcerns regarding potential impacts of climate change initiatives on system reliability. 66 Theseinclude the following issues (page 4):• Broad-scale fuel switching from coal to natural gas and increased dependence on naturalgas as a fuel for electric generation may impact reliability.66 NERC, Special <strong>Report</strong>: Electric Industry Concerns on the Reliability Impacts of Climate Change Initiatives,November 2008.Electric Power Outlook for <strong>Pennsylvania</strong> 2009-2014 63
• Innovative resource planning and implementation mechanisms are needed to ensure thetimely development, siting, construction, and operation of necessary and appropriatetransmission infrastructure to facilitate achieving the goals and objectives of the variousclimate change initiatives.• As demand side resources become an increasingly significant component of the resourcemix, effective integration and verification of these resources will be vital to maintainingreliability.Reserve margins in many NERC regions have increased compared to 2008 projections due inlarge part to the economic recession, which has reduced demand projections. An increase indemand side management programs and the addition of new resources have also contributed tothis trend. Demand is projected to grow within the next three years as the economy recovers.Demand is projected to increase 14.8 percent between 2009 and 2018, compared to 16.8 percentbetween 2008 and 2017, as forecast in last year’s report. The projected compound annualgrowth rate over the 10-year period for peak demand has decreased from 1.6 percent in 2008projections to 1.5 percent in 2009 projections. This projected growth rate reflects a continueddecline from previous forecast periods and parallels a decline in the growth in projected energyuse over similar forecast periods.Net internal demand in the United States is expected to increase by 111,799 MW or an average of1.6 percent per year for the next nine years, while deliverable capacity resources (existing-certain,resources, future-planned resources, and net firm and expected transactions) are projected toincrease by 78,380 MW or 8.4 percent (0.9 percent annually). Reserve margins are expected todecline from 24.1 percent in summer 2009 to 17.4 percent in 2018.If a region/subregion provides its own specific margin level based on load, generation andtransmission characteristics, as well as regulatory requirements, that level is adopted as theNERC Reference Reserve Margin Level. If not, NERC assigns a 15 percent reserve margin forpredominately thermal systems and 10 percent for predominately hydro systems. The NERCReference Reserve Margin Level of 15 percent is used in the United States to identify whenadditional resources may be needed. The existing capacity sufficiently meets the NERCReference Reserve Margin Level through 2018.64<strong>Pennsylvania</strong> <strong>Public</strong> <strong>Utility</strong> <strong>Commission</strong>
ReliabilityFirst CorporationReliabilityFirst Corporation (RFC) is one of eightregional reliability councils within NERC, and hasreplaced the reliability oversight functions ofMAAC, ECAR and MAIN. The two main controlareas within the RFC footprint are the PJM RTOand MISO. Two-thirds of the RFC load is in PJM.From the perspective of the RTOs, 60 percent of theMISO load and 85 percent of the PJM load is withinRFC. The reliability of these two RTOs determinesthe reliability of the RFC region. The reliabilityassessment summarized herein reflects the resourceadequacy of each RTO based on their individual reserve margin requirements. 67Compliance StandardsAnalyses were conducted by PJM and MISO to determine the reserve margins that were equivalentto the RFC Loss of Load Expectation (LOLE) criterion of not exceeding one occurrence in 10years (0.1 day/year) on an annual basis for their planning area. RFC’s assessment of long-termPJM resource adequacy is based on the reserve margin target determined from the PJM ReliabilityPricing Model analysis for the planning year 2009-10. This reserve margin target is 15.0 percentfor 2009, 15.5 percent for <strong>2010</strong> and 2011, and 16.2 percent thereafter. The 2009 PJM ReserveRequirement Study, however, recommends a 15.3 percent margin beyond 2012. 68 The MISOreserve margin target for 2009 was 15.4 percent, and is used to assess each of the next 10 years.The reserve margin targets are used as a general indicator of the overall adequacy of resources inthe RFC region. 69Reliability AssessmentRFC anticipates that sufficient resources will be available for PJM, MISO and the RFC regionalarea to have adequate reserves throughout the next 10 years. Summer reserve margins range froma high of 27.2 percent in 2009, declining to 18.2 percent in 2018. This assessment assumes thatfuture planned and a portion of conceptual capacity is deliverable. Based only on existingresources, the reserve margins are projected to decline from 26.9 percent in 2009, to 11.7 percentin 2018, which is an improvement over the previous forecast, due mainly to current economicconditions. See Figure 54.67 NERC, 2009 Long-Term Reliability Assessment, October 2009.68 PJM, 2009 PJM Reserve Requirement Study, Nov. 4, 2009.69 RFC, Long Term Resource Assessment 2009-2018, October 2009.Electric Power Outlook for <strong>Pennsylvania</strong> 2009-2014 65
Figure 54 RFC 2009-2018 reserve margin comparison (%)3025Net Capacity ResourcesExisting & Planned ResourcesExisting, Planned & Proposed ResourcesMISO Reserve Margin TargetPJM Reserve Margin Target2015102009 <strong>2010</strong> 2011 2012 2013 2014 2015 2016 2017 2018The system peak load of the PJM RTO for summer 2009, occurring on Aug. 10, 2009, was126,805 MW or 2.5 percent less than the 2008 peak load. This is the lowest annual peak load sincethe last transmission system integration. The weather normalized peak load was 133,780 MW.The all-time metered peak load was 144,644 MW, occurring on Aug. 2, 2006.For summer 2018, the net internal demand is projected to be 149,800 MW, or an equivalentcompound growth rate of 1.9 percent. PJM installed generating capacity totaled 167,326 MW atthe end of 2009, a 1.5 percent increase from December 2008, which was dominated by coal (40.7percent) and gas 70 (29.2 percent). A 2009 generation of 693,278 GWh included 50.5 percent coaland 36.0 percent nuclear. See Figures 55 and 56. 7170 Gas includes natural gas, landfill gas and biomass gas.71 2009 State of the Market <strong>Report</strong> for PJM, Vol. 1, March 11, <strong>2010</strong>.66<strong>Pennsylvania</strong> <strong>Public</strong> <strong>Utility</strong> <strong>Commission</strong>
Figure 55 PJM 2009 installed capacity by fuel typeNuclear18.4%Solid Waste0.4%Hydro4.7%Wind0.2%Coal40.7%Gas29.2%Oil6.4%Figure 56 PJM 2009 generation by fuel typeSolid Waste0.8%Hydro2.0%Wind0.8%Nuclear36.0%Coal50.5%Gas9.7%Oil0.2%At the time of PJM’s 2009 summer peak load, the actual reserve margin for existing capacityresources was 39,981 MW, or 31.5 percent. With an additional 4,475 MW of planned newcapacity, the reserve margins are expected to meet the PJM percent reserve margin target through2016. If an additional 7,951 MW (18.4 percent) of conceptual seasonal capacity is included, thereserve margin remains adequate beyond the forecast period.The MISO net internal peak demand for summer 2009 is projected to be 100,100 MW. Forsummer 2018, the net internal demand is projected to be 109,400 MW, or an equivalent compoundgrowth rate of 1.0 percent. The MISO market has 121,769 MW of net capacity resources for the2009 summer. The amount of proposed increase in capability for summer 2018, including 19.1percent of conceptual seasonal capacity, is 4,542 MW.Electric Power Outlook for <strong>Pennsylvania</strong> 2009-2014 67
The MISO reserve margin for existing capacity resources is 21,669 MW for 2009, which is 21.6percent, based on net internal demand. With an additional 424 MW of planned new capacity, thereserve margins are expected to meet the 15.4 percent target through 2014. If the likely portion ofproposed capacity additions is included, the reserve margin target is expected to be maintainedthrough 2018.Uncertain resources are not included when determining the reserve margin. Uncertain resourcesare the existing generation that represents wind/variable resource deratings, generating capacitythat has not been studied for delivery within the RTOs, and capacity located within the region thatis not part of PJM or MISO committed capacity. Conceptual capacity represents less certain futurecapacity additions and only a portion of the capacity is included when determining the expectedreserve margins.The amount of available wind power capability included in the reserve calculations is less than thenameplate rating of the wind resources. PJM has recently changed the default wind capabilityfrom 20 percent to 13 percent for new queue projects. MISO permits wind power providers todeclare up to 20 percent of nameplate capability as a capacity resource.The fuel mix of generating units in the RFC region is 15.0 percent nuclear, 3.0 percentconventional and pumped storage hydro, 47.0 percent coal, 6.0 percent oil, 28.0 percent gas, and1.0 percent wind and other. Since there currently are no adverse conditions affecting the resourceswithin the RFC region, the RFC assessment assumes that any future adverse weather or fuel supplyissues would be temporary in duration and limited in impact on resource availability, and will notaffect the long-term assessment.Within the PJM footprint, the capacity mix is likely to shift to more natural gas-fired combinedcycle and combustion turbine capacity. Continued reliance on steam (mainly coal) appears likely,although potential changes in environmental regulations may have an impact on coal unitsthroughout the footprint.Over the next seven years, there are plans within the RFC region for the addition of more than1,700 miles of high-voltage transmission lines (100 kV and above), and numerous new substationsand transformers expected to enhance and strengthen the bulk transmission system. PJM’s RTEPhas identified four major “backbone” projects, two of which were mentioned earlier.The Trans-Allegheny Interstate Line, scheduled for operation in 2011, consists of a new 500 kVcircuit from 502 Junction to Mt. Storm to Meadow Brook to Loudon. This project will relieveanticipated overloads and voltage problems in the Washington, D.C., area, including anticipatedoverloads expected in 2011 on the existing 500 kV network.The planned 130-mile, 500 kV circuit from Susquehanna to Lackawanna to Roseland will tie intothe existing 500 kV network and, with the addition of 500/230 kV transformers, will create astrong link from generation sources in Northeastern and North Central <strong>Pennsylvania</strong> into NewJersey. These facilities are expected to be in service by June 2012.68<strong>Pennsylvania</strong> <strong>Public</strong> <strong>Utility</strong> <strong>Commission</strong>
The Potomac-Appalachian Transmission Highline (PATH) transmission line consists of a 244-mileAmos to Bedington 765 kV line and a 92-mile, twin circuit 500 kV line from Bedington toKemptown. This project will reduce the west-to-east power flow on the existing PJM 500 kVtransmission paths and provide significant benefits to the constrained area of Washington andBaltimore. The Maryland <strong>Public</strong> Service <strong>Commission</strong> rejected the application of Alleghenyaffiliate, Potomac Edison Co., for a 20-mile segment of the line, and a new application has beenfiled. Also, the Virginia State Corporation <strong>Commission</strong> granted a motion of PATH AlleghenyVirginia Transmission Corp. to withdraw its application for a 31-mile segment. A new application,based on the <strong>2010</strong> RTEP analysis, is not expected before the third quarter of <strong>2010</strong>. The facilitieswere originally expected to be in service in 2012. Based on the findings of the latest analyses, PJMis directing that PATH be placed into service by June 1, 2015.The fourth “backbone” project is the Mid-Atlantic Power Pathway (MAPP), consisting of a new190-mile 500 kV line beginning at Possum Point, Virginia, and terminating at Salem, New Jersey.The transmission system is expected to perform well over a wide range of operating conditions,provided new facilities go into service as scheduled, and transmission operators take appropriateaction, as needed, to control power flows, reactive reserves, and voltages.Electric Power Outlook for <strong>Pennsylvania</strong> 2009-2014 69
<strong>Pennsylvania</strong>The <strong>Pennsylvania</strong> electric power outlook reflects the projections of RFC. Since transmission andgeneration are not regulated by this <strong>Commission</strong>, and since the bulk electric system is planned on aregional rather than a state basis, we must look to regional entities for data concerning the currentand future condition of the bulk electric system. While we can determine the aggregate load forthe state’s consumers, we do not know, with complete certainty, what generating facilities will beavailable to serve these consumers.Planning the enhancement and expansion of transmission capability on a regional basis is one ofthe primary functions of regional transmission organizations. PJM implements this functionpursuant to the Regional Transmission Expansion Planning Protocol set forth in Schedule 6 ofthe PJM Operating Agreement. A key part of this regional planning protocol is the evaluation ofboth generation interconnection and merchant transmission interconnection requests, theprocedures for which are codified under Part IV of the PJM Open Access Transmission Tariff.Although transmission planning is performed on a regional basis, most transmission additionsand upgrades in <strong>Pennsylvania</strong> are planned to support the local delivery system and newgenerating facilities. PJM’s service area in the state is shown in Figure 57. 72Figure 57 PJM service area in <strong>Pennsylvania</strong>72 PJM 2009 Regional Transmission Expansion Plan, Feb. 26, <strong>2010</strong>.70<strong>Pennsylvania</strong> <strong>Public</strong> <strong>Utility</strong> <strong>Commission</strong>
Load-serving entities (LSEs) acquire capacity resources by entering into bilateral agreements,participating in the PJM-operated capacity market, owning generation, and/or pursuing loadmanagement options. The PJM generator interconnection process ensures that new capacityresources satisfy LSE requirements to reliably meet their obligations.All new generation, which anticipates interconnecting and operating in parallel with the PJMtransmission grid and participating in the PJM capacity and/or energy markets, must submit aninterconnection request to PJM. These requests are placed in queues, or waiting lists, for theperformance of feasibility studies and other technical reviews.Proposed new generating plants and increased capacity of existing plants located in <strong>Pennsylvania</strong>total 20,688 MW through 2015. These facilities are either under study (active), underconstruction, partially in-service or in-service. Natural gas projects make up 61.5 percent ofqueued capacity. This additional capacity may be used to serve <strong>Pennsylvania</strong> customers or outof-statecustomers. See Figure 58. Appendix B provides the status of generator interconnectionrequests located in <strong>Pennsylvania</strong>.Figure 58 PJM queued generating capacity in <strong>Pennsylvania</strong> by fuel typeNatural Gas61.5%Coal5.4%Nuclear21.0%Solar0.8%Oil3.9%Hydro1.7%Other1.6%Biomass0.3%DieselWind 0.2%2.9%Methane0.7%The generating capacity located in <strong>Pennsylvania</strong> totals 46,568 MW. 73 As stated earlier, the outputof some of these facilities may serve loads outside of <strong>Pennsylvania</strong>. See Figure 59.The state’s 2009 aggregate non-coincident summer peak demand was 27,580 MW. In 2009,<strong>Pennsylvania</strong>’s net electric generation totaled 218,378 GWh, down 1.8 percent from 2008. Netgeneration from natural gas increased 55.7 percent from 2008. Pumped storage facilities used 56073 Electric Power Generation Association.Electric Power Outlook for <strong>Pennsylvania</strong> 2009-2014 71
GWh more than they generated. Figure 60 shows the generation distribution by fuel type. 74“Other” includes wind, solar and biomass sources. Appendix C lists the existing power plantslocated in <strong>Pennsylvania</strong>.Figure 59 Existing generating capacity in <strong>Pennsylvania</strong> by fuel typeOther1.3%Wind1.9%Oil8.7%Waste Coal3.1%Nuclear20.8%Coal36.2%Hydro4.9%Gas23.2%Figure 60 2009 generation in <strong>Pennsylvania</strong> by fuel typeOther, 1.8% Oil, 0.4%Nuclear, 35.1%Coal, 48.0%Hydro, 1.3%Gas, 13.6%74 U.S. DOE Energy Information Administration.72<strong>Pennsylvania</strong> <strong>Public</strong> <strong>Utility</strong> <strong>Commission</strong>
Section 4 - Conclusions<strong>Pennsylvania</strong> continues to benefit from a high level of electric service reliability.<strong>Pennsylvania</strong> outlook reflects the regional assessment of RFC.TheRFC reports that there is sufficient generation, transmission and distribution capacity in<strong>Pennsylvania</strong> to meet the needs of electric consumers for the foreseeable future. RFC anticipatesthat its reserve margin target will be satisfied through 2018, provided that proposed generationprojects will be completed in a timely manner and enhancements to the transmission network willbe capable of reliably delivering those resources. Summer reserve margins in RFC range from ahigh of 27.2 percent in 2009, declining to 18.2 percent in 2018. This assumes that 18.4 percent ofconceptual seasonal capability will become available during the last five years of the forecastperiod.The <strong>Commission</strong> continues to promote the development of alternative energy resources and pursuedemand side management, energy efficiency, and load management programs and technologies toaddress ways to encourage customers to reduce their demand. These efforts include theimplementation of the Alternative Energy Portfolio Standards and the Energy Efficiency andConservation Program. In the long term, these initiatives will improve overall energy efficiency,expand energy markets and maintain system reliability. Through demand side measures andoverall improvements in energy efficiency, EDCs and all customer classes will benefit.To summarize the relevant statistics in this report, aggregate <strong>Pennsylvania</strong> retail sales in 2009totaled 142,161 GWh, a 4.2 percent decrease from that of 2008. Residential sales accounted for35.4 percent of the total sales, followed by commercial (31.7 percent) and industrial (30.3 percent).Between 1994 and 2009, the state’s energy demand grew at an average annual rate of 1.0 percent.Residential sales grew at an annual rate of 1.5 percent and commercial sales increased at 2.1percent per year. Industrial sales declined at an annual rate of 0.4 percent, due mainly to a 9.4percent drop in sales from 2008. Average total sales growth from 2004 to 2009 was 0.1 percent.The current aggregate five-year projection of growth in energy demand is 1.4 percent. Thisincludes a residential growth rate of 0.9 percent, a commercial rate of 1.9 percent and an industrialrate of 1.6 percent.Over the past 15 years, the non-coincident peak load for the major EDCs increased at an averagerate of 0.7 percent per year. The peak load is expected to increase from 27,597 MW in 2009 to29,550 MW in 2014 at an average annual growth rate of 1.4 percent.* * * * *Electric Power Outlook for <strong>Pennsylvania</strong> 2009-2014 73
Susquehanna Steam Electric Station, Luzerne County, <strong>Pennsylvania</strong>74<strong>Pennsylvania</strong> <strong>Public</strong> <strong>Utility</strong> <strong>Commission</strong>
Appendix A – Data TablesThe following tables provide actual and projected peak load and residential, commercial andindustrial energy demand. Actual data covers years 2000 through 2009. Five-year projections arethose filed with the <strong>Commission</strong> in years 2000 through <strong>2010</strong>.Electric Power Outlook for <strong>Pennsylvania</strong> 2009-2014 75
Table A01 Duquesne Light CompanyTable A03 Duquesne Light CompanyActual and Projected Peak Load (MW)Actual and Projected Commercial Energy Demand (GWh)Projected Peak Load RequirmentsProjected Commercial Energy Demand(Year Forecast Was Filed)(Year Forecast Was Filed)Year Actual 2000 2001 2002 2003 2004 2005 2006 2007 2008 2009 <strong>2010</strong> Year Actual 2000 2001 2002 2003 2004 2005 2006 2007 2008 2009 <strong>2010</strong>2000 2673 2638 2000 6092 61132001 2771 2661 2661 2001 6170 6231 62312002 2886 2682 2682 2850 2002 6458 6336 6336 63242003 2686 2702 2702 2884 2822 2003 6346 6438 6438 6467 64362004 2646 2723 2723 2912 2841 2719 2004 6454 6540 6540 6570 6505 64282005 2884 2743 2934 2855 2740 2722 2005 6566 6628 6653 6570 6479 65682006 3053 2953 2870 2771 2765 2765 2006 6474 6729 6636 6597 6711 66932007 2890 2884 2801 2805 2805 3039 2007 6715 6703 6713 6870 6847 67842008 2822 2831 2835 2835 3086 2948 2008 6631 6841 6949 6991 6942 67312009 2732 2873 2873 3141 3007 2862 2009 6537 7076 7129 7127 6768 6648<strong>2010</strong> 2910 3194 3067 2836 2854 <strong>2010</strong> 7259 7302 6815 6627 64282011 3242 3128 2857 2863 2011 7457 6878 6583 65012012 3191 2850 2860 2012 6952 6533 65852013 2890 2917 2013 6527 66662014 2960 2014 6742Table A02 Duquesne Light CompanyTable A04 Duquesne Light CompanyActual and Projected Residential Energy Demand (GWh)Actual and Projected Industrial Energy Demand (GWh)Projected Residential Energy DemandProjected Industrial Energy Demand(Year Forecast Was Filed)(Year Forecast Was Filed)Year Actual 2000 2001 2002 2003 2004 2005 2006 2007 2008 2009 <strong>2010</strong> Year Actual 2000 2001 2002 2003 2004 2005 2006 2007 2008 2009 <strong>2010</strong>2000 3509 3610 2000 3581 35372001 3584 3643 3643 2001 3283 3576 35762002 3924 3681 3681 3671 2002 3328 3615 3615 33152003 3759 3716 3716 3726 3697 2003 3189 3651 3651 3382 33492004 3886 3759 3759 3772 3721 3811 2004 3229 3695 3695 3445 3415 30312005 4134 3780 3810 3744 3832 3941 2005 3128 3742 3491 3437 2990 33472006 3991 3846 3767 3879 4018 3984 2006 3182 3530 3453 3033 3407 32292007 4211 3791 3925 4088 4054 4141 2007 3145 3471 3075 3458 3299 32712008 4060 3978 4125 4118 4214 4216 2008 3079 3123 3501 3359 3315 30982009 3946 4198 4181 4293 4293 4177 2009 2616 3542 3411 3369 3102 3002<strong>2010</strong> 4243 4372 4371 4188 4117 <strong>2010</strong> 3464 3420 3084 2933 24402011 4453 4444 4181 4184 2011 3467 3140 2851 24072012 4527 4171 4267 2012 3141 2777 23952013 4197 4352 2013 2726 23852014 4448 2014 235976<strong>Pennsylvania</strong> <strong>Public</strong> <strong>Utility</strong> <strong>Commission</strong>
Table A05 Metropolitan Edison CompanyTable A07 Metropolitan Edison CompanyActual and Projected Peak Load (MW)Actual and Projected Commercial Energy Demand (GWh)Projected Peak Load RequirementsProjected Commercial Energy Demand(Year Forecast Was Filed)(Year Forecast Was Filed)Year Actual 2000 2001 2002 2003 2004 2005 2006 2007 2008 2009 <strong>2010</strong> Year Actual 2000 2001 2002 2003 2004 2005 2006 2007 2008 2009 <strong>2010</strong>2000 2274 2404 2000 3699 35182001 2486 2456 2455 2001 3855 3622 37512002 2616 2508 2504 2503 2002 3985 3732 3860 39762003 2438 2559 2553 2554 2527 2003 4018 3837 3970 4096 40572004 2468 2612 2602 2611 2584 2570 2004 4251 3947 4079 4216 4144 41702005 2752 2652 2668 2639 2634 2625 2005 4491 4189 4336 4258 4281 43102006 2884 2725 2691 2702 2689 2689 2006 4509 4456 4363 4388 4400 44622007 2825 2747 2756 2740 2740 2740 2007 4715 4464 4498 4506 4547 46642008 3045 2817 2801 2801 2801 2801 2008 4777 4601 4616 4668 4818 48182009 2739 2857 2856 2857 2857 2829 2009 4568 4721 4788 4969 4969 4853<strong>2010</strong> 2915 2915 2915 2932 2687 <strong>2010</strong> 4908 5108 5108 5020 46712011 2972 2972 3017 2640 2011 5244 5244 5152 47062012 3032 3085 2630 2012 5375 5291 47832013 3158 2668 2013 5421 48872014 2731 2014 4963Table A06 Metropolitan Edison CompanyTable A08 Metropolitan Edison CompanyActual and Projected Residential Energy Demand (GWh)Actual and Projected Industrial Energy Demand (GWh)Projected Residential Energy DemandProjected Industrial Energy Demand(Year Forecast Was Filed)(Year Forecast Was Filed)Year Actual 2000 2001 2002 2003 2004 2005 2006 2007 2008 2009 <strong>2010</strong> Year Actual 2000 2001 2002 2003 2004 2005 2006 2007 2008 2009 <strong>2010</strong>2000 4377 4344 2000 4412 43132001 4496 4430 4430 2001 4186 4352 43122002 4721 4516 4501 4607 2002 4012 4410 4409 42632003 4895 4602 4577 4708 4846 2003 3986 4459 4490 4341 39542004 5071 4687 4651 4804 4860 4885 2004 4042 4508 4567 4419 3989 40802005 5399 4724 4892 4980 4977 5097 2005 4083 4645 4498 4010 4136 40772006 5287 4988 5094 5083 5176 5325 2006 4008 4577 4030 4162 4119 41762007 5595 5211 5190 5276 5390 5516 2007 3992 4050 4206 4145 4155 41232008 5598 5300 5376 5515 5699 5699 2008 3831 4237 4175 4177 4156 41562009 5448 5472 5640 5872 5872 5771 2009 3439 4195 4200 4181 4181 3620<strong>2010</strong> 5764 6037 6037 5836 5587 <strong>2010</strong> 4221 4193 4193 3842 35382011 6187 6187 5969 5552 2011 4201 4201 4035 34972012 6341 6109 5577 2012 4209 4047 35282013 6232 5682 2013 4048 37312014 5799 2014 4021Electric Power Outlook for <strong>Pennsylvania</strong> 2009-2014 77
Table A09 <strong>Pennsylvania</strong> Electric CompanyTable A11 <strong>Pennsylvania</strong> Electric CompanyActual and Projected Peak Load (MW)Actual and Projected Commercial Energy Demand (GWh)Projected Peak Load RequirementsProjected Commercial Energy Demand(Year Forecast Was Filed)(Year Forecast Was Filed)Year Actual 2000 2001 2002 2003 2004 2005 2006 2007 2008 2009 <strong>2010</strong> Year Actual 2000 2001 2002 2003 2004 2005 2006 2007 2008 2009 <strong>2010</strong>2000 2569 2651 2000 4509 43872001 2337 2675 2321 2001 4538 4473 44722002 2693 2700 2347 2337 2002 4697 4558 4549 46132003 2308 2737 2373 2375 2410 2003 4727 4643 4626 4730 47822004 2425 2760 2399 2405 2456 2438 2004 4792 4728 4704 4846 4874 48252005 2531 2425 2437 2505 2481 2511 2005 5010 4781 4962 4976 4912 49282006 2696 2465 2544 2525 2554 2554 2006 4961 5078 5076 4986 4990 50492007 2524 2592 2565 2598 2598 2598 2007 5139 5178 5060 5064 5099 50452008 2880 2604 2637 2637 2637 2637 2008 5186 5136 5140 5188 5122 51222009 2451 2674 2674 2674 2674 2603 2009 5019 5213 5277 5199 5199 5159<strong>2010</strong> 2711 2711 2711 2630 2465 <strong>2010</strong> 5367 5277 5277 5213 51962011 2750 2750 2661 2452 2011 5356 5356 5265 52152012 2789 2688 2458 2012 5436 5320 52572013 2715 2496 2013 5364 53432014 2531 2014 5424Table A10 <strong>Pennsylvania</strong> Electric CompanyTable A12 <strong>Pennsylvania</strong> Electric CompanyActual and Projected Residential Energy Demand (GWh)Actual and Projected Industrial Energy Demand (GWh)Projected Residential Energy DemandProjected Industrial Energy Demand(Year Forecast Was Filed)(Year Forecast Was Filed)Year Actual 2000 2001 2002 2003 2004 2005 2006 2007 2008 2009 <strong>2010</strong> Year Actual 2000 2001 2002 2003 2004 2005 2006 2007 2008 2009 <strong>2010</strong>2000 3949 3881 2000 4698 50042001 3991 3915 3977 2001 4392 5093 48572002 4167 3951 4021 4043 2002 4315 5177 5144 46702003 4187 3984 4065 4089 4194 2003 4391 5239 5214 4783 44922004 4249 4017 4109 4134 4162 4135 2004 4589 5306 5244 4846 4708 45612005 4457 4154 4180 4203 4186 4295 2005 4729 5274 4887 4749 4666 45272006 4381 4226 4245 4236 4333 4420 2006 4678 4928 4797 4737 4612 48072007 4497 4287 4287 4385 4438 4469 2007 4610 4845 4791 4679 4828 48092008 4558 4339 4438 4496 4533 4533 2008 4594 4815 4708 4881 4881 48812009 4471 4524 4554 4598 4598 4611 2009 4044 4725 4905 4954 4954 4203<strong>2010</strong> 4614 4662 4662 4614 4569 <strong>2010</strong> 4930 4983 4983 4538 41262011 4727 4727 4662 4489 2011 5013 5013 4859 42222012 4793 4721 4443 2012 5043 4889 43702013 4776 4442 2013 4922 46072014 4486 2014 467478<strong>Pennsylvania</strong> <strong>Public</strong> <strong>Utility</strong> <strong>Commission</strong>
Table A13 <strong>Pennsylvania</strong> Power CompanyTable A15 <strong>Pennsylvania</strong> Power CompanyActual and Projected Peak Load (MW)Actual and Projected Commercial Energy Demand (GWh)Projected Peak Load RequirementsProjected Commercial Energy Demand(Year Forecast Was Filed)(Year Forecast Was Filed)Year Actual 2000 2001 2002 2003 2004 2005 2006 2007 2008 2009 <strong>2010</strong> Year Actual 2000 2001 2002 2003 2004 2005 2006 2007 2008 2009 <strong>2010</strong>2000 885 935 2000 1164 12042001 1011 957 883 2001 1220 1242 11622002 869 980 904 918 2002 1268 1284 1206 12702003 855 1003 930 947 891 2003 1291 1327 1251 1327 12792004 898 1025 956 983 923 865 2004 1296 1372 1293 1387 1310 13092005 1021 982 1022 958 884 952 2005 1367 1335 1449 1342 1339 13532006 984 1058 985 900 921 904 2006 1359 1514 1373 1370 1374 13842007 1042 1020 916 930 930 921 2007 1414 1405 1402 1400 1422 13942008 1063 929 938 938 936 936 2008 1404 1429 1427 1460 1427 14272009 901 951 951 951 951 984 2009 1367 1453 1498 1461 1461 1401<strong>2010</strong> 965 965 965 941 896 <strong>2010</strong> 1535 1496 1496 1394 14282011 980 980 963 890 2011 1532 1532 1424 14082012 994 981 899 2012 1569 1491 14492013 995 930 2013 1535 15002014 977 2014 1535Table A14 <strong>Pennsylvania</strong> Power CompanyTable A16 <strong>Pennsylvania</strong> Power CompanyActual and Projected Residential Energy Demand (GWh)Actual and Projected Industrial Energy Demand (GWh)Projected Residential Energy DemandProjected Industrial Energy Demand(Year Forecast Was Filed)(Year Forecast Was Filed)Year Actual 2000 2001 2002 2003 2004 2005 2006 2007 2008 2009 <strong>2010</strong> Year Actual 2000 2001 2002 2003 2004 2005 2006 2007 2008 2009 <strong>2010</strong>2000 1341 1390 2000 1643 15632001 1391 1412 1360 2001 1539 1596 16182002 1533 1434 1395 1447 2002 1505 1635 1644 15142003 1513 1457 1430 1483 1512 2003 1481 1673 1677 1516 15212004 1545 1479 1451 1520 1523 1542 2004 1554 1711 1716 1517 1507 15292005 1664 1473 1558 1552 1571 1612 2005 1629 1758 1519 1500 1555 15822006 1611 1597 1579 1599 1636 1659 2006 1708 1520 1493 1570 1558 15652007 1690 1607 1629 1665 1699 1659 2007 1627 1489 1580 1563 1578 17202008 1667 1657 1695 1744 1693 1693 2008 1614 1583 1568 1594 1727 17272009 1634 1723 1789 1724 1724 1780 2009 1229 1569 1610 1734 1734 1347<strong>2010</strong> 1835 1758 1758 1761 1701 <strong>2010</strong> 1626 1741 1741 1517 12262011 1789 1789 1806 1708 2011 1748 1748 1687 12142012 1821 1860 1721 2012 1755 1694 12382013 1904 1714 2013 1700 13702014 1739 2014 1596Electric Power Outlook for <strong>Pennsylvania</strong> 2009-2014 79
Table A17 PPL Electric Utilities CorporationTable A19 PPL Electric Utilities CorporationActual and Projected Peak Load (MW)Actual and Projected Commercial Energy Demand (GWh)Projected Peak Load RequirementsProjected Commercial Energy Demand(Year Forecast Was Filed)(Year Forecast Was Filed)Year Actual 2000 2001 2002 2003 2004 2005 2006 2007 2008 2009 <strong>2010</strong> Year Actual 2000 2001 2002 2003 2004 2005 2006 2007 2008 2009 <strong>2010</strong>2000 6355 6580 2000 11477 110902001 6583 6680 6850 2001 11778 11275 112912002 6970 6770 6960 7000 2002 12117 11444 11431 118502003 7197 6860 7060 7070 6790 2003 12273 11612 11561 12033 122122004 7335 6960 7170 7040 6860 7200 2004 12576 11782 11699 12219 12507 132752005 7083 7270 7120 7000 7300 7200 2005 13157 11848 12411 12757 13601 129672006 7577 7200 7140 7410 7290 7310 2006 13140 12602 13101 13975 13436 131882007 7163 7320 7510 7390 7410 7200 2007 13756 13418 14286 13946 13562 131842008 7414 7610 7490 7510 7270 7410 2008 13913 14631 14517 13836 13476 136762009 6845 7580 7610 7340 7450 7180 2009 13818 15068 14166 13777 14028 14258<strong>2010</strong> 7710 7400 7500 7250 7207 <strong>2010</strong> 14492 14045 14253 14486 140982011 7480 7580 7320 7227 2011 14290 14596 14631 146422012 7680 7360 7283 2012 14907 14926 149072013 7450 7366 2013 15228 152952014 7487 2014 15827Table A18 PPL Electric Utilities CorporationTable A20 PPL Electric Utilities CorporationActual and Projected Residential Energy Demand (GWh)Actual and Projected Industrial Energy Demand (GWh)Projected Residential Energy DemandProjected Industrial Energy Demand(Year Forecast Was Filed)(Year Forecast Was Filed)Year Actual 2000 2001 2002 2003 2004 2005 2006 2007 2008 2009 <strong>2010</strong> Year Actual 2000 2001 2002 2003 2004 2005 2006 2007 2008 2009 <strong>2010</strong>802000 11923 12031 2000 10280 105432001 12269 12150 12176 2001 10319 10836 109632002 12640 12280 12324 12391 2002 9853 11077 11255 107802003 13266 12421 12478 12514 12868 2003 9599 11295 11521 11135 103552004 13441 12562 12634 12650 13062 13308 2004 9611 11498 11777 11425 10503 99382005 14218 12799 12803 13259 13505 13950 2005 9720 1<strong>2010</strong> 11702 10641 10035 97502006 13714 12955 13462 13728 14311 14099 2006 9704 11970 10795 10155 9926 99682007 14411 13671 13962 14675 14392 14180 2007 9482 10924 10253 10136 10048 99652008 14419 14198 15019 14555 14422 14469 2008 9551 10346 10349 10084 9999 96252009 14218 15349 14794 14565 14584 14341 2009 8418 10577 10150 10032 9570 9401<strong>2010</strong> 15036 14702 14562 14340 14384 <strong>2010</strong> 10214 10059 9228 9141 85062011 14828 14608 14246 14390 2011 10084 9005 8879 83652012 14770 14350 14226 2012 9009 8866 82112013 14443 14164 2013 8864 81102014 14325 2014 8054<strong>Pennsylvania</strong> <strong>Public</strong> <strong>Utility</strong> <strong>Commission</strong>
Table A21 PECO Energy CompanyTable A23 PECO Energy CompanyActual and Projected Peak Load (MW)Actual and Projected Commercial Energy Demand (GWh)Projections of Peak Load RequirementsProjected Commercial* Energy Demand(Year Forecast Was Filed)(Year Forecast Was Filed)Year Actual 2000 2001 2002 2003 2004 2005 2006 2007 2008 2009 <strong>2010</strong> Year Actual 2000 2001 2002 2003 2004 2005 2006 2007 2008 2009 <strong>2010</strong>2000 7333 7339 2000 7481 66492001 7948 7398 7392 2001 7604 6702 73152002 8164 7457 7451 8012 2002 8019 6756 7446 77322003 7696 7517 7510 8076 8229 2003 8077 6810 7578 7963 81352004 7567 7577 7570 8140 8295 8129 2004 8414 6864 7711 8099 8233 81402005 8626 7631 8205 8362 8320 8320 2005 8520 7844 8265 8434 8349 83492006 8932 8271 8428 8445 8445 8755 2006 8857 8436 8637 8550 8550 86912007 8549 8496 8571 8571 8887 9066 2007 8892 8839 8755 8755 8864 90342008 8824 8700 8700 9020 9202 8677 2008 8700 8965 8965 9042 9215 90692009 7994 8831 9155 9340 8807 8956 2009 8404 9144 9223 9399 9251 8874<strong>2010</strong> 9293 9480 8940 9091 8114 <strong>2010</strong> 9407 9587 9436 9052 85722011 9622 9074 9227 8236 2011 9779 9625 9233 87442012 9210 9365 8359 2012 9817 9417 89182013 9506 8485 2013 9606 90972014 8612 2014 9279* Small Commercial & IndustrialTable A22 PECO Energy CompanyTable A24 PECO Energy CompanyActual and Projected Residential Energy Demand (GWh)Actual and Projected Industrial Energy Demand (GWh)Projected Residential Energy DemandProjected Industrial* Energy Demand(Year Forecast Was Filed)(Year Forecast Was Filed)Year Actual 2000 2001 2002 2003 2004 2005 2006 2007 2008 2009 <strong>2010</strong> Year Actual 2000 2001 2002 2003 2004 2005 2006 2007 2008 2009 <strong>2010</strong>2000 11304 10600 2000 15828 160472001 11178 10685 11278 2001 15312 16175 154052002 12335 10770 11385 11634 2002 15323 16305 15406 153242003 12259 10856 11488 11733 12020 2003 15518 16435 15408 15417 151302004 12507 10943 11592 11855 11905 12250 2004 15741 16567 15409 15429 14959 154772005 13469 11697 11957 11981 12385 12385 2005 15774 15409 15442 14980 15448 154492006 12797 12059 12054 12592 12592 13738 2006 15821 15458 15001 15448 15448 160892007 13487 12128 12839 12839 14013 13053 2007 16582 15022 15448 15448 16411 161372008 13317 13179 13179 14293 13314 13757 2008 16534 15448 15448 16739 16460 169142009 12893 13443 14579 13580 14032 13583 2009 15889 15757 17074 16789 17252 16864<strong>2010</strong> 14870 13852 14313 13855 13151 <strong>2010</strong> 17415 17125 17597 17202 162072011 14129 14599 14132 13414 2011 17467 17949 17546 165312012 14891 14415 13683 2012 18308 17897 168612013 14703 13956 2013 18254 171992014 14235 2014 17543* Large Commercial & IndustrialElectric Power Outlook for <strong>Pennsylvania</strong> 2009-2014 81
Table A25 West Penn Power CompanyTable A27 West Penn Power CompanyActual and Projected Peak Load (MW)Actual and Projected Commercial Energy Demand (GWh)Projections of Peak Load RequirementsProjected Commercial Energy Demand(Year Forecast Was Filed)(Year Forecast Was Filed)Year Actual 2000 2001 2002 2003 2004 2005 2006 2007 2008 2009 <strong>2010</strong> Year Actual 2000 2001 2002 2003 2004 2005 2006 2007 2008 2009 <strong>2010</strong>2000 3277 3284 2000 4265 41822001 3677 3304 3141 2001 4360 4225 43262002 3582 3341 3445 3458 2002 4497 4275 4395 44582003 3455 3380 3465 3505 3535 2003 4529 4329 4449 4543 45772004 3407 3415 3501 3542 3572 3621 2004 4691 4397 4517 4624 4653 47012005 3752 3536 3586 3610 3670 3702 2005 4892 4571 4684 4695 4780 47912006 3926 3622 3639 3705 3763 3723 2006 4959 4749 4739 4832 4907 49962007 3838 3674 3738 3812 3782 3813 2007 4998 4776 4878 5006 5092 50832008 3826 3766 3845 3824 3882 3871 2008 4925 4936 5098 5179 5179 51152009 3667 3866 3864 3965 3958 3910 2009 4880 5135 5249 5279 5235 5048<strong>2010</strong> 3895 4028 4036 3990 3788 <strong>2010</strong> 5318 5365 5327 5160 49662011 4078 4083 4032 3755 2011 5452 5387 5275 49872012 4123 4084 3771 2012 5462 5353 50592013 4120 3809 2013 5450 51692014 3951 2014 5307Table A26 West Penn Power CompanyTable A28 West Penn Power CompanyActual and Projected Residential Energy Demand (GWh)Actual and Projected Industrial Energy Demand (GWh)Projected Residential Energy DemandProjected Industrial Energy Demand(Year Forecast Was Filed)(Year Forecast Was Filed)Year Actual 2000 2001 2002 2003 2004 2005 2006 2007 2008 2009 <strong>2010</strong> Year Actual 2000 2001 2002 2003 2004 2005 2006 2007 2008 2009 <strong>2010</strong>822000 6022 6061 2000 8383 79422001 6325 6172 6192 2001 7955 8120 84812002 6459 6256 6260 6374 2002 7957 8230 8597 80062003 6641 6339 6329 6471 6486 2003 7747 8353 8663 8116 78852004 6724 6445 6436 6596 6599 6818 2004 8039 8477 8729 8188 7973 78142005 7088 6521 6680 6671 6890 6923 2005 8051 8799 8230 8023 7913 80272006 7133 6775 6744 6965 7047 7164 2006 8144 8290 8087 7998 8137 82832007 7266 6821 7041 7136 7289 7319 2007 8160 8187 8069 8220 8429 82822008 7172 7132 7194 7387 7484 7481 2008 8135 8140 8311 8543 8411 83112009 7101 7189 7417 7639 7654 7206 2009 7286 8313 8615 8584 8476 8440<strong>2010</strong> 7447 7761 7774 7264 7147 <strong>2010</strong> 8634 8728 8699 8711 76122011 7869 7892 7233 7104 2011 8766 8799 8906 77402012 7965 7248 7085 2012 8844 9093 79362013 7102 6952 2013 9246 81052014 7008 2014 8214<strong>Pennsylvania</strong> <strong>Public</strong> <strong>Utility</strong> <strong>Commission</strong>
Appendix B – Plant Additions and UpgradesThe following data represents PJM interconnection requests for new generating resources locatedin <strong>Pennsylvania</strong>. As of Jan. 31, <strong>2010</strong>, 13,167 MW or 13 percent of all PJM queued requests fornew generating resources or incremental additions to existing resources in <strong>Pennsylvania</strong>, receivedsince 1999, were placed in service. Projects withdrawn totaled 79,129 MW or 78 percent,representing 261 out of 464 projects. New capacity under construction amounts to 1,811 MW.Note: Some project requests may be duplicative, in that the same project may be considered formore than one point of injection into the system; however, in those cases, only one project is beingconsidered for construction.For addition information, see: http://www.pjm.com/planning/generation-interconnection.aspx.Source: PJMPJM queued generating capacity in <strong>Pennsylvania</strong>Natural Gas61.5%Coal5.4%Nuclear21.0%Solar0.8%Oil3.9%Hydro1.7%Other1.6%Biomass0.3%DieselWind 0.2%2.9%Methane0.7%Electric Power Outlook for <strong>Pennsylvania</strong> 2009-2014 83
Status of <strong>Pennsylvania</strong>'s Plant Additions and UpgradesTransmissionQueue PJM Substation MW MWC Status In Service Fuel OwnerA01 South Lebanon 230 KV 720 655 In-Service 2002 Q2 Natural Gas MEA08 Susquehanna 230kV 1140 15 In-Service 2002 Q3 Nuclear PPLA09 Susquehanna 230kV 1140 35 In-Service 2003 Q2 Nuclear PPLA10 Glory 115kV 6 6 In-Service 2000 Q1 Coal PENELECA11 Harwood 230 kV 356 201 In-Service 2002 Q2 Natural Gas PPLA12 Martins Creek 230 kV 600 600 In-Service 2004 Q2 Natural Gas PPLA18 North Temple 230 kV 557 557 In-Service 2002 Q4 Natural Gas MEA19 Eddystone 230 kV 521 521 In-Service 2002 Q1 Natural Gas PECOA21 Chichester 230 kV 725 725 In-Service 2004 Q4 Natural Gas PECOA31 Peckville/Varden 69kV 46 44 In-Service 2001 Q4 Natural Gas PPLA32 Montour #1 759 14 In-Service 2001 Q2 Coal PPLA33 Montour #2 14 14 In-Service 2000 Q4 Coal PPLA34 Brunner 230kV 749 14 In-Service 2002 Q2 Coal PPLA35 North Bangor 34.5kV 10 10 In-Service 2001 Q2 Methane MEA36 Hunterstown 500 kV 830 830 In-Service 2003 Q3 Natural Gas MEA59 Emilie 1145 540 In-Service 2004 Q2 Natural Gas PECOA59_W00 Springdale 138 kV 88 88 In-Service 2000 Q4 Natural Gas APSB03 Hosensack 500kV 750 750 In-Service 2003 Q1 Natural Gas PPLB05 Wayne-Homer City 345kV 265 250 In-Service 2002 Q1 Natural Gas PENELECB12_W01 South Bend 500 kV 600 600 In-Service 2002 Q1 Natural Gas APSB14 Arnold 115kV 10 In-Service 1999 Q1 Wind PENELECB18_W03 Springdale 138 kV 525 525 In-Service 2003 Q3 Natural Gas APSB23 Siegfried/Allentown 138kV 115 5 In-Service 2001 Q2 Coal PPLB23_W04 Gans 138 kV 88 88 In-Service 2001 Q4 Natural Gas APSB26 Hunlock Creek 66kV 50 50 In-Service 2002 Q2 Natural Gas PPLB28 Muddy Run 230kV 160 160 In-Service 2003 Q3 Hydro PECOB28_W08 Mill Run 25 kV 15 In-Service 2002 Q2 Wind APSB30 Emilie 230kV 605 605 In-Service 2004 Q2 Natural Gas PECOB34 Seward 230kV 550 304 In-Service 2006 Q2 Other PENELECD01 Engleside 69kV 2 1.6 In-Service 2000 Q2 Natural Gas PPLD03 Harwood 69kV 99 99 In-Service 2002 Q2 Natural Gas PPLD04 Peckville 69kV 20 1 In-Service 2000 Q2 Natural Gas PPLD05 East Carbondale 69kV 70 In-Service 2003 Q4 Wind PPLD06 Eclipse 115kV 85 5 In-Service 2000 Q3 Natural Gas PPLD07 Blueball 69kV 53 8 In-Service 2000 Q3 Natural Gas PECOD18 Hosensack 230kV 350 350 In-Service 2004 Q2 Natural Gas PPLE02 N. Lebanon 69kV 1 1.2 In-Service 2000 Q4 Methane MEE04_W20 Guilford 138 kV 88 88 In-Service 2002 Q4 Natural Gas APSE07 Montour 230kV 750 7 In-Service 1999 Q1 Coal PPLE13 Somerset 22.86kV 10 In-Service 1999 Q1 Wind PENELECE17_W27 Ronco 620 620 In-Service 2003 Q2 Natural Gas APSE20 Croydon 230kV 387 6.5 In-Service 2002 Q4 Oil PECOF03 Martins Creek 230kV 850 30 In-Service 2001 Q2 Coal PPLG04 Brunner Island #2 749 14 In-Service 2002 Q1 Coal PPLG05 Brunner Island #1 14 14 In-Service 2002 Q1 Coal PPLG06 Martins Creek #4 850 30 Under Construction 2012 Q1 Coal PPLG21 Meyersdale North 48 In-Service 2003 Q4 Wind PSEGG22 North Wales 34.5 kV 38 38 In-Service 2002 Q3 Natural Gas PECOG30_W53 South Bend 500 kV 704 104 Partially In-Service 2003 Q2 Natural Gas APSG36 Holtwood 152 5 In-Service 2002 Q2 Hydro PPLG46 Peach Bottom 500kV 2256 70 Partially In-Service 2007 Q4 Nuclear PECOG51_W60 Hatfield Ferry 500 kV 525 525 Suspended 2011 Q3 Coal APSG51_W63 Upton 34.5 kV 10 9.9 In-Service 2003 Q2 Methane APS84<strong>Pennsylvania</strong> <strong>Public</strong> <strong>Utility</strong> <strong>Commission</strong>
Status of <strong>Pennsylvania</strong>'s Plant Additions and UpgradesTransmissionQueue PJM Substation MW MWC Status In Service Fuel OwnerH02 Susquehanna 230kV 9 9 In-Service 2007 Q2 Nuclear PPLH03 Susquehanna 500kV 1153 9 In-Service 2003 Q4 Nuclear PPLH06 Chichester 230kV 750 25 In-Service 2004 Q4 Natural Gas PECOI12 Grand Point 69kV 31 23.3 In-Service 2004 Q1 Diesel APSI13 Hooversville 115kV 29 0 In-Service 2008 Q1 Wind PENELECI14 Upton 34.5kV 14 4.1 In-Service 2004 Q2 Methane APSJ09 Harrisburg Authority 26 26 In-Service 2006 Q2 Methane PPLK02 East Towanda-Moshannon 230kV 70 0 Suspended <strong>2010</strong> Q4 Wind PENELECK13 Hooversville 115kV 29 5.88 In-Service 2008 Q1 Wind PENELECK18 Arnold (Green Mountain) 115kV 10 2.08 In-Service Wind PENELECK20 Mill Run 25 kV 15 3 In-Service 2002 Q2 Wind APSK21 East Carbondale 69kV 69 13 In-Service 2004 Q3 Wind PPLK22 Somerset 22.86kV 9 1.8 In-Service 1999 Q1 Wind PENELECK23 Meyersdale North 48 6 In-Service 2004 Q3 Wind PENELECL08 Holtwood 69kV 109 2 In-Service 2003 Q4 Hydro PPLL09 Montour #1 230kV 761 2 In-Service 2003 Q4 Coal PPLL13 Rockwood 40 8 In-Service 2008 Q1 Wind PENELECL17 Rolling Hills 6 In-Service 2005 Q2 Methane MEL18 Bear Creek 26 5.2 In-Service 2006 Q1 Wind PPLM07 Peckville (Archbald) 50 6.3 In-Service 2004 Q1 Natural Gas PPLM11 Susquehanna #1 2520 111 Partially In-Service 2008 Q2 Nuclear PPLM12 Susquehanna #2 2520 107 Partially In-Service <strong>2010</strong> Q2 Nuclear PPLM26 Champion 272 272 Suspended 2013 Q4 Coal APSM27 Eddystone 138kV 1408 7 In-Service 2004 Q2 Coal PECON06 Hamilton 12kV 0 In-Service 2005 Q1 Methane PPLN13 Beaver Valley 1652 1630 In-Service 2005 Q1 Nuclear DLN14 Frackville-Hauto #3 69kV 27 5.4 In-Service 2006 Q2 Wind PPLN26 Daleville 2 1.7 Partially In-Service 2006 Q4 Methane PECON31 Freemansburg 69kV 5 In-Service 2008 Q2 Methane PPLN32 Gans 138kV 50 10.1 Under Construction <strong>2010</strong> Q3 Wind APSN36 Gold-Sabinsville 115kV 50 10 Under Construction <strong>2010</strong> Q4 Wind PENELECN39 Johnstown-Altoona 230kV 80 16 In-Service 2007 Q1 Wind PENELECO01 Letort 12kV 3 3.2 In-Service 2006 Q1 Methane PPLO18 Salix-Claysburg (Krayn) 115kV 65 13 Partially In-Service 2008 Q4 Wind PENELECO19 Somerset 115kV 33 6.6 Under Construction 2012 Q2 Wind PENELECO26 Pine Grove 69kV 8 8 Partially In-Service 2008 Q2 Diesel PPLO28 Jenkins-Harwood #2 69kV 51 10.2 Suspended 2011 Q4 Wind PPLO36 Honey Brook 12kV 2 Under Construction 2008 Q4 Methane PPLO38 Johnstown-Altoona 230kV 50 10 In-Service 2009 Q3 Wind PENELECO39 Sunbury - Dauphin 69kV 56 11.2 Suspended <strong>2010</strong> Q2 Wind PPLO40 Pine Grove - Frailey 69kV 28 5.6 Suspended 2012 Q3 Wind PPLO46 Frackville-Hauto #3 69kV 27 0.4 In-Service 2007 Q4 Wind PPLO48 Hays Mill - Lookout 115kV 38 7.2 In-Service 2008 Q2 Wind PENELECO52 Gold-Potter Co 115kV 50 10 Suspended 2011 Q2 Wind PENELECO53 Beaver Valley #1 902 81 In-Service 2007 Q2 Nuclear DLO54 Beaver Valley #2 908 77 In-Service 2008 Q3 Nuclear DLO56 Osterburg East 115kV 76 15.2 Suspended 2013 Q1 Wind PENELECO60 Berlin 23 kV 5 1.08 Under Construction 2012 Q1 Wind PENELECO70 Susquehanna - Harwood 230kV 124 24.8 Suspended 2011 Q4 Wind PPLO72 Hooversville-Central City 60 12 Suspended 2009 Q4 Wind PENELECP01 Westover-Madera 115kV 65 13 Suspended <strong>2010</strong> Q4 Wind PENELECP03 Frackville-Hauto #3 27 1.3 In-Service 2007 Q4 Wind PPLP04 Peach Bottom 500kV 557 550 Under Construction 2011 Q3 Natural Gas PECOElectric Power Outlook for <strong>Pennsylvania</strong> 2009-2014 85
Status of <strong>Pennsylvania</strong>'s Plant Additions and UpgradesTransmissionQueue PJM Substation MW MWC Status In Service Fuel OwnerP22 Johnstown Altoona 230kV 20 4 In-Service 2009 Q3 Wind PENELECP28 Mehoopany 115kV 150 30 Under Construction 2011 Q4 Wind PENELECP34 Washington Landfill 6 6.4 In-Service 2009 Q1 Biomass APSP47 Mansfield-S. Troy 115kV 100 20 In-Service 2009 Q4 Wind PENELECP60 New Baltimore 115kV (Stony Creek) 53 10.5 In-Service <strong>2010</strong> Q1 Wind PENELECQ18 Moser 34.5kV 5 5 In-Service 2007 Q4 Methane PECOQ20 Holtwood 249 140 Under Construction 2013 Q3 Hydro PPLQ25 Donegal-Iron City 138kV 80 16 Under Construction 2013 Q1 Wind APSQ27 Frackville-Shennandoah 69kV 100 20 In-Service 2009 Q2 Wind PPLQ28 Eldred-Frackville 230kV 170 34 Suspended 2011 Q3 Wind PPLQ34 Garrett 115kV 100 20 Under Construction 2011 Q2 Wind PENELECQ36 Philipsburg - Tyrone North 115kV 50 10 Under Construction <strong>2010</strong> Q4 Wind PENELECQ44 Elizabethtown 0 0 In-Service 2006 Q3 Natural Gas PECOQ45 North Lebanon 13.2kV 3 3.2 In-Service 2007 Q3 Methane MEQ46 Curwensville 34.5 kV 10 10 Under Construction 2009 Q1 Coal PENELECQ47 Peach Bottom 2532 140 Under Construction 2013 Q2 Nuclear PECOQ53 Summit-West Fall 115kV 38 7.6 Under Construction <strong>2010</strong> Q4 Wind PENELECQ59 S. Reading-Birdsboro 64kV 6 6.4 In-Service 2008 Q2 Biomass MEQ63 Seneca 230kV 16 16 Active 2008 Q1 Hydro PENELECQ73 South Reading 69kV 30 16 In-Service 2008 Q4 Biomass MER01 Susquehanna 800 800 Active 2013 Q1 Nuclear PPLR02 Susquehanna 800 800 Active 2013 Q1 Nuclear PPLR32 Salix - Claysburg 115kV 75 15 Active 2009 Q4 Wind PENELECR40 Rockwood - Meyersdale 115kV 38 0.36 Under Construction 2008 Q2 Wind PENELECR43 Frackville - Hauto #3 20 4 Under Construction 2012 Q2 Wind PPLR57 South Reading 69kV 30 9 In-Service 2008 Q4 Biomass MER81 Emilie 230kV 1195 101 In-Service <strong>2010</strong> Q1 Natural Gas PECOR92 DuBois 115kV 70 14 Active 2009 Q2 Wind PENELECS05 Seneca #2 230kV 16 16 Active 2008 Q1 Hydro PENELECS103 Warren 115kV 57 57 Active 2008 Q2 Natural Gas PENELECS20 Pine Grove-Fishbach 69kV 50 10 Suspended 2013 Q2 Wind PPLS29B Somerset 23kV 6 5.7 Active 2009 Q2 Methane PENELECS34 Handsome Lake Energy 345kV 270 20 In-Service 2007 Q2 Natural Gas PENELECS40 Hegins 11 10.5 In-Service 2009 Q1 Methane PPLS41 Eldred-Reed 69kV 13 12.5 Suspended <strong>2010</strong> Q2 Biomass PPLS42 Eldred-Fairview 18 3.6 Suspended <strong>2010</strong> Q2 Wind PPLS49 Bedford 115kV 203 18 Active 2009 Q4 Wind PENELECS64 York Inc. 115kV 18 18 Active 2011 Q1 Biomass MET102 Sunbury 69kV 160 10 In-Service 2007 Q4 Coal PPLT103 Sunbury 69kV 160 10 In-Service 2007 Q4 Coal PPLT108 Archbald 69kV 9 9.2 In-Service <strong>2010</strong> Q1 Methane PPLT109 Keystone 500kV 918 20 Active 2009 Q2 Coal PENELECT110 Keystone 500kV 916 20 Active 2009 Q4 Coal PENELECT117 Hunlock Creek 69kV 126 126 Under Construction 2012 Q2 Natural Gas UGIT118 Linwood 230kV 840 10 Under Construction <strong>2010</strong> Q2 Natural Gas PECOT121 Potter 115kV 75 15 Active 2009 Q4 Wind PENELECT129 Printz 230kV 541 20 Under Construction <strong>2010</strong> Q2 Natural Gas PECOT155 Belknap 25kV 6 6 Active <strong>2010</strong> Q2 Hydro APST156 Champion 292 20 Active 2011 Q1 Coal APST174 Yukon-Browns Run 500kV 930 900 Active 2011 Q2 Natural Gas APST182 TMI 230kV 845 24 Active 2008 Q1 Nuclear MET20 Falls 3 3 In-Service 2008 Q4 Solar PECOT39 Coudersport 46kV 18 3.6 Active 2011 Q1 Wind APS86<strong>Pennsylvania</strong> <strong>Public</strong> <strong>Utility</strong> <strong>Commission</strong>
Status of <strong>Pennsylvania</strong>'s Plant Additions and UpgradesTransmissionQueue PJM Substation MW MWC Status In Service Fuel OwnerT49 Steel City 1134 42 In-Service 2009 Q2 Natural Gas PPLT85 Roxbury-Blain 23kV 6 6 Under Construction 2008 Q4 Methane PENELECT86 Bradford 34.5kV 2 1.5 Under Construction 2008 Q3 Methane PENELECU1-010 Peach Bottom 575 18 Under Construction 2011 Q3 Natural Gas PECOU1-051 Clearfield 130 16.9 Active 2011 Q4 Wind PENELECU1-067 Honey Brook 3 1.6 Under Construction 2009 Q4 Methane PPLU1-068 York 115kV 51 10 Active 2008 Q2 Natural Gas MEU1-089 Paper Tap 69kV 20 20 In-Service 2008 Q4 Other PECOU2-015 Harwood-E. Palmerton 230kV 100 13 Active <strong>2010</strong> Q4 Wind PPLU2-016 Grover 230kV 85 11.05 Active 2011 Q4 Wind PENELECU2-029 Passyunk 1 0 Active 2015 Q4 Solar PECOU2-054 Weissport 3 2.6 Under Construction 2011 Q3 Hydro PPLU2-055 Karthaus-Milesburg 230kV 89 11.5 Active 2012 Q3 Wind APSU2-063 Croydon 230kV 391 5 Under Construction 2008 Q3 Natural Gas PECOU2-067 Eldred-Pine Grove 69kV 33 2.5 Under Construction 2008 Q3 Other PPLU2-069 Frackville 56 7.3 Under Construction 2014 Q2 Wind PPLU2-073 Frostburg 138kV II 200 26 Active <strong>2010</strong> Q4 Wind APSU2-074 Peach Bottom-Rock Springs 500kV 650 650 Active 2012 Q4 Natural Gas PECOU2-076 Falls 10 10 Suspended 2011 Q1 Methane PECOU3-001 Barbadoes 34kV 1 0 In-Service 2008 Q3 Other PECOU3-008 Mt. Bethel 230kV 200 200 Active 2012 Q1 Oil MEU3-009 Mt. Bethel 230kV 595 595 Active 2014 Q1 Oil MEU3-029 Beaver Valley #1 950 37 Active 2013 Q4 Nuclear DLU3-030 Beaver Valley #2 951 38 Active 2012 Q4 Nuclear DLU4-014 Siegfried-Hauto 69kV 10 3.8 Active 2009 Q2 Solar PPLU4-040 Lincoln 13.2kV 2 2 Under Construction 2011 Q1 Natural Gas MEU4-041 Valley 13.2kV 2 2 Under Construction 2011 Q1 Diesel MEU4-042 Hanover 13.2kV 2 2 Under Construction 2011 Q1 Diesel MEU4-043 Tolna 13.2kV 2 2 Under Construction 2011 Q1 Diesel MEU4-044 Stoverstown 13.2kV 2 2 Under Construction 2011 Q1 Diesel MEU4-045 Oil Creek 34.kV 2 2 Under Construction 2011 Q1 Diesel PENELECU4-046 Teepleville 34.5kV 2 2 Under Construction 2011 Q1 Diesel PENELECU4-047 Mill Village 34.5kV 2 2 Under Construction 2011 Q1 Diesel PENELECU4-048 Saegertown 34.5kV 2 2 Under Construction 2011 Q1 Diesel PENELECV1-026 Limerick 1213 20 Active <strong>2010</strong> Q4 Nuclear PECOV1-027 Limerick 1213 20 Active 2011 Q2 Nuclear PECOV1-028 North Wales 10 2 Under Construction 2009 Q2 Diesel PECOV2-019 Mansfield-S. Troy 115kV 101 0 Active 2009 Q4 Wind PENELECV2-027 South Milton 2 1.62 Under Construction 2011 Q1 Methane PPLV3-004 Siegfried 83 83 Active 2012 Q4 Coal PPLV3-006 Linglestown 1 0.38 Active 2009 Q4 Solar PPLV3-018 Towanda 115kV 75 9.75 Active 2012 Q4 Wind PENELECV3-019 Edinboro 13.8kV 2 2 Active 2011 Q1 Natural Gas PENELECV3-030 St. Benedict-Patton 46kV 32 4 Active 2012 Q4 Wind PENELECV3-031 Germantown 20 7.6 Active <strong>2010</strong> Q4 Solar MEV3-040 Siegfried-Hauto 69kV 10 3.8 Active 2011 Q2 Solar PPLV3-041 Daleville 4 4 Active <strong>2010</strong> Q1 Methane PECOV3-042 Thompson 115kV 84 10.9 Active 2012 Q4 Wind PENELECV3-044 Glendon 34.5kV 5 4.8 Active <strong>2010</strong> Q3 Methane MEV3-051 Letort 3 0.4 Active <strong>2010</strong> Q4 Wind PPLV3-057 Ironwood 230kV 20 0 Active 2011 Q1 Other MEV3-062 McConnellsburg-Guilford 138kV 20 7.6 Active 2011 Q4 Solar APSV4-002 Graceton 230kV 575 575 Active 2014 Q3 Natural Gas PECOElectric Power Outlook for <strong>Pennsylvania</strong> 2009-2014 87
Status of <strong>Pennsylvania</strong>'s Plant Additions and UpgradesTransmissionQueue PJM Substation MW MWC Status In Service Fuel OwnerV4-012 Morgantown 5 4.8 Active <strong>2010</strong> Q4 Methane PPLV4-014 Greenridge Landfill 7 0 Active <strong>2010</strong> Q4 Methane APSV4-020 North Temple 230kV 650 650 Active 2014 Q2 Natural Gas MEV4-027 Quarryville 5 1.9 Active <strong>2010</strong> Q4 Solar DPLV4-045 Peach Bottom 320 320 Active 2015 Q4 Nuclear PECOV4-052 West Reading 6 6 Active 2011 Q1 Natural Gas MEV4-072 Blue Ridge Landfill 13 12.8 Active 2011 Q1 Methane APSV4-075 Warwick 12kV 2 0.76 Active <strong>2010</strong> Q4 Solar PPLV4-076 Carlisle Pike 23kV 5 2 Active 2011 Q2 Solar PENELECV4-077 Montgomery Avenue 12.47kV 13 4.9 Active 2011 Q3 Solar PENELECW1-010 Cooper 20 7.6 Active 2011 Q4 Solar PECOW1-012 Millheim-Brush Jct 46kV 50 6.5 Active 2013 Q4 Wind APSW1-013 Saint Thomas 34kV I 20 7.6 Active 2011 Q3 Solar APSW1-014 Saint Thomas 34kV II 20 7.6 Active 2011 Q3 Solar APSW1-015 Shade Gap 115kV 70 9.1 Active 2013 Q4 Wind PENELECW1-042 Hubar Road 1 20 7.6 Active 2011 Q3 Solar APSW1-043 Hubar Road 2 20 7.6 Active 2011 Q3 Solar APSW1-044 Mont Alto 20 7.6 Active 2011 Q3 Solar APSW1-045 Roxbury 34.5kV 20 7.6 Active 2011 Q3 Solar MEW1-046 Face Rock 69kV 15 5.7 Active 2011 Q2 Solar PPLW1-050 Keller & Valle Camp Roads I 20 7.6 Active 2011 Q4 Solar APSW1-051 St. Thomas 34kV III 130 49.4 Active 2012 Q3 Solar APSW1-052 Keller & Valley Camp Roads II 20 7.6 Active 2011 Q4 Solar APSMW - Maximum facility output after interconnection requestMWC - Capacity interconnection request for the queue position (summer net)Source: PJM.com (as of March 12, <strong>2010</strong>)Generation Deactivations in <strong>Pennsylvania</strong>Capacity Transmission Age Requested ProjectedUnit (MW) Zone (Years) Deactivation Date Deactivation Date StatusHunlock 3 45 UGI 48 Jun-10 Jun-10 No reliability issuesCromby 1 144 PE 55 May-11 May-11 Reliability impacts identifiedCromby 2 201 PE 54 May-11 May-12 Reliability impacts identifiedEddystone 1 279 PE 49 May-11 May-11 Reliability impacts identifiedEddystone 2 309 PE 49 May-11 Dec-13 Reliability impacts identifiedSource: PJM.com (as of March 16, <strong>2010</strong>)Note 1: The NRC has approved a 20-year extension of the operating license for both reactors at PPL’s Susquehannanuclear power plant in Luzerne County. The license for unit 1 has been extended to 2042; the license for Unit 2 hasbeen extended to 2044. Unit 2 ended a PPL record of 723 days of continuous generation when it shut down forrefueling and maintenance in April 2009. The combined facility output is 2,465 MW. PPL owns 90 percent.Note 2: PJM has notified Exelon that with the completion of scheduled transmission system upgrades, Cromby Unit1 and Eddystone Unit 1 will not be needed for reliability and can be deactivated on the proposed date of May 31,2011. The retirement of Cromby Unit 2 and Eddystone Unit 2 could, however, result in reliability impacts.Although they are no longer economical to operate, Exelon plans to continue operating the units beyond theirdeactivation dates, during the completion of additional transmission system upgrades.88<strong>Pennsylvania</strong> <strong>Public</strong> <strong>Utility</strong> <strong>Commission</strong>
Location of queued generation interconnection requests in <strong>Pennsylvania</strong>Source: PJM 2009 Regional Transmission Expansion PlanElectric Power Outlook for <strong>Pennsylvania</strong> 2009-2014 89
Appendix C – Existing Generating FacilitiesThe following represents the most recently available data on existing generating facilities locatedin <strong>Pennsylvania</strong>. Below is a summary of generating capacity by fuel type, and the distribution ofelectric generation by fuel type for 2009.Existing generating capacity in <strong>Pennsylvania</strong>Other1.3%Wind1.9%Oil8.7%Waste Coal3.1%Nuclear20.8%Coal36.2%Hydro4.9%Gas23.2%Source: Electric Power Generation Association2009 generation in <strong>Pennsylvania</strong>Other, 1.8% Oil, 0.4%Nuclear, 35.1%Coal, 48.0%Hydro, 1.3%Gas, 13.6%Source: Energy Information Administration90<strong>Pennsylvania</strong> <strong>Public</strong> <strong>Utility</strong> <strong>Commission</strong>
<strong>Pennsylvania</strong>'s Existing Electric Generating FacilitiesCompany Name Plant Name Fuel TypeAlternateFuel TypeTechnicalTypeA/C Power-Colver Operations Colver Power Project Waste Coal ST-S 102.00AES Corporation* Beaver Valley Coal ST 125.00AES Corporation* AES Ironwood LLC Gas CC 710.00AES Wind Generation* Armenia Mountain Wind WTG 100.50Allegheny Electric Cooperative* William F Matson Hydroelectric Plant Water HY 21.70Allegheny Electric Cooperative* PPL Susquehanna Power Plant Nuclear ST 245.50Allegheny Energy Supply* Allegheny Lock & Dam 5 & 6 Water HY 13.00Allegheny Energy Supply* Armstrong Generating Station Coal ST 356.00Allegheny Energy Supply* Chambersburg Gen. Facility, AE Units 12 & 13 Gas SC 88.00Allegheny Energy Supply* Gans Gen. Facility, AE Units 8 & 9 Gas GT 88.00Allegheny Energy Supply* Hatfield's Ferry Power Station Coal ST 1710.00Allegheny Energy Supply* Hunlock Creek Power Station Gas GT 44.00Allegheny Energy Supply* Lake Lynn Hydroelectric Project Water HY 52.00Allegheny Energy Supply* Mitchell Generating Station Coal Oil ST 370.00Allegheny Energy Supply* Springdale, Units 1,2,3,4 & 5 Gas CC/GT 628.00American Consumer Industries Inc (ACI) Colmac Clarion Inc Waste Coal ST 32.00Babcock & Brown Wind Partners Allegheny Ridge Wind Farm Wind WTG 80.00Babcock & Brown Wind Partners Bear Creek Wind WTG 24.00Bio-Energy Partners Lake View Landfill Other IC 6.10Brookfield Renewable Power, Inc. Piney Dam (PA) Hydroelectric Plant Water HY 28.80Chambersburg Borough Electric Dept Chambersburg Power Plant Gas Oil IC 30.47Cogentrix* Northhampton Generating Station Waste Coal ST-S 112.00Cogentrix* Scrubgrass Generating Plant Waste Coal ST 85.00Community Energy, Inc.* Locust Ridge Wind Farm Wind WTG 128.00Conectiv Energy* Bethlehem Commerce Plant Gas CC 1092.00Consolidated Rail Corporation Juniata Locomotive Shop Coal ST-H 10.00Constellation Generation Group* Colver Power Plant Waste Coal ST-S 26.00Constellation Generation Group* Conemaugh Power Plant Coal IC/ST 179.00Constellation Generation Group* Keystone Generating Station (20.99%) Coal ST 357.00Constellation Generation Group* Keystone Peaking Plant (20.99%) Oil IC/Diesel 2.00Constellation Generation Group* Safe Harbor Hydroelectric Plant (66 2/3%) Water HY 277.00Constellation Power Inc* Handsome Lake Plant Gas SC 267.00Constellation Power Inc.* Panther Creek Energy Facility (50.00%) Waste Coal ST-S 40.00Corona Power LLC Sunbury Generating Station Coal Oil ST/GT/IC 462.50Covanta Energy Corporation Covanta Plymouth Renewable Energy LP Other ST 32.13Covanta Energy Corporation Delaware Valley Resource Recovery Facility Other ST-S 90.00Covanta Energy Corporation Lancaster County Resource Recovery Facility Other ST 35.70Covanta Energy Corporation York County Resource Recovery Plant Other ST 36.50Covanta Energy for Harrisburg Authority Harrisburg WTE Plant Other Gas ST-S 24.10Dominion Generation Fairless Energy Gas CC 1200.00Duke Energy North Allegheny Wind Farm Wind WTG 70.00Duke Energy Wholesale Power Generation Fayette County Energy Facility Gas CC 677.00Duquesne Conemaugh LLC Conemaugh Power Plant (3.83%) Coal IC/ST 65.60Duquesne Keystone LLC Keystone Generating Station (2.47%) Gas Oil IC/ST 42.30Dynegy Midwest Generation Ontelaunee Energy Center Gas CCGT 545.00E.On Climate and Renewables Stony Creek Wind Farm Wind WTG 52.50Ebensburg Power Co. Ebensburg Power Co Coal ST-S 48.50Edison Mission Group Forward Wind Farm Wind WTG 29.40Edison Mission Group Lookout Windpower Wind Farm Wind WTG 37.80EverPower Renewables Highland Wind Project Wind WTG 62.50Exelon Nuclear* Limerick Nuclear Gen. Station, Units 1 & 2 Nuclear ST-BWR 2293.00Exelon Nuclear* Three Mile Island Nuclear ST-PWR 837.00Exelon Nuclear* Peach Bottom Atomic Power St., Units 2 & 3 (50%) Nuclear ST-BWR 1145.00Exelon Power Generation Co. LLC* Chester Peaking Plant Oil GT 39.00Exelon Power Generation Co. LLC* Conemaugh (20.72%) Coal ST 352.00Exelon Power Generation Co. LLC* Conemaugh Peaking Plant Oil IC/Diesel 2.00Exelon Power Generation Co. LLC* Cromby Generating Station 1 Coal ST 144.00Exelon Power Generation Co. LLC* Cromby Generating Station 2 Oil Natural Gas ST 201.00Exelon Power Generation Co. LLC* Cromby Peaking Plant (20.72%) Oil IC/Diesel 3.00Exelon Power Generation Co. LLC* Croydon Peaking Plant Oil GT 391.00MWElectric Power Outlook for <strong>Pennsylvania</strong> 2009-2014 91
<strong>Pennsylvania</strong>'s Existing Electric Generating FacilitiesCompany Name Plant Name Fuel TypeAlternateFuel TypeTechnicalTypeExelon Power Generation Co. LLC* Delaware Peaking Plant Oil GT 56.00Exelon Power Generation Co. LLC* Delaware Peaking Plant Oil IC/Diesel 3.00Exelon Power Generation Co. LLC* Eddystone Generating Station 1 & 2 Coal ST 588.00Exelon Power Generation Co. LLC* Eddystone Generating Station 3 & 4 Oil Natural Gas ST 760.00Exelon Power Generation Co. LLC* Exelon-Conergy Solar Energy Center Other PV 3.00Exelon Power Generation Co. LLC* Fairless Hills Generating Other ST-S 60.00Exelon Power Generation Co. LLC* Falls Twp Peaking Station Oil GT 51.00Exelon Power Generation Co. LLC* Keystone Gen. Station (20.99%) Coal ST 357.00Exelon Power Generation Co. LLC* Keystone Peaking Plant (20.99%) Oil IC/Diesel 2.00Exelon Power Generation Co. LLC* Moser Peaking Station Oil GT 51.00Exelon Power Generation Co. LLC* Muddy Run HydroElectric Plant Water HY 1070.00Exelon Power Generation Co. LLC* Pennsbury Peaking Station Other GT 51.00Exelon Power Generation Co. LLC* Richmond Peaking Station Oil GT 96.00Exelon Power Generation Co. LLC* Schuylkill Generating Station Oil GT-S 166.00Exelon Power Generation Co. LLC* Schuylkill Peaking Station Oil GT 30.00Exelon Power Generation Co. LLC* Schuylkill Peaking Station Oil IC/Diesel 3.00Exelon Power Generation Co. LLC* Southwark Peaking Station Oil GT 52.00FirstEnergy Generation Corp.* Bruce Mansfield Plant Coal ST 2490.00FirstEnergy Generation Corp.* Seneca Pumped Storage Plant Water HY 451.00FirstEnergy Generation Corp.* York Haven Water HY 19.00FirstEnergy Nuclear Operating Co.* Beaver Valley Power Station Nuclear ST-PWR 1815.00Gamesa Locust Ridge II Wind WTG 102.00Gas Recovery Services, Inc. Modern Landfill (PA) Production Plant Other GT 9.00GDF Suez Energy Generation NA, Inc.* NEPCO-Northeastern Power Co. Waste Coal ST 59.00GDF Suez Energy Generation NA, Inc.* Northumberland Cogeneration Facility Other NG GT 18.00General Electric Co. Erie Works Plant Coal ST 36.00General Electric Co. Grove City Plant Oil GT 10.60Gilberton Power Co*. John B Rich Memorial Power Station Waste Coal ST-S 80.00Iberdrola Renewables Casselman Wind Project Wind WTG 34.50Indiana University of <strong>Pennsylvania</strong>* SW Jack Cogeneration Plant Gas Oil IC-H 24.40Ingenco Mountain View Landfill Other Oil IC 16.00Integrys Energy Services, Inc.* WPS Westwood Generation Waste Coal ST 30.00International Power America, Inc. (ANP)* Armstrong Energy LLC Gas GT 625.00Kimberly Clark Corp Chester Cogeneration Plant Coal Coke ST-S 60.00Koppers, Inc. Koppers Montgomery Cogeneration Plant Other ST-S 10.00Liberty Electric Power LLC Liberty Electric Power LLC Gas CC 610.00Merck & Co., Inc. West Point (PA) Merck Plant Gas GT/ST 30.25Midwest Generation LLC Homer City (EME) Generation Coal ST 1884.00Morris Energy Group LLC (MEG) York Solar Plant Other Gas CC 52.20Mount Carmel Cogeneration, Inc. Mount Carmel Cogeneration, Inc. Waste Coal ST-S 46.50NAES Corp North East Cogeneration Plant Gas CC 81.80NextEra Energy Resources (formerly FPL)* Marcus Hook Cogen Power Plant Other GT-S 50.00NextEra Energy Resources (formerly FPL)* Marcus Hook Cogeneration Plant Gas CC 744.00NextEra Energy Resources (formerly FPL)* Green Mountain Wind Energy Center Wind WTG 10.40NextEra Energy Resources (formerly FPL)* Meyersdale Wind Power Project Wind WTG 30.00NextEra Energy Resources (formerly FPL)* Mill Run Wind Wind WTG 15.00NextEra Energy Resources (formerly FPL)* Somerset Wind Farm Wind WTG 9.00NextEra Energy Resources (formerly FPL)* Waymart Wind Farm Wind WTG 64.50Noble Environmental Power Locust Ridge Wind Farm Wind WTG 26.00Northern Star Generation Services Co. Cambria County Cogen Waste Coal ST-S 98.00NRG Energy - Conemaugh Power LLC Conemaugh Power Plant Coal Oil IC/ST 65.00NRG Energy - Keystone Power LLC Keystone Generating Station (3.70%) Coal Oil IC/ST 65.00NRG Thermal, LLC* NRG Energy Paxton LLC Gas Oil ST-S 10.00PEI Power Corp. Archbald Cogenereation Power Station Other GT/ST 25.00PEI Power Corp. Archbald PEI II LLC Archbald Gas CT 50.00<strong>Pennsylvania</strong> Renewable Resources Assoc. Conemaugh Saltsburg Water HY 15.00<strong>Pennsylvania</strong> Wind Energy Humboldt Industrial Park Wind WTG 0.13PH Glatfelter Co. Spring Grove Glatfelter Cogeneration Plant Coal ST-S 67.25Power Systems Operations Ebensburg Power Co Waste Coal ST-S 48.50PPL Corp.* Lebanon County Landfill (2007) Other IC 3.20MW92<strong>Pennsylvania</strong> <strong>Public</strong> <strong>Utility</strong> <strong>Commission</strong>
<strong>Pennsylvania</strong>'s Existing Electric Generating FacilitiesCompany Name Plant Name Fuel TypeAlternateFuel TypeTechnicalTypePPL Montour LLC* Conemaugh Power Plant (16.25%) Coal Oil IC/ST 278.00PPL Generation LLC* Allentown Generating Station Oil CT 64.00PPL Generation LLC* Fishbach Generating Station Oil CT 37.20PPL Generation LLC* Harrisburg Generating Station Oil CT 64.00PPL Generation LLC* Harwood (PA) Generation Station Oil CT 32.00PPL Generation LLC* Jenkins Generating Station Oil Coke CT 32.00PPL Generation LLC* Keystone Steam Electric Station (12.34%) Coal CT 211.00PPL Generation LLC* Lock Haven Generating Station Oil CT 18.60PPL Generation LLC* Lower Mt. Bethel Energy LLC Gas CC 623.00PPL Generation LLC* PPL Brunner Island Coal ST 1483.00PPL Generation LLC* PPL Holtwood, LLC Water HY 108.00PPL Generation LLC* PPL Martins Creek Oil Natural Gas GT/ST 1664.00PPL Generation LLC* PPL Montour LLC Coal ST 1552.00PPL Generation LLC* PPL Susquehanna LLC Nuclear ST 2218.50PPL Generation LLC* PPL Wallenpaupack LLC Water HY 44.00PPL Generation LLC* (PPL Holtwood LLC) Safe Harbor Hydroelectric Plant (33 1/3%) Water HY 140.50PPL Generation LLC* Suburban Generation Station c/o Martins Creek Oil CT 29.00PPL Generation LLC* West Shore Generating Station Oil CT 37.20PPL Generation LLC* Williamsport Generating Station Oil CT 32.00Procter & Gamble Mehoopany Plant Gas GT-S 53.00PSEG Power Peach Bottom Atomic Power St., Units 2&3 (50%) Nuclear ST-BWR 1145.00PSEG Power Keystone Generating Station (22.84%) Gas Oil IC/ST 391.00PSEG Power Conemaugh Power Plant (22.50%) Gas Oil IC/ST 385.00Rohm and Haas Co. Bristol Oil ST 1.50RRI Energy, Inc.* Blossburg Plant (Mothball Pending) Gas CT 19.00RRI Energy, Inc.* Brunot Island Generating Station Gas Oil CC/GT 289.00RRI Energy, Inc.* Cheswick Generating Station Coal Diesel ST 560.00RRI Energy, Inc.* Conemaugh Power Plant (16.45%) Coal Oil IC/ST 281.00RRI Energy, Inc.* Elrama Generating Station Coal ST 460.00RRI Energy, Inc.* Hamilton Generating Station Oil CT 20.00RRI Energy, Inc.* Hunterstown Generating Station Gas Diesel CC 870.00RRI Energy, Inc.* Keystone Generating Station (16.67%) Coal Oil IC/ST 284.00RRI Energy, Inc.* Mountain Generating Station Gas Oil GT 40.00RRI Energy, Inc.* New Castle Generating Station Coal Oil ST/IC 333.00RRI Energy, Inc.* Orrtanna Generating Station Oil GT 20.00RRI Energy, Inc.* Portland Generating Station Coal Gas GT/ST 570.00RRI Energy, Inc.* Seward Generating Station Waste Coal ST 525.00RRI Energy, Inc.* Shawnee Generating Station Oil GT 20.00RRI Energy, Inc.* Shawville Generating Station Coal Oil ST 603.00RRI Energy, Inc.* Titus Generating Station Coal Gas ST/GT 274.00RRI Energy, Inc.* Tolna Station Oil GT 39.00RRI Energy, Inc.* Warren Generating Station Gas Oil GT 68.00Schuylkill Energy Resources St Nicholas Cogeneration Plant Waste Coal ST-S 100.00Sithe Energies Inc. Allegheny Lock & Dam No. 8 Water HY 13.00Sithe Energies Inc. Allegheny Lock & Dam No. 9 Water HY 17.40Smurfit-Stone Container Corp. Philadelphia Container Plant Oil ST-S 10.00Solar Turbines Inc. York Solar Plant Gas CC 70.00Sunoco, Inc. Philadelphia Refinery Power Plant Other ST-S 30.00Temple University Temple Univ. Standby Electric Gen. Facility Gas IC-H 16.00UGI Energy Services Inc.* Conemaugh Generation Station (5.97%) Coal ST 102.00United States Steel Corp. (US Steel) Clairton USX B Plant Gas ST 219.75Veolia Energy North America, Inc. Grays Ferry Power Plant Gas CC 174.60Weyerhaeuser Co (WEYCO) Bradford (PA) Plant Coal Liq ST 52.00Wheelabrator Technologies Inc. (WTI) Wheelabrator Falls, Inc. Other ST 53.00Wheelabrator Technologies Inc. (WTI) Wheelabrator Frackville Energy Co. Waste Coal ST-S 48.00WM Renewable Energy Pottstown Plant Other GT 6.40Total MW in PA 46568.48*=verified dataRevised 6/10Source: Electric Power Generation AssociationMWElectric Power Outlook for <strong>Pennsylvania</strong> 2009-2014 93
Nuclear Power Plants in <strong>Pennsylvania</strong>Net Generation and Capacity (2008)Net Capacity Net Generation Capacity FactorPlant Name Unit (MW)(GWh) (%)Operator/OwnerBeaver Valley 1 892 7,945 101FirstEnergy Corp./FirstEnergy NuclearBeaver Valley 2 846 6,726 92Operating CompanyTotal 1,738 14,671 96Limerick 1 1,134 9,345 94Limerick 2 1,134 9,702 97 Exelon Generation/Exelon NuclearTotal 2,268 19,047 96Peach Bottom 2 1,112 8,717 89Peach Bottom 3 1,112 9,818 101 Exelon Generation/Dual Ownership (1)Total 2,224 18,535 95Susquehanna 1 1,149 8,984 89Susquehanna 2 1,140 10,056 100 PPL Susquehanna, LLC/Dual Ownership (2)Total 2,289 19,040 95Three Mile 1 786 7,365 107 Exelon Generation/Exelon Nuclear(1) Plant Ow ners, Peach Bottom, both Units: Exelon Nuclear (50%) and PSEG Pow er (50%).(2) Plant Ow ners, Susquehanna, both Units: PPL Susquehanna, LLC (90%) and Allegheny Electric Cooperative (10%)Source: Form EIA-860, "Annual Electric Generator <strong>Report</strong>," and Form EIA-906, "Pow er Plant <strong>Report</strong>."94<strong>Pennsylvania</strong> <strong>Public</strong> <strong>Utility</strong> <strong>Commission</strong>