40 DEVELOPMENTAL ASSETS - DHHR
40 DEVELOPMENTAL ASSETS - DHHR
40 DEVELOPMENTAL ASSETS - DHHR

Create successful ePaper yourself
Turn your PDF publications into a flip-book with our unique Google optimized e-Paper software.
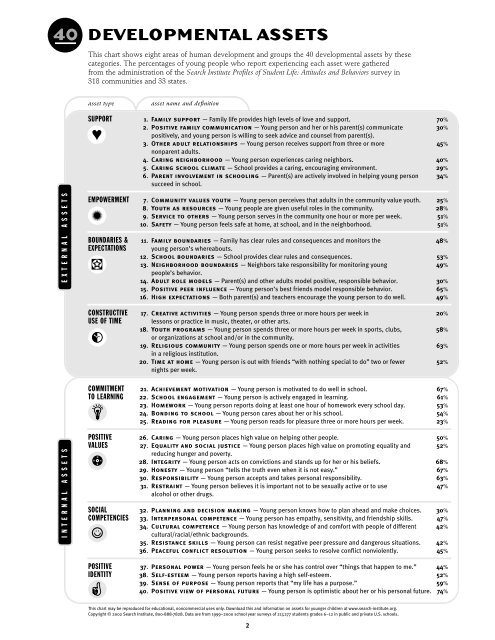
<strong>40</strong> <strong>DEVELOPMENTAL</strong> <strong>ASSETS</strong>This chart shows eight areas of human development and groups the <strong>40</strong> developmental assets by thesecategories. The percentages of young people who report experiencing each asset were gatheredfrom the administration of the Search Institute Profiles of Student Life: Attitudes and Behaviors survey in318 communities and 33 states.asset typeasset name and definitionSUPPORT 1. Family support — Family life provides high levels of love and support. 70%2. Positive family communication — Young person and her or his parent(s) communicate 30%♥positively, and young person is willing to seek advice and counsel from parent(s).3. Other adult relationships — Young person receives support from three or more 45%nonparent adults.4. Caring neighborhood — Young person experiences caring neighbors. <strong>40</strong>%5. Caring school climate — School provides a caring, encouraging environment. 29%6. Parent involvement in schooling — Parent(s) are actively involved in helping young person 34%succeed in school.E X T E R N A L A S S E T SEMPOWERMENT 7. Community values youth — Young person perceives that adults in the community value youth. 25%8. Youth as resources — Young people are given useful roles in the community. 28%9. Service to others — Young person serves in the community one hour or more per week. 51%10. Safety — Young person feels safe at home, at school, and in the neighborhood. 51%BOUNDARIES & 11. Family boundaries — Family has clear rules and consequences and monitors the 48%EXPECTATIONS young person’s whereabouts.12. School boundaries — School provides clear rules and consequences. 53%13. Neighborhood boundaries — Neighbors take responsibility for monitoring young 49%people’s behavior.14. Adult role models — Parent(s) and other adults model positive, responsible behavior. 30%15. Positive peer influence — Young person’s best friends model responsible behavior. 65%16. High expectations — Both parent(s) and teachers encourage the young person to do well. 49%CONSTRUCTIVE 17. Creative activities — Young person spends three or more hours per week in 20%USE OF TIMElessons or practice in music, theater, or other arts.18. Youth programs — Young person spends three or more hours per week in sports, clubs, 58%or organizations at school and/or in the community.19. Religious community — Young person spends one or more hours per week in activities 63%in a religious institution.20. Time at home — Young person is out with friends “with nothing special to do” two or fewer 52%nights per week.COMMITMENT 21. Achievement motivation — Young person is motivated to do well in school. 67%TO LEARNING 22. School engagement — Young person is actively engaged in learning. 61%23. Homework — Young person reports doing at least one hour of homework every school day. 53%24. Bonding to school — Young person cares about her or his school. 54%25. Reading for pleasure — Young person reads for pleasure three or more hours per week. 23%I N T E R N A L A S S E T SPOSITIVE 26. Caring — Young person places high value on helping other people. 50%VALUES 27. Equality and social justice — Young person places high value on promoting equality and 52%Nreducing hunger and poverty.W ES28. Integrity — Young person acts on convictions and stands up for her or his beliefs. 68%29. Honesty — Young person “tells the truth even when it is not easy.” 67%30. Responsibility — Young person accepts and takes personal responsibility. 63%31. Restraint — Young person believes it is important not to be sexually active or to use 47%alcohol or other drugs.SOCIAL 32. Planning and decision making — Young person knows how to plan ahead and make choices. 30%COMPETENCIES 33. Interpersonal competence — Young person has empathy, sensitivity, and friendship skills. 47%34. Cultural competence — Young person has knowledge of and comfort with people of different 42%cultural/racial/ethnic backgrounds.35. Resistance skills — Young person can resist negative peer pressure and dangerous situations. 42%36. Peaceful conflict resolution — Young person seeks to resolve conflict nonviolently. 45%POSITIVE 37. Personal power — Young person feels he or she has control over “things that happen to me.” 44%IDENTITY 38. Self-esteem — Young person reports having a high self-esteem. 52%39. Sense of purpose — Young person reports that “my life has a purpose.” 59%<strong>40</strong>. Positive view of personal future — Young person is optimistic about her or his personal future. 74%This chart may be reproduced for educational, noncommercial uses only. Download this and information on assets for younger children at www.search-institute.org.Copyright © 2002 Search Institute, 800-888-7828. Data are from 1999–2000 school year surveys of 217,277 students grades 6–12 in public and private U.S. schools.2
THE POWER OF <strong>ASSETS</strong>On one level, the <strong>40</strong> developmental assets represent common wisdom about the kinds of positiveexperiences and characteristics that young people need and deserve. But their value extends further.Surveys of more than 200,000 students in grades 6–12 reveal that assets are powerful influenceson adolescent behavior. Regardless of gender, ethnic heritage, economic situation, or geographic location,these assets both promote positive behaviors and attitudes and help protect young people from manydifferent problem behaviors.0–10 assets 11 – 20 assets 21 – 30 assets 31 – <strong>40</strong> assetsPROMOTING POSITIVE BEHAVIORS AND ATTITUDESOur research shows that the more assets students report having, the more likely they are to also report the followingpatterns of thriving behavior:50%65%77%85%26%47%69%89%36%57%74%88%8%17%30%47%EXHIBITS LEADERSHIPHas been a leader of anorganization or group in thepast 12 months.MAINTAINS GOOD HEALTHTakes good care of body(such as eating foods that arehealthy and exercisingregularly).VALUES DIVERSITYThinks it is important to get toknow people of other racial/ethnic groups.SUCCEEDS IN SCHOOLGets mostly A’s on report card(an admittedly high standard).PROTECTING YOUTH FROM HIGH-RISK BEHAVIORSAssets not only promote positive behaviors, they also protect young people: The more assets a young person reportshaving, the less likely he or she is to make harmful or unhealthy choices. (Note that these definitions are set ratherhigh, suggesting ongoing problems, not experimentation.)49%61%27%11%3%38%19%7%39%18%6%1%32%21%11%3%PROBLEM ALCOHOL USEHas used alcohol three or moretimes in the past 30 days or gotdrunk once or more in the pasttwo weeks.VIOLENCEHas engaged in three or moreacts of fighting, hitting, injuringa person, carrying a weapon,or threatening physical harm inthe past 12 months.ILLICIT DRUG USEUsed illicit drugs (marijuana,cocaine, LSD, PCP or angeldust, heroin, or amphetamines)three or more times in the past12 months.SEXUAL ACTIVITYHas had sexual intercoursethree or more times inlifetime.For more information: A Fragile Foundation: The State of Developmental Assets among American Youth; and Developmental Assets: A Synthesis of the Scientific Researchon Adolescent Development, both available from Search Institute.3
THECHALLENGEThe good news is that the assets are powerful and that everyone can build them (we call intentionallytrying to help youth develop these strengths building assets). The challenge for all of us is that mostyoung people aren’t experiencing enough of them.THE GAP IN <strong>ASSETS</strong> AMONG YOUTHWhile there is no “magic number” ofassets young people should have,our data indicate that 31 is a worthy,though challenging, benchmark forexperiencing their positive effects moststrongly. Yet, as this chart shows,only 9 percent of youth have 31or more assets. More than half have20 or fewer assets.21 – 30 assets 35%11 – 20 assets 41%9% 31 – <strong>40</strong> assets15% 0–10 assetsAVERAGE NUMBER OF <strong>ASSETS</strong> BY GENDER, GRADE,AND GEOGRAPHIC LOCATIONSearch Institute’s researchers havefound that, on average, youngpeople report having 19.3 assets.It may be tempting (and seem comforting)to think that your youth aredifferent because of where they live,the schools they attend, their gender orethnicity, and so on. But our researchshows that young people from all walksof life have too few assets.The chart here illustrates the overallconsistency in levels of assets amongboys and girls, younger youth andolder youth, and young people living inurban, out of urban, and rural areas.Overall, the average number of assetsstudents report experiencing doesnot vary much by race or ethnicity. Weare currently conducting analysesto learn how patterns of experiencewith specific assets may vary by race,ethnicity, and other demographiccategories.GENDERfemalesmalesGRADE6789101112GEOGRAPHIC LOCATIONurbanout of urbanrural20.717.823.121.119.618.317.818.118.319.4 [cities of at least 50,000]19.4 [towns of 2,500 to 49,999]19.2 [farm, country, reservation, towns under 2,500]0 5 10 15 20 25 30 35 <strong>40</strong> assets4