isoform-like proteins in marine euryhaline milkfish (Chanos
isoform-like proteins in marine euryhaline milkfish (Chanos
isoform-like proteins in marine euryhaline milkfish (Chanos

Create successful ePaper yourself
Turn your PDF publications into a flip-book with our unique Google optimized e-Paper software.
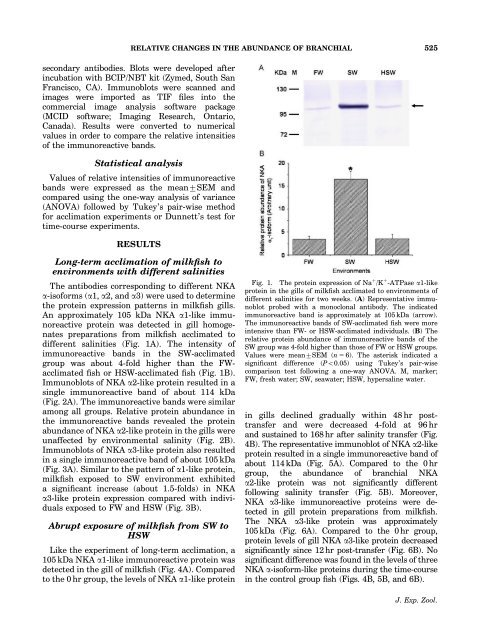
RELATIVE CHANGES IN THE ABUNDANCE OF BRANCHIAL 525secondary antibodies. Blots were developed after<strong>in</strong>cubation with BCIP/NBT kit (Zymed, South SanFrancisco, CA). Immunoblots were scanned andimages were imported as TIF files <strong>in</strong>to thecommercial image analysis software package(MCID software; Imag<strong>in</strong>g Research, Ontario,Canada). Results were converted to numericalvalues <strong>in</strong> order to compare the relative <strong>in</strong>tensitiesof the immunoreactive bands.Statistical analysisValues of relative <strong>in</strong>tensities of immunoreactivebands were expressed as the mean7SEM andcompared us<strong>in</strong>g the one-way analysis of variance(ANOVA) followed by Tukey’s pair-wise methodfor acclimation experiments or Dunnett’s test fortime-course experiments.RESULTSLong-term acclimation of <strong>milkfish</strong> toenvironments with different sal<strong>in</strong>itiesThe antibodies correspond<strong>in</strong>g to different NKAa-<strong>isoform</strong>s (a1, a2, and a3) were used to determ<strong>in</strong>ethe prote<strong>in</strong> expression patterns <strong>in</strong> <strong>milkfish</strong> gills.An approximately 105 kDa NKA a1-<strong>like</strong> immunoreactiveprote<strong>in</strong> was detected <strong>in</strong> gill homogenatespreparations from <strong>milkfish</strong> acclimated todifferent sal<strong>in</strong>ities (Fig. 1A). The <strong>in</strong>tensity ofimmunoreactive bands <strong>in</strong> the SW-acclimatedgroup was about 4-fold higher than the FWacclimatedfish or HSW-acclimated fish (Fig. 1B).Immunoblots of NKA a2-<strong>like</strong> prote<strong>in</strong> resulted <strong>in</strong> as<strong>in</strong>gle immunoreactive band of about 114 kDa(Fig. 2A). The immunoreactive bands were similaramong all groups. Relative prote<strong>in</strong> abundance <strong>in</strong>the immunoreactive bands revealed the prote<strong>in</strong>abundance of NKA a2-<strong>like</strong> prote<strong>in</strong> <strong>in</strong> the gills wereunaffected by environmental sal<strong>in</strong>ity (Fig. 2B).Immunoblots of NKA a3-<strong>like</strong> prote<strong>in</strong> also resulted<strong>in</strong> a s<strong>in</strong>gle immunoreactive band of about 105 kDa(Fig. 3A). Similar to the pattern of a1-<strong>like</strong> prote<strong>in</strong>,<strong>milkfish</strong> exposed to SW environment exhibiteda significant <strong>in</strong>crease (about 1.5-folds) <strong>in</strong> NKAa3-<strong>like</strong> prote<strong>in</strong> expression compared with <strong>in</strong>dividualsexposed to FW and HSW (Fig. 3B).Abrupt exposure of <strong>milkfish</strong> from SW toHSWLike the experiment of long-term acclimation, a105 kDa NKA a1-<strong>like</strong> immunoreactive prote<strong>in</strong> wasdetected <strong>in</strong> the gill of <strong>milkfish</strong> (Fig. 4A). Comparedto the 0 hr group, the levels of NKA a1-<strong>like</strong> prote<strong>in</strong>Fig. 1. The prote<strong>in</strong> expression of Na 1 /K 1 -ATPase a1-<strong>like</strong>prote<strong>in</strong> <strong>in</strong> the gills of <strong>milkfish</strong> acclimated to environments ofdifferent sal<strong>in</strong>ities for two weeks. (A) Representative immunoblotprobed with a monoclonal antibody. The <strong>in</strong>dicatedimmunoreactive band is approximately at 105 kDa (arrow).The immunoreactive bands of SW-acclimated fish were more<strong>in</strong>tensive than FW- or HSW-acclimated <strong>in</strong>dividuals. (B) Therelative prote<strong>in</strong> abundance of immunoreactive bands of theSW group was 4-fold higher than those of FW or HSW groups.Values were mean7SEM (n 5 6). The asterisk <strong>in</strong>dicated asignificant difference (Po0.05) us<strong>in</strong>g Tukey’s pair-wisecomparison test follow<strong>in</strong>g a one-way ANOVA. M, marker;FW, fresh water; SW, seawater; HSW, hypersal<strong>in</strong>e water.<strong>in</strong> gills decl<strong>in</strong>ed gradually with<strong>in</strong> 48 hr posttransferand were decreased 4-fold at 96 hrand susta<strong>in</strong>ed to 168 hr after sal<strong>in</strong>ity transfer (Fig.4B). The representative immunoblot of NKA a2-<strong>like</strong>prote<strong>in</strong> resulted <strong>in</strong> a s<strong>in</strong>gle immunoreactive band ofabout 114 kDa (Fig. 5A). Compared to the 0 hrgroup, the abundance of branchial NKAa2-<strong>like</strong> prote<strong>in</strong> was not significantly differentfollow<strong>in</strong>g sal<strong>in</strong>ity transfer (Fig. 5B). Moreover,NKA a3-<strong>like</strong> immunoreactive <strong>prote<strong>in</strong>s</strong> were detected<strong>in</strong> gill prote<strong>in</strong> preparations from <strong>milkfish</strong>.The NKA a3-<strong>like</strong> prote<strong>in</strong> was approximately105kDa (Fig. 6A). Compared to the 0hr group,prote<strong>in</strong> levels of gill NKA a3-<strong>like</strong> prote<strong>in</strong> decreasedsignificantly s<strong>in</strong>ce 12 hr post-transfer (Fig. 6B). Nosignificant difference was found <strong>in</strong> the levels of threeNKA a-<strong>isoform</strong>-<strong>like</strong> <strong>prote<strong>in</strong>s</strong> dur<strong>in</strong>g the time-course<strong>in</strong> the control group fish (Figs. 4B, 5B, and 6B).J. Exp. Zool.