Avoided Cost Comparison Levelized Cost of Energy ($/MWh)
Avoided Cost Comparison Levelized Cost of Energy ($/MWh) Avoided Cost Comparison Levelized Cost of Energy ($/MWh)
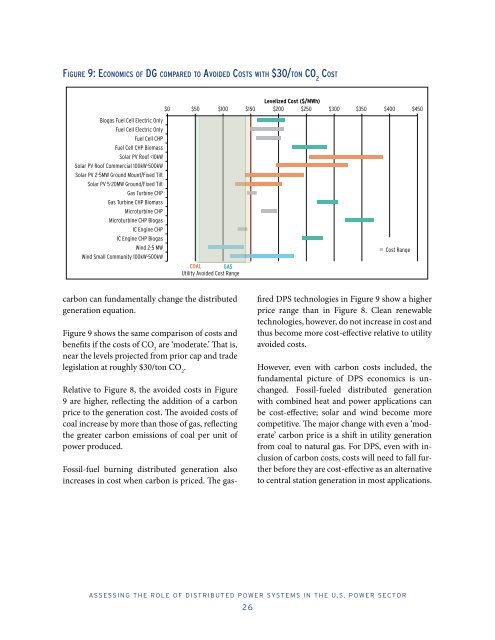
figure 9: economics of dg comPared To aVoided cosTs WiTh $30/Ton co 2 cosT Biogas Fuel Cell Electric Only Fuel Cell Electric Only Fuel Cell CHP Fuel Cell CHP Biomass Solar PV Roof
CHAPTER 3 security-relAted beneFits oF dPs The economic analysis in chapter 2 assessed the costs and benefits of DPS relative to centralized generation using a standard costcomparison model based on quantifiable inputs. This chapter attempts to assess one of the nonquantified aspect of DPS: its value to energy security. For the purposes of this paper, energy security is divided into two categories: • The security of the civilian grid with respect to intentional or unintentional disruption; and • The provision of energy to the U.S. military, both at domestic facilities and in front-line deployments. 3.1 Energy Security and the Civilian Grid Security and reliability of supply The U.S. economy is increasingly dependent on reliable electricity. The rapid computerization of many industry sectors such as health care, banking and commerce has resulted in an enormous increase in the need for reliable power. Between 2006 and 2011, the power consumption of all 63 “ENERGY STAR Data Center Energy Efficiency Initiatives.” (http://www.energystar.gov/index.cfm?c=prod_development.server_efficiency). 64 “Keeping the Lights On in a New World,” Electricity Advisory Committee Report to U.S. Department of Energy, January 2009. (http://energy. gov/sites/prod/files/oeprod/DocumentsandMedia/adequacy_report_01-09-09.pdf). 65 Adapted from: “Electrical Reliability,” Powervar: Solutions for Power Quality. (http://www.powervar.com/electrical-reliability.cfm). aSSESSIng THE ROlE OF dISTRIBuTEd POwER SySTEmS In THE u.S. POwER SECTOR 27 computer servers is estimated to increase from 61 billion kWh to 100 billion kWh. 63 Such an increase has added to the pressures on already stressed transmission infrastructure. 64 Electricity delivery is reliable only when supply perfectly matches demand. A perfectly reliable system would therefore be operating 8760 hours a year, 24 hours a day, 365 days a year. Power-system reliability is measured in levels of “9”s. Table 3 illustrates the length of outages associated with different levels of reliability. 65 Table 3: grid reliabiliTy and ouTage duraTion Reliability Outage Duration 99 percent 876 hours 99.9 percent 87.66 hours 99.99 percent 8.766 hours 99.999 percent 5.25 minutes 99.9999 percent 30 seconds 99.99999 percent 3 seconds According to the Galvin Electricity Initiative, the U.S. power sector is designed to run at a reliability of
- Page 1 and 2: Energy Security Initiative at BROOK
- Page 3 and 4: About The Brookings Energy Security
- Page 5 and 6: Acknowledgements The authors would
- Page 7 and 8: tAble oF contents LIST OF ACRONYMS.
- Page 9 and 10: list oF Acronyms ACEEE American Cou
- Page 11 and 12: executive summAry The U.S. power sy
- Page 13 and 14: introduction The U.S. power sector
- Page 15 and 16: • Chapters 2 and 3 assess the eco
- Page 17 and 18: were accorded the right to sell ene
- Page 19 and 20: on-site generation. 11 There is far
- Page 21 and 22: 1.3 Overview of DPS technology Dist
- Page 23 and 24: figure 2: disTribuTion of The Purch
- Page 25 and 26: uses an organic, low boiling point
- Page 27 and 28: can be used as energy storage, and
- Page 29 and 30: Similar to battery technologies, a
- Page 31 and 32: solar project. Known as “Project
- Page 33 and 34: CHAPTER 2 economic And environmentA
- Page 35 and 36: Table 2: lcoe financing assumPTions
- Page 37: figure 8: e3 analysis of economics
- Page 41 and 42: scale sources of renewable generati
- Page 43 and 44: total square footage occupied by th
- Page 45 and 46: The integration of DPS into militar
- Page 47 and 48: CHAPTER 4 current dPs Policy lAndsc
- Page 49 and 50: also avoid, reduce, or sequester ai
- Page 51 and 52: pendent System Operator 115 —and
- Page 53 and 54: • Microgrid, defined as “an int
- Page 55 and 56: In addition, states are potentially
- Page 57 and 58: Rules and Regulations Renewable Por
- Page 59 and 60: figure 10: groWing number of neT me
- Page 61 and 62: energy outputs of CHP will not be a
- Page 63 and 64: Permit Act, which will “limit sol
- Page 65 and 66: nancial markets like corporate stoc
- Page 67 and 68: are state renewable portfolio stand
- Page 69 and 70: Many respondents (mostly developers
- Page 71 and 72: Several IOUs pointed out the challe
- Page 73 and 74: more DPS-related information and kn
- Page 75 and 76: dent noted that the leveling of dem
- Page 77 and 78: to “pull” innovative and early
- Page 79 and 80: Net Metering and Interconnection Ad
- Page 81 and 82: Advocates of dynamic pricing saw it
- Page 83 and 84: ally—is the categorization and qu
- Page 85 and 86: CHAPTER 6 conclusions And recommend
- Page 87 and 88: DPS may have a positive impact on r
figure 9: economics <strong>of</strong> dg comPared To aVoided cosTs WiTh $30/Ton co 2 cosT<br />
Biogas Fuel Cell Electric Only<br />
Fuel Cell Electric Only<br />
Fuel Cell CHP<br />
Fuel Cell CHP Biomass<br />
Solar PV Ro<strong>of</strong>


