

Avoided Cost Comparison Levelized Cost of Energy ($/MWh)
Avoided Cost Comparison Levelized Cost of Energy ($/MWh)
Avoided Cost Comparison Levelized Cost of Energy ($/MWh)

Create successful ePaper yourself
Turn your PDF publications into a flip-book with our unique Google optimized e-Paper software.
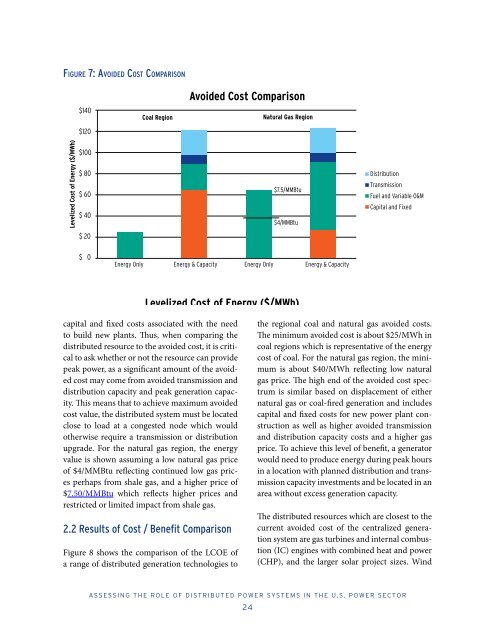
figure 7: aVoided cosT comParison<br />
<strong>Levelized</strong> <strong>Cost</strong> <strong>of</strong> <strong>Energy</strong> ($/<strong>MWh</strong>)<br />
$140<br />
$120<br />
$100<br />
$ 80<br />
$ 60<br />
$ 40<br />
$ 20<br />
$ 0<br />
<strong>Energy</strong> Only<br />
Coal Region<br />
<strong>Avoided</strong> <strong>Cost</strong> <strong>Comparison</strong><br />
<strong>Energy</strong> & Capacity <strong>Energy</strong> Only<br />
aSSESSIng THE ROlE OF dISTRIBuTEd POwER SySTEmS In THE u.S. POwER SECTOR<br />
24<br />
Natural Gas Region<br />
$7.5/MMBtu<br />
$4/MMBtu<br />
<strong>Levelized</strong> <strong>Cost</strong> <strong>of</strong> <strong>Energy</strong> ($/<strong>MWh</strong>)<br />
capital and fixed costs associated with the need<br />
to build new plants. Thus, when comparing the<br />
distributed resource to the avoided cost, it is critical<br />
to ask whether or not the resource can provide<br />
peak power, as a significant amount <strong>of</strong> the avoided<br />
cost may come from avoided transmission and<br />
distribution capacity and peak generation capacity.<br />
This means that to achieve maximum avoided<br />
cost value, the distributed system must be located<br />
close to load at a congested node which would<br />
otherwise require a transmission or distribution<br />
upgrade. For the natural gas region, the energy<br />
value is shown assuming a low natural gas price<br />
<strong>of</strong> $4/MMBtu reflecting continued low gas prices<br />
perhaps from shale gas, and a higher price <strong>of</strong><br />
$7.50/MMBtu which reflects higher prices and<br />
restricted or limited impact from shale gas.<br />
2.2 Results <strong>of</strong> <strong>Cost</strong> / Benefit <strong>Comparison</strong><br />
Figure 8 shows the comparison <strong>of</strong> the LCOE <strong>of</strong><br />
a range <strong>of</strong> distributed generation technologies to<br />
<strong>Energy</strong> & Capacity<br />
Distribution<br />
Transmission<br />
Fuel and Variable O&M<br />
Capital and Fixed<br />
the regional coal and natural gas avoided costs.<br />
The minimum avoided cost is about $25/<strong>MWh</strong> in<br />
coal regions which is representative <strong>of</strong> the energy<br />
cost <strong>of</strong> coal. For the natural gas region, the minimum<br />
is about $40/<strong>MWh</strong> reflecting low natural<br />
gas price. The high end <strong>of</strong> the avoided cost spectrum<br />
is similar based on displacement <strong>of</strong> either<br />
natural gas or coal-fired generation and includes<br />
capital and fixed costs for new power plant construction<br />
as well as higher avoided transmission<br />
and distribution capacity costs and a higher gas<br />
price. To achieve this level <strong>of</strong> benefit, a generator<br />
would need to produce energy during peak hours<br />
in a location with planned distribution and transmission<br />
capacity investments and be located in an<br />
area without excess generation capacity.<br />
The distributed resources which are closest to the<br />
current avoided cost <strong>of</strong> the centralized generation<br />
system are gas turbines and internal combustion<br />
(IC) engines with combined heat and power<br />
(CHP), and the larger solar project sizes. Wind