A Questionnaire to Evaluate the Knowledge and Attitudes of ... - IOV
A Questionnaire to Evaluate the Knowledge and Attitudes of ... - IOV
A Questionnaire to Evaluate the Knowledge and Attitudes of ... - IOV

You also want an ePaper? Increase the reach of your titles
YUMPU automatically turns print PDFs into web optimized ePapers that Google loves.
Vol. 33 No. 6 June 2007 <strong>Questionnaire</strong> on Pain <strong>Knowledge</strong>729Table 1Percentage <strong>of</strong> Correct Answers, Percentage <strong>of</strong> ‘‘Nei<strong>the</strong>r Agree Nor Disagree’’ Answers, <strong>and</strong> Missing Data<strong>of</strong> <strong>the</strong> Initial 21-Item <strong>Questionnaire</strong>Items in <strong>the</strong> <strong>Questionnaire</strong>Percentage <strong>of</strong>Correct Answers(95% CI)Percentage <strong>of</strong>‘‘Nei<strong>the</strong>rAgree NorDisagree’’AnswersPercentage<strong>of</strong>MissingData1. Giving narcotics on a regular schedule is preferred over ‘‘p.r.n.’’ schedule 81.1 (80.0e82.2) 7.9 0.3for continuous pain. (a)2. A patient should experience discomfort prior <strong>to</strong> giving <strong>the</strong> next dose <strong>of</strong> 45.2 (43.9e46.6) 15.4 0.8pain meds. (d)3. The preferred rule <strong>of</strong> administration <strong>of</strong> narcotic pain relievers <strong>to</strong> patients 55.8 (54.4e57.1) 25.1 1.4with pain is intramuscular. (d)4. When a patient requests increasing amounts <strong>of</strong> analgesics <strong>to</strong> control pain, 37.8 (36.4e39.1) 35.1 1.4this usually indicates that <strong>the</strong> patient is psychologically dependent. (d)5. Patients receiving narcotics on a ‘‘p.r.n.’’ basis may be likely <strong>to</strong> develop 40.0 (38.6e41.3) 21.8 1.0clock-watching behaviors. (a)6. The most accurate judge <strong>of</strong> <strong>the</strong> intensity <strong>of</strong> <strong>the</strong> patient’s pain is <strong>the</strong> 64.1 (62.8e65.4) 22.0 0.7patient. (a)7. When a patient in pain is receiving analgesic medication on a ‘‘p.r.n.’’ 39.5 (38.2e40.9) 20.6 1.0basis, it is appropriate for <strong>the</strong> patient <strong>to</strong> request pain meds before <strong>the</strong> painreturns. (a)8. Staff can always pick up cues from children that indicate that <strong>the</strong>y are in 46.4 (45.0e47.8) 28.6 1.3pain. (d)9. Because narcotics can cause respira<strong>to</strong>ry depression, <strong>the</strong>y should not be 37.2 (35.8e38.5) 32.7 2.2used in pediatric patients. (d)10. Children cry all <strong>the</strong> time, <strong>the</strong>refore, diversional activities are indicated 45.5 (44.1e46.9) 29.1 1.1ra<strong>the</strong>r than actual pain meds. (d)11. The most suitable dose <strong>of</strong> morphine for a patient in pain is a dose that 45.0 (43.6e46.4) 18.9 3.5best controls <strong>the</strong> symp<strong>to</strong>ms; <strong>the</strong>re is no maximum dose (i.e., a level thatmust not be exceeded) for morphine. (a)12. It may <strong>of</strong>ten be useful <strong>to</strong> give a placebo <strong>to</strong> a patient in pain <strong>to</strong> assess if he 24.3 (23.1e25.5) 14.7 2.7is genuinely in pain. (d)13. For effective treatment <strong>of</strong> cancer pain it is necessary <strong>to</strong> continuously assess 91.2 (90.4e92.0) 3.0 2.5<strong>the</strong> pain <strong>and</strong> <strong>the</strong> efficacy <strong>of</strong> <strong>the</strong> <strong>the</strong>rapy. (a)14. It is a patient’s right <strong>to</strong> expect <strong>to</strong>tal pain relief as a consequence <strong>of</strong> 70.9 (69.6e72.1) 14.9 2.8treatment. (a)15. Lack <strong>of</strong> pain expression does not mean lack <strong>of</strong> pain. (a) 83.5 (82.5e84.5) 7.3 2.616. Distraction, for example, by <strong>the</strong> use <strong>of</strong> music or relaxation, can decrease 67.4 (66.1e68.7) 20.0 2.6<strong>the</strong> perception <strong>of</strong> pain. (a)17. Estimation <strong>of</strong> pain by an M.D. or R.N. is as valid a measure <strong>of</strong> pain as 46.2 (44.8e47.6) 28.5 3.1a patient’s self-report. (d)18. Patients having severe chronic pain <strong>of</strong>ten need higher dosages <strong>of</strong> pain 46.6 (45.2e48.0) 24.5 3.4meds than patients with acute pain. (a)19. Increasing analgesic requirements are signs that <strong>the</strong> patient is becoming 25.0 (23.7e26.1) 34.7 2.7addicted <strong>to</strong> <strong>the</strong> narcotic. (d)20. If a patient (<strong>and</strong>/or family member) reports that a narcotic is causing 31.3 (30.0e32.6) 35.7 3.5euphoria, s/he should be given a lower dose <strong>of</strong> <strong>the</strong> analgesic. (d)21. 25% <strong>of</strong> patients receiving narcotics around <strong>the</strong> clock become addicted. 30.2 (28.9e31.4) 35.1 3.3(d)Total 50.2 (49.7e50.7) 22.7 2.0(a) ¼ Correct answer: ‘‘agree’’ or ‘‘strongly agree.’’(d) ¼ Correct answer: ‘‘disagree’’ or ‘‘strongly disagree.’’p.r.n. ¼ Pro re nataet al. study 6 (questions 1, 2, 4e10, 15e21), <strong>and</strong>five were prepared by <strong>the</strong> authors (questions 3,11e14).The questionnaire was h<strong>and</strong>ed <strong>to</strong> <strong>the</strong> headnurse <strong>of</strong> each hospital ward, who under<strong>to</strong>ok<strong>to</strong> give it <strong>to</strong> all <strong>the</strong> doc<strong>to</strong>rs <strong>and</strong> nurses in <strong>the</strong>ward; all were instructed <strong>to</strong> keep <strong>the</strong> questionnaireanonymous but <strong>to</strong> indicate <strong>the</strong>ir qualifications<strong>and</strong> <strong>the</strong> name <strong>of</strong> <strong>the</strong> ward. Thequestionnaire was <strong>to</strong> be completed quickly,without consulting medical texts.Psychometric AnalysisIn developing a scale from <strong>the</strong> initial questionnaire,we considered one sequence <strong>of</strong> explora<strong>to</strong>ry<strong>and</strong> confirma<strong>to</strong>ry analysis in threephases.
730 Zanolin et al.Vol. 33 No. 6 June 2007Principal Component Analysis Phase. To identify<strong>the</strong> number <strong>of</strong> <strong>the</strong> underlying components <strong>of</strong><strong>the</strong> initial questionnaire, <strong>the</strong> Pearson’s correlationmatrix was explored by means <strong>of</strong> PrincipalComponent Analysis (PCA); 19 items weaklycorrelated with o<strong>the</strong>rs (r < 0.15) had been previouslyexcluded from this analysis. The number<strong>of</strong> components was determined on <strong>the</strong>basis <strong>of</strong> eigenvalues <strong>of</strong> <strong>the</strong> correlation matrixgreater than 1, <strong>and</strong> by looking for sharp breaksin <strong>the</strong> size <strong>of</strong> <strong>the</strong> eigenvalues using a scree plot.Varimax rotation <strong>and</strong> item-component correlations,i.e., ‘‘component loading,’’ greater than0.32, in absolute value, were chosen <strong>to</strong> identifya simple component structure.Multiple Correspondence Analysis Phase. MultipleCorrespondence Analysis (MCA) or HomogeneityAnalysis (HOMALS) 20 is designed <strong>to</strong>test <strong>the</strong> items’ internal homogeneity <strong>and</strong> reliability<strong>and</strong> <strong>the</strong> Likert equidistance <strong>of</strong> <strong>the</strong>item option responses for each dimension <strong>of</strong><strong>the</strong> PCA. This method uses <strong>the</strong> Likert pointsas nominal categories responses <strong>and</strong> enablesoptimal grading for each category response<strong>of</strong> <strong>the</strong> Likert questions (called ‘‘optimalweights’’); consequently, an ‘‘optimal score’’for each subject could be obtained. The optimalscore <strong>of</strong> a subject is <strong>the</strong> sum <strong>of</strong> <strong>the</strong> optimalweights <strong>of</strong> <strong>the</strong> item options chosen. According<strong>to</strong> <strong>the</strong> criterion <strong>of</strong> <strong>the</strong> internal consistency,MCA computes a homogeneity index (called‘‘Guttman’s eta’’), <strong>and</strong> <strong>the</strong> ‘‘optimal reliability’’determined by Cronbach’s alpha coefficient isa one-<strong>to</strong>-one transformation <strong>of</strong> Guttman’s eta.Good internal consistency has been suggestedif Cronbach’s alpha exceeds 0.70, <strong>and</strong> good homogeneityhas been suggested if Guttman’s etavalue exceeds 0.30. The assumed equidistanceacross Likert points is checked by plotting <strong>the</strong>optimal weights vs. Likert points (called ‘‘transformationplot’’); we should expect a straightlineplot for each item if equidistance is acorrect assumption.Confirma<strong>to</strong>ry Fac<strong>to</strong>r Analysis Phase. A Confirma<strong>to</strong>ryFac<strong>to</strong>r Analysis (CFA) 19 model withone fac<strong>to</strong>r is fitted, considering Likert or optimalpoints <strong>of</strong> <strong>the</strong> item option responses set foreach dimension <strong>of</strong> PCA. The construct validity<strong>of</strong> <strong>the</strong> assumed unidimensionality is evaluatedfrom <strong>the</strong> CFA model fitting solution by <strong>the</strong>St<strong>and</strong>ardized Root Mean Squared Residual(SRMR) index; this measures <strong>the</strong> residual reduction<strong>of</strong> <strong>the</strong> model (mis)fit as one fac<strong>to</strong>r isadded <strong>to</strong> <strong>the</strong> null model <strong>of</strong> uncorrelated items.Unidimesionality is suggested if SRMR index isless than roughly 0.05. Item-fac<strong>to</strong>r correlations,i.e., ‘‘fac<strong>to</strong>r loading,’’ <strong>and</strong> McDonald’somega reliability 21 are also computed. Correlations>0.32 in absolute value <strong>and</strong> omega >0.70are <strong>the</strong> chosen cut <strong>of</strong>fs <strong>to</strong> corroborateunidimensionality.New <strong>Questionnaire</strong>Once <strong>the</strong> new questionnaire had been designed,results according <strong>to</strong> <strong>the</strong> new versionwere computed considering both <strong>the</strong> correct/incorrectmodality <strong>and</strong> <strong>the</strong> score <strong>of</strong> answers.In <strong>the</strong> latter case, missing datareferring <strong>to</strong> any single item were assigned <strong>the</strong>value <strong>of</strong> <strong>the</strong> median <strong>of</strong> all <strong>the</strong> subjects, <strong>and</strong>a st<strong>and</strong>ardized score was calculated as summatedscore/maximum score, expressed asa percentage, with 100% indicating <strong>the</strong> mostfavorable level <strong>of</strong> ‘‘knowledge <strong>and</strong> attitudes <strong>to</strong>ward<strong>the</strong> approach <strong>and</strong> treatment <strong>of</strong> pain’’ <strong>and</strong>0% <strong>the</strong> least favorable. Differences in scoresbetween pr<strong>of</strong>essional categories (physicians<strong>and</strong> nurses), hospital departments (Anes<strong>the</strong>siology<strong>and</strong> Emergency, Medicine, Surgery, <strong>and</strong>o<strong>the</strong>r departments), <strong>and</strong> geographical zones(nor<strong>the</strong>rn, central, <strong>and</strong> sou<strong>the</strong>rn Italy) weretested through ANOVA. Descriptive data analyses<strong>and</strong> PCA/MCA were performed using SPSSs<strong>of</strong>tware, version 13.0 (http://www.spss.com),<strong>and</strong> CFA was provided by Mplus s<strong>of</strong>tware,version 3.13 (http://www.statmodel.com).ResultsCorrect Answer Distribution <strong>of</strong> <strong>the</strong> Initial<strong>Questionnaire</strong>The overall percentage <strong>of</strong> correct answers <strong>of</strong><strong>the</strong> 4,961 caregivers who completed <strong>the</strong> initialquestionnaire was 50.2% (95% Confidence Interval[CI]: 49.7%e50.7%), corresponding <strong>to</strong>an average number <strong>of</strong> correct answers <strong>of</strong>10.5/21 (Table 1). The question with <strong>the</strong> highestpercentage <strong>of</strong> correct answers (91.2%) wasq13 (‘‘For effective treatment <strong>of</strong> cancer pain, itis necessary <strong>to</strong> continuously assess <strong>the</strong> pain <strong>and</strong><strong>the</strong> efficacy <strong>of</strong> <strong>the</strong> <strong>the</strong>rapy’’ [<strong>the</strong> correct answeris ‘‘agree’’]). The question with <strong>the</strong> lowest
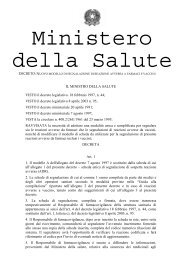
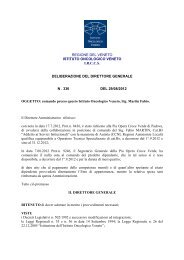
Vol. 33 No. 6 June 2007 <strong>Questionnaire</strong> on Pain <strong>Knowledge</strong>731number <strong>of</strong> correct answers was q12 (‘‘It may <strong>of</strong>tenbe useful <strong>to</strong> give a placebo <strong>to</strong> a patient inpain <strong>to</strong> assess if he is genuinely in pain’’ [<strong>the</strong>correct answer is ‘‘disagree’’]). In Table 1, <strong>the</strong>percentage <strong>of</strong> missing answers is also shown:it tends <strong>to</strong> be higher from q11 onward, because<strong>the</strong> questions were written on <strong>the</strong> back<strong>of</strong> each page <strong>of</strong> <strong>the</strong> questionnaire <strong>and</strong> perhapssome interviewees did not see <strong>the</strong>m.There was a statistically significant difference(P < 0.001) in <strong>the</strong> number <strong>of</strong> correct answersbetween doc<strong>to</strong>rs (12/21; 57.3%) <strong>and</strong>nurses (10/21; 47.6%). There were also statisticallysignificant differences (P > 0.001) betweenAnes<strong>the</strong>siology <strong>and</strong> Emergency (11.6/21; 55.2%), with <strong>the</strong> highest mean score, <strong>and</strong>o<strong>the</strong>r departments (10.6/21; 50.5%), Medicine(10.5/21; 50.2%), <strong>and</strong> Surgery (10.2/21;48.7%). The highest percentage <strong>of</strong> correctanswers was reached in central Italy (11.0/21;52.1%), followed by sou<strong>the</strong>rn Italy (10.5/21; 50.1%) <strong>and</strong> nor<strong>the</strong>rn Italy (10.2/21;48.7%). These differences were again statisticallysignificant (P < 0.001). Questions 4, 9,19, 20, <strong>and</strong> 21 present <strong>the</strong> highest percentage<strong>of</strong> ‘‘nei<strong>the</strong>r agree nor disagree’’ answers.Psychometric AnalysisConsidering <strong>the</strong> correlation matrix between<strong>the</strong> items <strong>of</strong> <strong>the</strong> initial questionnaire, sevenquestions (q5, q6, q7, q11, q14, <strong>and</strong> q18)were excluded from <strong>the</strong> PCA as <strong>the</strong>y wereweakly correlated (r < 0.15) with <strong>the</strong> vast majority<strong>of</strong> <strong>the</strong> o<strong>the</strong>r items. As q19 was almostequal <strong>to</strong> q4 (r ¼ 0.44), it was also excluded.PCA identified two dominant components(eigenvalues > 1), explaining 33% <strong>of</strong> <strong>the</strong> <strong>to</strong>talvariance <strong>and</strong> 60% <strong>of</strong> <strong>the</strong> pairwise correlations<strong>of</strong> <strong>the</strong> 14 questions examined. Componentloading patterns, after Varimax orthogonal rotation<strong>of</strong> <strong>the</strong> correlation matrix, are shown inTable 2. The first component includes 10 itemsabout ‘‘<strong>the</strong> knowledge <strong>and</strong> attitudes <strong>to</strong>wardpain <strong>of</strong> <strong>the</strong> health care providers’’; <strong>the</strong> secondcomponent includes four items containingquestions with a high percentage <strong>of</strong> correct answersthat are not particularly useful for <strong>the</strong>identification <strong>of</strong> a valuable dimension, <strong>and</strong><strong>the</strong>refore, has not been considered in <strong>the</strong> followingMCA/CFA phases. These results are<strong>the</strong> same as those obtained when doc<strong>to</strong>rs’<strong>and</strong> nurses’ data were analyzed separately.ItemTable 2Component Loadings aPrincipalComponent 1PrincipalComponent 2Uniquenessq1 0.137 0.529 0.580q2 0.529 0.171 0.662q3 0.494 0.182 0.712q4 0.636 0.067 0.586q8 0.334 0.098 0.516q9 0.606 0.056 0.628q10 0.618 0.061 0.614q12 0.541 0.233 0.601q13 0.048 0.744 0.441q15 0.043 0.685 0.499q16 0.089 0.617 0.607q17 0.335 0.004 0.457q20 0.530 0.013 0.719q21 0.531 0.051 0.707Eigenvalue 2.850 1.763Proportion 0.203 0.125Cumulative 0.204 0.330a Correlations between items <strong>and</strong> principal components after Varimaxrotation.Numbers in bold indicate items with loadings > 0.32.The internal criterion index (Guttman’s eta)<strong>of</strong> <strong>the</strong> MCA scaling was equal <strong>to</strong> 0.285, <strong>and</strong> <strong>the</strong>Cronbach’s alpha coefficient was 0.722, indicatingan ‘‘acceptable’’ optimal scaling.The MCA optimal weights are reported inTable 3 <strong>and</strong> displayed in Fig. 1. The transformationplot <strong>of</strong> <strong>the</strong> optimal weights shows thatall <strong>of</strong> <strong>the</strong> items describe a straight line (arein a linear form), <strong>and</strong> <strong>the</strong>refore, <strong>the</strong> Likertequidistance assumption was respected. Thus,<strong>the</strong> original Likert points from 1 <strong>to</strong> 5 were retainedfor <strong>the</strong> 10 selected items, <strong>and</strong> in <strong>the</strong>CFA phase <strong>the</strong> items were processed as continuousvariables. McDonald’s omega index wasequal <strong>to</strong> 0.708, indicating an acceptable reliability,<strong>and</strong> <strong>the</strong> SRMR index was equal <strong>to</strong>0.03, i.e., <strong>the</strong> assumption <strong>of</strong> conditional itemsindependence given <strong>the</strong> unidimensional instrumentwas supported.Raw item-<strong>to</strong>tal score correlations variedfrom 0.61 (q4) <strong>to</strong> 0.40 (q17) (Table 4). Thesame trend was found for <strong>the</strong> optimal item<strong>to</strong>talscore correlations (from 0.65 <strong>of</strong> q4 <strong>to</strong>0.36 <strong>of</strong> q17), <strong>and</strong> it was similar for item-fac<strong>to</strong>rcorrelations (from 0.58 <strong>of</strong> q10 <strong>to</strong> 0.23 <strong>of</strong> q17).This suggests that <strong>the</strong> sum row scores or <strong>the</strong> sumoptimal scores were good values <strong>of</strong> <strong>the</strong> ‘‘true’’scores <strong>of</strong> <strong>the</strong> continuous unidimensional fac<strong>to</strong>runderlying <strong>the</strong> 10-item set called ‘‘pain knowledge<strong>and</strong> attitudes’’ (PAK) that health care providersmight have <strong>to</strong>ward patients.
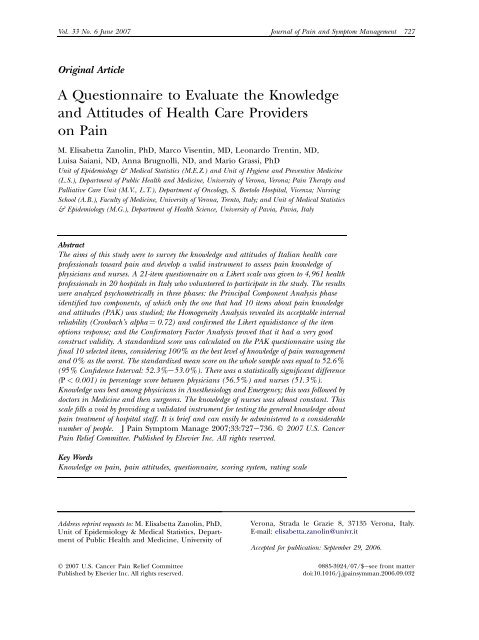
732 Zanolin et al.Vol. 33 No. 6 June 2007Table 3MCA/HOMALS Optimal Weights <strong>of</strong> <strong>the</strong> Selected 10 Likert Items <strong>of</strong> <strong>the</strong> PAK <strong>Questionnaire</strong>q2 q3 q4 q8 q9 q10 q12 q17 q20 q211 0.93 0.80 1.21 0.84 1.43 1.04 1.32 0.78 0.83 1.322 0.40 0.30 0.60 0.27 0.57 0.50 0.59 0.28 0.60 0.563 0.24 0.25 0.11 0.16 0.13 0.24 0.20 0.21 0.02 0.054 0.37 0.73 0.66 0.31 0.59 0.66 0.21 0.31 0.50 0.415 1.13 1.67 1.68 1.30 1.39 1.45 0.95 1.22 1.58 1.81Mean 0 0 0 0 0 0 0 0 0 0Variance 0.31 0.28 0.42 0.15 0.38 0.38 0.26 0.13 0.27 0.28Description <strong>of</strong> <strong>the</strong> PAK Scale ScoresThe mean number <strong>of</strong> correct answers for <strong>the</strong>selected 10 items <strong>of</strong> <strong>the</strong> PAK scale was 4.0/10(40%; CI: 39.3%e40.6%); physicians had47.7% <strong>of</strong> correct answers <strong>and</strong> nurses 37.2%(P < 0.001). Anes<strong>the</strong>siology <strong>and</strong> Emergencyscored 46.9%, followed by o<strong>the</strong>r departmentswith 42.1%, Medicine 39.8%, <strong>and</strong> Surgery38.0% (P < 0.001).When considering <strong>the</strong> PAK questionnaireon <strong>the</strong> st<strong>and</strong>ard scale from 0 (least favorableattitude) <strong>to</strong> 100 (most favorable attitude), <strong>the</strong>st<strong>and</strong>ardized mean score (Table 5) calculatedon <strong>the</strong> whole sample was equal <strong>to</strong> 52.6% (CI:52.3%e53.0%). The difference between <strong>the</strong>percentage score <strong>of</strong> physicians (56.5%) <strong>and</strong>nurses (51.3%) was statistically significant(P < 0.001), as was <strong>the</strong> difference between Anes<strong>the</strong>siology<strong>and</strong> Emergency (56.1%, <strong>the</strong> highestpercentage), <strong>and</strong> o<strong>the</strong>r departments(54.8%), Medicine (52.6%), <strong>and</strong> Surgery(51.6%; P < 0.001). Significant differences alsowere observed among nor<strong>the</strong>rn, central (<strong>the</strong>highest percentage), <strong>and</strong> sou<strong>the</strong>rn Italy (<strong>the</strong>lowest). A significant interaction (P < 0.001)between hospital departments <strong>and</strong> pr<strong>of</strong>essionalstaff was found (Table 5): There was a decreasein knowledge between physicians in Anes<strong>the</strong>siology<strong>and</strong> Emergency, followed by doc<strong>to</strong>rs inMedicine <strong>and</strong> <strong>the</strong>n physicians in Surgery,whereas <strong>the</strong> knowledge <strong>of</strong> nurses remainedalmost constant.DiscussionThis study provides an overview <strong>of</strong> <strong>the</strong> pr<strong>of</strong>essionalpreparation <strong>and</strong> attitudes <strong>of</strong> physicians<strong>and</strong> nursing staff in Italy with regard <strong>to</strong>pain. Moreover, through <strong>the</strong> data collected,a reliable <strong>and</strong> valid instrument <strong>to</strong> assess <strong>the</strong>pain knowledge <strong>of</strong> health pr<strong>of</strong>essionals hasOptimal quantification2,01,51,00,50,0-0,5-1,0q2q3q4q8q9q10q12q17q20q21-1,5-2,01 2 3 4 5Likert pointsFig. 1. Transformation plots <strong>of</strong> <strong>the</strong> selected 10 Likert items <strong>of</strong> <strong>the</strong> PAK questionnaire.
Vol. 33 No. 6 June 2007 <strong>Questionnaire</strong> on Pain <strong>Knowledge</strong>733Table 4Raw <strong>and</strong> Optimal Item-Total Correlations, <strong>and</strong>Item-Fac<strong>to</strong>r Correlation <strong>of</strong> <strong>the</strong> Selected 10 LikertItems <strong>of</strong> <strong>the</strong> PAK <strong>Questionnaire</strong>ItemsRaw Item-TotalCorrelationOptimal Item-Total CorrelationItem-Fac<strong>to</strong>rCorrelationq2 0.572 0.555 0.457q3 0.518 0.530 0.431q4 0.608 0.647 0.572q8 0.415 0.382 0.274q9 0.585 0.618 0.563q10 0.596 0.620 0.577q12 0.516 0.507 0.442q17 0.401 0.355 0.227q20 0.505 0.517 0.423q21 0.509 0.534 0.431Reliability 0.703 0.722 0.708been developed. Participation in <strong>the</strong> study wason a voluntary basis. However, we believe that<strong>the</strong> high number <strong>of</strong> participants <strong>and</strong> <strong>the</strong> location<strong>of</strong> <strong>the</strong> hospitals in different regions <strong>of</strong> <strong>the</strong>country make <strong>the</strong> results representative <strong>of</strong> <strong>the</strong>Italian situation. Fur<strong>the</strong>rmore, newly collecteddata from o<strong>the</strong>r hospitals in Italy (Zanolin,data not published), obtained by using <strong>the</strong>same initial questionnaire, seem <strong>to</strong> be veryTable 5Mean (SD) <strong>of</strong> PAK St<strong>and</strong>ard Score (Percentage<strong>of</strong> Maximum <strong>Knowledge</strong>) <strong>of</strong> Health CareProviders (n ¼ 4,961) by Hospital Location,Pr<strong>of</strong>ession, <strong>and</strong> Hospital DepartmentPr<strong>of</strong>ession aPhysicians(n ¼ 1,348)Nurses(n ¼ 3,457) TotalHospital departmentsSurgery 53.0 (12.3) 51.0 (12.5) 51.6 (12.5)(n ¼ 1,931)Medicine 56.9 (12.9) 51.1 (11.6) 52.6 (12.4)(n ¼ 2,363)Anes<strong>the</strong>siology 63.8 (13.0) 52.5 (13.3) 56.1 (14.1)(n ¼ 575)O<strong>the</strong>r56.6 (14.0) 54.5 (11.5) 54.8 (12.5)departments(n ¼ 90)Hospital locationsNor<strong>the</strong>rn Italy 56.5 (12.7) 51.9 (11.3) 53.1 (12.0)(n ¼ 2499)Central Italy 57.5 (13.3) 52.4 (12.1) 53.7 (12.6)(n ¼ 1880)Sou<strong>the</strong>rn Italy(n ¼ 582)52.9 (14.1) 45.5 (14.2) 47.4 (14.6)Total (n ¼ 4,961) 56.5 (13.2) 51.3 (12.2) 52.6 (12.7)P < 0.001 for <strong>the</strong> differences in hospital departments, hospitallocations, <strong>and</strong> pr<strong>of</strong>essional categories.P < 0.001 for <strong>the</strong> interaction between pr<strong>of</strong>essional categories <strong>and</strong>hospital departments.a 156 cases <strong>of</strong> pr<strong>of</strong>essional data missing.similar <strong>to</strong> <strong>the</strong> findings presented here. Thisconfirms that <strong>the</strong> findings <strong>of</strong> this study canbe generalized <strong>to</strong> fit most hospital healthpr<strong>of</strong>essionals working in Italy.The Initial <strong>Questionnaire</strong>The overall percentage <strong>of</strong> correct answerswas 51.2%. This does not greatly differ from<strong>the</strong> results published by Lebovits et al., 6 whoconducted a study in three New York City hospitalsusing a 15-item questionnaire that wasvery similar <strong>to</strong> ours. Out <strong>of</strong> 686 nurses, physicians,pharmacists, <strong>and</strong> medical <strong>and</strong> nursingstudents, 56% correct answers were obtained.In a previous study, <strong>the</strong> authors found 61%correct answers in one single hospital in Italy, 9after administering a very similar 16-item questionnaire<strong>to</strong> hospital staff.After analyzing <strong>the</strong> answers <strong>to</strong> individualquestions, <strong>the</strong> highest percentages <strong>of</strong> correctanswers refer <strong>to</strong> <strong>the</strong> basic problems <strong>of</strong> interpretation<strong>and</strong> pain treatment: continuous symp<strong>to</strong>massessment (q13), individual differencesin expressing pain (q15), <strong>and</strong> administration<strong>of</strong> drugs at fixed times (q1). However, <strong>the</strong> lowestpercentages refer <strong>to</strong> <strong>the</strong> misinterpretation<strong>of</strong> <strong>the</strong> placebo effect (q12) <strong>and</strong> mistaken beliefslinked <strong>to</strong> <strong>the</strong> danger <strong>of</strong> drug addiction(q19 <strong>and</strong> q21). These results are similar <strong>to</strong>those obtained in <strong>the</strong> study conducted in a singlehospital in Italy, 9 although <strong>the</strong>y are slightlylower. On one h<strong>and</strong>, <strong>the</strong>y seem <strong>to</strong> indicate that<strong>the</strong>re is considerable awareness <strong>to</strong>ward a patientin pain, but on <strong>the</strong> o<strong>the</strong>r h<strong>and</strong>, <strong>the</strong>re isan important lack <strong>of</strong> preparative training in<strong>the</strong> case <strong>of</strong> pharmacological treatment.In <strong>the</strong> present study, <strong>the</strong>re was a statisticallysignificant difference between percentages <strong>of</strong>correct answers <strong>of</strong> <strong>the</strong> different pr<strong>of</strong>essionalgroups (physicians 58.1% vs. nurses 48.7%).This difference was also noticed by Lebovitset al. 6 <strong>and</strong> Visentin et al. 9 <strong>and</strong> could be due<strong>to</strong> <strong>the</strong> lack <strong>of</strong> adequate training programs fornurses. The difference in answers between pr<strong>of</strong>essionalsworking in different specialist fieldsalso was significant from a statistical point <strong>of</strong>view: Correct answers were more frequentamong staff from intensive care departments<strong>and</strong> medical wards compared <strong>to</strong> surgical departments(similar findings were reported byLebovits et al. 6 <strong>and</strong> Visentin et al. 9 ).The percentage <strong>of</strong> correct answers was significantlyhigher in central Italy with respect
734 Zanolin et al.Vol. 33 No. 6 June 2007<strong>to</strong> those obtained in <strong>the</strong> north <strong>and</strong> <strong>the</strong> south,which was probably due <strong>to</strong> <strong>the</strong> presence <strong>of</strong>a higher number <strong>of</strong> small-sized hospitals takingpart in <strong>the</strong> survey. In <strong>the</strong>se kinds <strong>of</strong> hospitals,<strong>the</strong> staff is usually less stressed by o<strong>the</strong>rcommitments <strong>and</strong> can dedicate more time <strong>to</strong>pain management, which is not usually considereda priority. Moreover, sensitization <strong>to</strong> paincan easily reach a greater percentage <strong>of</strong> <strong>the</strong>hospital staff in smaller environments. Thelower percentage <strong>of</strong> correct responses in<strong>the</strong> south <strong>of</strong> Italy is not surprising, as hospitalsin that part <strong>of</strong> <strong>the</strong> country are not commonlyconsidered at <strong>the</strong> same level as <strong>the</strong> rest <strong>of</strong><strong>the</strong> country. Never<strong>the</strong>less, <strong>the</strong> <strong>to</strong>tal overall percentage<strong>of</strong> correct answers was low, revealing<strong>the</strong> necessity <strong>to</strong> implement training coursesspecifically for <strong>the</strong> fields suggested by <strong>the</strong> questionswith <strong>the</strong> worst response rates.Psychometric AnalysisDuring <strong>the</strong> psychometric analysis, some questionswere excluded, as <strong>the</strong>y were weakly correlatedwith <strong>the</strong> o<strong>the</strong>rs, <strong>and</strong> q19, which was verysimilar <strong>to</strong> q4, was not included. The PCA outputrevealed that <strong>the</strong> initial questionnaire was notunidimensional, but it was made up <strong>of</strong> two components.Only <strong>the</strong> first one, ‘‘knowledge <strong>and</strong>attitudes <strong>to</strong>ward <strong>the</strong> treatment <strong>of</strong> pain,’’accounting for <strong>the</strong> greatest explained <strong>to</strong>tal variance/pairwisecorrelations, was considered in<strong>the</strong> MCA/CFA scaling assessment. Ano<strong>the</strong>r reasonfor excluding <strong>the</strong> second component wasthat it only contained four questions witha high percentage <strong>of</strong> correct answers, <strong>and</strong> soit was not very useful for <strong>the</strong> aim <strong>of</strong> our study.A relatively good internal homogeneity wasfound for this set <strong>of</strong> 10 items after MCA scaling,as Guttman’s eta was equal <strong>to</strong> 0.285, whichis close <strong>to</strong> <strong>the</strong> 0.30 value that is considered <strong>the</strong>cut <strong>of</strong>f for good homogeneity. Cronbach’s alphacoefficient was 0.72, denoting a good reliability,as it exceeded <strong>the</strong> value <strong>of</strong> 0.70 <strong>and</strong>indicated a low degree <strong>of</strong> error in measuring<strong>the</strong> characteristic <strong>of</strong> interest. As far as <strong>the</strong> internalhomogeneity is concerned, most itemswere referred ei<strong>the</strong>r <strong>to</strong> <strong>the</strong> medical knowledge<strong>of</strong> analgesic use (q2, q3, q9, <strong>and</strong> q12) or <strong>to</strong>prejudice about presumed misuse (q4, q10,q20, <strong>and</strong> q21), whereas q8 <strong>and</strong> q17 dealt withpain assessment <strong>of</strong> health pr<strong>of</strong>essionals withrespect <strong>to</strong> patient perception, which could perhapslead <strong>to</strong> a decrease in homogeneity.Questions 8 <strong>and</strong> 17 are less correlated <strong>to</strong> <strong>the</strong><strong>to</strong>tal score than <strong>the</strong> o<strong>the</strong>r items (Table 3),which is probably due <strong>to</strong> <strong>the</strong> fact that <strong>the</strong>setwo questions are slightly different from <strong>the</strong>o<strong>the</strong>rs, confirming <strong>the</strong>ir contribution <strong>to</strong> <strong>the</strong>decrease in homogeneity. The MCA methodalso makes it possible <strong>to</strong> test <strong>the</strong> equidistanceacross <strong>the</strong> Likert points within each question.This was confirmed for all <strong>of</strong> <strong>the</strong> items, revealingthat <strong>the</strong>re was no necessity <strong>to</strong> use optimalscaling scores.Finally, through CFA we could evaluate constructvalidity: The SRMR index was less than0.05, indicating that all <strong>of</strong> <strong>the</strong> items are linked<strong>to</strong> a unique underlying fac<strong>to</strong>r (dimension),<strong>and</strong>, <strong>the</strong>refore, this scale presents very goodconstruct validity. McDonald’s omega confirms<strong>the</strong> acceptable reliability <strong>of</strong> <strong>the</strong> reduced questionnaire(PAK).The question with <strong>the</strong> best item-<strong>to</strong>tal <strong>and</strong>optimal scoring-<strong>to</strong>tal correlation was q4, followedby q10, which was <strong>the</strong> best for itemfac<strong>to</strong>rcorrelation. On <strong>the</strong> contrary, as alreadymentioned, <strong>the</strong> questions presenting a loweritem-<strong>to</strong>tal correlation were q17 <strong>and</strong> q8, probablydue <strong>to</strong> <strong>the</strong> slightly different conten<strong>to</strong>rientation.The PAK Scale ScoresThe mean number <strong>of</strong> correct answers <strong>of</strong> <strong>the</strong>10-item PAK questionnaire was 10% lower withrespect <strong>to</strong> <strong>the</strong> initial questionnaire, becausemost <strong>of</strong> <strong>the</strong> items with <strong>the</strong> highest percentage<strong>of</strong> correct response had not been selected for<strong>the</strong> final version. This is an important characteristicbecause questions having an excessivelyhigh percentage <strong>of</strong> correct answers do not discriminatesubjects with a good knowledge inrespect <strong>to</strong> <strong>the</strong> o<strong>the</strong>rs. The o<strong>the</strong>r differences between<strong>the</strong> categories <strong>of</strong> pr<strong>of</strong>essional staff oramong hospital departments gave <strong>the</strong> sameresults as those obtained from <strong>the</strong> initialquestionnaire.The st<strong>and</strong>ardized score was higher than <strong>the</strong>correct answer percentage <strong>of</strong> <strong>the</strong> initial questionnaire,because it also assigned a score <strong>to</strong><strong>the</strong> ‘‘nei<strong>the</strong>r agree nor disagree’’ answers.The trend <strong>of</strong> <strong>the</strong> score differed according <strong>to</strong>physicians (gradually increasing from Surgery<strong>to</strong> Anes<strong>the</strong>siology <strong>and</strong> Emergency) <strong>and</strong> nurses(almost constant across hospital departments)in different hospital departments, <strong>and</strong> <strong>the</strong> explanationfor this could be that <strong>the</strong>re is no
Vol. 33 No. 6 June 2007 <strong>Questionnaire</strong> on Pain <strong>Knowledge</strong>735specialization in different medical disciplinesfor nurses in Italy at present. Consequently,nurses have all undergone <strong>the</strong> same pr<strong>of</strong>essionaltraining in pain management, regardless<strong>of</strong> <strong>the</strong> ward <strong>the</strong>y work in. On <strong>the</strong>contrary, physicians have different pr<strong>of</strong>essionalbackgrounds, based on <strong>the</strong>ir specialization,which may comprise training in pain management(e.g., anes<strong>the</strong>siologists) or not (e.g., surgeons).Moreover, surgeons usually develop<strong>the</strong>ir technical abilities <strong>to</strong> a higher level <strong>and</strong> insteaddelegate <strong>the</strong> control <strong>of</strong> pos<strong>to</strong>perativepain <strong>to</strong> anes<strong>the</strong>siologists.The proposed PAK scale in this survey fillsa void in <strong>the</strong> validated instruments in <strong>the</strong> field<strong>of</strong> testing <strong>the</strong> general knowledge about paintreatment <strong>of</strong> hospital staff. It is brief <strong>and</strong> caneasily be administered <strong>to</strong> a considerable number<strong>of</strong> people. Ano<strong>the</strong>r advantage is <strong>the</strong> simpleway in which <strong>the</strong> PAK questionnaire quantifiesadherence <strong>to</strong> scientific criteria concerningpain knowledge on a scale from 0 (0% st<strong>and</strong>ardscore; <strong>the</strong> least favorable level <strong>of</strong> knowledge <strong>and</strong>attitude) <strong>to</strong> 40 (100% st<strong>and</strong>ard score; <strong>the</strong> mostfavorable level <strong>of</strong> knowledge <strong>and</strong> attitude). Never<strong>the</strong>less,<strong>the</strong> PAK does not assess o<strong>the</strong>r importantaspects <strong>of</strong> pain management that are morelinked <strong>to</strong> clinical practice, such as <strong>the</strong> complianceor <strong>the</strong> motivation in approaching <strong>the</strong>problem <strong>of</strong> pain in a hospital setting. Hopefully,o<strong>the</strong>r surveys will be implemented <strong>to</strong> study indepth <strong>the</strong>se important elements.AcknowledgmentsThe authors wish <strong>to</strong> acknowledge <strong>the</strong> followinghospitals <strong>and</strong> local coordina<strong>to</strong>rs participating in<strong>the</strong> study: Aless<strong>and</strong>ria (G. D’Amico), GarbagnateMilanese (F. Zucco), Feltre (G. Gobber), Mestre(G.P. Pina<strong>to</strong>), Rovigo (B. Piva), Latisana (U.Colonna), Castelnuovo né Monti (D.D. Murri),Lugo di Romagna (V. Ricci), Modena (B. Biasi),Empoli (R. Di Grancio), Grosse<strong>to</strong> (C. Casadio),Arezzo (P. Maurizi), Gubbio (T. Lazzarini), Narni(A. Favilli), Senigallia (F. Tardioli), ClinicaColumbus Rimini (G. Pari), Eboli (A. De Martino),Taran<strong>to</strong> (D. Semeraro), <strong>and</strong> Tricase (S.Colonna).References1. Donovan M, Dillon P, McGuire L. Incidence<strong>and</strong> characteristics <strong>of</strong> pain in a sample <strong>of</strong> medicalsurgical inpatients. Pain 1987;30:69e78.2. Abbott FV, Gray-Donald K, Sewitch MJ, et al.The prevalence <strong>of</strong> pain in hospitalized patients<strong>and</strong> its resolution over six months. Pain 1992;50:15e28.3. Trentin L, Visentin M, de Marco R, Zanolin E.Prevalence <strong>of</strong> pain in a public hospital: correlationbetween patients <strong>and</strong> caregivers. J Headache Pain2001;2:73e78.4. Costantini M, Viterbori P, Gaddo F. Prevalence<strong>of</strong> pain in Italian hospital: results <strong>of</strong> regional crosssectionalsurvey. J Pain Symp<strong>to</strong>m Manage 2002;23(3):221e230.5. Visentin M, Zanolin E, Trentin L, Sar<strong>to</strong>ri S, deMarco R. Prevalence <strong>and</strong> treatment <strong>of</strong> pain in adultsadmitted <strong>to</strong> Italian hospitals. Eur J Pain 2005;9:61e67.6. Lebovits AH, Florence I, Bathina R, et al. Painknowledge <strong>and</strong> attitudes <strong>of</strong> healthcare providers:practice characteristic differences. Clin J Pain1997;13:237e243.7. Levin ML, Berry JI, Leiter J. Management <strong>of</strong>pain in terminally ill patients: physician reports <strong>of</strong>knowledge, attitudes, <strong>and</strong> behavior. J Pain Symp<strong>to</strong>mManage 1998;15:27e40.8. Drayer RA, Henderson J, Reidenberg M. Barriers<strong>to</strong> better pain control in hospitalized patients.J Pain Symp<strong>to</strong>m Manage 1999;17:434e440.9. Visentin M, Trentin L, de Marco R, Zanolin E.<strong>Knowledge</strong> <strong>and</strong> attitudes <strong>of</strong> Italian medical staff <strong>to</strong>wards<strong>the</strong> approach <strong>and</strong> treatment <strong>of</strong> patients inpain. J Pain Symp<strong>to</strong>m Manage 2001;22:925e930.10. Ponte CD, Johnson-Tribino J. <strong>Attitudes</strong> <strong>and</strong>knowledge about pain: an assessment <strong>of</strong> West Virginiafamily practitioners. Fam Med 2005;37(7):477e480.11. Mercadante S, Salvaggio L. Cancer pain knowledgein Sou<strong>the</strong>rn Italy: data from a postgraduaterefresher course. J Pain Symp<strong>to</strong>m Manage 1999;11:108e115.12. Minotti V, Betti M. <strong>Attitudes</strong> <strong>of</strong> Italian generalpractitioners in <strong>the</strong> treatment <strong>of</strong> cancer pain.Tumori 1997;83:729e731.13. Porzio G, Aielli F, Narducci F, et al. <strong>Knowledge</strong><strong>and</strong> attitudes <strong>of</strong> Italian medical oncology residents<strong>to</strong>wards <strong>the</strong> approach <strong>and</strong> treatment <strong>of</strong> pain.J Pain Symp<strong>to</strong>m Manage 2003;26(1):590e592.14. Broekmans S, V<strong>and</strong>erschueren S, Morlion B,Kumar A, Evers G. Nurses’ attitudes <strong>to</strong>ward paintreatment with opioids: a survey in a Belgian universityhospital. Int J Nur Stud 2004;41:183e189.15. Edwards HE, Nash RE, Najman JM, et al. Determinants<strong>of</strong> nurses’ intention <strong>to</strong> administer opioidsfor pain relief. Nurs Health Sci 2001;3:149e159.16. Lai YH, Dal<strong>to</strong>n JA, Belyea M, et al. Development<strong>and</strong> testing <strong>of</strong> <strong>the</strong> pain opioid analgesics beliefsscale in Taiwanese cancer patients. J Pain Symp<strong>to</strong>mManage 2003;25:376e385.
736 Zanolin et al.Vol. 33 No. 6 June 200717. Adriaansen MJM, van Achterberg T. A test instrumentfor palliative care. Int J Nur Stud 2004;41:107e117.18. Chiu LH, Trinca J, Lim LM, Tuazon JA. A study<strong>to</strong> evaluate <strong>the</strong> pain knowledge <strong>of</strong> two subpopulations<strong>of</strong> final year nursing students: Australia<strong>and</strong> Philippines. J Adv Nurs 2003;41:99e108.19. Gorsuch RL. Fac<strong>to</strong>r analysis, 2nd ed. Hillsdale,NJ: Lawrence Erlbaum Associates, 1983.20. Gifi A. Nonlinear multivariate analysis. Chichester:Wiley, 1990.21. McDonald RP. Test <strong>the</strong>ory. A unified treatment.London: Lawrence Erlbaum Associates, 1999.