Chapter 2 Balance of Payments - Planning Commission
Chapter 2 Balance of Payments - Planning Commission
Chapter 2 Balance of Payments - Planning Commission

Create successful ePaper yourself
Turn your PDF publications into a flip-book with our unique Google optimized e-Paper software.
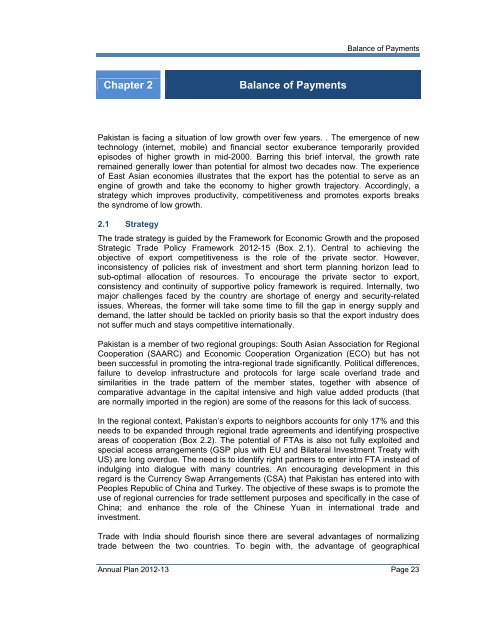
<strong>Balance</strong> <strong>of</strong> <strong>Payments</strong><strong>Chapter</strong> 2<strong>Balance</strong> <strong>of</strong> <strong>Payments</strong>Pakistan is facing a situation <strong>of</strong> low growth over few years. . The emergence <strong>of</strong> newtechnology (internet, mobile) and financial sector exuberance temporarily providedepisodes <strong>of</strong> higher growth in mid-2000. Barring this brief interval, the growth rateremained generally lower than potential for almost two decades now. The experience<strong>of</strong> East Asian economies illustrates that the export has the potential to serve as anengine <strong>of</strong> growth and take the economy to higher growth trajectory. Accordingly, astrategy which improves productivity, competitiveness and promotes exports breaksthe syndrome <strong>of</strong> low growth.2.1 StrategyThe trade strategy is guided by the Framework for Economic Growth and the proposedStrategic Trade Policy Framework 2012-15 (Box 2.1). Central to achieving theobjective <strong>of</strong> export competitiveness is the role <strong>of</strong> the private sector. However,inconsistency <strong>of</strong> policies risk <strong>of</strong> investment and short term planning horizon lead tosub-optimal allocation <strong>of</strong> resources. To encourage the private sector to export,consistency and continuity <strong>of</strong> supportive policy framework is required. Internally, twomajor challenges faced by the country are shortage <strong>of</strong> energy and security-relatedissues. Whereas, the former will take some time to fill the gap in energy supply anddemand, the latter should be tackled on priority basis so that the export industry doesnot suffer much and stays competitive internationally.Pakistan is a member <strong>of</strong> two regional groupings: South Asian Association for RegionalCooperation (SAARC) and Economic Cooperation Organization (ECO) but has notbeen successful in promoting the intra-regional trade significantly. Political differences,failure to develop infrastructure and protocols for large scale overland trade andsimilarities in the trade pattern <strong>of</strong> the member states, together with absence <strong>of</strong>comparative advantage in the capital intensive and high value added products (thatare normally imported in the region) are some <strong>of</strong> the reasons for this lack <strong>of</strong> success.In the regional context, Pakistan’s exports to neighbors accounts for only 17% and thisneeds to be expanded through regional trade agreements and identifying prospectiveareas <strong>of</strong> cooperation (Box 2.2). The potential <strong>of</strong> FTAs is also not fully exploited andspecial access arrangements (GSP plus with EU and Bilateral Investment Treaty withUS) are long overdue. The need is to identify right partners to enter into FTA instead <strong>of</strong>indulging into dialogue with many countries. An encouraging development in thisregard is the Currency Swap Arrangements (CSA) that Pakistan has entered into withPeoples Republic <strong>of</strong> China and Turkey. The objective <strong>of</strong> these swaps is to promote theuse <strong>of</strong> regional currencies for trade settlement purposes and specifically in the case <strong>of</strong>China; and enhance the role <strong>of</strong> the Chinese Yuan in international trade andinvestment.Trade with India should flourish since there are several advantages <strong>of</strong> normalizingtrade between the two countries. To begin with, the advantage <strong>of</strong> geographicalAnnual Plan 2012-13 Page 23
<strong>Balance</strong> <strong>of</strong> <strong>Payments</strong>proximity – cheaper transportation costs and trade complementarily in goods in whicheither country has a comparative advantage are overwhelming. The shorter distanceswill render it unnecessary for industry to carry high levels <strong>of</strong> inventories <strong>of</strong> rawmaterial, intermediate goods and parts, thereby reducing cost <strong>of</strong> operations and thecountry’s overall trade deficit while also improving allocation <strong>of</strong> scarce resources.(Box 2.2).Box: 2.1 Draft Strategic Trade Policy Framework 2012-15Salient Features <strong>of</strong> Strategic Trade Policy Framework (STPF) are:• Process <strong>of</strong> trade policy formulation, implementation and post implementation auditand evaluation has been streamlined. Ministry <strong>of</strong> Commerce (MoC) will align tradepolicy with development policies <strong>of</strong> the Government and Pakistan’s Framework forEconomic Growth• Export performance during the period 2009-12 was better than expected despiteglobal recession, energy shortages and security concerns. The target <strong>of</strong> 23.5Billion US Dollars set for June 30 th 2012 was surpassed a complete year inadvance• STPF is an outward looking policy framework that put emphasis on increasingexports to reduce trade deficit than on reducing imports. The overall objective <strong>of</strong>the STPF is to achieve export led sustainable high economic growth by engagingIndustry, civil society and donors and necessary policy intervention• STPF aims to reduce twin problems <strong>of</strong> uncertainty <strong>of</strong> policy and regulatory rigidity• STPF place special emphasis on increasing the volume <strong>of</strong> regional trade. Tradenormalization process with India is the most important step taken by the Ministry <strong>of</strong>Commerce which will open large market for Pakistani goods andservices. Moreover, increase in imports from India will reduce cost <strong>of</strong> our Industrialproduction and it will also be beneficial to domestic consumer• MoC is planning to introduce “Principles <strong>of</strong> Protection Policy” in STPF to provideguiding principles to protect certain industries. This will ensure the right balancebetween protection and competition for the industry• STPF aims at facilitating the business community in every possible way. In thisregard, MoC have completed an in-house review <strong>of</strong> regulatory framework oninternational trade i-e Import policy order and export policy order with a view tointroduce regulatory reforms that reduce cost <strong>of</strong> doing business. Regulations willamended/reformed in consultations with relevant stakeholders to ease theregulatory burdenSource: Ministry <strong>of</strong> CommerceAnnual Plan 2012-13 Page 24
<strong>Balance</strong> <strong>of</strong> <strong>Payments</strong>Box: 2.2 Regional Cooperation• The government has declared 2012 as the Year <strong>of</strong> Regional Cooperation andEconomic Activity. In this back drop, the <strong>Planning</strong> <strong>Commission</strong> in collaboration withWorld Bank and the Department for International Development UK has proposed tohold a Conference on “Regional Conference on Economic Cooperation and Trade”during the last quarter <strong>of</strong> 2012. The Conference will (i) build on the currentmomentum for greater regional trade, (ii) examine opportunities to take full advantage<strong>of</strong> emerging economic cooperation, (iii) address three overarching challenges inbuilding greater regional trade: (a) Creating regional markets by removing barriers totrade in goods and services (b) enhancing connectivity between people andeconomic sector (c) opening access to finance as means to expand opportunities forcross-border investment and financial risk mitigation. The Conference is expected tohelp build the knowledge and analytical base for these efforts• The focus countries for this Conference are regional partners that share a border withor have recently announced the intention to signing a free trade commitment withPakistan. This includes: Afghanistan, China, India, Iran, and Turkey• Other developments that could enhance trade with Pakistan’s neighbors include, i)Progress in structuring commercial arrangements to underpin the proposed TAPI gaspipeline between Turkmenistan, Afghanistan, Pakistan, and India. ii) High-levelcommitment to develop the Central Asia-South Asia Regional Electricity Market,including the CASA-1000 regional transmission line between Afghanistan, PakistanKyrgyz Republic and Tajikistan; iii) The signing <strong>of</strong> the Afghanistan-Pakistan Tradeand Transit Agreement, iv) The completion <strong>of</strong> the development <strong>of</strong> Gwadar Port byChina, and its commercial operation by a leading port operator from Singapore (PSIInternational)Macroeconomic stability and supportive fiscal, monetary and exchange rate policiesprovide impetus to trade. The on-going tariff rationalization drive will eliminate manydistortions hampering trade and production. Industrial policy framework may be mademore realistic and supportive to industrial development.On the import side balance <strong>of</strong> payments position can be improved through demandmanagement and cutting the imports <strong>of</strong> luxury items in the short run. In addition, thiscan be done by entering into agreements with friendly countries by trading in localcurrencies and barter trade. In the long run trade deficits can be reduced throughbringing down heavy dependence on imported oil for power generation. This can bedone by diverting to alternate sources <strong>of</strong> power generation.The current account will be driven by the workers’ remittances which have shownremarkable strength. The flow <strong>of</strong> remittances has been improving over the last fewyears and has remained a consistent source <strong>of</strong> inflows to the country. However, itwould be unrealistic to solely depend on this source <strong>of</strong> financing external account. Forthis purpose, we are to enhance non- debt creating inflows that are stable, sustainableand have positive impact on economic growth.Annual Plan 2012-13 Page 25
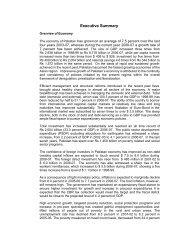
<strong>Balance</strong> <strong>of</strong> <strong>Payments</strong>2.2 Review <strong>of</strong> 2011-12The Annual Plan 2011-12 was prepared in the backdrop <strong>of</strong> energy and powershortages coupled with weak law & order situation and global uncertainty. Exporttarget was, therefore, set at $ 25.8 billion for 2011-12 as compared to US$ 25.3 billionrecorded during 2010-11, depicting an increase <strong>of</strong> about 2.0%. The current accountdeficit was targeted to be 0.6% <strong>of</strong> GDP in 2011-12, against current surplus <strong>of</strong> 0.1% <strong>of</strong>GDP actually recorded in 2010-11 (Annexure 2.3).Pakistan’s external sector showed strength in the previous year but could not maintainit in the current financial year. External account during July-March <strong>of</strong> 12 remained indeficit to the tune <strong>of</strong> $ 2.6 billion as compared to a surplus <strong>of</strong> $ 1.8 billion recordedduring the same period <strong>of</strong> previous year. Deterioration in the country’s externalaccounts largely owes to higher trade deficit, that widened by 42.4%. The increase inthe services account deficit also contributed to the deteriorated current accountbalance.The most encouraging development during Jul-March <strong>of</strong> 2011-12 was 21.5% growth inremittances that reached to a level <strong>of</strong> $ 9.7 billion as compared to about $ 8 billionrecorded during the corresponding period <strong>of</strong> last year. The growth in remittances is theresult <strong>of</strong> Pakistan Remittance Initiative (PRI) jointly launched by State Bank <strong>of</strong>Pakistan, Ministry <strong>of</strong> Finance and Ministry <strong>of</strong> Overseas Pakistanis. However, it wouldbe unrealistic to solely depend on this source <strong>of</strong> financing external account.With a gradually rising current account deficit and consistently declining foreigninflows, the SBP foreign exchange reserves are on declining path. Total liquid foreignexchange reserves stood at $ 16.5 billion as on 6 th April 2012. The decline in reserveswas primarily because <strong>of</strong> scheduled repayments to International Monetary Fund (IMF),decline in external <strong>of</strong>ficial inflows and decline in foreign direct investment because <strong>of</strong>power shortages and deteriorating law and order situation. These developmentsexerted downward pressure on rupee strength. Consequently, the Rupee during Jul-Mar 2012 depreciated by 3.0% as compared to 2.4% in the same period <strong>of</strong> previousyear. The average exchange rate for the month <strong>of</strong> March 2012 was Rs 90.71/$.<strong>Balance</strong> <strong>of</strong> Trade: Trade deficit in the Annual Plan 2011-12 was targeted at $ 12.2billion (5.2% <strong>of</strong> GDP). Due to higher growth in imports as compared to exports, tradedeficit widened by 42.4% during the first nine months <strong>of</strong> 2011-12 and touched the level<strong>of</strong> $ 11.6 billion (Annexure 2.3). This deterioration in trade account is mainly due to anincrease <strong>of</strong> $ 3.9 billion in the imports payment which more than <strong>of</strong>fset the impact <strong>of</strong>rise <strong>of</strong> about $ 431 million in the exports earning. Trade deficit remained 6.4% <strong>of</strong> GDPduring July-March 2012.Exports: Exports during July-March <strong>of</strong> 2011-12 stood at $ 18.3 billion against $ 17.9billion in the corresponding period <strong>of</strong> previous year showing an increase <strong>of</strong> 2.4%.Component-wise analysis <strong>of</strong> export items during July-March <strong>of</strong> 2011-12 shows positivegrowth in other manufactures group and all other items groups while other groupshave depicted a negative growth. The available data <strong>of</strong> about 76.3% <strong>of</strong> total exportitems, on both volume and prices, shows a negative growth <strong>of</strong> 9.7%.If this trend inexports continues, targets <strong>of</strong> Annual Plan 2011-12 are likely to be missed. . Exports(fob) for the full year <strong>of</strong> 2011-12 are estimated to be around $ 24.8 billion against theAnnual Plan target <strong>of</strong> $ 25.8 billion (Annexure 2.1). The weak performance <strong>of</strong> exportsAnnual Plan 2012-13 Page 26
<strong>Balance</strong> <strong>of</strong> <strong>Payments</strong>may be attributed to the following factors:• High export base <strong>of</strong> the previous year as a result <strong>of</strong> high export receipts due toexport prices. The windfall gains to export receipts due to abnormally highcotton prices in 11 have dissipated faster than anticipated• Instable law and order situation, energy shortages and increase in the cost <strong>of</strong>doing business in the country• Crises in the Euro zone and stiff competition in textile products from China,India and Bangladesh in the international market• India has allowed the export <strong>of</strong> Basmati rice after 4 years that has augmentedthe world supply. India is <strong>of</strong>fering non-basmati rice at much lower price due toboth large carryover stocks and recent depreciation <strong>of</strong> the Indian currencyTo increase exports, improvement in quality <strong>of</strong> export products, product and marketdiversification, exploring untapped markets, promoting local R&D and ensuringuninterrupted supply <strong>of</strong> energy are required. At the moment if we look into annualizedexports (by adding exports <strong>of</strong> past 12 months till respective month, the exportspotential has declined since August 2011. This is partially because <strong>of</strong> weaker demandin export destinations like EU and partly because <strong>of</strong> supply side disruptions Figure 2.1:$ Million27.026.025.024.023.022.021.020.019.018.017.016.0Fig-2.1: Annualized ExportsApr-12Dec-11Aug-11Apr-11Dec-10Aug-10Apr-10Dec-09Aug-09Apr-09Dec-08Aug-08Apr-08Dec-07Aug-07Apr-07Dec-06Aug-06Annualized by adding monthly exports <strong>of</strong> preceding 12-monthsImports: Imports during July-March 2011-12 increased by 14.9% to $ 29.9 billion overthe corresponding period <strong>of</strong> previous year i.e. $ 26 billion. Group-wise analysis <strong>of</strong>imports during July-March 2011-12 showed that all import groups indicated positivegrowth except food, transport and textile groups, which have witnessed negativegrowth rates.Imports bill surged mainly on account <strong>of</strong> higher prices <strong>of</strong> import <strong>of</strong> crude and edible oil.The rise in international oil prices severely impacted the import bill <strong>of</strong> the country. Price<strong>of</strong> Brent crude had almost touched $ 125 a barrel due to tensions in the Middle Eastand fell only recently eased below $100 a barrel. It is estimated that imports (fob) for2011-12 will be about $ 40.2 billion compared to the Annual Plan target <strong>of</strong> $ 38.0billion (Annexure 2.2).Annual Plan 2012-13 Page 27
<strong>Balance</strong> <strong>of</strong> <strong>Payments</strong>Workers’ Remittances: Workers’ remittances have continuously witnessed anincreasing trend during the last few years. Remittances during July-March <strong>of</strong> 2011-12reached a level <strong>of</strong> $ 9.7 billion as against $ 8 billion in the corresponding period <strong>of</strong>previous year (Annexure 2.3), registering an increase <strong>of</strong> 21.4%. Monthly averageremittances during this period stood at $ 1,081 million as compared to $ 890 millionduring the same period <strong>of</strong> previous year. Keeping this trend in view, remittances areexpected to surpass the annual plan targets <strong>of</strong> $ 12.0 billion and will be around $13billion. Remittances have shown an upward trend due to various factors, particularlythe measures taken under the Pakistan Remittance Initiative (PRI) leading toincreased inflow through <strong>of</strong>ficial channels. Increasing trend <strong>of</strong> worker’s remittance isreflected in Figure 2.2.$ Million12,00011,00010,0009,0008,0007,0006,0005,0004,0003,0002,0004,169Fig 2.2: Flow <strong>of</strong> Remittances8,9067,8116,4515,4944,60011,201 10,877* July-April Source: SBPCurrent Account <strong>Balance</strong>: The current account deficit was targeted at $ 1.4 billion(0.6% <strong>of</strong> GDP) in the Annual Plan 2011-12 as against a surplus <strong>of</strong> $ 214 million(0.1% <strong>of</strong> GDP) recorded in 2010-11 (Annexure 2.3). This was largely based on theassumption <strong>of</strong> higher level <strong>of</strong> workers’ remittances. With estimated trade deficit at$ 15.3 billion and remittances <strong>of</strong> $ 13.2 billion, the current account for 2011-12 isestimated to be in deficit by $ 4.0 billion against a surplus <strong>of</strong> $ 0.2 billion recordedduring 2010-11.Capital Account: Gross aid disbursements during 2011-12 are expected to decreasemarginally to $ 2.3 billion as compared to $ 2.4 billion recorded previous year.(Annexure 2.3)Overall <strong>Balance</strong>: The overall balance is likely to be in deficit by $ 2.6 billion in2011-12 compared to a surplus <strong>of</strong> $ 2.5 billion recorded in 2010-11 (Annexure 2.3).2.3 Outlook for 2012-13The Annual Plan 2012-13 aims at maintaining a sustainable balance <strong>of</strong> paymentsposition to ensure macroeconomic stability. Pakistan has a high degree <strong>of</strong> dependenceon oil imports, essential industrial raw materials & machinery and equipment. To meetthe requirements without excessive reliance on external borrowing needs a robustAnnual Plan 2012-13 Page 28
<strong>Balance</strong> <strong>of</strong> <strong>Payments</strong>export growth strategy. The current account balance would also need to be improvedby attracting private transfers, especially workers’ remittances. The capital accountwould be strengthened by attracting various sources <strong>of</strong> financing with greater recourseto non-debt creating, stable and sustainable sources <strong>of</strong> financing such as foreign directinvestment.Trade Account: On account <strong>of</strong> the energy shortages and security situation, exports(fob) for 2012-13 are projected to grow by 4% to $ 25.8 billion from $ 24.8 billionestimated for 2011-12. Imports during 2012-13 are projected to increase by 6.8% to$ 42.9 billion from $ 40.2 billion estimated for 2011-12. Hence, the trade account isprojected to be in deficit by $ 17.1 billion in 2012-13 (Annex: 2.3).Current Account <strong>Balance</strong>: The current account is targeted to be in deficit by $ 4.8billion in 2012-13 (1.9% <strong>of</strong> GDP) as against a deficit <strong>of</strong> $ 4.0 billion (1.7% <strong>of</strong> GDP)estimated for 2011-12 (Annex: 2.3).Capital Account: Gross aid disbursements during 2012-13 are expected to remain atthe level <strong>of</strong> $ 2.7 billion against $ 2.3 billion estimated for 2011-12.Overall <strong>Balance</strong>: <strong>Balance</strong> <strong>of</strong> payments will remain under pressure due to externaldebt repayments including repayments to IMF, declining trend <strong>of</strong> export quantum,rising international oil prices and weak financial inflows. Allowing for other capitalinflows, the overall balance is likely to be in deficit by $ 1.7 billion in 2012-13 comparedto an estimated deficit <strong>of</strong> $ 2.6 billion in 2011-12. Details are given In (Annexure 2.3)Annual Plan 2012-13 Page 29
<strong>Balance</strong> <strong>of</strong> <strong>Payments</strong>EXPORTSAnnex-2.1($ Million)2010-11 July-March 2011-12 2012-13ItemsActual 2011 2012 Target Estimate* Target**A. Food Group 5,459.3 3,135.2 2,976.6 4,209.3 4,963.8 5,212.0Rice 3,123.0 1,596.4 1,488.4 2,229.1 2,756.1 2,893.9a)Basmati 2,160.3 698.5 574.3 940.6 1,776.0 1,864.8b)Others 962.7 897.9 914.1 1,288.5 980.1 1,029.1Fish & Fish Preparations 296.2 198.7 222.8 297.9 332.1 348.7Fruits 292.4 239.2 275.7 274.6 337.0 353.9Vegetables 268.2 155.1 91.0 259.6 157.4 165.2Wheat 586.6 350.2 106.5 368.1 178.4 187.3Meat & Meat Preparations 153.8 108.5 123.6 161.0 175.2 183.9All other food items 739.1 421.2 588.6 522.9 1,032.9 1,084.5B. Textile Group 13,817.5 9,955.3 9,019.5 15,489.9 12,564.4 13,192.7Raw Cotton 364.8 276.6 362.0 251.4 477.4 501.3Cotton Yarn 2,201.4 1,697.8 1,264.2 2,064.7 1,639.2 1,721.1Cotton cloth 2,623.2 1,835.7 1,751.2 2,430.0 2,502.4 2,627.5Knitwear 2,305.6 1,678.2 1,469.7 2,459.5 2,019.1 2,120.0Bedwear 2,088.9 1,502.4 1,311.1 3,678.0 1,822.8 1,914.0Towels 762.3 534.4 492.6 844.9 702.7 737.8Ready-made Garments 1,773.7 1,228.1 1,204.0 1,836.0 1,738.9 1,825.9Art, Silk & Synthetic Textile 607.8 435.8 414.0 712.9 577.5 606.4Madeup Articles (exclud. Other Tex) 624.9 454.3 411.4 733.8 566.0 594.3Other textile materials 464.9 312.0 339.3 478.7 518.4 544.3C Petroleum Group & Coal 1,345.4 990.4 721.9 1,239.6 969.7 1,018.2Petroleum Products(Excl. TopNaphta) 895.4 649.6 282.6 695.2 389.5 409.0Petroleum Top Naphta 449.9 340.7 439.1 544.4 579.9 608.9Annual Plan 2012-13 Page 30
<strong>Balance</strong> <strong>of</strong> <strong>Payments</strong>EXPORTSAnnex-2.1($ Million)2010-11 July-March 2011-12 2012-13ItemsActual 2011 2012 Target Estimate* Target**D. Other Manufactures Group 4,041.5 2,857.7 3,455.6 4,706.7 4,949.7 5,197.2Carpets,Rugs & mats 132.4 97.8 92.5 132.7 125.2 131.5Sports Goods 330.0 231.4 234.1 338.7 333.9 350.6Leather Tanned 465.0 324.2 313.7 506.3 449.9 472.4Leather Manufactures 540.6 412.9 400.3 572.7 527.3 553.7Footwears 109.3 79.4 76.0 108.8 107.5 112.9Surgical Goods & MedicalInstruments 260.6 186.7 222.1 247.1 309.9 325.4Cutlery 85.5 64.2 59.9 94.7 79.8 83.8Chemicals And Pharm.Products 923.0 639.3 812.8 933.7 1,178.1 1,237.0Engineering Goods 255.8 160.5 215.9 676.6 350.2 367.8Jewellary 403.0 277.2 584.7 565.8 849.9 892.4Cement 457.4 329.7 339.2 440.6 470.6 494.2Other Minor items 78.8 54.2 104.4 89.0 167.3 175.6E. All Others 146.7 788.0 1,015.9 (27.3) 611.0 641.6Total Exports (A-E) 24,810.4 17,726.7 17,189.5 25,618.2 24,058.7 25,261.6Exports (fob) 25,356.0 17,892.0 16,251.0 25,835.2 24,840.0 25,812.0Source: PBS, SBP & <strong>Planning</strong> <strong>Commission</strong>Estimates* Revised Estimates** Annual PlanAnnual Plan 2012-13 Page 31
<strong>Balance</strong> <strong>of</strong> <strong>Payments</strong>IMPORTSAnnex-2.2($ Million)2010-11 July-March 2011-12 2012-13ItemActual 2011 2012 Target Estimate* Target**A. Food Group 3,878.1 2,948.3 2,591.2 8,419.6 3,356.1 3,557.0Milk & Cream Including milk forinfants 165.8 114.6 121.7 178.3 157.7 167.1Tea 334.1 260.8 271.7 412.6 351.9 372.9Spices 104.0 83.3 76.8 118.3 99.5 105.5Palm Oil 2,020.7 1,378.3 1,718.3 5,824.0 2,225.4 2,358.7Sugar 684.6 677.1 15.1 1,017.8 19.6 20.8Pulses 403.1 308.6 282.4 691.6 365.7 387.6Others 165.9 125.4 105.2 177.0 136.3 144.4B. Machinery Group 5,274.9 3,938.3 4,156.1 4,008.0 4,028.0 4,269.2Power Generating Machinery 1,038.3 778.2 826.0 1,062.7 1,069.8 1,133.9Office Mach. Incl. Data Proc. Equip. 239.4 172.9 211.9 228.1 274.5 290.9Textile Machinery 456.7 357.2 316.0 502.9 409.3 433.8Construction & Mining Machinery 115.6 87.0 99.6 139.1 129.0 136.8Electrical Machinery & Apparatus 618.9Annual Plan 2012-13 Page 32
<strong>Balance</strong> <strong>of</strong> <strong>Payments</strong>ItemIMPORTSAnnex-2.2($ Million)2010-11 July-March 2011-12 2012-13Actual 2011 2012 Target Estimate* Target**793.4 604.6 806.2 801.6 849.6Telecom 1,023.6 751.8 943.7 1,158.9 1,222.2 1,295.4Others 1,607.9 1,186.6 1,139.9 110.1 121.6 128.8C. Transport Group 2,068.6 1,549.9 1,508.8 1,974.5 1,954.1 2,071.1Road Motor Vehicles Build UnitsCKD/SKD 1,314.0 955.4 1,159.6 1,286.0 1,501.9 1,591.8Aircrafts, Ships and Boats 749.6 590.3 297.7 683.8 385.6 408.7Other Transport Equipments 5.0 4.2 51.4 4.7 66.6 70.6D. Petroleum Group 12,085.5 8,088.9 11,136.4 12,069.3 14,423.5 15,287.0Petroleum Products 7,277.3 4,688.5 7,406.9 6,786.5 9,593.2 10,167.5Petroleum Crude 4,808.2 3,400.4 3,729.5 5,282.8 4,830.3 5,119.5E. Textile Group 2,883.0 2,172.4 1,802.6 2,638.2 2,334.6 2,474.4Raw Cotton 979.9 785.1 340.2 1,232.0 440.6 467.0Synthetic Fibre 546.6 399.1 397.3 639.8 514.6 545.4Suynthetic & Artificial SilkYarn 542.8 401.3 456.6 620.2 591.4 626.8Annual Plan 2012-13 Page 33
<strong>Balance</strong> <strong>of</strong> <strong>Payments</strong>ItemIMPORTSAnnex-2.2($ Million)2010-11 July-March 2011-12 2012-13Actual 2011 2012 Target Estimate* Target**Worn clothing 128.7 92.9 109.5 146.2 141.8 150.3Other Textile Items 685.1 494.2 499.0 646.3 685.0F. Agri. & other Chemi. Gr. 2,892.0 4,525.1 2,644.7 6,423.4 3,425.3 3,630.3Fertilizer Manufactured 537.6 471.7 899.2 596.9 1,164.6 1,234.3Insecticides 154.2 106.6 96.9 1,586.7 125.5 133.0Plastic Materials 1,511.5 1,115.7 1,152.4 788.0 1,492.5 1,581.9Medicinal Products 688.7 501.3 496.2 3,451.8 642.7 681.2G. Metal Group 1,972.0 1,460.9 1,609.9 2,158.9 2,085.1 2,209.9Gold 109.7 87.7 119.2 135.1 154.4 163.7Iron and Steel Scrap 517.8 383.9 412.9 461.1 534.8 566.8Iron and Steel 1,203.9 886.0 984.4 1,400.0 1,275.0 1,351.3Aluminium Wrought & Worked 140.7 103.4 93.3 162.7 120.8 128.1H. Miscellaneous Group 812.4 590.4 606.7 982.9 785.8 832.8Rubber Crude Incl. Synth/Reclaimed 201.4 142.0 145.7 216.3 188.7 200.0Annual Plan 2012-13 Page 34
<strong>Balance</strong> <strong>of</strong> <strong>Payments</strong>ItemIMPORTSAnnex-2.2($ Million)2010-11 July-March 2011-12 2012-13Actual 2011 2012 Target Estimate* Target**Rubber Tyres & Tubes 201.5 148.7 173.5 229.6 224.7 238.1Paper & Paper Board & Manuf.There<strong>of</strong> 409.5 299.7 287.6 537.0 372.4 394.7I. All Others 8,547.1 3,742.0 7,229.0 4,235.3 10,717.6 11,359.2Total Imports( A-I) 40,413.7 29,016.3 33,285.4 42,910.1 43,110.0 45,691.0Imports (fob) 35,872.0 26,049.0 29,941.0 38,037.1 40,183.0 42,938.0Source: PBS, SBP &<strong>Planning</strong> <strong>Commission</strong> Estimates * Revised Estimates ** Annual PlanAnnual Plan 2012-13 Page 35
<strong>Balance</strong> <strong>of</strong> <strong>Payments</strong><strong>Balance</strong> <strong>of</strong> <strong>Payments</strong>Annex-2.3US $ MillionITEM 2010-11 July-March 2011-12 2012-13Actual 2011 2012 Target Estimate* Target**Current Account <strong>Balance</strong> 214 466 -3,394 -1,401 -4,015 -4,777-<strong>Balance</strong> on Goods -10,516 -8,499 12,683 -12,202 -15,343 -17,126Exports f.o.b 25,356 20,460 20,474 25,835 24,840 25,812Imports f.o.b 35,872 28,959 33,157 38,037 40,183 42,938Services <strong>Balance</strong> -1,940 -1,225 -2,347 -1,391 -2,664 -2,494Income (net) -3,017 -2,465 -2,655 -2,808 -3,075 -3,171<strong>Balance</strong> on Goods, Services &- -Income -15,473 12,189 17,685 -16,401 -21,082 -22,791Current Transfers (net) 15,687 12,655 14,291 15,000 17,067 18,014Current Transfers: credit, <strong>of</strong> which: 15,863 12,798 14,400 15,120 17,189 18,138Workers Remittances 11,201 9,046 10,877 12,000 13,169 14,091Capital Account 161 82 167 160 172 128Financial Account: <strong>of</strong> which 2,101 690 1,200 6,946 1,574 3,072Direct Investment in Pakistan 1,635 1,293 668 3,500 850 1,800Portfolio Investment (net) 338 295 -126 950 -152 507General Government 298 -25 389 1,974 575 573Annual Plan 2012-13 Page 36
<strong>Balance</strong> <strong>of</strong> <strong>Payments</strong><strong>Balance</strong> <strong>of</strong> <strong>Payments</strong>Annex-2.3US $ MillionITEM 2010-11 July-March 2011-12 2012-13Actual 2011 2012 Target Estimate* Target**Disbursements 2,377 1,674 1,588 3,631 2,284 2,700Amortization 1,957 1,677 1,184 164 1,709 2,127Financing gap 16 -29 -515 1,705 -296 -100Overall <strong>Balance</strong> 2,492 1,209 -2,542 7,410 -2,565 -1,677Reserves and Related Items -2,492 -1,209 2,542 -7,410 2,565 1,677Reserve Assets -2,225 -1,635 3,239 -420 4,510 2,653Foreign Exchange ( SBP ) -2,225 -1,635 3,239 -420 4,510 2,653Use <strong>of</strong> Fund Credit and Loans -27 -185 -588 -1,180 -1,197 -2,953Memorandum ItemsCurrent Account <strong>Balance</strong> (% <strong>of</strong> GDP) 0.1 0 -1.3 -0.6 -1.7 -1.9Exports f.o.b (growth rate %) 28.9 24.7 2.4 5.0 -2.0 4.1Imports f.o.b (growth rate %) 14.9 15.6 14.9 6.0 12.0 6.9* Revised EstimatesSource: SBP & <strong>Planning</strong><strong>Commission</strong> Estimates** Annual PlanAnnual Plan 2012-13 Page 37