SurvCE 3.0 - GNSS Analysis Point Averaging - Carlson Software
SurvCE 3.0 - GNSS Analysis Point Averaging - Carlson Software
SurvCE 3.0 - GNSS Analysis Point Averaging - Carlson Software

Create successful ePaper yourself
Turn your PDF publications into a flip-book with our unique Google optimized e-Paper software.
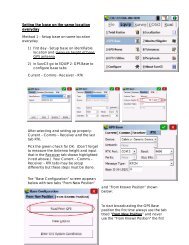
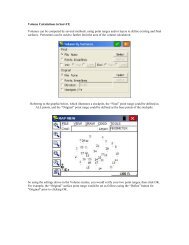
<strong>Carlson</strong> <strong>Software</strong> Inc.102 West 2 nd StreetMaysville, KY 41056www.carlsonsw.comPhone: (606) 564-5028Fax: (606) 564-6422<strong>SurvCE</strong> <strong>3.0</strong> - <strong>GNSS</strong> <strong>Analysis</strong> <strong>Point</strong> <strong>Averaging</strong>In File / Job Settings under the Options tab you can check the box for "Apply <strong>GNSS</strong> <strong>Analysis</strong>" the <strong>Point</strong> Averagemethods and screen dialogs are completely changed wtihin <strong>Point</strong> Average.This analysis approach deals with one <strong>Point</strong> ID at a time, and works if multiple measurements were taken on that<strong>Point</strong> ID, either as distinct Store <strong>Point</strong> exercises or as A for Average within Store <strong>Point</strong>s.The method, however, is designed for a field procedure of distinct single point measurements using Store <strong>Point</strong>,storing the same <strong>Point</strong> ID, typically at intervals over a period of time, capturing different satellite configurations. Byusing this procedure, greater point positional certainty can be obtained through statistical analysis.The Store <strong>Point</strong>s option of A for average can work similarly if a longer time interval between measurements is used,but the advantage of the individual Store <strong>Point</strong>s approach is that the <strong>GNSS</strong> rover can be used for other work betweenreturning to the same point to measure it again with the same point ID.So if you were mixing topo or data gathering work with key point, boundary point measurement, you could measurethe key point, do 30 minutes of topo, measure the key point again, do another 30 minutes of topo, and repeat thatprocedure, accumulating multiple data on the same point ID for the key point, in preparation for "<strong>GNSS</strong> Anlaysis<strong>Point</strong> <strong>Averaging</strong>".If all of your work was "key" point measurement, you could simply sequence from one key point to another,returning to the same points over an extended time period. Then the <strong>GNSS</strong> <strong>Analysis</strong> method will calculate themeasured points to greater certainty (as reported statistically), with blunder detection and blunder removal.With <strong>GNSS</strong> <strong>Analysis</strong>, extensive testing has shown reliability of between 1 and 2 centimeters with multiple readings,but with statistical standard deviations of as little as 3 millimeters. Blunder detection is accomplished using the ChiSquare Variance Test. The parameters and error estimates are hard coded in the preliminary release of this feature,based on thousands of point measurements.This trial, fixed parameter feature is provided with the caveat that most testing has been conducted with Topcon andAltus <strong>GNSS</strong> receivers, and for fixed antenna conditions involving low and secure antenna positions.The parameters for statistical analysis may not apply to your specific condition. These parameters will be convertedto user-defined variables with suggested ranges for settings in subsequent releases based on reports from trial usagewith a wider range of equipment.This document contains confidential and proprietary information that remains the property of <strong>Carlson</strong> <strong>Software</strong> Inc.Page 1 of 6 Updated 6/11/2013
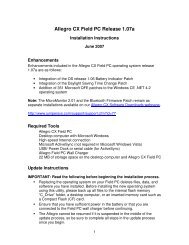
<strong>Carlson</strong> <strong>Software</strong> Inc.102 West 2 nd StreetMaysville, KY 41056www.carlsonsw.comPhone: (606) 564-5028Fax: (606) 564-6422Preconditions to <strong>GNSS</strong> <strong>Analysis</strong>The following preconditions must be set for <strong>GNSS</strong> <strong>Analysis</strong>:• Both the CRD file AND the associated RW5 file of the same name must be on the same data directoryIf you just copied a CRD file to a data collector without the associated RW5 file, <strong>GNSS</strong> <strong>Analysis</strong> will not work. Thecompanion, same name RW5 file must be present on the same directory. Plus the data in the RW5 has to containRMS values, DOP values and vector data, stored based on the following two preconditions.• File, Job Settings, Options Tab:“Store GPS Accuracy in Raw File” checked ONThis stores the HRMS, VRMS, PDOP and other DOP valuesnecessary for the statistical analysis.• File, Job Settings, Options Tab:“Apply <strong>GNSS</strong><strong>Analysis</strong> to average GPS Pts” checked ONThis activates the <strong>GNSS</strong> <strong>Analysis</strong> routine• Equip, GPS Rover, Receiver Tab:“Store Vectors in Raw Data” checked OnThis stores the base to rover vector data necessary for the leastsquares calculations used.This document contains confidential and proprietary information that remains the property of <strong>Carlson</strong> <strong>Software</strong> Inc.Page 2 of 6 Updated 6/11/2013
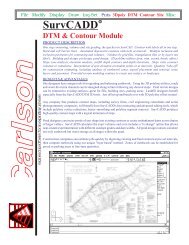
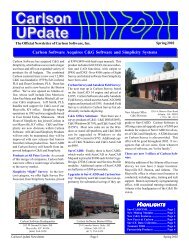
<strong>Carlson</strong> <strong>Software</strong> Inc.102 West 2 nd StreetMaysville, KY 41056www.carlsonsw.comPhone: (606) 564-5028Fax: (606) 564-6422The process of removing blunders will reduce these values to acceptable levels (also accomplished automatically bytapping "Run"). So after removal of the first blunder (V), on the third observation, the next worst blunder appearsbelow, which is the (H) on the same 3rd reading. Note that when one blunder on the same reading is alreadyidentified, the next blunder on that reading is identified by reverse coloring (here white, not dark):Notice how the Q value came down after removing the first vertical reading.Next, remove the "reverse highlighted" (H) reading for the third observation, which in effect eliminates that thirdreading altogether:With the third observation entirely removed, the horizontal blunders are eliminated (now 0) and max F value is anacceptable 10.18. The vertical Q value is still at 6, and one more blunder has been identified that is "significant"enough that removal is necessary and recommended. This is the vertical reading on the first observation. Removethat to obtain the final result (use of observations 1 and 2 for horizontal, observation 2 only for vertical). Remember,remove to the right of the highlighted item (the H or V):This document contains confidential and proprietary information that remains the property of <strong>Carlson</strong> <strong>Software</strong> Inc.Page 5 of 6 Updated 6/11/2013
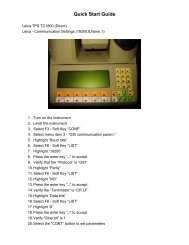
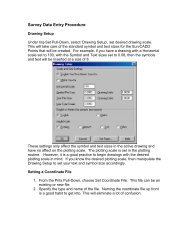
<strong>Carlson</strong> <strong>Software</strong> Inc.102 West 2 nd StreetMaysville, KY 41056www.carlsonsw.comPhone: (606) 564-5028Fax: (606) 564-6422Observation 1 was used for the H only, observation 2 for H and V and observation 3 was not used at all (thoseobservations get a line drawn through as below). This same result is obtained by tapping "Reset". The next "worst"blunder is still highlighted, but there is no reason to continue the process—analysis parameters are satisfied.The "X" in the lower left of the screen is a somewhat arbitrary designation category. If 3 or more observations areused and pass the analysis, the quality of the observations are ranked 1 through 4 as follows: 1=city center, 2=ruralarea, 3a=farm land, 3b=forest, 4=unproductive land. The calculation will "qualify" for one of these designationswith sufficient observations. Clicking the Settings button shows the hardcoded Aprior, Chi-Square and QNDistribution values. These values were selected based on extensive testing with a variety of commercial <strong>GNSS</strong>equipment. The "Antenna Freehand" setting will impact the calculation. If the <strong>GNSS</strong> antenna is on a fixed tripod,that resets parameters for the least squares calculations in terms of expected errors. If "Antenna Freehand" is clickedon, errors from a potentially moving antenna will be higher.Here is another example, collected in the field using A for Average within Store <strong>Point</strong>s. Note how all 5 observationsare used.If you scroll the top section to the Right of the statistically averagedpoint you can view the External Reliability values and data on theduration of the measurement (delay), which in this case was 13minutes.Longer delay values are recommended to obtain different satelliteconstellation configurations.This document contains confidential and proprietary information that remains the property of <strong>Carlson</strong> <strong>Software</strong> Inc.Page 6 of 6 Updated 6/11/2013