Cover Page to be inserted - Phycology Research Group, Ghent ...
Cover Page to be inserted - Phycology Research Group, Ghent ...
Cover Page to be inserted - Phycology Research Group, Ghent ...

Create successful ePaper yourself
Turn your PDF publications into a flip-book with our unique Google optimized e-Paper software.
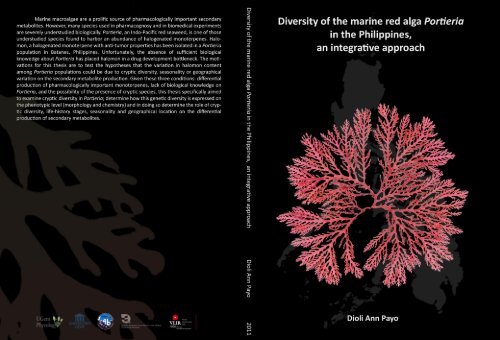
<strong>Ghent</strong> UniversityFaculty of Sciences, Department of Biology<strong>Phycology</strong> <strong>Research</strong> groupDiversity of the marine red alga Portieria inthe Philippines, an integrative approachDioli Ann PayoPromo<strong>to</strong>r:Co-Promo<strong>to</strong>rs:Prof. Dr. O. De ClerckProf. Dr. H. CalumpongDr. F. LeliaertThesis submitted in partial fulfillmen<strong>to</strong>f the requirements for the degree ofDoc<strong>to</strong>r (PhD) of Sciences (Biology)26 Septem<strong>be</strong>r 2011
EXAM COMMITTEE______________________________Mem<strong>be</strong>rs of the reading committeeDr. Line Le Gall (Muséum National d'His<strong>to</strong>ire Naturelle, Paris)Prof. Dr. Ludwig Triest (Vrije Universiteit Brussel)Dr. Yves Samyn (Koninklijk Belgisch Instituut voor Natuuurwetenschappen)Mem<strong>be</strong>rs of the examination committeeProf. Dr. Dominique Adriaens (Chairman Pre-Defense, <strong>Ghent</strong> University)Prof. Dr. Koen Sab<strong>be</strong> (Chairman Public Defense, <strong>Ghent</strong> University)Prof. Dr. Olivier De Clerck (Promo<strong>to</strong>r, <strong>Ghent</strong> University)Prof. Dr. Hilconida Calumpong (Co-Promo<strong>to</strong>r, Silliman University, Philippines)Dr. Frederik Leliaert (Co-Promo<strong>to</strong>r, <strong>Ghent</strong> University)Prof. Dr. Annemieke Ver<strong>be</strong>ken (<strong>Ghent</strong> University)Dr. Heroen Verbruggen (<strong>Ghent</strong> University)_______________________________________________________The research reported in this thesis was funded by the Flemish Interuniversity Council(VLIR) and the Global Taxonomy Initiative, Royal Belgian Institute of Natural Sciences.This was performed at the <strong>Phycology</strong> <strong>Research</strong> <strong>Group</strong> (www.phycology.ugent.<strong>be</strong>) and atthe Institute of Environment & Marine Sciences, Silliman University, Philippines.ii
ACKNOWLEDGEMENTSFirst of all, I would like <strong>to</strong> acknowledge the people who made it possible so I could startwith this PhD project on Portieria. It all started from Prof. Olivier De Clerck‘sdiscussion with Prof. John West about this alga. Next thing that happened was theendorsement of Prof. West and Prof. Lawrence Liao of my application for VLIR PhDscholarship. Prof. Dr. Eric Coppejans has supported my PhD application and hasalways welcomed me in his lab since 2003 when I started <strong>to</strong> work on Dictyota. A goodnum<strong>be</strong>r of Prof. Coppejans‘ Portieria collections had <strong>be</strong>en included in this work.I would also like <strong>to</strong> thank my co-promoter in the Philippines Prof. Dr. HilconidaCalumpong, for her confidence in me. Despite of not knowing me in 2005, sheaccepted my proposal and supported my PhD scholarship application. Prof.Calumpong‘s support on this research ranged from advice on experimental design andfield work, reserving an exclusive room and an outdoor space for my experimental workat the Silliman labora<strong>to</strong>ry, and reviewing my manuscript drafts. Prof. Calumpong alsogave me opportunities for exposure by inviting me <strong>to</strong> present during the Fridaylabora<strong>to</strong>ry meetings. I would also like <strong>to</strong> mention the help extended by her entire staff,especially Jacinta Lucañas, Julieta Echaves and Mrs. Pacita Raterte for la<strong>be</strong>quipment and research fund concerns, and the generally friendly lab atmosphere createdby her entire staff and PhD students. Annalie Candido, Rio Naguit, Wilson Tisera,Amida Diwata Macansan<strong>to</strong>s also helped <strong>to</strong> collect Portieria at Apo Island, BunakenIsland, Indonesia, and Spratley Islands. Zaccharias “Nong Iyas” Generoso has <strong>be</strong>en agreat assistance in the field, in my grazing experiments and who entertained me with hisamusing field research s<strong>to</strong>ries in the old days. I am also indebted <strong>to</strong> Abner Bucol whoassisted me for two years even during rough seas in my monthly surveys in Siquijor andSia<strong>to</strong>n and during my first trip <strong>to</strong> Batanes. Apart from allowing me <strong>to</strong> hire their boats,keen fishermen from Siquijor suggested good sites for Portieria. Some friends fromcollege and NGO days also got dragged in<strong>to</strong> this affair of collecting Portieria, like ReyLadiao, Flora<strong>be</strong>l Fumar, Bernie Caliñajan, William Villaver, Peddy Caet andNonoy of Liloan, Cebu. Thanks are also due <strong>to</strong> Basco, Batanes Mayor Manuel Violawho forwarded my letter of intent <strong>to</strong> collect <strong>to</strong> the Municipal Environment Officer,Francis Dominggo, who in turn assisted during the Batanes collections.Generous phycologists from different institutions have also enriched the num<strong>be</strong>r of mysamples such as Alison Sherwood, Tom Cowling, Max Hommersand, WillemPrud’homme Van Reine, Stefano Draisma, Tom Schils, Diane and Mark Littler.David Reid Wiseman generously sent a copy of his PhD thesis of 1973 on Och<strong>to</strong>des andChondrococcus.iv
In <strong>Ghent</strong>, despite of all the scheduling difficulties and the technical troubles, RenaatDasseville made it possible that I could use the GC-MS. I am also indebted <strong>to</strong> him forthe GC-MS knowledge that he imparted. Joannamel Colo, the Ecomama thesis studentI supervised, performed the traditional measurements on Portieria and also a portion ofthe chemical work. Frederic Lynen of the chemistry department also welcomed me inhis lab and allowed me <strong>to</strong> use HPLC and GC-MS machines during the explora<strong>to</strong>ryperiod of my Portieria extracts.I am also sincerely thankful <strong>to</strong> all the mem<strong>be</strong>rs of the <strong>Phycology</strong> <strong>Research</strong> <strong>Group</strong> forthe generosity with their time, knowledge and all the help of any form extended <strong>to</strong> meduring my PhD years. My DNA extraction, PCR and DNA sequencing work had <strong>be</strong>engreatly assisted by Caroline Vlaeminck and Sofie D’hondt. Klaas Pauly and HeroenVerbruggen have also contributed <strong>to</strong> my Portieria samples. Special thanks are also due <strong>to</strong>the mem<strong>be</strong>rs of the brains<strong>to</strong>rming team who helped shape the direction of the molecularaspect of this research composed of Heroen Verbruggen, Frederik Leliaert andOlivier De Clerck. I greatly appreciate the administrative help provided by ChristelleVankerckhove but most of all her kindness, warmth and motherly demeanor. I shallalso thank Agniezka Lipinska, Frédérique Steen, and Ana Tronholm, my labroommates, for bringing fun and the wonderful and comforting conversations.I greatly appreciate all the kindness and help in the analyses and manuscript writing ofmy co-promoter Frederik Leliaert, from whom I learned a lot. I admire his effectiveway of transferring knowledge. Finally, I am greatly indebted <strong>to</strong> my promoter, OlivierDe Clerck for <strong>be</strong>lieving that I can do a PhD, for all these learning opportunities (<strong>to</strong>omany <strong>to</strong> mention) that he made possible for me, the supervision since my master‘s thesisperiod (which resulted <strong>to</strong> a <strong>be</strong>st thesis award from VLIZ), during the thesis proposalwriting and for always pushing me <strong>to</strong> do <strong>be</strong>tter. I appreciate the keenness he gave inevery aspect of my work and also that ―hands-on‖ training. I leave my sincerest thanks <strong>to</strong>these promoters and will take with me all the lessons I have learned from them here in<strong>Ghent</strong>.I thank my thesis committee for the academic dedication exercised on reviewing thepre-defense version of this manuscript. It has made me realize the important role of acritique committee in improving the quality of an academic work.Portieria research would not have <strong>be</strong>en possible without the PhD scholarship provided bythe Flemish Interuniversity Council (VLIR) from 2006 <strong>to</strong> 2010. VLIR also fundedmy scholarship for a master‘s degree in Ecological Marine Management at the FreeUniversity of Brussels (VUB) from 2002 <strong>to</strong> 2004. The Global Taxonomy Initiativeunder the Royal Belgian Institute of Natural Sciences came <strong>to</strong> the rescue through Dr.Yves Samyn by providing fund for my trip back <strong>to</strong> and living allowance in Belgium in2011.v
Claire Van Maercken, my landlady of four years in <strong>Ghent</strong>, deserves sincereappreciation for a service <strong>to</strong> foreign students, homely accommodation and theconversations. My family gave inspiration and extended much needed help during thesampling and labwork in Silliman.-D.A. Payo-Septem<strong>be</strong>r 2011<strong>Ghent</strong>, BelgiumThis academic work was performed in collaboration with Silliman University – Institute ofEnvironmental and Marine Studies, Filipino biologists and locals of sampling sites in the Philippines.Prior informed consent was obtained from the mayor and the municipal environment natural resourcesofficer of Basco. Portieria species have no economic value and are not classified by CITES (IUCN) asthreatened or endangered. Export permit has <strong>be</strong>en granted by the Bureau of Fisheries and AquaticResources. All other Indo-Pacific specimens have <strong>be</strong>en generously donated by phycologists from differentinstitutions.vi
vii
2.5 Acknowledgements .......................................................................................... 402.6 References .......................................................................................................... 413 The red algal genus Portieria in the Philippines: species delimitation anddiversity pattern 1 ..................................................................................................... 45Abstract ....................................................................................................................... 453.1 Introduction....................................................................................................... 463.2 Materials and methods ..................................................................................... 493.2.1 Taxon sampling ................................................................................... 493.2.2 DNA sequencing and alignment ...................................................... 493.2.3 Species delimitation and phylogeny ................................................. 573.2.4 Species ranges and <strong>to</strong>tal species richness ........................................ 603.3 Results................................................................................................................. 613.3.1 Single locus GMYC approach ........................................................... 613.3.2 Multilocus species delimitation ......................................................... 633.3.3 Species richness and distributions .................................................... 673.4 Discussion .......................................................................................................... 703.4.1 Species delimitation ............................................................................ 703.4.2 Diversity and conservation ................................................................ 723.5 Acknowledgements .......................................................................................... 743.6 References .......................................................................................................... 754 Evolution of the red seaweed Portieria in the tropical Indo-Pacific 1 ....... 79Abstract ....................................................................................................................... 794.1 Introduction....................................................................................................... 804.2 Materials and methods ..................................................................................... 824.2.1 Taxon sampling ................................................................................... 824.2.2 DNA extraction, amplification and sequencing ............................. 824.2.3 DNA-based species delimitation ...................................................... 834.2.4 Phylogenetic analysis .......................................................................... 844.3 Results................................................................................................................. 854.3.1 Species diversity and geographical distribution .............................. 854.3.2 Species-level phylogeny ...................................................................... 884.4 Discussion .......................................................................................................... 904.4.1 Diversity, distribution and endemism .............................................. 904.4.2 Evolutionary his<strong>to</strong>ry of Portieria in the Indo-Pacific .................... 924.5 Conclusions ....................................................................................................... 94ix
4.6 Acknowledgements .......................................................................................... 954.7 Supplementary figures ...................................................................................... 964.8 Supplementary tables ....................................................................................... 994.9 References ........................................................................................................ 1115 Morphometric characterization of the Portieria-complex in thePhilippines 1 ............................................................................................................ 115Abstract ..................................................................................................................... 1155.1 Introduction..................................................................................................... 1165.2 Materials and methods ................................................................................... 1175.2.1 Specimen sampling, image preparation and acquisition ............. 1175.2.2 DNA-based species assignment ..................................................... 1215.2.3 Fractal analysis ................................................................................... 1215.2.4 Conventional morphometric measurements ................................ 1235.2.5 Statistical analyses.............................................................................. 1255.3 Results............................................................................................................... 1255.3.1 Phylogenetic Analyses ...................................................................... 1255.3.2 Form variation <strong>be</strong>tween genetic clusters ....................................... 1275.4 Discussion ........................................................................................................ 1385.5 Acknowledgements ........................................................................................ 1395.6 References ........................................................................................................ 1416 Variability of non-polar secondary metabolites in the red alga Portieria 1 143Abstract ..................................................................................................................... 1436.1 Introduction..................................................................................................... 1446.2 Materials and methods ................................................................................... 1466.2.1 Collection and S<strong>to</strong>rage ..................................................................... 1466.2.2 Extraction ........................................................................................... 1476.2.3 Phylogenetic Analysis ....................................................................... 1496.2.4 Metabolite analysis, data processing and multivariate analysis .. 1496.3 Results............................................................................................................... 1516.3.1 Delimitation of species ..................................................................... 1516.3.2 Identification of compounds in non-polar extracts..................... 1516.3.3 Metabolite Fingerprinting ................................................................ 1536.4 Discussion ........................................................................................................ 1636.5 Acknowledgements ........................................................................................ 1656.6 References ........................................................................................................ 1676.7 Supplementary tables ..................................................................................... 170x
7 Seasonal dynamics of Portieria populations in the Philippines 1 .............. 185Abstract ..................................................................................................................... 1857.1 Introduction..................................................................................................... 1867.2 Materials and methods ................................................................................... 1877.2.1 Study sites ........................................................................................... 1877.2.2 Sampling. ............................................................................................ 1887.2.3 Statistical analyses.............................................................................. 1897.3 Results............................................................................................................... 1897.3.1 Biophysical parameters ..................................................................... 1897.3.2 Density, cover and biomass ............................................................. 1917.3.3 Thallus height .................................................................................... 1967.3.4 Reproductive thalli ............................................................................ 1997.4 Discussion ........................................................................................................ 1997.5 Acknowledgements ........................................................................................ 2017.6 References ........................................................................................................ 2038 General discussion ....................................................................................... 2058.1 Seaweed species diversity: the red alga Portieria as a case study ............... 2058.1.1 Importance of correctly delimiting species ................................... 2058.1.2 Species concepts and species delimitation .................................... 2058.1.3 DNA-based species delimitation .................................................... 2068.1.4 Cryptic diversity ................................................................................. 2088.1.5 Unveiling cryptic diversity in Portieria hornemannii ........................ 2088.2 Diversity and evolution of marine Indo-Pacific species ........................... 2118.2.1 Macroalgal diversity in the Philippines .......................................... 2118.2.2 Speciation within the Philippines ................................................... 2128.2.3 Natural product variability in macroalgae ..................................... 2148.3 Future prospects ............................................................................................. 2158.4 Taxonomic implications ................................................................................ 2178.5 Significance of the study in the Philippine setting..................................... 2198.6 Conclusions ..................................................................................................... 2198.7 References ........................................................................................................ 223Summary ................................................................................................................ 229Samenvatting ......................................................................................................... 233Curriculum vitae.................................................................................................... 237xi
ABBREVIATIONS AND ACRONYMSAIC ............................................ Akaike Information CriterionBEAST ..................................... Bayesian Evolutionary Analysis by Sampling TreesBI ............................................... Bayesian InferenceBP&P ........................................ Bayesian Phylogenetics and PhylogeographyCI ............................................... Confidence IntervalCM ............................................. Conventional Morphometric AnalysisCOX .......................................... Cy<strong>to</strong>chrome OxidaseCV ............................................. Coefficient of VariationDA/DFA ................................. Discriminant Function AnalysisD B .............................................. Box Counting DimensionDCM ......................................... DichloromethaneEF2 ............................................ Elongation Fac<strong>to</strong>r 2FA .............................................. Fractal AnalysisGC-MS...................................... Gas Chroma<strong>to</strong>graphy-Mass SpectrometryGMYC ...................................... General Mixed Yule Coalescent ModelGTR .......................................... General Time Reversible ModelGTR + I + G....................... GTR model with a proportion of Invariant sites and Gammadistributed rate heterogeneityHPD .......................................... Highest Posterior DensityILS ............................................. Incomplete Lineage SortingIMA ........................................... Indo-Malay ArchipelagoIWP ........................................... Indo-West PacificKI .............................................. Kovats IndexLR .............................................. Likelihood RatioLSU nrDNA ............................ Large Subunit of the Nuclear Ribosomal RNA GenematK ......................................... Megakaryocyte-Associated Tyrosine Kinase GeneMCMC ...................................... Markov Chain Monte CarloML ............................................. Maximum LikelihoodMa .............................................. Million Years AgoNCI ........................................... National Cancer InstitutenrDNA ..................................... Nuclear Ribosomal RNA GenePCA ........................................... Principle Component AnalysisPCR ........................................... Polymerase Chain ReactionPP .............................................. Posterior ProbabilityPSR ............................................ Phylogenetic Species RecognitionrbcL ............................................ Ribulose-1,5-bisphosphate carboxylase oxygenase.................................................... Large SubunitrbcS ............................................. Ribulose-1,5-bisphosphate carboxylase oxygenase.................................................. Small SubunitrjMCMC ................................... Reversible Jump Markov Chain Monte CarloSE .............................................. Standard ErrorSPE ............................................ Solid Phase ExtractiontRNA......................................... Transfer RNAUCLN ....................................... Uncorrelated LognormalΛ ................................................ Lacunarityxii
xiii
LIST OF TABLESTable 2.1. List of specimens used in morphological analyses. ................................................................................................ 28Table 2.2. List of species used in the rbcL and LSU nrDNA analyses with accession num<strong>be</strong>rs. .................................... 37Table 3.1. Specimens used in the phylogenetic analysis with indication of their identity, herbarium num<strong>be</strong>r(Voucher) and collecting information. ......................................................................................................................................... 51Table 3.2. List of genes sequenced and primer sequences and amplification conditions used. ...................................... 57Table 3.3. Lineage branching patterns fit <strong>to</strong> single- and multiple-threshold variants of the GMYC model. Modeloutputs include the threshold genetic distance from the branch tips where transition occurred (T, presented forsingle-threshold models), the num<strong>be</strong>r of putative species as the sum of sequence clusters and single<strong>to</strong>ns(NGMYC), and confidence intervals (CI). Likelihoods are presented for null (L0) and GMYC (LGMYC) models,where null likelihoods are the same for single and multiple threshold model comparisons. Significance of thelikelihood ratio (LR) was evaluated using a χ2 test with 3 degrees of freedom <strong>to</strong> compare GMYC and null models.*p < 0.001. .......................................................................................................................................................................................... 61Table 3.4. Occurrence of 21 Portieria species in the Philippines. Species collected from a single site only areindicated in bold. Num<strong>be</strong>rs indicate the num<strong>be</strong>r of specimens collected from each site. ............................................... 68Table 5.1. List of Portieria specimens used in fractal (FA) and conventional morphometric (CM) analyses. DNAsequences of the cox2-3 gene were also were also obtained from the samples. The symbol (*) indicates presence ofdata or availability of a sequence. ................................................................................................................................................118Table 5.2. Definition of fractal and FracLac-derived (non-conventional) parameters....................................................122Table 5.3. Definition of conventional measurements. ............................................................................................................124Table 5.4. Summary of the Stepwise Discriminant Function Analysis of fractal and non-conventional parametersshowing the independent contributions of each variable <strong>to</strong> the overall discrimination of groups. Wilks lambdavalues ranges from 0.0 (indicating perfect discrimina<strong>to</strong>ry power) <strong>to</strong> 1.0 (indicating the absence of discrimina<strong>to</strong>rypower). Partial Wilks‘ Lambda indicates for the unique contribution of a variable <strong>to</strong> group discrimination. Thelower the value of Partial Wilks‘, the greater is the unique discrimina<strong>to</strong>ry power of the respective variable. ...........130Table 5.5. Standardized b coefficients derived from canonical analysis of fractal and non-conventional variables,showing the optimal combination of variables so that the first function provides the most overall discrimination<strong>be</strong>tween groups. The larger the standardized b coefficient, the larger the respective variable's unique contribution<strong>to</strong> the discrimination specified by the respective discriminant function. ...........................................................................131Table 5.6. Means of canonical variables (from canonical analysis of fractal and non-conventional variables)indicating which groups are <strong>be</strong>st distinguished in each function or root. ..........................................................................131Table 5.7. Classification matrix (from DA of fractal and non-conventional variables) indicating the percentage ofcases correctly classified for each group when a priori classification probabilities are the same for all groups. .......133Table 5.8. Means of the 25 conventional measurements measured. Length and width measurements are in mm. .134Table 5.9. Summary of the Stepwise Discriminant Function Analysis of conventional parameters showing theindependent contributions of each variable <strong>to</strong> the overall discrimination of groups. .....................................................135Table 5.10. Standardized b coefficients derived from canonical analysis of conventional variables, showing theoptimal combination of variables so that the first function provides the most overall discrimination <strong>be</strong>tweenxiv
groups. The larger the standardized b coefficient, the larger is the respective variable's unique contribution <strong>to</strong> thediscrimination specified by the respective discriminant function. .......................................................................................136Table 5.11. Means of canonical variables (conventional) indicating which groups are <strong>be</strong>st distinguished in eachfunction or root composed of conventional variables. ..........................................................................................................136Table 5.12. Classification matrix (from DA of conventional variables) indicating the percentage of cases correctlyclassified for each group when a priori classification probabilities are the same for all groups. ...................................136Table 5.13. Classification matrix derived from combined variables indicating the percentage of cases correctlyclassified for each group when a priori classification probabilities are the same for all groups. ...................................137Table 6.1. Frequency of compounds that are unique <strong>to</strong> or common <strong>to</strong> several species of Portieria found in Batanes.Values in parenthesis indicate <strong>to</strong>tal num<strong>be</strong>r of compounds found in a species, while 1 indicates presence and 0absence of a compound. ................................................................................................................................................................158Table 6.2. Compound peaks detected from GC-MS analysis of samples used for evaluation of temporal and spatialpatterns of non-polar metabolites of 3 cryptic species of P. hornemannii found in the Visayas. Identifications basedon comparison of either Kovats Indices (KI) of compounds retrieved from the Retention Index Calcula<strong>to</strong>r (Luceroet al. 2009) or mass spectral comparison of compounds retrieved from NIST or MassBase. Asterisk (*) indicatescompounds with parent ions showing halogenated mass spectral patterns. .....................................................................160xv
LIST OF FIGURESFig. 1.1. Cyclic and acyclic halogenated monoterpenes isolated from Portieria hornemannii (adapted from Fuller et al.1992 and Andrianasolo et al. 2006). Halomon has <strong>be</strong>en found <strong>to</strong> have specific cy<strong>to</strong><strong>to</strong>xicity <strong>to</strong>wards a broad rangeof tumor cells. Compounds 1-4 were isolated from Portieria populations in Batanes, Philippines. Compounds 1 and5-8 were extracted from Madagascar specimens. ......................................................................................................................... 2Fig. 1.2. Marine drug-producing invertebrates (adapted from Molinski et al. 2008) (a) Textile cone snail Conus magusis the source of anti-chronic pain Ziconotide (Prialt; Elan Pharmaceuticals) (Pho<strong>to</strong> credit: Alan J. Kohn). (b) TheCarib<strong>be</strong>an sea-squirt Trididemnum solidum is the source of the antitumor compound Tra<strong>be</strong>ctedin (Molinski et al.,2008). ...................................................................................................................................................................................................... 3Fig. 1.3. Distribution of natural products obtained from marine organisms based on a study in 2002 (adapted fromBlunt et. al 2004). ................................................................................................................................................................................ 3Fig. 1.4. Biogenetic scheme for the origin of marine algal monoterpenes involving bromonium or chloronium ioninitiatedadditions and cyclizations (adapted from Wise et al. 2002) ....................................................................................... 4Fig. 1.5. Distribution of Portieria in the Indo-Pacific (violet– P. hornemannii, orange– P. spinulosa, red – P. japonica,blue – P. tripinnata, green – P. harveyii). Distribution patterns are based on unverified literature reports listed inAlgaebase (Guiry and Guiry, 2011). ................................................................................................................................................ 7Fig. 1.6. Gross morphology and morphological variation of Portieria. (a) Underwater pho<strong>to</strong>graph of P. hornemanniifrom South Africa (Pho<strong>to</strong> credit: O. De Clerck). (b) Habit in situ of P. hornemannii from Sri Lanka (Pho<strong>to</strong> credit:Olivier Dargent in Coppejans et al., 2009). (c-d) Pressed herbarium specimen from Kwazulu-Natal, South Africa.(e) Fresh specimen from Siquijor, Philippines. (f) Fresh specimen from Batanes, Philippines. (g) Fresh specimenfrom Guiuan, Eastern Samar, Philippines (Pho<strong>to</strong> credit: R. Ladiao). (h) Fresh specimen from Batanes, Philippines.8Fig. 1.7. Tri-phasic life-his<strong>to</strong>ry of Portieria. .................................................................................................................................... 9Fig. 1.8. Possible scenarios of morphological convergence and variation confounding species delimitation (adaptedfrom Cianciola et. al. 2010). (a) Scenario in which morphology is congruent with molecular data. (b) Convergentmorphological evolution of distantly related species. (c) Convergent evolution scenario is observed in species thatexhibit large degree of environmentally-influenced morphological plasticity. .................................................................... 10Fig. 2.1. General morphology of P. hornemannii. Scale bar: 10mm. (a) DAP703, Dapdap, Siquijor, Siquijor. (b)Sawang, Siquijor. (c) DAP337, White Beach, Mahatao, Batanes (d) DAP345, White Beach, Mahatao, Batanes (e)DAP368, Chanaryan, Basco, Batanes (f) DAP336, White Beach, Mahatao, Batanes. ...................................................... 29Fig. 2.2. Vegetative morphology of P. hornemannii. (a) Typically inrolled tip of a major axis. Scale bar: 100 µm. (b)Newly developing flat apex. Scale bar: 100 µm. (c) Detail of a haptere anas<strong>to</strong>mosing separate branches. Scale bar:0.5 mm. (d) Longitudinal optical section of the axial filament and the alternating distichous pattern of primarylateral periaxial cells. Scale bar: 100 µm. (e) Detail of the apex and the abaxial branching pattern of the distichousprimary lateral filaments. Scale bar: 10 µm. (f) Surface view of cortical cells. Scale bar: 10 µm. (g) Medullary cells incross sectional view. Scale bar: 100 µm. ....................................................................................................................................... 29Fig. 2.3. Vegetative morphology of P. hornemannii. (a) Surface view of a conspicuously depressed, large gland cellsurrounded by a ring of cortical cells. Scale bar: 10 µm. (b, c) Detail of a barrel-shaped, multinucleate axial cell. In(c) arrow points <strong>to</strong> a nucleus. Scale bar: 100 µm. (d) Dumb-<strong>be</strong>ll-shaped axial cells observed at the thallus base.Scale bar: 100 µm. (e) Arrow points <strong>to</strong> rhizoidal filaments found at the thallus base. Scale bar: 100 µm. (f) Detail ofthe rhizoidal cells. Scale bar: 10 µm. ............................................................................................................................................. 31Fig. 2.4. Development of male reproductive structures in P. hornemannii. (a) Surface view of a sessile nemathecium.Scale bar: 100 µm. (b) Transverse section of elongated daughter cells originating from a basal cell during the earlydevelopment of spermatangial filaments. Scale bar: 10 µm. (c) Daughters cells formed from subsequent peri- andxvi
anticlinal cell division of the elongated cells. Scale bar: 10 µm. (d) Fully developed spermatangial branches. Scalebar: 100 µm. (e) A mature spermatangial branch <strong>be</strong>aring spermatia. Scale bar: 10 µm. ................................................... 32Fig. 2.5. Female reproductive structures and carposporophyte development in P. hornemannii. (a) Unfertilizedcarpogonial branch - trichogyne (tr) and carpogonium (cp). Scale bar: 50 µm. (b) Several auxiliary branches in anemathecium. Scale bar: 50 µm. (c) Auxilliary branch - basal cell (bc), auxilliary cell (aux), and terminal cell (tc) anda sterile nemathecial filament (nf). Scale bar: 10 µm. (d) Fertilized carpogonium. Scale bar: 10 µm. (e) and (f) Aconnecting filament (cf) connects the carpogonium <strong>to</strong> the auxilliary cell. Scale bar: 10 µm. (g) Gonimoblast initial(gi) developing from auxilliary cell. Scale bar: 10 µm. (h) A developing carposporophyte. Scale bar: 50µm. (i) Crosssection of a cys<strong>to</strong>carp with fully developed gonimoblasts. Scale bar: 100 µm. (j) Carpospores (cps). Scale bar: 10µm. (k) Hair cell from a sterile nemathecial filament. Scale bar: 10 µm. .............................................................................. 33Fig. 2.6. Tetrasporore development in P. hornemannii. (a) Surface view of a tetrasporangial nemathecium. Scale bar:100 µm. (b) Compact arrangement of tetrasporangia covered in transverse section. Scale bar: 100 µm. (c) Detail ofzonately divided tetrasporangia. Scale bar: 10 µm. .................................................................................................................... 35Fig. 2.7. Maximum likelihood phylogeny of family Rhizophyllidaceae based from combined rbcL and LSU nrRNAgene sequences. Node support values are given at each ramification (ML and BI). The log-likelihood value of thetree is - 10542.80329. Base frequencies are A = 0.26209, C = 0.19951, G = 0.27892, T = 0.25949. The substitutionrates are AC = 0.67945, AG = 2.29698, AT = 2.49003, CG = 0.88817, CT = 6.35790, GT = 1.0000. Theproportion of invariable sites in the alignment is 0.504 and the shape parameter of the gamma distribution amongsite rate heterogeneity is 0.735........................................................................................................................................................ 36Fig. 3.1. Sampling locations of Portieria within the Philippines. .............................................................................................. 50Fig. 3.2. (a) Ultrametric tree of the Portieria based on a Bayesian analysis of cox2-3 spacer sequence data withdivergence times estimated under a relaxed molecular clock in BEAST. (b) The graph represents the correspondinglineage-through-time plot. The dotted vertical line indicates the maximum likelihood transition point of the switchin branching rates from interspecific <strong>to</strong> intraspecific events, as estimated by a general mixed Yule-coalescent(GMYC) model. The blue color indicates the confidence interval in the estimated num<strong>be</strong>r of species. ..................... 62Fig. 3.3. Gene trees inferred from (a) cox2-3 spacer (b) elongation fac<strong>to</strong>r 2 (EF2) (c) rbcL -spacer. Colorscorrespond <strong>to</strong> cox2-3 GMYC clusters <strong>to</strong> which a sample <strong>be</strong>longs. Branch support (posterior probabilities > 0.50and bootstrap support >70 are indicated on the branches...................................................................................................... 64Fig. 3.4. Bayesian species tree inferred using *BEAST with num<strong>be</strong>rs above branches representing posteriorprobability values. This 19-species guide tree was used as reference tree for the Bayesian species delimitation ofPortieria using BP&P. The speciation probabilities are provided for each node under each combination of priors forΘ and τ0: <strong>to</strong>p, Θ ~ G(1, 10) and τ0 ~ G(1, 10), middle, Θ ~ G(2, 2000) and τ0 ~ G(2, 2000), bot<strong>to</strong>m Θ ~ G(1, 10)and τ0 ~ G(2, 2000). .......................................................................................................................................................................... 65Fig. 3.5. Bayesian species delimitation results after further splitting four V1 clades in<strong>to</strong> 11 species. Only the nodesleading <strong>to</strong> the four main clades are strongly supported while remaining speciation events are not supported........... 66Fig. 3.6. Distribution of Portieria species in the Philippines. Num<strong>be</strong>r of samples (n) is indicated for each samplingsite. (a) Location of sampling sites. (b) Species found in the Batanes sites. (c) Species found in the Visayas,Sorsogon and Camiguin. .................................................................................................................................................................. 69Fig. 3.7. Total species richness estimates of Portieria in the Philippines derived using the first order Jacknifeestima<strong>to</strong>r. Extrapolation of extant diversity involves use of existing frequency data of species per site and the fittingof various asymp<strong>to</strong>tic functions <strong>to</strong> determine diversity <strong>be</strong>yond current sample size. ....................................................... 70Fig. 4.1. Map showing the location of collecting sites (black dots). The blue area illustrates the known distributionrange of Portieria (Guiry & Guiry, 2011), and the five coloured areas show the geographical regions used in thisstudy: orange (Western and Central Indian Ocean), dark green (Indo-Malay Archipelago), light green (Japan), cyan(E Australia), purple (Hawaii). ........................................................................................................................................................ 83xvii
Fig. 4.2. Ultrametric tree of the Portieria based on a Bayesian analysis of cox2-3 spacer sequence data withdivergence times estimated under a relaxed molecular clock in BEAST. The dotted vertical line indicates themaximum likelihood transition point of the switch in branching rates from interspecific <strong>to</strong> intraspecific events, asestimated by a general mixed Yule-coalescent (GMYC) model. ............................................................................................ 86Fig. 4.3. Map of the Philippines illustrating the geographical distributions of species within the archipelago. Mostspecies exhibit intra-archipelagic endemism, with only three species <strong>be</strong>ing more widely distributed within thearchipelago (S6, S39 and V32). ....................................................................................................................................................... 87Fig. 4.4. Time-calibrated phylogeny of Portieria based on Bayesian analysis of a five-locus data set with divergencetimes estimated under a relaxed molecular clock in BEAST. Support values are posterior probabilities (PP); onlyvalues > 0.90 are shown. Uncertainty in divergence times are indicated by grey bars on internal nodes,corresponding <strong>to</strong> the 95% highest posterior density (HPD) of node ages. Time is given in millions of years <strong>be</strong>forepresent. Stars indicate significant diversification shifts using the relative cladogenesis statistic (see key in figure). .. 89Fig. 4.5. Lineage through time (LTT) plot based on the chronogram in Fig. 4.4, showing a near constant rate ofdiversification. .................................................................................................................................................................................... 90Fig. 5.1. Collection of conventional parameter measurements. (a) General branching pattern of Portieria. (b) A 10-mm branch tip with the gray area marking the measurement spot. (c) Num<strong>be</strong>rs assigned <strong>to</strong> branchlets. (d) Lengthand width measurements collected. (e) Location of angles measured. Num<strong>be</strong>rs on (d) and (e) are further defined inTable 5.3. ...........................................................................................................................................................................................120Fig. 5.2. Phylogenetic tree reconstructed using Bayesian inference based on the mi<strong>to</strong>chondrial cox2-3 spacer ofPortieria specimens collected from Batanes (B) and Visayas (V) Islands in the Philippines. ML analysis generatedidentical groupings. Posterior probabilities ≥ 0.5 are indicated at the branches. .............................................................126Fig. 5.3. Boxplot of mean values for all measured parameters for each clade and for all the clades. ..........................128Fig. 5.4. Images of branches demonstrating an increasing box-counting dimension (DB) with lacunarity. ...............129Fig. 5.5. Scatter plots of discriminant scores derived from significant discriminant (canonical) roots. (a) Scatter plo<strong>to</strong>f discriminant scores derived from fractal and non-conventional (FracLac-derived) variables. (b) Scatter plot ofdiscriminant scores derived from conventional variables. (c) Scatter plot of discriminant scores derived fromcombined FracLac-derived and conventional variables. ........................................................................................................132Fig. 6.1. Map of sampling sites. (a) Map of the Philippines indicating location of Batanes and Visayas. (b) Samplingsites in Batan and Sabtang Islands in Batanes. (c) Sampling sites in Siquijor, Negros, and Cebu Islands in theVisayas. ..............................................................................................................................................................................................147Fig. 6.2. Phylogenetic tree reconstructed using Bayesian inference based on the cox2-3 gene of Portieria specimenscollected from Batanes (B) and Visayas (V) Islands in the Philippines. Branch support (posterior probabilities) ≥0.5 are indicated at the branches. The eleven clades represent cryptic species. Species B34 and B38 were notincluded in the chemical analysis. ................................................................................................................................................152Fig. 6.3. Portion of GC-MS <strong>to</strong>tal ion chroma<strong>to</strong>grams of non-polar extracts of Portieria samples (a) malegame<strong>to</strong>phyte from Bantayan (Dumaguete), V1 (b) White Beach, Batanes, B21 (c) Liloan, V32. β-myrcene, aprecursor of many halogenated monoterpenes, was detected only in the Bantayan specimens. Naphthalene is usedas an internal standard. ...................................................................................................................................................................154Fig. 6.4. Frequency distribution indicating num<strong>be</strong>r of shared and unique non-polar secondary metabolites. (a)within life-his<strong>to</strong>ry stages of Bantayan specimens (b) species V32 of the Visayas specimens. .......................................155Fig. 6.5. Principal component analysis of GC-MS standardized relative abundance datasets which includes thecompounds detected in a 67-minute run of Portieria extracts. (a) Male game<strong>to</strong>phyte (M1-2) samples are clearlydiscriminated occurring at the positive end of the plane while female game<strong>to</strong>phyte (F2-7) and tetrasporophytesamples (T1-2) are only partially discriminated by Fac<strong>to</strong>r 1. (b) Batanes dataset includes 5 cryptic species. Thexviii
clustering of B35 replicates and the scattered pattern of B5 suggest variation in component compounds exists<strong>be</strong>tween species but at the same time suggested that variation within species can occur. .............................................157Fig. 6.6. Principal component analysis of GC-MS standardized relative abundance datasets for detecting possiblespatial and temporal patterns in (a) the Visayas species (b) the Visayas samples <strong>be</strong>longing <strong>to</strong> species V32. Lettersindicate sampling site (DAP: Dapdap; PAG: Pagubagubaan; SAW: Sawang; SIA: Sia<strong>to</strong>n) and num<strong>be</strong>rs indicatemonth and year of sampling. ........................................................................................................................................................162Fig. 7.1a-b. Maps showing the location of the four survey sites (Sia<strong>to</strong>n, Dapdap, Pagubagubaan and Sawang) ofPortieria, the species found and the location of the PAGASA Station (Dumaguete) where rainfall data was obtained..............................................................................................................................................................................................................187Fig. 7.2. Temporal variation in environmental parameters. Temperature and salinity measurements during thesurveys in (a) Sia<strong>to</strong>n (b) Dapdap (c) Sawang (d) Pagubagubaan. .........................................................................................190Fig. 7.3. Mean monthly rainfall (± SE) measured at the PAGASA station closest <strong>to</strong> the sampling sites. NE and SWmonsoon months are indicated by light and dark gray bars, respectively. .........................................................................191Fig. 7.4. Temporal variation in monthly mean abundance (individuals.m -2 ) (± SE) and percent cover (± SE) from2007-2009 in 4 surveyed sites (a) Sia<strong>to</strong>n (b) Dapdap (c) Sawang (d) Pagubagubaan. The symbol * indicates absenceof sampling data due <strong>to</strong> site inaccessibility during extreme wave actions and bad weather. Pagubagubaan has only<strong>be</strong>en surveyed for 1 year as this site was a later discovery. ....................................................................................................192Fig. 7.5. Temporal variation in monthly mean biomass (± SE) of Portieria from 2007-2009 in 4 surveyed sites (a)Sia<strong>to</strong>n (b) Dapdap (c) Sawang (d) Pagubagubaan. The symbol * indicates absence of sampling data due <strong>to</strong> siteinaccessibility during extreme wave actions and bad weather. Pagubagubaan has only <strong>be</strong>en surveyed for 1 year asthis site was a later discovery. .......................................................................................................................................................193Fig. 7.6. Monthly mean thallus height (± SE) of Portieria from 2007-2009 in 4 surveyed sites (a) Sia<strong>to</strong>n (b) Dapdap(c) Sawang (d) Pagubagubaan. ......................................................................................................................................................197Fig. 7.7. Percentage of cys<strong>to</strong>carpic plants in Sia<strong>to</strong>n (n=10-23) and Dapdap (n=5-51) from 2007 <strong>to</strong> 2009. ..............198xix
xxi
1 GENERAL INTRODUCTION1.1 Marine biodiversity and secondary metabolitesMarine biodiversity offers a rich resource of secondary metabolites withbiomedical and pharmacological potentials. These compounds do not play anessential role in the basic metabolic processes of an organism (Dixon, 2001). Theyappear <strong>to</strong> function as defense mechanisms against consumers, pathogens andcompeti<strong>to</strong>rs and therefore, may influence the organization and structure of marinesystems at the genetic, population and ecosystem levels (Hay and Fenical, 1996;Hay, 2009). Marine secondary metabolites generally have low molecular weights(
2 CHAPTER 1Fig. 1.1. Cyclic and acyclic halogenated monoterpenes isolated from Portieria hornemannii (adapted from Fuller et al.1992 and Andrianasolo et al. 2006). Halomon has <strong>be</strong>en found <strong>to</strong> have specific cy<strong>to</strong><strong>to</strong>xicity <strong>to</strong>wards a broad rangeof tumor cells. Compounds 1-4 were isolated from Portieria populations in Batanes, Philippines. Compounds 1 and5-8 were extracted from Madagascar specimens.
General introduction 3Fig. 1.2. Marine drug-producing invertebrates (adapted from Molinski et al. 2008) (a) Textile cone snail Conus magusis the source of anti-chronic pain Ziconotide (Prialt; Elan Pharmaceuticals) (Pho<strong>to</strong> credit: Alan J. Kohn). (b) TheCarib<strong>be</strong>an sea-squirt Trididemnum solidum is the source of the antitumor compound Tra<strong>be</strong>ctedin (Molinski et al.,2008).Macroalgae or seaweeds supply about 9% of these marine biomedicalcompounds (Blunt et al., 2004) (Fig. 1.3). One such group of compounds,halogenated monoterpenes (Fig. 1.1), is exclusively found in three genera ofmacrophytic red algae, including Plocamium, Portieria and Och<strong>to</strong>des (Polzin et al.,2003). Monoterpenes are a class of terpenes that consist of two isoprene units andhave the molecular formula C 10H 16.Fig. 1.3. Distribution of natural products obtained from marine organisms based on a study in 2002 (adapted fromBlunt et. al 2004).Monoterpenes may <strong>be</strong> linear (acyclic) or contain rings (Wise et al., 2002).The biosynthesis of halogenated monoterpenes in macrophytic red algae is not verywell unders<strong>to</strong>od (Wise and Croteau, 1999). Wise et al. (2002) proposed a biogenenicscheme involving bromonium and chloronium ion-initiated additions andcyclizations (Fig. 1.4). Naylor et al. (1983) suggest that ocimene is the common
4 CHAPTER 1monoterpene precursor <strong>to</strong> all the halogenated monoterpenes found in Plocamium,while myrcene is common precursor <strong>to</strong> all the halogenated monoterpenes found inPortieria (Polzin et al., 2003). The halogenation of monoterpenes with bromine andchlorine ions in seawater is most likely promoted by a vanadium-dependentbromoperoxidase (Butler and Walker, 1993; Butler and Carter-Franklin, 2004).Fig. 1.4. Biogenetic scheme for the origin of marine algal monoterpenes involving bromonium or chloronium ioninitiatedadditions and cyclizations (adapted from Wise et al. 2002)Halomon, a pentahalogenated monoterpene, was isolated from the redalga Portieria hornemannii from Batan Island in the Philippines by Füller et al. (1992)(Fig. 1.1). The compound was initially screened in anti-HIV assays but proved <strong>to</strong> <strong>be</strong>inactive. Instead Füller et al. (1992) discovered that halomon showed one of themost extreme cases of differential cy<strong>to</strong><strong>to</strong>xicity observed so far. The compound actsas vigorous anti-tumor agent against a broad range of tumor cells when subjected <strong>to</strong>the National Cancer Institute (NCI) Human disease-oriented drug screen (see
General introduction 5http://www.cancer.gov/). Subsequently halomon was selected for drugdevelopment by NCI Decision Network Committee (Fuller et al., 1992; Carté,1996). The isolation of halomon and the discovery of its anti-tumour potential inthe 1990s initiated research interests on this taxon (Fuller et al., 1992; Fuller et al.,1994; Meñez et al., 1996; Egorin et al., 1997; Puglisi and Paul, 1997). Apart frompublications on halogenated monoterpene isolation from Portieria (Barahona andRorrer, 2003; Kuniyoshi et al., 2003; Andrianasolo et al., 2006), interest on thistaxon especially even on its pharmacological potential appear <strong>to</strong> have waned leavinglarge gaps on our existing knowledge of Portieria. The absence of sufficientbiological knowledge about Portieria has placed halomon in a drug developmentbottleneck. The motivation for this thesis is the hypothesis that the variation inhalomon content among Portieria populations could <strong>be</strong> due <strong>to</strong> cryptic diversity,seasonality and geographical variation on the secondary metabolite production.1.2 Portieria: a taxonomic perspectivePortieria is a marine red algal genus that <strong>be</strong>longs <strong>to</strong> the familyRhizophyllidaceae under the order Gigartinales. The family Rhizophyllidaceae waserected by Schmitz (1889), based from the type genus Rhizophyllis, whose currentlyaccepted name is Contarinia. Wiseman (1975) proposed the retention of the familyagainst Denizot‘s Contariniaceae on the basis that Rhizophyllis is a legitimatesynonym and is the basionomic stem of the family. The family Rhizophyllidaceaecurrently includes four genera: Contarinia, Och<strong>to</strong>des, Portieria and more recently,Nesophila.The genus Portieria Zanardini has a complex nomenclatural his<strong>to</strong>ry. Thenomenclature of this genus was discussed by Silva et al. (1987). Silva et al. (1987)declared preference over Portieria <strong>be</strong>cause of its unequivocal status over othersynonyms. Portieria, named after a French collec<strong>to</strong>r Portier, initially included a singlespecies, P. coccinea, from the Red Sea. Among its synonyms was Desmia, establishedby Lyngbye (1819). This referred <strong>to</strong> three species with narrow and compressedbranches. Two of these referred <strong>to</strong> the types of Herbacea Stackhouse (1809) andHippurina Stackhouse (1809) which are both referable <strong>to</strong> Desmarestia Lamouroux.The third species was Desmia hornemannii, which according <strong>to</strong> Silva et al (1987),signifies the <strong>be</strong>ginning of a valid nomenclature. This was based on a specimennamed Fucus hornemannii from Mertens which was earlier published as nomennudum. Kutzing also established independently the genus Chondrococcus based ontwo species now currently placed in the genera Melanthalia Montagne and CallophylisKützing. He also applied Chondrococcus lam<strong>be</strong>rtii <strong>to</strong> species <strong>be</strong>longing <strong>to</strong> Callophylis
6 CHAPTER 1and Chondrococcus as descri<strong>be</strong>d recently. The erroneous attachment of a name <strong>to</strong>several species by Lyngbye and Kützing, thus, favored the retention of Zanardini‘sPortieria. Thus, P. coccinea, Chondrococcus lam<strong>be</strong>rtii and Desmia hornemannii are listed assynonyms of P. hornemannii in Silva et al., 1996.There are about seven currently recognized species of Portieria: Portieriadicho<strong>to</strong>ma (Hauck) P.C. Silva, P. harveyi (J. Agardh) P.C. Silva, P. hornemannii(Lyngbye) P.C. Silva, P. japonica (Harvey) P.C. Silva, P. kilneri (J. Agardh) P.C. Silva,P. spinulosa (Kutzing), P.C. Silva, P. tripinnata (Hering) De Clerck (listed in Guiry andGuiry 2011; Silva and Menez 1987). Wiseman (1973) expressed doubt on themem<strong>be</strong>rship of P. dicho<strong>to</strong>ma under this genus based on the absence of inrolled tips,non-paraphysial tetrasporangial nemathecia, and gland cells. My examination of thetype material of P. dicho<strong>to</strong>ma deposited at the Leiden Herbarium (Netherlands)confirms that this species is probably not a mem<strong>be</strong>r of Portieria.Previous authors have failed <strong>to</strong> set clear morphological boundaries <strong>be</strong>tweenPortieria species. Wiseman‘s (1973) taximetric studies on branching pattern, thallusheight, branch width, length and width of tetrasporangia of Chondrococcus specimensfrom the Indo-Pacific proved that these morphological characters are futile indefining species boundaries. He recognized the existence of a continuum of formsand concluded that all recognized taxa of Chondrococcus are conspecifics ofChondrococcus hornemannii (Lyngbye) Schmitz. Millar and Van Reine (2005) furthersuggested that P. spinulosa and P. hornemannii are conspecific. Guiry and Guiry (2011)noted these taxonomic views but opted <strong>to</strong> recognize Silva‘s species list which wasbased on nomenclatural decisions. Nevertheless, the presence of a morphologicalcontinuum and the absence of clear delimiting characters suggest of a speciescomplex in P. hornemannii.
General introduction 71.3 Portieria hornemanniiPortieria hornemannii (Lyngbye) P. C. Silva is a marine red macroalga reachingabout 15 cm. It grows in intertidal and subtidal areas of the Indo-Pacific. Its widedistribution includes coasts of North Africa (Red Sea), East Africa and SouthAfrica, India, Indian Ocean Islands, South East Asia, East Asia, Australia, NewZealand and the Pacific Islands (Guiry and Guiry, 2011). They are generallyattached <strong>to</strong> rocky or dead coral substrates but can <strong>be</strong> epiphytic on othermacroalgae. The general habit and morphology includes a thallus that is recum<strong>be</strong>nt<strong>to</strong> erect arising from an encrusting base or a discoid holdfast (Fig. 1.6). Thalluscolor may vary from greenish pink <strong>to</strong> dark red with older specimens turning orange<strong>to</strong> brown. Compressed axes branch up <strong>to</strong> about 5 orders with apices that areslightly <strong>to</strong> strongly incurved.Fig. 1.5. Distribution of Portieria in the Indo-Pacific (violet– P. hornemannii, orange– P. spinulosa, red – P. japonica,blue – P. tripinnata, green – P. harveyii). Distribution patterns are based on unverified literature reports listed inAlgaebase (Guiry and Guiry, 2011).
8 CHAPTER 1Fig. 1.6. Gross morphology and morphological variation of Portieria. (a) Underwater pho<strong>to</strong>graph of P. hornemanniifrom South Africa (Pho<strong>to</strong> credit: O. De Clerck). (b) Habit in situ of P. hornemannii from Sri Lanka (Pho<strong>to</strong> credit:Olivier Dargent in Coppejans et al., 2009). (c-d) Pressed herbarium specimen from Kwazulu-Natal, South Africa.(e) Fresh specimen from Siquijor, Philippines. (f) Fresh specimen from Batanes, Philippines. (g) Fresh specimenfrom Guiuan, Eastern Samar, Philippines (Pho<strong>to</strong> credit: R. Ladiao). (h) Fresh specimen from Batanes, Philippines.
General introduction 9Internal morphology reveals a uniaxial thallus and gland cells that areubiqui<strong>to</strong>us in both nemathecial and cortical tissues. Portieria has a tri-phasic lifecycle typical for florideophycean red algae (Fig. 1.7). The free-living haploidgame<strong>to</strong>phytes and diploid tetrasporophytes are isomorphic. All life-his<strong>to</strong>ry stagesenclose reproductive structures in nemathecia, mound-like growths of specializedfilaments produced by the further growth of superficial cells and which containsreproductive bodies (Rao, 1956; Wiseman, 1973). P. hornemannii has <strong>be</strong>en descri<strong>be</strong>das early as 1819 by Lyngbye. Knowledge about this taxon has <strong>be</strong>en limited <strong>to</strong>general descriptions, and therefore has remained largely understudied until now.However, the presence of intermediate forms has long <strong>be</strong>en observed by earlierworkers (Wiseman, 1973 and authors cited therein).Fig. 1.7. Tri-phasic life-his<strong>to</strong>ry of Portieria.
10 CHAPTER 11.4 Cryptic species diversityMacroalgal systematics has <strong>be</strong>en dominated by the morphological speciesconcept, a criterion that uses discontinuities in the pattern of morphologicalvariation <strong>to</strong> distinguish species. Morphological delimitation of algal species is,however, contentious; especially in groups that are morphologically depauperateand exhibit convergent evolution <strong>to</strong>wards reduced morphologies (Cianciola et al.,2010) (Fig. 1.8).Fig. 1.8. Possible scenarios of morphological convergence and variation confounding species delimitation (adaptedfrom Cianciola et. al. 2010). (a) Scenario in which morphology is congruent with molecular data. (b) Convergentmorphological evolution of distantly related species. (c) Convergent evolution scenario is observed in species thatexhibit large degree of environmentally-influenced morphological plasticity.
General introduction 11Molecular data are increasingly used <strong>to</strong> explore species boundaries in algae. One ofthe most remarkable outcomes of molecular studies is the discovery of cryptic andpseudo-cryptic species. Cryptic species are defined as species that aremorphologically indistinguishable, while pseudo-cryptic species are species that arereadily distinguished morphologically once the appropriate characters areconsidered (Knowl<strong>to</strong>n, 1993; Verbruggen et al., 2005; Bickford et al., 2007; Maggset al., 2007). Cryptic species (sometimes called sibling species) have <strong>be</strong>en found <strong>to</strong><strong>be</strong> common in the marine environment where chemical recognition systems (e.g.chemically-mediated recognition) play a dominant role (Knowl<strong>to</strong>n, 1993). Detectionof cryptic species is particularly challenging especially among marine organisms withsimple body plans like macroalgae. These organisms lack diagnosablemorphological differences probably <strong>be</strong>cause their relevance is reduced. It now<strong>be</strong>comes clear that in several algal groups (including red algae) species diversity has<strong>be</strong>en underestimated due <strong>to</strong> the presence of cryptic and pseudo-cryptic species(Zuccarello et al., 2002; Zuccarello and West, 2004; Leliaert et al., 2009). Adistinction <strong>be</strong>tween cryptic and pseudo-cryptic species will always <strong>be</strong> arbitrary <strong>to</strong> acertain extent since this is inherently linked <strong>to</strong> the effort made by researchers <strong>to</strong>search for diagnostic characters. However, true cryptic species may probably, <strong>be</strong>strefer <strong>to</strong> those entities that have not undergone sufficient morphologicaldifferentiation <strong>to</strong> create functional importance for the organism. Such that, theseentities remain morphologically quasi-identical, but genetically different. Inaddition, morphologically identical species may display various other phenotypicdifferences, such as ecophysiological or biochemical differences.The generic concept of Portieria has <strong>be</strong>en solely based on observations ofstructural characters (Zanardini, 1851). Furthermore, status of species boundaries<strong>be</strong>tween P. hornemannii and other currently accepted species are highly ambiguous.Absence of clear diagnostic characters and apparent continuum of forms ledauthors <strong>to</strong> suggest that Portieria is a monospecific genus. Under this scenario P.harveyi, P. japonica, P. spinulosa and P. tripinnata all <strong>be</strong>come synonyms of P. hornemannii(Wiseman, 1973; Millar and Van Reine, 2005).The use of molecular data <strong>to</strong> investigate Portieria‘s diversity is a form ofreverse taxonomy. Reverse taxonomy first identifies species boundaries based onmolecular data, and then uses these species circumscriptions <strong>to</strong> analysemorphological, biogeographical and ecological variation (Blaxter 2004, Markmannand Tautz 2005, and Vogler 2007). In addition, we employed an integrativetaxonomy approach, including morphometrics (e.g. fractal dimension) and chemicalcharacterization of Portieria specimens. Integrative taxonomy aims <strong>to</strong> delimit the
12 CHAPTER 1units of life‘s diversity from multiple and complementary perspectives(phylogeography, comparative morphology, population genetics, ecology,development, <strong>be</strong>haviour, etc. (Dayrat 2005).1.4.1 Species delimitation approachesThe ease by which genetic data are generated nowadays has propelled theuse of gene sequences <strong>to</strong> identify species and <strong>to</strong> infer species boundaries (Knowlesand Carstens, 2007). Over the past 15 years, different empirical methods fordelimiting species based on DNA sequence data have <strong>be</strong>en descri<strong>be</strong>d (reviewed inSites and Marshall, 2003). Species delimitation approaches can <strong>be</strong> differentiated in<strong>to</strong>tree based and non-tree-based methods. The latter category focuses on indirectinferences of the presence or absence of gene flow while tree-based methodsdelimit species based on properties related <strong>to</strong> phylogenetic tree <strong>to</strong>pologies(monophyly, concordance with geography, exclusivity, etc.). Regardless of whetherthese methods are tree or non-tree based, they all apply some sort of exclusivitycriterion, e.g. unique nucleotide differences (Cracraft, 1989; Davis and Nixon, 1992;Wiens and Penkrot, 2002; Monaghan et al., 2005) or discontinuities in sequencevariation associated with species boundaries (Hudson and Coyne, 2002).For example phylogenetic species recognition (PSR) recognizes speciesbased on the presence of monophyletic genealogical groups supported by aconsensus of the majority of the loci used or the presence of a high support by onelocus but not contradicted by the rest (Dettman et al., 2003). DNA barcodingutilizes short, standardized and group specific DNA sequences, e.g. cy<strong>to</strong>chrome coxidase 1 (cox1) for animals and rbcL and matK for flowering plants, <strong>to</strong> identifyspecimens using a DNA barcode reference library (He<strong>be</strong>rt et al., 2003, Frézal andLeblois, 2008; Borisenko et al., 2009; CBOL plant working group, 2009). Barcodingalso aims <strong>to</strong> enhance the discovery of new species based on the notion of lowdivergence within species versus high divergence <strong>be</strong>tween species (He<strong>be</strong>rt et al.,2003; Frézal and Leblois, 2008). However, the utility of DNA barcoding as aspecies delimitation <strong>to</strong>ol is still under debate (Vogler and Monaghan, 2007).Empirical as well as simulation studies demonstrate that traditional barcodingstudies often fail <strong>to</strong> correctly delimit species, especially in understudied groups oforganisms (Meyer and Paulay, 2005; Hickerson et al., 2006; Meier et al., 2006;Bittner et al., 2010). Still applying exclusivity criteria but aiming <strong>to</strong> reducearbitrariness in delimiting species, the General Mixed Yule Coalescent Model(GMYC) determines the point of transition of evolutionary processes from species
General introduction 13level (speciation and extinction) <strong>to</strong> population level (coalescence) (Pons et al.,2006). This point of transition is detectable as an increase of branching rate<strong>be</strong>tween speciation (macroevolution) and coalescence processes at population level(microevolution). The transition in branching rates is <strong>be</strong>st demonstrated by asudden increase in the slope in a lineage through time plot (LTT). Monaghan et al.(2009) developed a multi-threshold model of the GMYC where speciationcoalescenttransition is allowed <strong>to</strong> vary along individual branches of a phylogenetictree. It is suggested that the GMYC should <strong>be</strong> supported with congruent resultsfrom additional genetic loci or traditional means.However, a fundamental criticism applies <strong>to</strong> the techniques outlined above.Single-gene barcoding studies assume that the inferred gene tree is representativefor the true species phylogeny. A num<strong>be</strong>r of processes, such as lineage sorting,introgression, undetected gene duplication may cause gene trees <strong>to</strong> disagree withthe true tree of species (Heled and Drummond, 2010; O'Meara, 2010). Genetic lociundergo a transition from an initial state of polyphyly or paraphyly upon lineagesplitting <strong>to</strong>ward monophyly as the time since speciation increases (Avise and Ball,1990). So even though eventually all taxa might <strong>be</strong> delimited with a criterion likereciprocal monophyly, recently diverged species will only rarely meet thisassumption. Therefore, a num<strong>be</strong>r of alternative species delimitation methodologies,relying on multiple loci, have <strong>be</strong>en developed which model the relationship <strong>be</strong>tweenthe gene trees and the species his<strong>to</strong>ry probabilistically (Maddison, 1997; Hickersonet al., 2006; Knowles and Carstens, 2007; Heled and Drummond, 2010; O'Meara,2010). Coalescent theory allows modelling gene genealogies by going backwards intime while utilizing population genetic models in the calculation of probabilities andlikelihood analyses of polymorphism data (Nordborg, 2003; Degnan andRosen<strong>be</strong>rg, 2009). The basic coalescent model considers several assumptions whichare the following: large and panmictic populations, a neutral mutation process, andconstant population sizes within populations. Additional assumptions includeabsence of recombination within genes, absence of migration, and horizontal genetransfers across the species phylogeny (Meng and Kubatko, 2009).Apart from recent species divergence, exclusivity criterion (e.g. reciprocalmonophyly) cannot always <strong>be</strong> satisfied in all loci <strong>be</strong>cause forms of balancingselection such as heterosis or frequency dependent selection may keep allelespolymorphic for long periods of time (Hudson and Coyne 2002). A strictmonophyly of 15 loci can only <strong>be</strong> achieved after more than 1 million years in aspecies with an effective population size (N e) of 250000 and with a generation rateof one per year (Knowles and Carstens 2007). With this method, a speciation event
14 CHAPTER 1can only <strong>be</strong> recognized after the lengthy period of sorting ancestral polymorphisms.Therefore, relaxing the stringent criterion of exclusivity (for example, multispeciescoalescent approaches) might <strong>be</strong> necessary <strong>to</strong> allow recognition of more specieswhich can go unnoticed.1.4.2 Molecular markersMolecular markers frequently used for species-level phylogenetic inferencein red macroalgae include mi<strong>to</strong>chondrial cox2-3 spacer, cox1 and plastid rbcL or rbcLrbcSspacer markers (Zuccarello et al., 1999; Saunders, 2005; Robba et al., 2006;Maggs et al., 2007). These organellar DNA markers are ideal for lower-levelphylogeny <strong>be</strong>cause they are uniparentally inherited, nonrecombining, and havesmaller effective population size than nuclear markers (Provan et al., 2004). Thecox2-3 spacer has <strong>be</strong>en demonstrated <strong>to</strong> <strong>be</strong> variable within species and populationsin the red algae (Zuccarello et al., 1999). Recently, the cox1 has <strong>be</strong>en foundsuccessful in resolving species complexes in several red algal genera (Saunders,2005; Robba et al., 2006). The same has also <strong>be</strong>en observed in the chloroplast generbcL (Freshwater et al., 2010). Although, nuclear markers such as 18s and 28snrDNA are exploited <strong>to</strong> resolve relationships at higher taxonomic levels (Maggs etal., 2007), we utilized the nuclear gene elongation fac<strong>to</strong>r 2 (EF2) for speciesdelimitation purposes. The enzyme EF2 catalyzes the coordinated movement of thetwo tRNA molecules, the mRNA and the conformational changes in the ribosomeduring the elongation cycle of protein synthesis (Jørgensen et al., 2006). The use ofEF2 marker in red algae is rather recent and has <strong>be</strong>en first used <strong>to</strong> resolvesupraordinal relationships in the red algal class Floridophyceae (Le Gall andSaunders, 2007). We, however, examined the utility of this gene in resolving speciesrelationships and in extracting clues for hybridization.1.5 Temporal and geographic variation in secondary metabolitesEarlier studies largely failed <strong>to</strong> explain the qualitative and quantitativevariation of secondary metabolites in Portieria (Matlock et al., 1999). Meñez et al.(1996) observed that halomon-producing populations of P. hornemannii were grazedby the sea hare, Aplysia parvula. The cause of differential production of secondarymetabolites has <strong>be</strong>en addressed in a limited num<strong>be</strong>r of studies. The influences ofnutrient availability on secondary metabolite production as well as site <strong>to</strong> sitedifferences were studied among P. hornermannii populations in Guam. Puglisi andPaul (1997) tested the so-called carbon/nutrient hypothesis which postulates that
General introduction 15the secondary metabolites produced by a certain alga are dependent on the nutrientavailability. Quantitative analysis of och<strong>to</strong>dene (a monoterpene related <strong>to</strong> halomon)and triglyceride concentrations were investigated among 6 sites in Guam, but thevariation in the och<strong>to</strong>dene concentration could not <strong>be</strong> attributed <strong>to</strong> the availabilityof nitrogen or phosphorus, hence refuting the carbon/nutrient hypothesis. Inaddition, site <strong>to</strong> site variation in apakaoch<strong>to</strong>dene levels was observed amongpopulations in Guam (Matlock et al., 1999). However, these investigations have nottaken cryptic diversity in<strong>to</strong> consideration. None has also addressed possibleseasonal differential production of these metabolites.1.6 Aims and outline of this thesisSuccessful utilization of a marine drug resource results from an extensivebiological and chemical research that can last for decades. This is exemplified by thetwo decades of research that produced Ziconotide (Prialt), an anti-chronic paindrug from the cone snail Conus. Initially, this thesis has <strong>be</strong>en conceptualized <strong>to</strong>address the possible causes of variation in monoterpene signature in Portieria whichrestrained further drug development research. A large part of the lack ofunderstanding on this differential production of monoterpenes stems from aknowledge gap on the biology of Portieria. We hypothesized that this variation mightin part <strong>be</strong> due <strong>to</strong> the existence of cryptic species. Given these three conditions:differential production of pharmacologically important monoterpenes, lack ofbiological knowledge on Portieria, and the possibility of the presence of crypticspecies, this thesis specifically aimed <strong>to</strong>:1. examine cryptic diversity in Portieria;2. determine how this genetic diversity is expressed on the phenotypiclevel (morphology and chemistry) and in doing so ;3. determine the role of cryptic diversity, life-his<strong>to</strong>ry stages, seasonalityand geographical location on the differential production of secondarymetabolites.
16 CHAPTER 1To achieve these goals, we conducted the following investigations andreport the results on six research chapters:Chapter 2 provides a more detailed account of Portieria vegetative andreproductive development, with an emphasis on post fertilization development. Iinterpret the developmental relationships among genera within Rhizophyllidaceaeand relate them <strong>to</strong> phylogenetic observations.Chapter 3 descri<strong>be</strong>s the unprecedented cryptic species diversity in the P.hornemannii complex in the Philippines and delineates species using the GeneralMixed-Yule Coalescent Model Approach and Bayesian species delimitation.Chapter 4 infers the evolutionary his<strong>to</strong>ry of Portieria based on the existingIndo-Pacific diversity and geological his<strong>to</strong>ry.Chapter 5 morphometrically characterizes and distinguishes Portieriaspecies using conventional and fractal parameters given a seemingly continuum offorms.Chapter 6 examines the variability of non-polar secondary metabolites inPortieria by determining if variation is due <strong>to</strong> the different life-his<strong>to</strong>ry stages inPortieria, presence of phylogenetically distinct cryptic species and spatial andtemporal fac<strong>to</strong>rs.Chapter 7 examines the seasonal dynamics of Portieria populations in thePhilippines given the local structure of the diversity of Portieria-complex. Itinvestigates how this diversity is maintained and how differences in phenologyamong different cryptic species may reinforce isolation.Chapter 8 offers a general discussion on the significance of the conductedresearch and the implications of the results. Prospects for future research andconclusion are also provided.
General introduction 171.7 Author contributionsChapter 1. D.A. Payo wrote the general introduction. O. De Clerck and F. Leliaert commented on themanuscript.Chapter 2. D.A. Payo carried out microscopy observations and the manuscript writing with guidancefrom O. De Clerck. H.P. Calumpong and O. De Clerck commented on the manuscript.Chapter 3. D.A. Payo conducted field collections and the molecular work. O. De Clerck providedguidance on the molecular experiments. Data analyses and writing of the manuscript were shared byD.A. Payo, O. De Clerck and F. Leliaert. H. Verbruggen provided samples and important insights inthe direction of the data analyses. H.P. Calumpong provided samples and advice regarding importantfield collection sites and commented on the manuscript.Chapter 4. D.A. Payo conducted field collections and the molecular work. O. De Clerck providedguidance on the molecular experiments. Data analyses and writing of the manuscript were shared by F.Leliaert, D.A. Payo and O. De Clerck. H. Verbruggen provided samples and important insights in thedirection of the data analyses. H.P. Calumpong and S.M. Lin provided samples and commented on themanuscript.Chapter 5. D.A. Payo designed the study, carried out field work, fractal and non-conventionalmeasurements, data analyses and the manuscript writing. J. Colo performed the conventionalmorphometric measurements. O. De Clerck provided guidance. O. De Clerck, H.P. Calumpong andF. Leliaert commented on the manuscript.Chapter 6. D.A. Payo designed the study, carried out field work and labora<strong>to</strong>ry experiments, dataanalyses and the manuscript writing. J. Colo participated in the processing of samples in thelabora<strong>to</strong>ry. O. De Clerck provided guidance. O. De Clerck, H.P. Calumpong and F. Leliaertcommented on the manuscript.Chapter 7. D.A. Payo designed the study, carried out field work, data analyses and the manuscriptwriting. A. Bucol performed the field work in the absence of DAP. O. De Clerck, H.P. Calumpongand F. Leliaert commented on the manuscript.Chapter 8. D.A. Payo wrote the general discussion. F. Leliaert and O. De Clerck commented on themanuscript.
18 CHAPTER 1
General introduction 191.8 ReferencesAndrianasolo, E.H., France, D., Cornell-Kennon, S., Gerwick, W.H., 2006. DNA methyl transferaseinhibiting halogenated monoterpenes from the Madagascar red marine alga Portieriahornemannii. J. Nat. Prod 69, 576-579.Barahona, L.F., Rorrer, G.L., 2003. Isolation of halogenated monoterpenes from bioreac<strong>to</strong>r-culturedmicroplantlets of the macrophytic red algae Och<strong>to</strong>des secundiramea and Portieria hornemannii. J.Nat. Prod. 66, 743.Bickford, D., Lohman, D.J., Sodhi, N.S., Ng, P.K.L., Meier, R., Winker, K., Ingram, K.K., Das, I.,2007. Cryptic species as a window on diversity and conservation. Trends Ecol. Evol. 22, 148-155.Bittner, L., Halary, S., Payri, C., Cruaud, C., de Reviers, B., Lopez, P., Bapteste, E., 2010. Someconsiderations for analyzing biodiversity using integrative metagenomics and genenetworks. Biology Direct 5, 47.Blaxter, M., Elsworth, B., Daub, J., 2004. DNA taxonomy of a neglected animal phylum: anunexpected diversity of tardigrades. Proc. R. Soc. Lond. B. Biol. Sci. 271, S189.Blunt, J.W., Copp, B.R., Munro, M.H.G., Northcote, P.T., Prinsep, M.R., 2004. Marine naturalproducts. Nat. Prod. Rep. 21, 1-49.Borisenko, A.V., Sones, J.E., He<strong>be</strong>rt, P.D.N., 2009. The front end logistics of DNA barcoding:challenges and prospects. Molecular Ecology Resources 9, 27-34.Butler, A., Carter-Franklin, J.N., 2004. The role of vanadium bromoperoxidase in the biosynthesis ofhalogenated marine natural products. Nat. Prod. Rep. 21, 180-188.Butler, A., Walker, J.V., 1993. Marine haloperoxidases. Chem. Rev. 93, 1937-1944.Cardozo, K.H.M., Guaratini, T., Barros, M.P., Falcão, V.R., Tonon, A.P., Lopes, N.P., Campos, S.,Torres, M.A., Souza, A.O., Colepicolo, P., 2007. Metabolites from algae with economicalimpact. Comparative Biochemistry and Physiology Part C: Toxicology & Pharmacology 146, 60-78.Carté, B.K., 1996. Biomedical potential of marine natural products. Bioscience 46, 271-286.CBOL plant working group (2009). A DNA barcode for land plants. PNAS 106 (21): 12794–12797.Cianciola, E.N., Popolizio, T.R., Schneider, C.W., Lane, C.E., 2010. Using Molecular-Assisted AlphaTaxonomy <strong>to</strong> Better Understand Red Algal Biodiversity in Bermuda. Diversity 2, 946-958.Coppejans, E., Leliaert, F., Dargent, O., Gunasekara, R., De Clerck, O. 2009. Sri Lankan Seaweeds -Methodologies and field guide <strong>to</strong> the dominant species. Abc Taxa, vol 6: i-viii, 265 pp.Cracraft, J., 1989. Speciation and its on<strong>to</strong>logy: the empirical consequences of alternative speciesconcepts for understanding patterns and processes of differentiation. Speciation and itsConsequences, 28-59.Croteau, R., Kutchan, T.M., Lewis, N.G., 2000. Natural products (secondary metabolites). Biochemistryand molecular biology of plants, 1250–1318.Davis, J.I., Nixon, K.C., 1992. Populations, genetic variation, and the delimitation of phylogeneticspecies. Syst. Biol. 41, 421.Dayrat, B., 2005. Towards integrative taxonomy. Biol. J. Linn. Soc. 85, 407-416.Degnan, J.H., Rosen<strong>be</strong>rg, N.A., 2009. Gene tree discordance, phylogenetic inference and themultispecies coalescent. Trends Ecol. Evol. 24, 332-340.Dettman, J.R., Jacobson, D.J., Taylor, J.W., 2003. A multilocus genealogical approach <strong>to</strong> phylogeneticspecies recognition in the model eukaryote Neurospora. Evolution 57, 2703-2720.Dixon, R.A., 2001. Natural products and plant disease resistance. Nature 411, 843-847.Egorin, M.J., Rosen, D.M., Benjamin, S.E., Callery, P.S., Sentz, D.L., Eiseman, J.L., 1997. In vitrometabolism by mouse and human liver preparations of halomon, an antitumor halogenatedmonoterpene. Cancer Chemother. Pharmacol. 41, 9-14.Fenical, W., 1975. Halogenation in the Rhodophyta: a review. J. Phycol 11, 245-259.
20 CHAPTER 1Freshwater, D.W., Tudor, K., O'Shaughnessy, K., Wysor, B., 2010. DNA barcoding in the red algalorder Gelidiales: comparison of COI with rbcL and verification of the barcoding gap.Cryp<strong>to</strong>gamie. Algologie 31, 435-449.Frézal, L., Leblois, R., 2008. Four years of DNA barcoding: current advances and prospects. Infect.,Genet. Evol. 8, 727-736.Fuller, R.W., Cardellina, J.H., Jurek, J., Scheuer, P.J., Alvaradolindner, B., McGuire, M., Gray, G.N.,Steiner, J.R., Clardy, J., Menez, E., Shoemaker, R.H., Newman, D.J., Snader, K.M., Boyd,M.R., 1994. Isolation and structure activity features of halomon-related antitumormonoterpenes from the red alga Portieria hornemannii J. Med. Chem. 37, 4407-4411.Fuller, R.W., Cardellina, J.H., Ka<strong>to</strong>, Y., Brinen, L.S., Clardy, J., Snader, K.M., Boyd, M.R., 1992. Apentahalogenated monoterpene from the red alga Portieria hornemannii produces a novelco<strong>to</strong><strong>to</strong>xicity profile against a diverse panel of human tumor cell lines J. Med. Chem. 35, 3007-3011.Guiry, M.D., Guiry, G.M., 2011. AlgaeBase. World-wide electronic publication, National University ofIreland, Galway. http://www.algaebase.org; searched on 19 June 2011.Hay, M.E., 2009. Marine chemical ecology: Chemical signals and cues structure marine populations,communities, and ecosystems. Annual Review of Marine Science 1, 193-212.Hay, M.E., Fenical, W., 1996. Chemical ecology and marine biodiversity: insights and products fromthe sea. Oceanography 9.He<strong>be</strong>rt, P.D.N., Cywinska, A., Ball, S.L., DeWaard, J.R., 2003. Biological identifications through DNAbarcodes. Proceedings of the Royal Society of London Series B-Biological Sciences 270, 313-321.Heled, J., Drummond, A.J., 2010. Bayesian Inference of Species Trees from Multilocus Data. Mol. Biol.Evol. 27, 570-580.Hickerson, M.J., Meyer, C.P., Moritz, C., 2006. DNA barcoding will often fail <strong>to</strong> discover new animalspecies over broad parameter space. Syst. Biol. 55, 729-739.Hudson, R.R., Coyne, J.A., 2002. Mathematical consequences of the genealogical species concept.Evolution 56, 1557-1565.Jha, R.K., Zi-rong, X., 2004. Biomedical compounds from marine organisms. Mar. Drugs 2, 123-146.Jørgensen, R., Merrill, A.R., Andersen, G.R., 2006. The life and death of translation elongation fac<strong>to</strong>r2. Biochem. Soc. Trans. 34, 1-6.Knowles, L.L., Carstens, B.C., 2007. Delimiting species without monophyletic gene trees. Symposiumon Species Delimitation - New Approaches for Discovering Diversity, S<strong>to</strong>ny Brook, NY,pp. 887-895.Knowl<strong>to</strong>n, N., 1993. Sibling species in the sea. Annu. Rev. Ecol. Syst. 24, 189-216.Kuniyoshi, M., Oshiro, N., Miono, T., Higa, T., 2003. Halogenated monoterpenes having acyclohexadienone from the red alga Portieria hornemanni. J. Chin. Chem. Soc. 50, 167-170.Le Gall, L., Saunders, G.W., 2007. A nuclear phylogeny of the Florideophyceae (Rhodophyta) inferredfrom combined EF2, small subunit and large subunit ribosomal DNA: Establishing the newred algal subclass Corallinophycidae. Mol. Phylogen. Evol. 43, 1118-1130.Leliaert, F., Verbruggen, H., Wysor, B., De Clerck, O., 2009. DNA taxonomy in morphologicallyplastic taxa: Algorithmic species delimitation in the Boodlea complex (Chlorophyta:Cladophorales). Mol. Phylogen. Evol. 53, 122-133.Lyngbye, H.C., 1819. Tentamen hydrophy<strong>to</strong>logiae danicae continens omnia hydrophyta cryp<strong>to</strong>gamaDaniae, Holsatiae, Faeroae, Islandiae, Groenlandiae hucusque cognita, systematice disposita,descripta et iconibus illustrata, adjectis simul speciebus norvegicis. typis Schultzianis, incommissis Librariae Gyldendaliae., Hafniae [Copenhagen].Maddison, W.P., 1997. Gene trees in species trees. Syst. Biol. 46, 523-536.Maggs, C.A., Verbruggen, H., De Clerck, O. (Eds.), 2007. 6 Molecular systematics of red algae:building future structures on firm foundations.Markmann, M., Tautz, D., 2005. Reverse taxonomy: an approach <strong>to</strong>wards determining the diversity ofmeio<strong>be</strong>nthic organisms based on ribosomal RNA signature sequences. PhilosophicalTransactions of the Royal Society B: Biological Sciences 360, 1917.
General introduction 21Matlock, D.B., Ginsburg, D.W., Paul, V.J., 1999. Spatial variability in secondary metabolite productionby the tropical red alga Portieria hornemannii. Hydrobiologia 399, 267-273.Meier, R., Shiyang, K., Vaidya, G., Ng, P.K.L., 2006. DNA barcoding and taxonomy in Diptera: a taleof high intraspecific variability and low identification success. Syst. Biol. 55, 715-728.Meñez, E.G., Calumpong, H.P., Newman, D.J., West, J.A., 1996. An account of the red alga Portieriahornemannii (Gigartinales, Rhodophyllidaceae) from the Philippines. Nova Hedwigia 112, 161-170.Meng, C., Kubatko, L.S., 2009. Detecting hybrid speciation in the presence of incomplete lineagesorting using gene tree incongruence: A model. Theor. Popul. Biol. 75, 35-45.Meyer, C.P., Paulay, G., 2005. DNA barcoding: Error rates based on comprehensive sampling. PLoSBiol. 3, 2229-2238.Millar, A.J.K., Van Reine, W.F.P., 2005. Marine <strong>be</strong>nthic macroalgae collected by Vieillard from NewCaledonia and descri<strong>be</strong>d as new species by Kutzing. Phycologia 44, 536-549.Molinski, T.F., Dalisay, D.S., Lievens, S.L., Saludes, J.P., 2008. Drug development from marine naturalproducts. Nature Reviews Drug Discovery 8, 69-85.Monaghan, M.T., Balke, M., Gregory, T.R., Vogler, A.P., 2005. DNA-based species delineation intropical <strong>be</strong>etles using mi<strong>to</strong>chondrial and nuclear markers. Philosophical Transactions of the RoyalSociety B-Biological Sciences 360, 1925-1933.Monaghan, M.T., Wild, R., Elliot, M., Fujisawa, T., Balke, M., Inward, D.J.G., Lees, D.C.,Ranaivosolo, R., Eggle<strong>to</strong>n, P., Barraclough, T.G., Vogler, A.P., 2009. Accelerated speciesinven<strong>to</strong>ry on Madagascar using coalescent-based models of species delineation. Syst Biol 58,298-311.Naylor, S., Hanke, F.J., Manes, L.V., Crews, P., 1983. Chemical and biological aspects of marinemonoterpenes. Fortschritte Der Chemie Organischer Naturs<strong>to</strong>ffe, LXIV. 44, 189.Nordborg, M., 2003. Coalescent Theory. In: Balding, D., Bishop, M., Cannings, C. (Eds.), Handbookof Statistical Genetics. John Wiley and Sons Ltd, New York, pp. 602–635.O'Meara, B.C., 2010. New Heuristic Methods for Joint Species Delimitation and Species TreeInference. Syst. Biol. 59, 59-73.Paul, V.J., Ritson-Williams, R., Sharp, K., 2011. Marine chemical ecology in <strong>be</strong>nthic environments.Nat. Prod. Rep.Polzin, J.J., Rorrer, G.L., Cheney, D.P., 2003. Metabolic flux analysis of halogenated monoterpenebiosynthesis in microplantlets of the macrophytic red alga Och<strong>to</strong>des secundiramea. Biomol. Eng.20, 205-215.Pons, J., Barraclough, T.G., Gomez-Zurita, J., Cardoso, A., Duran, D.P., Hazell, S., Kamoun, S.,Sumlin, W.D., Vogler, A.P., 2006. Sequence-based species delimitation for the DNAtaxonomy of undescri<strong>be</strong>d insects. Syst. Biol. 55, 595-609.Provan, J., Murphy, S., Maggs, C.A., 2004. Universal plastid primers for Chlorophyta and Rhodophyta.Eur. J. Phycol. 39, 43-50.Puglisi, M.P., Paul, V.J., 1997. Intraspecific variation in the red alga Portieria hornemannii: Monoterpeneconcentrations are not influenced by nitrogen or phosphorus enrichment. Mar. Biol. 128,161-170.Rao, C. S. P. The life-his<strong>to</strong>ry and reproduction of Polyides caprinus (Gunn.) Papenf. Ann. Bot., 2, 20,211-230.Robba, L., Russell, S.J., Barker, G.L., Brodie, J., 2006. Assessing the use of the mi<strong>to</strong>chondrial cox1marker for use in DNA barcoding of red algae (Rhodophyta). Am. J. Bot. 93, 1101-1108.Saunders, G.W., 2005. Applying DNA barcoding <strong>to</strong> red macroalgae: a preliminary appraisal holdspromise for future applications. Philosophical Transactions of the Royal Society B-Biological Sciences360, 1879-1888.Silva, P.C., Meñez, E.G., Moe, R.L., 1987. Catalog of the <strong>be</strong>nthic marine algae of the Philippines.Smithsonian Institution Press, Washing<strong>to</strong>n, D.C.Silva, P.C., Basson, P.W., Moe, R.L., 1996, Catalogue of the <strong>be</strong>nthic marine algae of the Indian Ocean.Univ of California Pr.
22 CHAPTER 1Sites, J.W., Marshall, J.C., 2003. Delimiting species: a Renaissance issue in systematic biology. TrendsEcol. Evol. 18, 462-470.Smit, A.J., 2004. Medicinal and pharmaceutical uses of seaweed natural products: a review. J. Appl.Phycol. 16, 245-262.Verbruggen, H., De Clerck, O., Kooistra, W., Coppejans, E., 2005. Molecular and morphometric datapinpoint species boundaries in Halimeda section Rhipsalis (Bryopsidales, Chlorophyta). J.Phycol. 41, 606-621.Vogler, A.P., Monaghan, M.T., 2007. Recent advances in DNA taxonomy. J. Zool. Syst. Evol. Res. 45, 1-10.Wiens, J.J., Penkrot, T.A., 2002. Delimiting species using DNA and morphological variation anddiscordant species limits in spiny lizards (Sceloporus). Syst. Biol. 51, 69.Wise, M.L., Croteau, R., 1999. Monoterpene biosynthesis. Comprehensive natural products chemistry 2, 97-153.Wise, M.L., Rorrer, G.L., Polzin, J.J., Croteau, R., 2002. Biosynthesis of marine natural products:isolation and characterization of a myrcene synthase from cultured tissues of the marine redalga Och<strong>to</strong>des secundiramea. Arch. Biochem. Biophys. 400, 125-132.Wiseman, D.R., 1973,. Morphological and taxonomic studies of the red algal genera Och<strong>to</strong>des andChondrococcus. Department of Botany. Duke University, p. 234.Wiseman, D.R., 1975. On the status of the red algal family, the Rhizophyllidaceae (Gigartinales).Taxon 24, 489-490.Zanardini, G., 1851. Algae novae vel minus cognitae in mari Rubro a Portiero collectae. Flora 34, 33-38.Zuccarello, G.C., Sandercock, B., West, J.A., 2002. Diversity within red algal species: variation inworld-wide samples of Spyridia filamen<strong>to</strong>sa (Ceramiaceae) and Murrayella periclados(Rhodomelaceae) using DNA markers and breeding studies. Eur. J. Phycol. 37, 403-417.Zuccarello, G.C., West, J.A., 2004. Multiple cryptic species: molecular diversity and reproductiveisolation in the Bostrychia radicans/ B. moritziana complex (Rhodomelaceae, Rhodophyta) withfocus on North American isolates (vol 39, pg 948, 2003). J. Phycol. 40, 226-226.Zuccarello, G.C., West, J.A., Kamiya, M., King, R.J., 1999. A rapid method <strong>to</strong> score plastid haplotypesin red seaweeds and its use in determining parental inheritance of plastids in the red algaBostrychia (Ceramiales). Hydrobiologia 401, 207-214.
2 MORPHOLOGY, VEGETATIVE ANDREPRODUCTIVE DEVELOPMENT OF THERED ALGA PORTIERIA (GIGARTINALES:RHIZOPHYLLIDACEAE) 1AbstractEarlier descriptions of the Indo-Pacific red alga Portieria hornemannii lacked detailed information on itsvegetative and reproductive development and morphology. An in-depth treatment is presented on thedevelopment of the uniaxial thallus and the formation of male, female and tetrasporangial nemathecia.Post fertilization events and carposporophyte development are descri<strong>be</strong>d, confirming Kylin‘spresumption on the development of connecting filaments <strong>be</strong>tween the carpogonium and the auxiliarycell following fertilization. Phylogenetic analysis using chloroplast encoded rbcL and nuclear ribosomalLSU gene sequences, including mem<strong>be</strong>rs of Rhizophyllidaceae and their close relatives suggests amonophyletic family. Contarinia is resolved as the sister taxon of a clade uniting Nesophila, Och<strong>to</strong>des andPortieria. The relationships among the latter genera remain largely unresolved.Keywords: Portieria; Rhizophyllidaceae; Indo-Pacific; Morphology; Vegetative; Reproductive;Phylogeny1 Published as: Payo, D.A., Calumpong, H., De Clerck, O., 2011. Morphology, vegetative and reproductivedevelopment of the red alga Portieria hornemannii (Gigartinales: Rhizophyllidaceae). Aquat. Bot. 95, 94-102.23
24 CHAPTER 22.1 IntroductionPortieria Zanardini is a small red algal genus with seven currently acceptedspecies that are widely distributed in tropical and subtropical waters of the Indo-West Pacific Ocean (Guiry and Guiry, 2010, Silva and Menez 1987). Portieria<strong>be</strong>longs <strong>to</strong> the family Rhizophyllidaceae. The family, erected by Schmitz (1889), wasbased on the genus Rhizophyllis, which is currently regarded as a synonym ofContarinia (Denizot, 1968). Wiseman (1975) proposed the retention of the familyRhizophyllidaceae against Denizot‘s Contariniaceae on the basis that Rhizophyllis is alegitimate synonym of Contarinia and is the basionomic stem of the family. Itsmem<strong>be</strong>rs are characterized with flattened or cylindrical thalli, uniaxial or biaxial,prominent or not so prominent central axis, large gland cells, spermatangia andtetrasporangia in sessile nemathecia and female globular nemathecia (Kylin, 1956;Wiseman, 1975; Millar, 1990; Abbott, 1999; Oliveira et al., 2005). Rhizophyllidaceaeis among the nemathecia-<strong>be</strong>aring families of the order Gigartinales which now onlyincludes 28 mem<strong>be</strong>rs as more recently, Peyssonnelliaceae, <strong>be</strong>came an order of itsown (Saunders et al., 2004; Krayesky et al., 2009; Verbruggen et al., 2010). Thefamily includes 4 genera: Contarinia, Och<strong>to</strong>des, Nesophila and Portieria. The genera haveinteresting biogeographic distributions with each genus exhibiting a near exclusivedistribution. The genus Contarinia is known with certainty only from theMediterranean Sea and Atlantic coast of northwestern Morocco, Portugal, andSpain (Feldmann, 1939; Benhissoune et al., 2002; Berecibar et al., 2009; Peña andBárbara, 2010). Two additional species, C. okamurae Segawa and C. pacifica(Børgesen) Denizot have <strong>be</strong>en reported from Japan and in Easter Islandrespectively but their identity requires confirmation. Och<strong>to</strong>des, Portieria and Nesophilaare endemic <strong>to</strong> the Carib<strong>be</strong>an, Indo-Pacific, and New Zealand, respectively. Thegeneric concept of Portieria has <strong>be</strong>en solely based on observations of structuralcharacters (Zanardini, 1851).The vegetative and reproductive developments have <strong>be</strong>en studied in detailonly for a few mem<strong>be</strong>rs of the Rhizophyllidaceae. Detailed treatments of thestructure of Och<strong>to</strong>des secundiramea were provided by Joly and Ugadim (1966) andWiseman (1976, 1977). Contarinia squamariae was studied by Denizot (1968) andmore recently by Berecibar et al. (2009). All other species remain largely unstudied.This includes the genus Portieria. The earliest accounts on Portieria (often as Desmiaand Chondrococcus; see Silva et al. 1987 for details on the generic synonomy) werelimited <strong>to</strong> general descriptions (Lyngbye, 1819; Zanardini, 1851; Kützing, 1867;Agardh, 1876). Kylin (1930, 1956) provided a more detailed account of the
Morphology, vegetative and reproductive development 25vegetative and the reproductive structures of Portieria which included illustrations ofthe male reproductive structures, auxiliary filaments in the female nemathecia andtetrasporangia. Fine details of early post fertilization events, however, were notpresented. The genus was studied in detail by D. Reid Wiseman (1973) but theseresults were never published.In this paper, we provide a more detailed account of Portieria hornemannii‘svegetative and reproductive development, with an emphasis on post fertilizationdevelopment. We will interpret the developmental relationships among genera andrelate them <strong>to</strong> phylogenetic observations.2.2 Materials and methods2.2.1 Morphological analysisReproductive and non-reproductive P. hornemannii samples were collectedfrom different locations in the Indo-Pacific from 1980 <strong>to</strong> 1997. Observations weremade on specimens preserved in 5% formalin-seawater solution. Fine cross sectionsof the thallus were made by hand using a single or double-edged blade. To observereproductive structures, nemathecia-<strong>be</strong>aring tissues were squashed. Whole axialcells were observed by making a slight longitudinal cut along the axis of a piece ofthallus and pressing it with cover slip <strong>to</strong> split the tissue which further reveals thecells. Whole-mount and sectioned materials were stained with 1% aniline bluesolution, fixed with a drop of 10% HCl, rinsed with distilled water and mounted inKaro syrup for preservation. To reveal presence of nuclei, bleached tissue sectionswere stained with Wittmann‘s ace<strong>to</strong>-iron-haema<strong>to</strong>xylin-chloral-hydrate solution.Excess water was removed from tissue sections <strong>be</strong>fore application of stainingsolution. The stain was allowed <strong>to</strong> stay on the material for at least 30 minutes<strong>be</strong>fore adding 45% acetic acid on one edge of the cover slip <strong>to</strong> destain. Excess acidwas drained from the opposite side of the cover slip using an absor<strong>be</strong>nt paper.Hoyer‘s mounting medium (1:1 distilled water) was applied next from one side ofthe cover slip and was allowed <strong>to</strong> stand for about an hour. The mounting mediumwas removed with acetic acid and finally, mounted using Karo syrup. Further detailsof this procedure are descri<strong>be</strong>d in Wittmann (1965) and Hommersand et al. (1992).Pho<strong>to</strong>graphs were taken with an Olympus DP50 digital camera or OlympusColorview IIIu digital color camera mounted on a Leitz Diaplan or BX51 Olympuscompound microscope, or Leica Wild M10 stereo microscope. Specimens arehoused at the herbarium of <strong>Ghent</strong> University (GENT).
26 CHAPTER 22.2.2 Molecular analysisDNA sequences were either retrieved from Genbank or generated for thisstudy. DNA was extracted from silica dried material and informative loci amplifiedand sequenced according <strong>to</strong> De Clerck et al. (2005). Primers used for amplificationwere derived from Wang et al. (2000) and Wilkes et al. (2005) for rbcL gene andHarper and Saunders (2001) for the LSU nrRNA gene. Generated sequences wereedited using BIOEDIT 7.0.9.0 (Hall, 1999) and were aligned <strong>to</strong>gether withGenbank sequences using MAFFT (Multiple Alignment using Fast FourierTransform) (Ka<strong>to</strong>h and Toh, 2008). The alignments included 7 taxa consisting fourmem<strong>be</strong>rs of Rhizophyllidaceae and three genera of closely related families(Dumontiaceae, Kallymeniaceae, and Polyidaceae). The initial alignment of the LSUnrRNA gene contained 2817 bases but was finally reduced <strong>to</strong> 2659 bases, excluding158 positions from regions difficult <strong>to</strong> align. The rbcL alignment included 1430bases. The concatenated alignment of the two genes included 4088 positions.Phylogenetic analyses were performed on three datasets: DNA sequences of theLSU nrRNA gene, rbcL gene, and concatenated sequences of the two. The threedatasets were exported for phylogenetic analysis <strong>to</strong> MEGA 4.0.2 (Tamura et al.,2007) for initial Neighbour Joining (NJ) analyses. The concatenated dataset wasexported <strong>to</strong> PhyML (Guindon et al., 2009) for Maximum Likelihood (ML) analyses,and <strong>to</strong> MrBayes 3.0 (Huelsen<strong>be</strong>ck and Ronquist, 2001) for Bayesian Inference (BI).The model of nucleotide substitution used for ML was General Time Reversible(GTR), determined using Modeltest 3.7 (Posada and Crandall, 1998) according <strong>to</strong>the Akaike information criterion (Posada and Buckley, 2004). PhyML was set <strong>to</strong>estimate the proportion of invariable sites, consider 4 substitution rate categories,estimate the gamma distribution parameter, use BIONJ as an input tree, and <strong>to</strong>conduct a non-parametric bootstrap analysis of 100 replicates. Bayesian analysis wasperformed using a GTR + I + Γ model. The data set was divided in two partitions,corresponding <strong>to</strong> the rbcL and LSU nrRNA genes, with all model parametersuncoupled <strong>be</strong>tween the partitions. Posterior probabilities were estimated using aMetropolis-coupled Markov chain Monte Carlo approach with sampling according<strong>to</strong> the Metropolis–Hastings algorithm. The analysis used four chains, one cold andthree incrementally heated. Each run consisted of 1000000 generations and wassampled every 1000 generation. Burnin value was determined using TRACER V1.4(Rambaut and Drummond, 2007) and was set at 100 generations.
Morphology, vegetative and reproductive development 272.3 Results2.3.1 PortieriaForty-two P. hornemannii specimens spanning the Indo-Pacific weremorphologically examined for its vegetative and reproductive development (Table2.1).2.3.2 DescriptionThallus erect, color varying from greenish pink <strong>to</strong> dark red, olderspecimens <strong>be</strong>coming orange <strong>to</strong> brown. Freshly collected specimens exhibiting astrong pungent smell. Thalli attached with a discoid holdfasts or with a crust likebase, sometimes entangled among other seaweeds lacking a clear holdfast. One <strong>to</strong>several axes arising from the base, growing <strong>to</strong> a height of 3- 15 cm (Fig. 2.1a-e).Main axes compressed, 300- 1800 µm wide near the base, gradually narrowing<strong>to</strong>wards the apices, up <strong>to</strong> 1100 µm thick near the base; alternately branched up <strong>to</strong>four <strong>to</strong> five orders. Apices typically incurved, sometimes straight in newlydeveloping axes (Fig. 2.2a and b). Epiphytic specimens often with curled, entwinedaxes, secondarily attached <strong>to</strong> one another by hapteres (Fig. 2.2c).
28 CHAPTER 2Table 2.1. List of specimens used in morphological analyses.Specimen num<strong>be</strong>r Place of collection Date ofcollectionHabitatCollec<strong>to</strong>rDAP102, DAP210,DAP211, DAP212,DAP213, DAP299,DAP713Dapdap, Siquijor, Siquijor,Philippines17.02.200714.04.2007Found from 1<strong>to</strong> 1.5 m depthon rocks and dead coralsexposed <strong>to</strong> wavesD.A. PayoDAP167 Daang-Lungsod, Alcoy, Cebu ,Philippines14.03.2007 Found in a sitewith patchy dead coralsD.A. PayoDAP202, DAP203,DAP204, DAP378,DAP389Takot Sawang, Tambisan, SanJuan, Siquijor, Philippines17.03.2007 In an offshore reefeither epilithic,epiphytic or unattachedD.A. PayoDAP247, DAP249,DAP251Airport side, Silliman Beach,Dumaguete, Negros Oriental,Phlippines30.03.2007 Epilithic on rocksby the airportD.A. PayoDAP285, DAP288Pasig Reef, Maydolong,Eastern Samar, Philippines08.04.2007 In an offshore reefexposed <strong>to</strong> strong wavesD.A. PayoDAP333, DAP337,DAP338, DAP339,DAP342, DAP344,DAP345, DAP346White Beach, Mahatao,Batanes, Philippines21.04.2007 In a furrowedintertidal areaexposed <strong>to</strong> strong wavesD.A. PayoDAP363, DAP366,DAP368Chanaryan, Basco, Batanes,Philippines22.04.2007 In an intertidal areaexposed <strong>to</strong> strong wavesD.A. PayoHEC4217Laing Island, Hansa Bay,Bogia, Madang Province,Papua New Guinea05.1980 Found at the baseof a coral,among Halimedasat 2 m depthE. CoppejansHV584Logon Bay, Malapascua Is.,Philippines22.01.2004 Epiphytic locatedin an intertidal flatH. VerbruggenHV646 Olango, Cebu, Philippines, 25.01.2004 Intertidal flat, epiphytic H. VerbruggenKZN027 Zinkwazi, Black Rock Park,South Africa, KZN1485 PortO'Call, Trafalgar, Kwazulu-Natal, South Africa23.12.1999 Intertidal rock pools O. De ClerckKZN2027KZN2056Palm Beach, Kwazulu-Natal,South AfricaTrafalgar, Kwazulu-Natal,South Africa07.02.2001 Intertidal O. De Clerck08.02.2001 Intertidal O. De ClerckMAS264 Masirah Is., Oman Epilithic at 2.5 m depth T. SchilsODC906 Kaalawai, Oahu, Hawaii 26.04.2003 Shallow subtidal O. De ClerckODC1077Mzamba, Eastern CapeProvince21.08.2005 Intertidal rock poolsand shallow subtidalO. De ClerckODC1160,ODC1164Palm Beach, Kwazulu-Natal,South Africa22.08.2005 O. De ClerckSOC030Nojid, Rhiy di-Qatanhin,Socotra Archipelago, Socotra,YemenFossil reefrock platform, epilithic,shallow subtidal,F. LeliaertSOC154Rhiy di-Irisalepilithic, SocotraArchipelago, Socotra, YemenEpilithic,subtidal,and exposedF. Leliaert
Morphology, vegetative and reproductive development 29Fig. 2.1. General morphology of P. hornemannii. Scale bar: 10mm. (a) DAP703, Dapdap, Siquijor, Siquijor. (b)Sawang, Siquijor. (c) DAP337, White Beach, Mahatao, Batanes (d) DAP345, White Beach, Mahatao, Batanes (e)DAP368, Chanaryan, Basco, Batanes (f) DAP336, White Beach, Mahatao, Batanes.Fig. 2.2. Vegetative morphology of P. hornemannii. (a) Typically inrolled tip of a major axis. Scale bar: 100 µm. (b)Newly developing flat apex. Scale bar: 100 µm. (c) Detail of a haptere anas<strong>to</strong>mosing separate branches. Scale bar:0.5 mm. (d) Longitudinal optical section of the axial filament and the alternating distichous pattern of primarylateral periaxial cells. Scale bar: 100 µm. (e) Detail of the apex and the abaxial branching pattern of the distichousprimary lateral filaments. Scale bar: 10 µm. (f) Surface view of cortical cells. Scale bar: 10 µm. (g) Medullary cells incross sectional view. Scale bar: 100 µm.
30 CHAPTER 2Thallus uniaxial; apical cell conspicuous, dome-shaped, 5- 6 μm x 4-7 µmdimensions. Growth of an indeterminate axis takes place by oblique division of theapical cell with the high side of successive axial cells alternating in a single plane(1/2 divergence). Each axial cell cuts off a first periaxial cell (the initial of a lateralfilament) 1 – 2 cells <strong>be</strong>low the apex, in an alternating distichous pattern (Fig. 2.2dand e). A second periaxial cell is cut off <strong>to</strong>wards the dorsal surface (i.e. away fromthe inrolled apex) approximately 7- 9 cells <strong>be</strong>low the apex. Two additional periaxialcells, one situated <strong>be</strong>low the first periaxial cell and another one at the ventralsurface are then cut off. The first periaxial cell forms a lateral determinate filament.The other periaxial cells do not develop so extensively and contribute mostly <strong>to</strong> thethickness of the axes. There seems <strong>to</strong> <strong>be</strong> no strict pattern in the sequence ofperiaxial cell formation nor are there always four periaxial cells formed per segment.At least three periaxial cells are produced from each axial cell. The first periaxialcells divide <strong>to</strong> produce a lateral determinate filament, up <strong>to</strong> 10 cells long, which arelargely responsible for the lateral expansion of the axes. Each of the cells of a lateralfilament cuts off up a dorsal, ventral and abaxial cell. The abaxial cell forms adominant filament, resulting <strong>to</strong> a secund pattern (Fig. 2.2e). The dorsal and ventralcell form comparatively shorter filaments, contributing only <strong>to</strong> the thickness of thethallus. Peripheral cells will differentiate <strong>to</strong> form a small-celled cortical layer up <strong>to</strong> 3layers thick. Cortical cells measure 5 x 10.3 µm in surface view (Fig. 2.2f). Internalcells enlarge and will form a medulla, up <strong>to</strong> 3 layers thick in the central part of thethallus (Fig. 2.2g). Medullary cells are up <strong>to</strong> 160 µm in diameter. Gland cells, 8 - 25µm in diameter, are formed from the subcortical cells and abound all throughoutthe thallus (Fig. 2.3a). They can also <strong>be</strong> found in the nemathecia. Gland cells aresituated just <strong>be</strong>low the surface and are surrounded by a ring of 5- 7 cortical cells(Fig. 2.3a). The shape of the axial cell changes markedly in older portions of thethallus. About 3 segments <strong>be</strong>low the apex, the axial cell elongates, <strong>be</strong>coming 3.5times longer than broad. At the middle part of the thallus, the axial cell <strong>be</strong>comesbarrel-shaped (210- 270 μm x 50- 90 µm), and the pit connections separatingsuccessive axial cells <strong>be</strong>come very prominent (Fig. 2.3b). The enlarged axial cellcontain up <strong>to</strong> 10 nuclei which stain prominently with aniline blue and haema<strong>to</strong>xylinsolution (Fig. 2.3c). In the basal portions of the thallus, the midsection of the axialcell shrinks, <strong>be</strong>coming bar<strong>be</strong>ll-shaped (Fig. 2.3d).
Morphology, vegetative and reproductive development 31Fig. 2.3. Vegetative morphology of P. hornemannii. (a) Surface view of a conspicuously depressed, large gland cellsurrounded by a ring of cortical cells. Scale bar: 10 µm. (b, c) Detail of a barrel-shaped, multinucleate axial cell. In(c) arrow points <strong>to</strong> a nucleus. Scale bar: 100 µm. (d) Dumb-<strong>be</strong>ll-shaped axial cells observed at the thallus base.Scale bar: 100 µm. (e) Arrow points <strong>to</strong> rhizoidal filaments found at the thallus base. Scale bar: 100 µm. (f) Detail ofthe rhizoidal cells. Scale bar: 10 µm.At the base of the thallus, multinucleated narrow rhizoidal filaments areissued from the axial cells, extending <strong>to</strong>wards the medullary cells, finally passing<strong>be</strong>tween cortical cells <strong>to</strong>wards the periphery of the thallus (Fig. 2.3e and f).Secondary pit connections are not formed. Indeterminate branches are formedevery 2- 10 mm. Similar <strong>to</strong> the formation of determinate laterals, indeterminatebranches are also formed in the same plane. Indeterminate branches originate in aholoblastic manner, i.e. <strong>be</strong>ing formed in addition <strong>to</strong> the periaxial cells. Thebranching pattern of the newly formed axes repeats that of the main axes.2.3.3 Reproductive morphologyGame<strong>to</strong>phytes are dioecious. Spermatangial branches are borne in sessilenemathecia which vary in size and shape (258- 864 μm x 129- 748 µm) and areproduced on the thallus surface (Fig. 2.4a). Spermatangial filaments are compactlyarranged in the nemathecia. Sterile paraphyses are absent but gland cells may <strong>be</strong>observed. Fully developed spermatangial branches are enveloped in a mucilaginouscoating and reach 30- 147 µm long. The spermatangial branches cut off at least 9-
32 CHAPTER 210 spermatia (3- 5µm). Development of the branch <strong>be</strong>gins with a round basal cellcutting off two cells that elongate and divide in<strong>to</strong> a 4 <strong>to</strong> 6-celled filament (Fig. 2.4band c). The cells forming the new spermatangial filament serve as the initials for thespermatia. Up <strong>to</strong> 3 spermatia are formed per cell (Fig. 2.4d and e).Fig. 2.4. Development of male reproductive structures in P. hornemannii. (a) Surface view of a sessile nemathecium.Scale bar: 100 µm. (b) Transverse section of elongated daughter cells originating from a basal cell during the earlydevelopment of spermatangial filaments. Scale bar: 10 µm. (c) Daughters cells formed from subsequent peri- andanticlinal cell division of the elongated cells. Scale bar: 10 µm. (d) Fully developed spermatangial branches. Scalebar: 100 µm. (e) A mature spermatangial branch <strong>be</strong>aring spermatia. Scale bar: 10 µm.Globular cys<strong>to</strong>carps (300- 500 µm) are borne on either side of the thallus atthe base of the ultimate or penultimate lateral branchlets. Carpogonial and auxiliarybranches occur in the same nemathecium (Fig. 2.5a-Fig. 2.5c). Thecarposporophyte development is non-procarpic (Fig. 2.5d-j). Early development ofa nemathecium starts with cortical cells cutting off two initials from which auxiliaryfilaments, carpogonial branches and sterile paraphyses develop. Every matureauxiliary and carpogonial branch is paired with a sterile filament. Paraphyses, 60- 80µm long, are unbranched except for the distal end. In the development of theauxiliary branch, an apical initial undergoes two or three periclinal divisions <strong>to</strong> forma three or sometimes four-celled branch, consisting of a darkly staining basal cell (7-18 μm x 3- 7 μm), an auxiliary cell (4- 7 μm x 4- 7 μm) and a terminal cell (6- 8 μmx 4-6 μm). The basal cell is markedly broader and longer compared <strong>to</strong> the auxiliaryand terminal cells.
Morphology, vegetative and reproductive development 33Fig. 2.5. Female reproductive structures and carposporophyte development in P. hornemannii. (a) Unfertilizedcarpogonial branch - trichogyne (tr) and carpogonium (cp). Scale bar: 50 µm. (b) Several auxiliary branches in anemathecium. Scale bar: 50 µm. (c) Auxilliary branch - basal cell (bc), auxilliary cell (aux), and terminal cell (tc) anda sterile nemathecial filament (nf). Scale bar: 10 µm. (d) Fertilized carpogonium. Scale bar: 10 µm. (e) and (f) Aconnecting filament (cf) connects the carpogonium <strong>to</strong> the auxilliary cell. Scale bar: 10 µm. (g) Gonimoblast initial(gi) developing from auxilliary cell. Scale bar: 10 µm. (h) A developing carposporophyte. Scale bar: 50µm. (i) Crosssection of a cys<strong>to</strong>carp with fully developed gonimoblasts. Scale bar: 100 µm. (j) Carpospores (cps). Scale bar: 10µm. (k) Hair cell from a sterile nemathecial filament. Scale bar: 10 µm.The basal cell and terminal cell may have nutritive purposes for the developinggonimoblasts after fertilization. Carpogonial branches were only rarely observed.Four-celled carpogonial branches which include a basal cell, a subhypogynous cell, ahypogynous cell, and a terminal carpogonium with trichogyne (133 µm long) reacha length of about 178 μm. The formation of the branch <strong>be</strong>gins with periclinaldivision of an apical initial. The resulting two cells undergo substantial elongationwith the upper cell subsequently forming a long extension. The initial furtherundergoes anticlinal division resulting <strong>to</strong> a 3 or 4-celled branch with the terminalcell <strong>be</strong>coming the carpogonium with a trichogynal extension. Only a short receptiveportion of the trichogynal process projects above the rest of the nemathecialfilaments. Hair cells can also <strong>be</strong> found in the nemathecium and can <strong>be</strong> mistaken as atrichogyne of a carpogonial branch (Fig. 2.5k). Following fertilization,
34 CHAPTER 2subhypogynous and hypogynous cells fuse with the carpogonium and produce anon-septate connecting filament (Fig. 2.5d-e). The connecting filament fuses withan auxiliary cell which then <strong>be</strong>gins <strong>to</strong> extend at its upper tip, reorienting obliquelyevading the terminal cell. From the expanded auxiliary cell, several gonimoblastinitials are issued from which carpospores develop (Fig. 2.5g). After fertilization and<strong>be</strong>fore fusing with the connecting filament of a carpogonial branch, the auxiliarycell appears completely stretched and loses its deep staining character. Even afterthe appearance of gonimoblast initials, auxiliary cell remains attached <strong>to</strong> the basaland terminal cells. The basal cell of the auxiliary branch forms a distinctive stalk anddoes not participate in the carpospore development. Succeeding divisions ofcarpospores occurs in all directions, which explains the irregularly globular structureof a nemathecium. A well-documented post-fertilization pattern reported in othergenera within Gigartinales (e.g. Dudresnaya, Gigartina, Kallymenia, and Waernia)(Robins and Kraft, 1985; Hommersand and Fredericq, 1990; Hommersand et al.,1992; Wilce et al., 2003, Rodriguez-Prie<strong>to</strong> and Hommersand, 2009) is suggested inPortieria. The presence of a conspicuous num<strong>be</strong>r of auxiliary branches within anemathecium compared <strong>to</strong> a rather obscure presence of a carpogonial branch mostlikely suggests that a single carpogonial branch when fertilized, produces severalcopies of the now diploid nucleus, forms several connecting filaments, and depositsa nucleus <strong>to</strong> a num<strong>be</strong>r of auxilliary branches, such that a single fertilization canproduce several gonimoblasts. As observed, a single connecting filament can form acontinuous link among succeeding auxiliary cells forming a long chain. Within thenemathecium, clusters of carpospores are separated in<strong>to</strong> pockets by a thin layer ofsterile cells. The entire nemathecium is covered by a mucilaginous coating.Tetrasporangial nemathecia are initially formed on the surfaces of theultimate and penultimate branches and later spread out in the entire thallus withonly small surfaces free of tetrasporangia (Fig. 2.6a). They are enclosed in a flat,sessile nemathecium (258- 903 μm x 129- 194 μm). Similar <strong>to</strong> the spermatangialnemathecium, sterile paraphyses are lacking. The entire nemathecium is alsoenclosed in a mucilaginous coating (Fig. 2.6b). Tetrasporangia (L - 25.6 -32.0 μm)are zonate and are transversely <strong>to</strong> obliquely divided. They develop from a basal celloriginating from the cortex, which cuts off two tetrasporangial mother cells. Theseundergo meiosis and giving rise <strong>to</strong> four (sometimes 3- 6) haploid spores (Fig. 2.6band c).
Morphology, vegetative and reproductive development 35Fig. 2.6. Tetrasporore development in P. hornemannii. (a) Surface view of a tetrasporangial nemathecium. Scale bar:100 µm. (b) Compact arrangement of tetrasporangia covered in transverse section. Scale bar: 100 µm. (c) Detail ofzonately divided tetrasporangia. Scale bar: 10 µm.2.3.4 Molecular phylogeneticsThe molecular data set consisted of rbcL (1430 bp) and LSU nrRNA gene(2659 bp) sequences consisting of 4 Rhizophyllidacean genera and 3 closely relatedfamilies (Dumontiaceae, Kallymeniaceae, and Polyidaceae) (Table 2.2). The twodatasets were concatenated <strong>to</strong> include a <strong>to</strong>tal of 4088 characters, 997 of which wereparsimony informative. The placements of the different genera within theRhizophyllidacean clade were also inconsistent in the datasets. BI and ML treesinferred from the concatenated datasets of rbcL and LSU nrRNA genes showed anidentical <strong>to</strong>pology with an exclusive Rhizophyllidacean clade (Fig. 2.7). Bootstrapand BI support values of the family were high (100% for both) with Kallymeniacribrosa as the closest relative. Bootstrap and BI support values for intragenericrelationships were high (99- 100%) except for the low support on the nodeseparating Och<strong>to</strong>des and Nesophila (46% and 75%, respectively). Branch lengthsseparating Portieria, Nesophila and Och<strong>to</strong>des are relatively short compared <strong>to</strong> thebranch leading <strong>to</strong> Contarinia.
36 CHAPTER 2Fig. 2.7. Maximum likelihood phylogeny of family Rhizophyllidaceae based from combined rbcL and LSU nrRNAgene sequences. Node support values are given at each ramification (ML and BI). The log-likelihood value of thetree is - 10542.80329. Base frequencies are A = 0.26209, C = 0.19951, G = 0.27892, T = 0.25949. The substitutionrates are AC = 0.67945, AG = 2.29698, AT = 2.49003, CG = 0.88817, CT = 6.35790, GT = 1.0000. Theproportion of invariable sites in the alignment is 0.504 and the shape parameter of the gamma distribution amongsite rate heterogeneity is 0.735.
Morphology, vegetative and reproductive development 37Table 2.2. List of species used in the rbcL and LSU nrDNA analyses with accession num<strong>be</strong>rs.Species Gene Location Collec<strong>to</strong>r, date Accession Specimennum<strong>be</strong>rSourcePortieria hornemannii(Lyngbye) P.C. SilvaLSU nrDNADapdap,Siquijor,Siquijor,PhilippinesDA Payo,15.03.2007DAP213This studyrbc L South Africa S. Fredericq AF212185 Fredericq et al., 1999Och<strong>to</strong>des secundiramea(Montagne) M.A. HoweLSU nrDNARocher duDiamant,MartiniqueD. and M. Littler DML30919 This studyrbc LBaie Olive,GuadeloupeA. Renoux EU349209 Krayesky et al ., 2007Nesophila hoggardiiW.A.Nelson & N.M.AdamsLSU nrDNAMatu KapitiI.,New ZealandW. Nelson20.12.1994EU349089 Krayesky et al ., 2007rbc LMatu KapitiI.,New ZealandW. Nelson20.12.1994EU349210 Krayesky et al ., 2007Contarinia squamariae(Meneghini) DenizotLSU nrDNABegur,Catalunya,SpainO. De Clerck,18.01.2008ODC1498This studyrbc LBegur,Catalunya,SpainO. De Clerck,18.01.2008ODC1498This studyKallymenia cribrosaHarveyLSU nrDNA - J.T Harper andG.W. SaundersAY171611Harper andSaunders, 2002rbc LAustralia:Tarcoola BeachM.H. & F.Hommersand21.09.1995EU349216 Krayesky et al ., 2007Polyides rotundus(Hudson) GaillonLSU nrDNAPointe duNid de Cor<strong>be</strong>t,Audresselles,Nord-Pas deCalais, FranceO. De Clerck,16.09.2004ODC1014This studyrbc LPenmaich,Brittany,FranceD.W. Freshwater U04214 Fredericq et al ., 1996Dumontia con<strong>to</strong>rta(S.G. Gmelin) RuprechtLSU nrDNAManomet Bluffs,Plymouth Co.,MA, USAM.H. Hommersand,23.04.1993EU349094 Krayesky et al ., 2007rbc LUSA: ManometBluffs, PlymouthCo, MAM.H. Hommersand,23.04.1993AY294378Gavio andFredericq, 2003
38 CHAPTER 22.4 DiscussionDetailed observations of the vegetative morphology and reproductivestructures are presented for the genus Portieria (formerly Chondrococcus and Desmia).Despite considerable variation in external morphology, all genera of theRhizophyllidaceae share a similar basic structure, differing only in minor details. Allgenera are pseudoparenchyma<strong>to</strong>us with inner cells differentiated in<strong>to</strong> a cellularmedulla while peripheral cells form a small-celled, pigmented cortical layer. Thinrhizoidal filaments are interspersed in the medullary region of all four genera.Secondary pit connections, although reported for the Rhizophyllidaceae by Millar(1990) as cited from Wiseman (1973), appear <strong>to</strong> <strong>be</strong> absent. Wiseman, however, didnot mention presence of secondary pit connections in both Och<strong>to</strong>des and Portieria.Studies on Nesophila and Contarinia do not mention presence or absence of thischaracter (Denizot, 1968; Nelson and Adams, 1996; Berecibar et al., 2009). Itsabsence might <strong>be</strong> a uniform characteristic of the family but this will needconfirmation.Another consistent vegetative character is the presence of large prominentgland cells located in the cortex. In Portieria, these cells are suspected <strong>to</strong> harborhalogenated monoterpenes (Meñez et al., 1996). The uniaxial growth pattern isshared with Nesophila and Contarinia, but not with Och<strong>to</strong>des in which growth isinitiated by a pair of apical cells which give rise <strong>to</strong> a helicoid biaxis (Joly andUgadim, 1966; Wiseman, 1976). A truly biaxial organization as observed in Och<strong>to</strong>desis unique within the red algae, but despite the fact that 2 axial filaments are formedthe fundamental structure of the thallus is very similar <strong>to</strong> that observed in Portieria.The most important difference is presented by the num<strong>be</strong>r of periaxial cells whichis cut off from each axial cell. In Portieria 3 or 4 periaxial cells are formed, compared<strong>to</strong> only 2 in Och<strong>to</strong>des. Unfortunately, this information is lacking for both Contariniaand Nesophila. The axial cells are large and prominent in all genera but the shape ofthe cells varies. In Portieria, the axial cells are barrel-shaped, multinucleate andpossess conspicuously broad pit connections. The axial cells of Nesophila, Och<strong>to</strong>desand Contarinia appear long and cylindrical (Nelson and Adams, 1996; Berecibar etal., 2009).Reproductive features are conserved in the Rhizophyllidaceae as suggestedby Kylin (1956) and confirmed by the works of Wiseman (1977), Nelson & Adams(1996), Berecibar et al. (2009) and this study. Although Wiseman (1977) reports thatOch<strong>to</strong>des can <strong>be</strong> procarpic and non-procarpic, mem<strong>be</strong>rs of the family are generallyand perhaps, exclusively non-procarpic. The non-procarpic character as exhibited in
Morphology, vegetative and reproductive development 39Portieria and the rest of the family, which permits a series of diploid nuclei transferfrom a single fertilization, increases the certainty of successful continuation of a se<strong>to</strong>f genetic characteristics. This reproductive strategy may <strong>be</strong> partially limiting interms of genetic diversity compared <strong>to</strong> a procarpic one where carporsporophytesare potentially offsprings of different male gametes. This limitation is howevercompensated by the possibility of increased genetic recombination by meiosisduring sporangial development (Hawkes, 1990).The presence of male, female and tetrasporangial nemathecia are consistentthroughout Rhizophyllidaceae. In Portieria, nemathecia are borne in both surfaces ofthe thallus. The upright habit of Portieria probably permits its presence on bothsurfaces as opposed <strong>to</strong> the creeping habit of Contarinia where nemathecia areformed on dorsal surfaces (Berecibar et al., 2009). This is probably particularlyimportant for female game<strong>to</strong>phytes in achieving a greater settling surface forspermatia. While for tetrasporophytes and male game<strong>to</strong>phytes, the increased surfacealso allow for a greater num<strong>be</strong>r of spores. Tetrasporangia and spermatia are formedin nemathecia lacking sterile paraphyses. Tetrasporangia are zonately <strong>to</strong> irregularlyzonately divided. Spermatia are formed by means of anticlinal divisions from a 4 <strong>to</strong>6-celled filament. The female reproductive structures are likewise very similaramong all four genera. Auxiliary and carpogonial cell filaments are produced in thesame nemathecia interspersed with sterile nutritive filaments. The auxiliary cellfilaments are usually 3 <strong>to</strong> 4-celled with a large basal cell subtending the auxiliary cell.Kylin (1956) was unable <strong>to</strong> observe the early post fertilization events in Portieria.From the structural observations, however, he hypothesized that the transfer of thediploid nucleus from carpogonium <strong>to</strong> the auxiliary cell would <strong>be</strong> mediated by meansof a connecting filament. Wiseman in his unpublished thesis was also unable <strong>to</strong>follow the details of post-fertilization development with certainty in Portieria. Ourobservations clearly demonstrate that a connecting filament, issued from a fusioncell which includes the carpogonium, hypogynous and subhypogynous cell, fuseswith a nearby auxiliary cell. These observations are congruent with those fromOch<strong>to</strong>des (Wiseman, 1977) and Contarinia (Berecibar et al., 2009).While the taxonomic position of the Rhizophyllidaceae in the orderGigartinales has <strong>be</strong>en confirmed using small subunit (SSU) rDNA gene sequences(Tai et al., 2001; Saunders et al., 2004) and combined multi-gene datasets(Verbruggen et al., 2010), phylogenetic relationships within Rhizophyllidaceangenera have not <strong>be</strong>en examined. The close relationship of the genera of theRhizophyllidaceae is confirmed by means of molecular sequence analyses, whichresolves Contarinia as the sister taxon of a clade uniting Nesophila, Och<strong>to</strong>des and
40 CHAPTER 2Portieria. The relationships among the latter genera remain largely unresolved. Inthis respect, it is important that the genus Contarinia was represented in the analysisby C. squamariae and not by the type of the genus Contarinia peyssonneliaeformisZanardini, which was unfortunately unavailable for the study. Especially the lattergenus, with currently 5 species, remains highly understudied at present, and itsmonophyletic nature is all but certain. Future studies may reveal that Contarinia ispresent only in the Mediterranean Sea and warm temperate Eastern Atlantic Ocean,while all other species attributed <strong>to</strong> the genus <strong>be</strong>long <strong>to</strong> widely divergent lineages.2.5 AcknowledgementsWe are grateful <strong>to</strong> the following for samples provided: E. Coppejans, F. Leliaert, H.Verbruggen, W. Prud‘homme Van Reine, M. Hommersand, D. and M. Littler, T. Cowling,A. Sherwood, W. Villaver, R. Ladiao, F. Fumar, J. Lucañas and A. Bucol. Thanks are alsodue <strong>to</strong> Prof. D. Reid Wiseman who generously sent a copy of his PhD thesis on Och<strong>to</strong>desand Chondrococcus <strong>to</strong> us. We also thank two anonymous reviewers for their valuablecomments and suggestions. The research is funded by the Flemish Interuniversity Council(VLIR) as part of the PhD grant <strong>to</strong> D.A. Payo.
Morphology, vegetative and reproductive development 412.6 ReferencesAbbott, I.A., 1999. Marine Red Algae of the Hawaiian Islands. Bishop Museum Press, Honolulu,Hawaii.Agardh, J.G., 1876. Species genera et ordines algarum, seu descriptiones succinctae specierum,generum et ordinum, quibus algarum regnum constituitur. Volumen tertium: de Florideiscurae posteriores. Part 1. C.W.K. Gleerup, Lipsiae [Leipzig].Benhissoune, S., Boudouresque, C.F., Perret-Boudouresque, M., Verlaque, M., 2002. A checklist ofthe seaweeds of the Mediterranean and Atlantic coasts of Morocco. III. Rhodophyceae(excluding Ceramiales). Bot. Mar. 45, 391-412.Berecibar, E., Wynne, M.J., San<strong>to</strong>s, R., 2009. First record of Contarinia squamariae (Rhizophyllidaceae,Rhodophyta) from Portugal: description of morphological and reproductive structures. Bot.Mar. 52, 15-23.De Clerck, O., Gavio, B., Fredericq, S., Cocquyt, E., Coppejans, E., 2005. Systematic reassessment ofthe red algal genus Phyllymenia (Halymeniaceae, Rhodophyta). Eur. J. Phycol. 40, 169-178.Denizot, M., 1968. Les algues Floridées Encrustantes (à l'exclusion des Corallinacées). Labora<strong>to</strong>ire deCryp<strong>to</strong>gamie, Muséum National d'His<strong>to</strong>ire Naturelle, Paris.Feldmann, J., 1939. Les algues marines de la côte des Albères. IV. Rhodophycées. Revue Algologique 11,247-330.Fredericq, S., Hommersand, M., Freshwater, D.W., 1996. The molecular systematics of some agar-andcarrageenan-containing marine red algae based on rbcL sequence analysis. Hydrobiologia 326,125–135.Guindon, S., Dufayard, J.F., Hordijk, W., Lefort, V., Gascuel, O., 2009. PhyML: fast and accuratephylogeny reconstruction by maximum likelihood. Infect. Genet. Evol. 9, 384-385.Guiry, M.D., Guiry, G.M., 2010, Algaebase.World-wide electronic publication, National University ofIreland, Galway. searched on 07 April 2010. http://www.algaebase.org.Hall, T.A., 1999. BioEdit: a user-friendly biological sequence alignment edi<strong>to</strong>r and analysis programfor Windows 95/98/NT. Nucl. Acids. Symp. Ser. 41, 95-98.Harper, J.T., Saunders, G.W., 2001. Molecular systematics of the Florideophyceae (Rhodophyta) usingnuclear large and small subunit rDNA sequence data. J. Phycol. 37, 1073-1082.Hawkes, M.W., 1990. Reproductive strategies. In: Cole, K.M., Sheath, R.G. (Eds.),Biology of the red algae. Cambridge University Press, New York, pp. 455–476.Harper, J.T., Saunders, G.W., 2002. Using molecular data <strong>to</strong> resolve the taxonomic limits of thegenera Callophyllis, Euthora and Pugetia (Kallymeniaceae, Rhodophyta). Phycol. Res. 50, 275–281.Hawkes, M.W., 1990. Reproductive strategies. In: Cole, K.M., Sheath, R.G. (Eds.), Biology of the redalgae. Cambridge University Press, New York, pp. 455–476.Hommersand, M., Fredericq, S., 1990. Sexual reproduction and cys<strong>to</strong>carp development. In: Cole,K.M., Sheath, R.G. (Eds.), Biology of the red algae. Cambridge University Press, New York,pp. 305–345.Hommersand, M., Fredericq, S., Cabioch, J., 1992. Developmental morphology of Gigartina pistillata(Gigartinaceae, Rhodophyta). Phycologia 31, 300-325.Huelsen<strong>be</strong>ck, J.P., Ronquist, F., 2001. MRBAYES: Bayesian inference of phylogenetic trees.Bioinformatics 17, 754-755.Joly, A.B., Ugadim, Y., 1966. The reproduction of Och<strong>to</strong>des secundiramea (Montagne (Gigartinales,Rhizophyllidaceae). Bo.l Ins. Oceanogr. 15, 55-64.Ka<strong>to</strong>h, K., Toh, H., 2008. Improved accuracy of multiple ncRNA alignment by incorporatingstructural information in<strong>to</strong> a MAFFT-based framework. BMC Bioinformatics 9, 212.
42 CHAPTER 2Krayesky, D.M., Norris, J.N., Gabrielson, P.W., Gabriela, D., Fredericq, S., 2009. A new order of redalgae based on the Peyssonneliaceae, with an evaluation of the ordinal classification of theFlorideophyceae (Rhodophyta). Proc. Biol. Soc. Wash. 122, 364-391.Kützing, F.T., 1867. Tabulae phycologicae; oder, Abbildungen der Tange. Gedruckt auf kosten desVerfassers (in commission <strong>be</strong>i W. Köhne). Nordhausen.Kylin, H., 1930. Ü<strong>be</strong>r die Entwicklungsgeschichte der Florideen, von Harald Kylin. CWK Gleerup.Kylin, H., 1956. Die Gattungen der Rhodophyceen. CWK Gleerups Förlag, Lund.Lyngbye, H.C., 1819. Tentamen hydrophy<strong>to</strong>logiae danicae continens omnia hydrophyta cryp<strong>to</strong>gamaDaniae, Holsatiae, Faeroae, Islandiae, Groenlandiae hucusque cognita, systematice disposita,descripta et iconibus illustrata, adjectis simul speciebus norvegicis. typis Schultzianis, incommissis Librariae Gyldendaliae., Hafniae [Copenhagen].Meñez, E.G., Calumpong, H.P., Newman, D.J., West, J.A., 1996. An account of the red alga Portieriahornemannii (Gigartinales, Rhodophyllidaceae) from the Philippines. Nova Hedwigia 112, 161-170.Millar, A.J.K., 1990. Marine red algae of the Coffs Harbour region, northern New South Wales. Aust.Syst. Bot. 3, 293-593.Nelson, W.A., Adams, N.M., 1996. Nesophila hoggardii gen. et sp. nov. (Rhizophyllidaceae, Rhodophyta)from offshore islands of northern New Zealand. Museum N.Z. Te Papa Tongarewa 5, 1-8.Oliveira, E., Österlund, K., M<strong>to</strong>lera, M.S.P., 2005. Marine Plants of Tanzania. A Field Guide <strong>to</strong> theSeaweeds and Seagrasses. Botany Department, S<strong>to</strong>ckholm University, S<strong>to</strong>ckholm.Peña, V., Bárbara, I., 2010. New records of crus<strong>to</strong>se seaweeds associated with subtidal maerl <strong>be</strong>ds andgravel bot<strong>to</strong>ms in Galicia (NW Spain). Bot. Mar. 53, 41-61.Posada, D., Buckley, T.R., 2004. Model selection and model averaging in phylogenetics: advantages ofAkaike information criterion and Bayesian approaches over likelihood ratio tests. Syst. Biol.53, 793-808.Posada, D., Crandall, K.A., 1998. MODELTEST: testing the model of DNA substitution.Bioinformatics 14, 817-818.Robins, P.A., Kraft, G.T., 1985. Morphology of the type and Australian species of Dudresnaya(Dumontiaceae, Rhodophyta). Phycologia 24, 1–34.Rodriguez-Prie<strong>to</strong>, C., Hommersand, M., 2009. Behaviour of the nuclei in pre- and postfertilizationstages in Kallymenia (Kallymeniaceae, Rhodophyta). Phycologia 48, 138–155.Rambaut, A., Drummond, A.J., 2007, Tracer v1.4.Available free from http://<strong>be</strong>ast.bio.ed.ac.uk/Tracer.Saunders, G., Chiovitti, A., Kraft, G., 2004. Small-subunit rDNA sequences from representatives ofselected families of the Gigartinales and Rhodymeniales (Rhodophyta) 3. Delineating theGigartinales sensu stric<strong>to</strong>. Botany 82, 43-74.Schmitz, F., 1889. Systematische Ü<strong>be</strong>rsicht der bisher <strong>be</strong>kannten Gattungen der Florideen. Flora oderAllgemeine botanische Zeitung 72, 435-456, pl. XXI.Silva, P.C., Meñez, E.G., Moe, R.L., 1987. Catalog of the Benthic Marine Algae of the Philippines.Smithsonian Institution Press, Washing<strong>to</strong>n, D.C.Tai, V., Lindstrom, S.C., Saunders, G.W., 2001. Phylogeny of the Dumontiaceae (Gigartinales,Rhodophyta) and associated families based on SSU rDNA and internal transcri<strong>be</strong>d spacersequence data. J. Phycol. 37, 184-196.Tamura, K., Dudley, J., Nei, M., Kumar, S., 2007. MEGA 4: molecular evolutionary genetics analysis(MEGA) software version 4.0. Mol. Biol. Evol. 24, 1596-1599.Verbruggen, H., Maggs, C., Saunders, G., Le Gall, L., Yoon, H., De Clerck, O., 2010. Data miningapproach identifies research priorities and data requirements for resolving the red algal treeof life. BMC Evol. Biol. 10, 16.Wang, H.W., Kawaguchi, S., Horiguchi, T., Masuda, M., 2000. Reinstatement of Grateloupia catenata(Rhodophyta, Halymeniaceae) on the basis of morphology and rbcL sequences. Phycologia 39,228-237.
Morphology, vegetative and reproductive development 43Wilce, R.T., Maggs, C.A., Sears, J.R., 2003. Waernia mirabilis gen. nov., sp nov (Dumontiaceae,Gigartinales): A new noncoralline crus<strong>to</strong>se red alga from the Northwestern Atlantic Oceanand its relationship <strong>to</strong> Gainia and Blinksia. J. Phycol. 39, 198–212.Wilkes, R.J., McIvor, L.M., Guiry, M.D., 2005. Using rbcL sequence data <strong>to</strong> reassess the taxonomicposition of some Grateloupia and Dermocorynus species (Halymeniaceae, Rhodophyta) fromthe North-Eastern Atlantic. Eur. J. Phycol. 40, 53-60.Wiseman, D.R., 1973, Morphological and Taxonomic Studies of the Red Algal Genera Och<strong>to</strong>des andChondrococcus. Department of Botany. Duke University, p. 234.Wiseman, D.R., 1975. On the status of the red algal family, the Rhizophyllidaceae (Gigartinales).Taxon 24, 489-490.Wiseman, D.R., 1976. Observations of the vegetative morphology of the red algal genus Och<strong>to</strong>des J.Agardh (Rhizophyllidaceae, Gigartinales). Phycologia 15, 143-147.Wiseman, D.R., 1977. Observations of the reproductive morphology of the red algal genus Och<strong>to</strong>des J.Agardh (Rhizophyllidaceae, Gigartinales). Phycologia 16, 1-8.Wittmann, W., 1965. Ace<strong>to</strong>-iron-haema<strong>to</strong>xylin-chloral hydrate for chromosome staining. BiotechHis<strong>to</strong>chem 40, 161-164.Zanardini, G., 1851. Algae novae vel minus cognitae in mari Rubro a Portiero collectae. Flora 34, 33-38.
44 CHAPTER 2
3 THE RED ALGAL GENUS PORTIERIA IN THEPHILIPPINES: SPECIES DELIMITATION ANDDIVERSITY PATTERN 1AbstractIn this paper we address the diversity of the red algal genus Portieria in the Philippines.Traditionally, only one or two species are recognized. We apply gene sequence data <strong>to</strong>delimit species and compare methods that rely on a single locus with multilocus speciesdelimitation approaches. Single-locus approach, applied <strong>to</strong> a mi<strong>to</strong>chondrial cox2-3 spacer,makes use of a General Mixed Yule Coalescent model <strong>to</strong> detect species boundaries. Themultilocus approach uses a Bayesian modelling approach <strong>to</strong> generate the posteriorprobabilities of species assignments taking account of uncertainties due <strong>to</strong> incongruence<strong>be</strong>tween individual gene trees caused by the ancestral coalescent process. The outcomes ofboth analyses are highly congruent and result in the recognition of 21 species of Portieria inthe Philippines. This finding is important with respect <strong>to</strong> the use of cox2-3 gene sequencefor species delimitation in this group of algae. Species distributions are highly structuredwith the great majority of species <strong>be</strong>ing confined <strong>to</strong> a small geographic range (
46 CHAPTER 33.1 IntroductionSpecies are fundamental units of natural diversity. Correctly delimiting andidentifying these units is of interest not only for systematists and evolutionarybiologists, but also <strong>to</strong> ecologists, conservation biologists and natural productchemists (Harrison, 1998; Pietra, 2002). Correctly assessing species-level diversityand the geographic ranges of the respective species has direct consequences formanagement and policy making. Despite its relevance, the delimitation of species isfar from clear-cut and the application of different criteria may result in widelydiverging estimates of species richness and profoundly influence our understandingof diversity patterns at regional as well as global scales (Wiens and Penkrot, 2002;Sites and Marshall, 2003; Agapow et al., 2004; Sites and Marshall, 2004; Wiens,2007).Delimitation of species is closely tied <strong>to</strong> conceptual issues on what aspecies precisely is and how they should <strong>be</strong> defined (Mayden, 1997). The literatureon species concepts is vast and a fair num<strong>be</strong>r of systematists spend the good latterhalf of the 20th century disagreeing on which concept <strong>to</strong> apply (Mayden, 1997; DeQueiroz, 1998; Lee, 2003; Sites and Marshall, 2003). A remarkably simple andelegant consensus, however, emerged by decoupling a primary from secondaryspecies concepts. The primary concept, known as the species lineage concept orunified species concept, regards a species as a separately evolving metapopulationlineage. The existence of separately evolving lineages is treated as the only necessaryproperty of a species and conflict resulting from the application of different speciesconcepts arises <strong>be</strong>cause secondary species concepts are manifested at differentpoints in time during the process of speciation. Hence, these secondary criteria (e.g.reproductive isolation, diagnosability, niche differentiation, monophyly, etc.) arerelevant only <strong>to</strong> assess lineage separation (De Queiroz, 1998, 2007). Applying thelineage species concept then <strong>be</strong>comes a matter of identifying separately evolvinglineages.The ease by which genetic sequences are generated nowadays has propelledthe use of such data <strong>to</strong> identify separately evolving lineages and <strong>to</strong> infer speciesboundaries (Knowles and Carstens, 2007). Over the past 15 years, a whole suite ofmethods have <strong>be</strong>en proposed <strong>to</strong> delimit species based on gene sequence data(reviewed in Sites and Marshall, 2003). These methods differ conceptually in <strong>be</strong>ingtree-based or not, requiring prior knowledge on group mem<strong>be</strong>rship or not, relyingon a single locus or examining the signal in multiple independent loci. The mostpopular approach equates the species boundary with the identification of
Species delimitation and diversity pattern in the Philippines 47reciprocally monophyletic groups which have noticeably diverged from other suchgroups. Commonly a threshold of sequence divergence, the ―barcoding gap‖,arbitrarily defined as 10 times the mean intraspecific variation for the group understudy, is applied (He<strong>be</strong>rt et al., 2003; He<strong>be</strong>rt et al., 2004). Exclusivity criteria, such asa barcoding gap for species delimitation are intuitively appealing for a variety ofreasons. Perhaps most notably, they provide a utilitarian approach of broadapplicability across disparate taxa (Knowles and Carstens, 2007). In addition mostmethodologies which apply the exclusivity criterion use a single locus, which maketheir application considerably easier from a practical point of view. This approach,however, has <strong>be</strong>en criticized on various grounds. Empirical as well as simulationstudies demonstrated that traditional barcoding studies often fail <strong>to</strong> correctly delimitspecies, especially in understudied groups of organisms (Meyer and Paulay, 2005;Hickerson et al., 2006; Meier et al., 2006; Bittner et al., 2010). However, a morefundamental criticism applies. Single-gene barcoding studies assume that theinferred gene tree is representative for the true species phylogeny. A num<strong>be</strong>r ofprocesses, such as lineage sorting, introgression and undetected gene duplicationmay cause gene trees <strong>to</strong> disagree with the species tree (Heled and Drummond,2010; O'Meara, 2010). Genetic loci undergo a transition from an initial state ofpolyphyly or paraphyly upon lineage splitting <strong>to</strong>ward monophyly as the time sincespeciation increases (Avise and Ball, 1990). So even though eventually all taxa might<strong>be</strong> delimited with a criterion like reciprocal monophyly, recently diverged specieswill only rarely meet this assumption. Analytical expectations derived frompopulation genetic theory indicate that a substantial amount of time is required afterthe initial divergence of species <strong>be</strong>fore there will <strong>be</strong> a high probability of observingreciprocal monophyly (Hudson and Coyne, 2002). The time needed <strong>to</strong> obtainreciprocally monophyletic lineages is proportional <strong>to</strong> the effective population size aswell as the origin of molecular markers used (e.g., organelle versus nuclear DNA orcoding versus non-coding sequences) (Hudson and Turelli, 2003). Given the timeneeded <strong>to</strong> achieve reciprocal monophyly a growing num<strong>be</strong>r of systematists considerit an unrealistic assumption and a num<strong>be</strong>r of alternative species delimitationmethodologies, relying on multiple loci, have <strong>be</strong>en developed which model therelationship <strong>be</strong>tween the gene trees and the species his<strong>to</strong>ry probabilistically(Maddison, 1997; Hickerson et al., 2006; Knowles and Carstens, 2007; Heled andDrummond, 2010; O'Meara, 2010).In this paper, we compare techniques which rely on some sort ofexclusivity criterion with recently developed multilocus methods that do not requirereciprocal monophyly. We use the red algal genus Portieria in the Philippines as a
48 CHAPTER 3test case. Portieria is fairly common on coral reefs where it occurs from the shallowsubtidal down <strong>to</strong> 40 m deep. Two species are reported in the Philippines: P.hornemannii and P. japonica. Due <strong>to</strong> its secondary metabolic compounds, halogenatedmonoterpenes, this seaweed persists even in areas with extensive grazing byherbivorous fish (Meyer et al., 1994a, b; Puglisi and Paul, 1997; Matlock et al.,1999), although their secondary metabolites apparently do not protect them from<strong>be</strong>ing grazed by the sea hare Aplysia parvula (Ginsburg and Paul, 2001). Six speciesare flagged as currently accepted (Guiry and Guiry, 2010), but there is considerableuncertainty on the num<strong>be</strong>r Portieria species <strong>to</strong> <strong>be</strong> recognized. Wiseman (1973), whoconducted the only comprehensive study on the morphology and diversity ofPortieria, applied a particularly broad species concept by recognizing only onespecies, P. hornemannii. Other authors have expressed doubts on this highlyrestricted view and have variously recognized a varying num<strong>be</strong>r of species (Silva etal., 1996; De Clerck et al., 2005a). Species diversity, however, has up <strong>to</strong> now not<strong>be</strong>en assessed using DNA sequence data. We compare species delimitation basedon a single locus dataset with multilocus coalescent-based approaches. A firstdelimitation is based on a single locus, the mi<strong>to</strong>chondrial cox2-3 spacer (Zuccarelloet al., 1999). We apply a general mixed Yule-coalescent (GMYC) model (Pons et al.,2006; Monaghan et al., 2009) on a mi<strong>to</strong>chondrial cox2-3 spacer dataset, aiming <strong>to</strong>detect species boundaries based on differences in branching rates at the level ofspecies and populations. We then test if the GMYC clusters correspond <strong>to</strong>separately evolving lineages by applying Bayesian species delimitation on amultilocus sequence dataset using a coalescent-based method developed by Yang &Rannala (2010). The method uses reversible-jump Markov chain Monte Carlo(rjMCMC) <strong>to</strong> estimate the posterior distribution for species delimitation models.Models assume different num<strong>be</strong>rs of species, with each species composed of threekey parameters: θ (the product of effective population size N and mutation rate µper site), τA (the time at which the species arose) and τD (the time at which thespecies splits in<strong>to</strong> two descendent species). Our delimitation models included theGMYC lineages which were either lumped in the more encompassing or subdividedin<strong>to</strong> less exclusive lineages. Subsequently, we assess the geographic range of therespective species and discuss the observed diversity patterns.
Species delimitation and diversity pattern in the Philippines 493.2 Materials and methods3.2.1 Taxon samplingA <strong>to</strong>tal of 265 Portieria hornemannii specimens were collected in 25 sitesthroughout the Philippines. Extensive sampling <strong>to</strong>ok place in the northern islandsof Batanes, in the Visayas, and Sorsogon (Fig. 3.1). Samples were collected in theintertidal and shallow subtidal by snorkeling or SCUBA diving. Specimens arevouchered in the <strong>Ghent</strong> University Herbarium and the Institute of Environmentaland Marine Sciences at Silliman University. A complete list of specimens andcollection data is provided in Table 3.1.3.2.2 DNA sequencing and alignmentTotal genomic DNA was extracted from silica-dried or ethanol preservedspecimens using a modified CTAB method (De Clerck et al., 2005b). We amplifiedmi<strong>to</strong>chondrial, chloroplast and nuclear genes specifically targeting themi<strong>to</strong>chondrial cox2-3 spacer, chloroplast rbcL-spacer and a section of the nuclearencoded elongation fac<strong>to</strong>r 2 (EF2), respectively. PCR conditions and primersequences are detailed in Table 3.2.
50 CHAPTER 3Fig. 3.1. Sampling locations of Portieria within the Philippines.
Species delimitation and diversity pattern in the Philippines 51Table 3.1. Specimens used in the phylogenetic analysis with indication of their identity, herbarium num<strong>be</strong>r(Voucher) and collecting information.Species Num<strong>be</strong>r Locality Date ofCollec<strong>to</strong>rCollectionB21 DAP1434 Pier, Basco, Batanes 25.04.2009 D.A. Payo and O. De ClerckB21 DAP1422 Coral, Basco, Batanes 25.04.2009 D.A. Payo and O. De ClerckB21 DAP1434 White Beach, Mahatao, Batanes 26.04.2009 D.A. Payo and O. De ClerckB21 DAP1437 White Beach, Mahatao, Batanes 26.04.2009 D.A. Payo and O. De ClerckB21 DAP1442 White Beach, Mahatao, Batanes 26.04.2009 D.A. Payo and O. De ClerckB21 DAP1449 Pier, Mahatao, Batanes 26.04.2009 D.A. Payo and O. De ClerckB21 DAP1466 Chavayan, Sabtang Island, Batanes 27.04.2009 D.A. Payo and O. De ClerckB21 DAP1471 Chavayan, Sabtang Island, Batanes 27.04.2009 D.A. Payo and O. De ClerckB21 DAP1472 Chavayan, Sabtang Island, Batanes 27.04.2009 D.A. Payo and O. De ClerckB21 DAP339 White Beach, Mahatao, Batanes 21.04.2007 D.A. Payo, A. Bucol, J. LucañasB21 DAP364 Chanaryan, Basco, Batanes 22.04.2007 D.A. Payo, A. Bucol, J. LucañasB21 DAP367 Chanaryan, Basco, Batanes 22.04.2007 D.A. Payo, A. Bucol, J. LucañasB21 DAP369 Chanaryan, Basco, Batanes 22.04.2007 D.A. Payo, A. Bucol, J. LucañasB21 DAP374 Chanaryan, Basco, Batanes 22.04.2007 D.A. Payo, A. Bucol, J. LucañasB21 DAP375 Chanaryan, Basco, Batanes 22.04.2007 D.A. Payo, A. Bucol, J. LucañasB33 DAP1419 Coral, Basco, Batanes 25.04.2009 D.A. Payo and O. De ClerckB33 DAP1420 Coral, Basco, Batanes 25.04.2009 D.A. Payo and O. De ClerckB33 DAP1424 Coral, Basco, Batanes 25.04.2009 D.A. Payo and O. De ClerckB33 DAP1425 Coral, Basco, Batanes 25.04.2009 D.A. Payo and O. De ClerckB33 DAP1426 Coral, Basco, Batanes 25.04.2009 D.A. Payo and O. De ClerckB33 DAP1428 Coral, Basco, Batanes 25.04.2009 D.A. Payo and O. De ClerckB33 DAP1429 Coral, Basco, Batanes 25.04.2009 D.A. Payo and O. De ClerckB33 DAP1430 Coral, Basco, Batanes 25.04.2009 D.A. Payo and O. De ClerckB33 DAP1431 Coral, Basco, Batanes 25.04.2009 D.A. Payo and O. De ClerckB33 DAP1432 White Beach, Mahatao, Batanes 26.04.2009 D.A. Payo and O. De ClerckB33 DAP366 Chanaryan, Basco, Batanes 22.04.2007 D.A. Payo, A. Bucol, J. LucañasB34 DAP337 White Beach, Mahatao, Batanes 21.04.2007 D.A. Payo, A. Bucol, J. LucañasB34 DAP338 White Beach, Mahatao, Batanes 21.04.2007 D.A. Payo, A. Bucol, J. LucañasB35 DAP1393 Pier, Basco, Batanes 25.04.2009 D.A. Payo and O. De ClerckB35 DAP1394 Pier, Basco, Batanes 25.04.2009 D.A. Payo and O. De ClerckB35 DAP1395 Pier, Basco, Batanes 25.04.2009 D.A. Payo and O. De ClerckB35 DAP1398 Pier, Basco, Batanes 25.04.2009 D.A. Payo and O. De ClerckB35 DAP1399 Pier, Basco, Batanes 25.04.2009 D.A. Payo and O. De ClerckB35 DAP1400 Pier, Basco, Batanes 25.04.2009 D.A. Payo and O. De ClerckB35 DAP1403 Pier, Basco, Batanes 25.04.2009 D.A. Payo and O. De ClerckB35 DAP1404 Pier, Basco, Batanes 25.04.2009 D.A. Payo and O. De ClerckB35 DAP1405 Pier, Basco, Batanes 25.04.2009 D.A. Payo and O. De ClerckB35 DAP1409 Pier, Basco, Batanes 25.04.2009 D.A. Payo and O. De ClerckB35 DAP1410 Pier, Basco, Batanes 25.04.2009 D.A. Payo and O. De ClerckB35 DAP1412 Pier, Basco, Batanes 25.04.2009 D.A. Payo and O. De ClerckB35 DAP1413 Pier, Basco, Batanes 25.04.2009 D.A. Payo and O. De ClerckB35 DAP1414 Pier, Basco, Batanes 25.04.2009 D.A. Payo and O. De ClerckB35 DAP1415 Pier, Basco, Batanes 25.04.2009 D.A. Payo and O. De ClerckB35 DAP1417 Pier, Basco, Batanes 25.04.2009 D.A. Payo and O. De Clerck
52 CHAPTER 3Table 3.1. Continued.Species Num<strong>be</strong>r Locality Date ofCollec<strong>to</strong>rCollectionB35 DAP1421 Coral, Basco, Batanes 25.04.2009 D.A. Payo and O. De ClerckB35 DAP1423 Coral, Basco, Batanes 25.04.2009 D.A. Payo and O. De ClerckB35 DAP1433 White Beach, Mahatao, Batanes 26.04.2009 D.A. Payo and O. De ClerckB35 DAP1443 White Beach, Mahatao, Batanes 26.04.2009 D.A. Payo and O. De ClerckB35 DAP1447 White Beach, Mahatao, Batanes 26.04.2009 D.A. Payo and O. De ClerckB35 DAP1450 Pier, Mahatao, Batanes 27.04.2009 D.A. Payo and O. De ClerckB35 DAP145 Tolingon, Isa<strong>be</strong>l, Leyte 03.03.2007 D.A. PayoB35 DAP1467 Chavayan, Sabtang Island, Batanes 27.04.2009 D.A. Payo and O. De ClerckB35 DAP340 White Beach, Mahatao, Batanes 21.04.2007 D.A. Payo, A. Bucol, J. LucañasB35 DAP342 White Beach, Mahatao, Batanes 21.04.2007 D.A. Payo, A. Bucol, J. LucañasB35 DAP347 White Beach, Mahatao, Batanes 21.04.2007 D.A. Payo, A. Bucol, J. LucañasB35 DAP363 Chanaryan, Basco, Batanes 22.04.2007 D.A. Payo, A. Bucol, J. LucañasB35 DAP368 Chanaryan, Basco, Batanes 22.04.2007 D.A. Payo, A. Bucol, J. LucañasB35 DAP371 Chanaryan, Basco, Batanes 22.04.2007 D.A. Payo, A. Bucol, J. LucañasB35 DAP372 Chanaryan, Basco, Batanes 22.04.2007 D.A. Payo, A. Bucol, J. LucañasB35 DAP377 Chanaryan, Basco, Batanes 22.04.2007 D.A. Payo, A. Bucol, J. LucañasB38 DAP1427 Coral, Basco, Batanes 25.04.2009 D.A. Payo and O. De ClerckB5 DAP1435 White Beach, Mahatao, Batanes 26.04.2009 D.A. Payo and O. De ClerckB5 DAP1436 White Beach, Mahatao, Batanes 26.04.2009 D.A. Payo and O. De ClerckB5 DAP1438 White Beach, Mahatao, Batanes 26.04.2009 D.A. Payo and O. De ClerckB5 DAP1440 White Beach, Mahatao, Batanes 26.04.2009 D.A. Payo and O. De ClerckB5 DAP1441 White Beach, Mahatao, Batanes 26.04.2009 D.A. Payo and O. De ClerckB5 DAP1445 White Beach, Mahatao, Batanes 26.04.2009 D.A. Payo and O. De ClerckB5 DAP1446 White Beach, Mahatao, Batanes 26.04.2009 D.A. Payo and O. De ClerckB5 DAP1451 Chavayan, Sabtang Island, Batanes 27.04.2009 D.A. Payo and O. De ClerckB5 DAP1452 Chavayan, Sabtang Island, Batanes 27.04.2009 D.A. Payo and O. De ClerckB5 DAP1453 Chavayan, Sabtang Island, Batanes 27.04.2009 D.A. Payo and O. De ClerckB5 DAP1454 Chavayan, Sabtang Island, Batanes 27.04.2009 D.A. Payo and O. De ClerckB5 DAP1455 Chavayan, Sabtang Island, Batanes 27.04.2009 D.A. Payo and O. De ClerckB5 DAP1456 Chavayan, Sabtang Island, Batanes 27.04.2009 D.A. Payo and O. De ClerckB5 DAP1457 Chavayan, Sabtang Island, Batanes 27.04.2009 D.A. Payo and O. De ClerckB5 DAP1458 Chavayan, Sabtang Island, Batanes 27.04.2009 D.A. Payo and O. De ClerckB5 DAP1459 Chavayan, Sabtang Island, Batanes 27.04.2009 D.A. Payo and O. De ClerckB5 DAP1460 Chavayan, Sabtang Island, Batanes 27.04.2009 D.A. Payo and O. De ClerckB5 DAP1462 Chavayan, Sabtang Island, Batanes 27.04.2009 D.A. Payo and O. De ClerckB5 DAP1463 Chavayan, Sabtang Island, Batanes 27.04.2009 D.A. Payo and O. De ClerckB5 DAP1464 Chavayan, Sabtang Island, Batanes 27.04.2009 D.A. Payo and O. De ClerckB5 DAP1465 Chavayan, Sabtang Island, Batanes 27.04.2009 D.A. Payo and O. De ClerckB5 DAP1469 Chavayan, Sabtang Island, Batanes 27.04.2009 D.A. Payo and O. De ClerckB5 DAP1470 Chavayan, Sabtang Island, Batanes 27.04.2009 D.A. Payo and O. De ClerckB5 DAP318 White Beach, Mahatao, Batanes 21.04.2007 D.A. Payo, A. Bucol, J. LucañasB5 DAP346 White Beach, Mahatao, Batanes 21.04.2007 D.A. Payo, A. Bucol, J. LucañasB5 DAP321 White Beach, Mahatao, Batanes 21.04.2007 D.A. Payo, A. Bucol, J. LucañasB5 DAP333 White Beach, Mahatao, Batanes 21.04.2007 D.A. Payo, A. Bucol, J. LucañasB5 DAP334 White Beach, Mahatao, Batanes 21.04.2007 D.A. Payo, A. Bucol, J. Lucañas
Species delimitation and diversity pattern in the Philippines 53Table 3.1. Continued.Species Num<strong>be</strong>r Locality Date ofCollec<strong>to</strong>rCollectionB5 DAP343 White Beach, Mahatao, Batanes 21.04.2007 D.A. Payo, A. Bucol, J. LucañasB5 DAP344 White Beach, Mahatao, Batanes 21.04.2007 D.A. Payo, A. Bucol, J. LucañasB5 DAP352 Chanaryan, Basco, Batanes 22.04.2007 D.A. Payo, A. Bucol, J. LucañasB5 DAP365 Chanaryan, Basco, Batanes 22.04.2007 D.A. Payo, A. Bucol, J. LucañasB5 DAP370 Chanaryan, Basco, Batanes 22.04.2007 D.A. Payo, A. Bucol, J. LucañasB5 DAP373 Chanaryan, Basco, Batanes 22.04.2007 D.A. Payo, A. Bucol, J. LucañasB8 DAP345 White Beach, Mahatao, Batanes 21.04.2007 D.A. Payo, A. Bucol, J. LucañasB8 DAP1396 Pier, Basco, Batanes 25.04.2009 D.A. Payo and O. De ClerckB8 DAP1397 Pier, Basco, Batanes 25.04.2009 D.A. Payo and O. De ClerckB8 DAP1401 Pier, Basco, Batanes 25.04.2009 D.A. Payo and O. De ClerckB8 DAP1402 Pier, Basco, Batanes 25.04.2009 D.A. Payo and O. De ClerckB8 DAP1406 Pier, Basco, Batanes 25.04.2009 D.A. Payo and O. De ClerckB8 DAP1407 Pier, Basco, Batanes 25.04.2009 D.A. Payo and O. De ClerckB8 DAP1408 Pier, Basco, Batanes 25.04.2009 D.A. Payo and O. De ClerckB8 DAP1416 Pier, Basco, Batanes 25.04.2009 D.A. Payo and O. De ClerckB8 DAP1418 Pier, Basco, Batanes 25.04.2009 D.A. Payo and O. De ClerckB8 DAP1439 White Beach, Mahatao, Batanes 26.04.2009 D.A. Payo and O. De ClerckB8 DAP1444 White Beach, Mahatao, Batanes 26.04.2009 D.A. Payo and O. De ClerckB8 DAP1448 Pier, Mahatao, Batanes 26.04.2009 D.A. Payo and O. De ClerckB8 DAP1461 Chavayan, Sabtang Island, Batanes 27.04.2009 D.A. Payo and O. De ClerckB8 DAP1468 Chavayan, Sabtang Island, Batanes 27.04.2009 D.A. Payo and O. De ClerckB8 DAP336 White Beach, Mahatao, Batanes 21.04.2007 D.A. Payo, A. Bucol, J. LucañasS2 DAP1501 Dapdap, Bulusan, Sorsogon 30.04.2009 D.A. Payo and O. De ClerckS36 DAP1482 Dancalan, Bulusan, Sorsogon 29.04.2009 D.A. Payo and O. De ClerckS36 DAP1487 Dancalan, Bulusan, Sorsogon 29.04.2009 D.A. Payo and O. De ClerckS36 DAP1490 Dancalan, Bulusan, Sorsogon 29.04.2009 D.A. Payo and O. De ClerckS39 GUI010 Binuthan Reef, Guiuan, Eastern Samar 13.04.2009 R. LadiaoS39 GUI013 Binuthan Reef, Guiuan, Eastern Samar 13.04.2009 R. LadiaoS39 GUI016 Binuthan Reef, Guiuan, Eastern Samar 13.04.2009 R. LadiaoS39 GUI017 Binuthan Reef, Guiuan, Eastern Samar 13.04.2009 R. LadiaoS39 GUI019 Binuthan Reef, Guiuan, Eastern Samar 13.04.2009 R. LadiaoS39 GUI004 Binuthan Reef, Guiuan, Eastern Samar 13.04.2009 R. LadiaoS39 DAP1476 Dancalan, Bulusan, Sorsogon 29.04.2009 D.A. Payo and O. De ClerckS39 DAP1480 Dancalan, Bulusan, Sorsogon 29.04.2009 D.A. Payo and O. De ClerckS39 DAP1483 Dancalan, Bulusan, Sorsogon 29.04.2009 D.A. Payo and O. De ClerckS39 DAP1491 Dancalan, Bulusan, Sorsogon 29.04.2009 D.A. Payo and O. De ClerckS39 DAP1492 Dancalan, Bulusan, Sorsogon 29.04.2009 D.A. Payo and O. De ClerckS39 DAP290 Pasig Reef, Maydolong, Eastern Samar 08.04.2007 D.A. Payo and R. LadiaoS39 DAP297 Pasig Reef, Maydolong, Eastern Samar 08.04.2007 D.A. Payo and R. LadiaoS40 DAP1473 Dancalan, Bulusan, Sorsogon 29.04.2009 D.A. Payo and O. De ClerckS40 DAP1493 Dapdap, Bulusan, Sorsogon 30.04.2009 D.A. Payo and O. De ClerckS6 DAP1474 Dancalan, Bulusan, Sorsogon 29.04.2009 D.A. Payo and O. De ClerckS6 DAP1475 Dancalan, Bulusan, Sorsogon 29.04.2009 D.A. Payo and O. De ClerckS6 DAP1484 Dancalan, Bulusan, Sorsogon 29.04.2009 D.A. Payo and O. De Clerck
54 CHAPTER 3Table 3.1. Continued.Species Num<strong>be</strong>r Locality Date ofCollec<strong>to</strong>rCollectionS6 DAP1502 Dapdap, Bulusan, Sorsogon 30.04.2009 D.A. Payo and O. De ClerckS6 DAP1503 Dapdap, Bulusan, Sorsogon 30.04.2009 D.A. Payo and O. De ClerckS6 DAP1504 Dapdap, Bulusan, Sorsogon 30.04.2009 D.A. Payo and O. De ClerckS6 DAP1505 Dapdap, Bulusan, Sorsogon 30.04.2009 D.A. Payo and O. De ClerckS6 DAP1506 Dapdap, Bulusan, Sorsogon 01.05.2009 D.A. Payo and O. De ClerckS6 DAP1507 Dapdap, Bulusan, Sorsogon 01.05.2009 D.A. Payo and O. De ClerckS6 DAP1508 Dapdap, Bulusan, Sorsogon 01.05.2009 D.A. Payo and O. De ClerckS6 DAP1509 Dapdap, Bulusan, Sorsogon 01.05.2009 D.A. Payo and O. De ClerckS6 DAP1510 Dapdap, Bulusan, Sorsogon 01.05.2009 D.A. Payo and O. De ClerckS6 DAP1511 Dapdap, Bulusan, Sorsogon 01.05.2009 D.A. Payo and O. De ClerckS6 DAP1512 Dapdap, Bulusan, Sorsogon 01.05.2009 D.A. Payo and O. De ClerckS6 MAY002 Pasig Reef, Maydolong, Eastern Samar 09.04.2009 R. LadiaoS6 POR003 Dapdap, Bulusan, Sorsogon 22.04.1998 M. HommersandS7 DAP1477 Dancalan, Bulusan, Sorsogon 29.04.2009 D.A. Payo and O. De ClerckS7 DAP1478 Dancalan, Bulusan, Sorsogon 29.04.2009 D.A. Payo and O. De ClerckS7 DAP1479 Dancalan, Bulusan, Sorsogon 29.04.2009 D.A. Payo and O. De ClerckS7 DAP1481 Dancalan, Bulusan, Sorsogon 29.04.2009 D.A. Payo and O. De ClerckS7 DAP1485 Dancalan, Bulusan, Sorsogon 29.04.2009 D.A. Payo and O. De ClerckS7 DAP1488 Dancalan, Bulusan, Sorsogon 29.04.2009 D.A. Payo and O. De ClerckS7 DAP1489 Dancalan, Bulusan, Sorsogon 29.04.2009 D.A. Payo and O. De ClerckS7 POR002 Dancalan, Bulusan, Sorsogon 21.04.1998 M. HommersandSP3 SCS105 Spratley Islands, Philippines .04.2007 H. Calumpong andA.D. Macansan<strong>to</strong>sSP3 SCS109 Spratley Islands, Philippines .04.2007 H. Calumpong andA.D. Macansan<strong>to</strong>sV1A DAP058 Malo, Sia<strong>to</strong>n 27.01.2007 D.A. Payo and A. BucolV1A DAP070 Malo, Sia<strong>to</strong>n 27.01.2007 D.A. Payo and A. BucolV1A DAP102 Dapdap, Siquijor, Siquijor 17.02.2007 D.A. Payo and A. BucolV1A DAP103 Dapdap, Siquijor, Siquijor 17.02.2007 D.A. Payo and A. BucolV1A DAP104 Dapdap, Siquijor, Siquijor 17.02.2007 D.A. Payo and A. BucolV1A DAP108 Bukabok Reef, San Juan, Siquijor 17.02.2007 D.A. Payo and A. BucolV1A DAP210 Dapdap, Siquijor, Siquijor 15.03.2007 D.A. Payo and A. BucolV1A DAP213 Dapdap, Siquijor, Siquijor 15.03.2007 D.A. Payo and A. BucolV1A DAP214 Dapdap, Siquijor, Siquijor 15.03.2007 D.A. Payo and A. BucolV1A DAP439 Dapdap, Siquijor, Siquijor 14.05.2007 D.A Payo and A. BucolV1A DAP442 Dapdap, Siquijor, Siquijor 14.05.2007 D.A Payo and A. BucolV1A DAP445 Dapdap, Siquijor, Siquijor 14.05.2007 D.A Payo and A. BucolV1A DAP450 Dapdap, Siquijor, Siquijor 14.05.2007 D.A Payo and A. BucolV1A DAPSTN1 Malo, Sia<strong>to</strong>n, Negros Oriental 2008 D.A Payo and A. BucolV1B DAP087 Bantayan, Dumaguete, Negros Oriental 31.01.2007 D.A. PayoV1B DAP088 Bantayan, Dumaguete, Negros Oriental 31.01.2007 D.A. PayoV1B DAP247 Bantayan, Dumaguete, Negros Oriental 30.03.2007 D.A. PayoV1B DAP248 Bantayan, Dumaguete, Negros Oriental 30.03.2007 D.A. PayoV1B DAP249 Bantayan, Dumaguete, Negros Oriental 30.03.2007 D.A. PayoV1B DAP250 Bantayan, Dumaguete, Negros Oriental 30.03.2007 D.A. PayoV1B DAP251 Bantayan, Dumaguete, Negros Oriental 30.03.2007 D.A. PayoV1C DAP167 Daang-Lungsod, Alcoy, Cebu 14.03.2007 D.A. Payo and W. VillaverV1C DAP168 Daang-Lungsod, Alcoy, Cebu 14.03.2007 D.A. Payo and W. Villaver
Species delimitation and diversity pattern in the Philippines 55Table 3.1. Continued.Species Num<strong>be</strong>r Locality Date ofCollec<strong>to</strong>rCollectionV1C DAP170 Daang-Lungsod, Alcoy, Cebu 14.03.2007 D.A. Payo and W. VillaverV1C DAP171 Daang-Lungsod, Alcoy, Cebu 14.03.2007 D.A. Payo and W. VillaverV1C DAP185 Daang-Lungsod, Alcoy, Cebu 14.03.2007 D.A. Payo and W. VillaverV1C DAP186 Daang-Lungsod, Alcoy, Cebu 14.03.2007 D.A. Payo and W. VillaverV1C DAP211 Dapdap, Siquijor, Siquijor 15.03.2007 D.A. Payo and A. BucolV1D HV584 Malapascua, Cebu 22.01.2004 H. VerbruggenV1E PAL001 Palompon, Leyte .05.2009 D.G. PayoV1E PAL002 Palompon, Leyte .05.2009 D.G. PayoV1E DAP144 Tolingon, Isa<strong>be</strong>l, Leyte 03.03.2007 D.A. PayoV1E DAP146 Tolingon, Isa<strong>be</strong>l, Leyte 03.03.2007 D. A. PayoV1E DAP148 Tolingon, Isa<strong>be</strong>l, Leyte 03.03.2007 D.A. PayoV1E DAP151 Tolingon, Isa<strong>be</strong>l, Leyte 03.03.2007 D.A. PayoV1E DAP152 Tolingon, Isa<strong>be</strong>l, Leyte 03.03.2007 D.A. PayoV1E DAP153 Tolingon, Isa<strong>be</strong>l, Leyte 03.03.2007 D.A. PayoV1E DAP154 Tolingon, Isa<strong>be</strong>l, Leyte 03.03.2007 D.A. PayoV1E DAP155 Tolingon, Isa<strong>be</strong>l, Leyte 03.03.2007 D.A. PayoV1E DAP156 Tolingon, Isa<strong>be</strong>l, Leyte 03.03.2007 D.A. PayoV26 DAP052 Malo, Sia<strong>to</strong>n 27.01.2007 D.A. Payo and A. BucolV26 DAP054 Malo, Sia<strong>to</strong>n 27.01.2007 D.A. Payo and A. BucolV26 DAP055 Malo, Sia<strong>to</strong>n 27.01.2007 D.A. Payo and A. BucolV26 DAP184 Daang-Lungsod, Alcoy, Cebu 14.03.2007 D.A. Payo and W. VillaverV26 DAPSTN2 Malo, Sia<strong>to</strong>n, Negros Oriental 2008 D.A Payo and A. BucolV26 DAPSTN5 Malo, Sia<strong>to</strong>n, Negros Oriental 2008 D.A Payo and A. BucolV27 DAP187 Apo, Dauin, Negros Oriental 24.03.2007 D.A. Payo and A. CandidoV27 DAP188 Apo, Dauin, Negros Oriental 24.03.2007 D.A. Payo and A. CandidoV27 DAP189 Apo, Dauin, Negros Oriental 24.03.2007 D.A. Payo and A. CandidoV27 DAP190 Apo, Dauin, Negros Oriental 24.03.2007 D.A. Payo and A. CandidoV27 DAP191 Apo, Dauin, Negros Oriental 24.03.2007 D.A. Payo and A. CandidoV27 DAP468 Pali<strong>to</strong>n, San Juan, Siquijor 14.05.2007 D.A Payo and A. BucolV31 MAY010 Pasig Reef, Maydolong, Eastern Samar 09.04.2009 R. LadiaoV31 MAY011 Pasig Reef, Maydolong, Eastern Samar 09.04.2009 R. LadiaoV31 MAY012 Pasig Reef, Maydolong, Eastern Samar 09.04.2009 R. LadiaoV31 MAY013 Pasig Reef, Maydolong, Eastern Samar 09.04.2009 R. LadiaoV31 MAY014 Pasig Reef, Maydolong, Eastern Samar 09.04.2009 R. LadiaoV31 MAY015 Pasig Reef, Maydolong, Eastern Samar 09.04.2009 R. LadiaoV31 MAY016 Pasig Reef, Maydolong, Eastern Samar 09.04.2009 R. LadiaoV31 MAY017 Pasig Reef, Maydolong, Eastern Samar 09.04.2009 R. LadiaoV31 MAY018 Pasig Reef, Maydolong, Eastern Samar 09.04.2009 R. LadiaoV31 MAY019 Pasig Reef, Maydolong, Eastern Samar 09.04.2009 R. LadiaoV31 MAY001 Pasig Reef, Maydolong, Eastern Samar 09.04.2009 R. LadiaoV31 MAY003 Pasig Reef, Maydolong, Eastern Samar 09.04.2009 R. LadiaoV31 MAY004 Pasig Reef, Maydolong, Eastern Samar 09.04.2009 R. LadiaoV31 MAY006 Pasig Reef, Maydolong, Eastern Samar 09.04.2009 R. LadiaoV31 MAY007 Pasig Reef, Maydolong, Eastern Samar 09.04.2009 R. Ladiao
56 CHAPTER 3Table 3.1. Continued.Species Num<strong>be</strong>r Locality Date ofCollec<strong>to</strong>rCollectionV31 MAY008 Pasig Reef, Maydolong, Eastern Samar 09.04.2009 R. LadiaoV31 MAY009 Pasig Reef, Maydolong, Eastern Samar 09.04.2009 R. LadiaoV31 DAP286 Pasig Reef, Maydolong, Eastern Samar 08.04.2007 D.A. Payo and R. LadiaoV31 DAP288 Pasig Reef, Maydolong, Eastern Samar 08.04.2007 D.A. Payo and R. LadiaoV31 DAP291 Pasig Reef, Maydolong, Eastern Samar 08.04.2007 D.A. Payo and R. LadiaoV31 DAP293 Pasig Reef, Maydolong, Eastern Samar 08.04.2007 D.A. Payo and R. LadiaoV31 DAP294 Pasig Reef, Maydolong, Eastern Samar 08.04.2007 D.A. Payo and R. LadiaoV31 DAP295 Pasig Reef, Maydolong, Eastern Samar 08.04.2007 D.A. Payo and R. LadiaoV31 DAP296 Pasig Reef, Maydolong, Eastern Samar 08.04.2007 D.A. Payo and R. LadiaoV31 DAP298 Pasig Reef, Maydolong, Eastern Samar 08.04.2007 D.A. Payo and R. LadiaoV32 CAM001 Camiguin .04.2009 H. CalumpongV32 DAP1388 Liloan, Santander, Cebu 18.04.2009 D.A. PayoV32 DAP1389 Liloan, Santander, Cebu 18.04.2009 D.A. PayoV32 DAP1390 Liloan, Santander, Cebu 18.04.2009 D.A. PayoV32 DAP1391 Liloan, Santander, Cebu 18.04.2009 D.A. PayoV32 DAP1392 Liloan, Santander, Cebu 18.04.2009 D.A. PayoV32 DAP1394a Liloan, Santander, Cebu 18.04.2009 D.A. PayoV32 DAP1393a Liloan, Santander, Cebu 18.04.2009 D.A. PayoV32 GUI011 Binuthan Reef, Guiuan, Eastern Samar 13.04.2009 R. LadiaoV32 GUI014 Binuthan Reef, Guiuan, Eastern Samar 13.04.2009 R. LadiaoV32 GUI018 Binuthan Reef, Guiuan, Eastern Samar 13.04.2009 R. LadiaoV32 GUI001 Binuthan Reef, Guiuan, Eastern Samar 13.04.2009 R. LadiaoV32 GUI002 Binuthan Reef, Guiuan, Eastern Samar 13.04.2009 R. LadiaoV32 GUI003 Binuthan Reef, Guiuan, Eastern Samar 13.04.2009 R. LadiaoV32 GUI005 Binuthan Reef, Guiuan, Eastern Samar 13.04.2009 R. LadiaoV32 GUI006 Binuthan Reef, Guiuan, Eastern Samar 13.04.2009 R. LadiaoV32 GUI007 Binuthan Reef, Guiuan, Eastern Samar 13.04.2009 R. LadiaoV32 GUI008 Binuthan Reef, Guiuan, Eastern Samar 13.04.2009 R. LadiaoV32 GUI009 Binuthan Reef, Guiuan, Eastern Samar 13.04.2009 R. LadiaoV32 DAP1338 Pagubagubaan Reef San Juan, Siquijor 30.06.2008 D.A. Payo and A. BucolV32 DAP1346 Pagubagubaan Reef San Juan, Siquijor 14.07.2008 D.A. Payo and A. BucolV32 DAP1351 Pagubagubaan Reef San Juan, Siquijor 14.07.2008 D.A. Payo and A. BucolV32 DAP1352 Pagubagubaan Reef San Juan, Siquijor 14.07.2008 D.A. Payo and A. BucolV32 DAP202 Sawang Reef, San Juan, Siquijor 17.03.2007 D.A. Payo and A. CandidoV32 DAP204 Sawang Reef, San Juan, Siquijor 17.03.2007 D.A. Payo and A. CandidoV32 DAP205 Sawang Reef, San Juan, Siquijor 17.03.2007 D.A. Payo and A. CandidoV32 DAP455 Pali<strong>to</strong>n, San Juan, Siquijor 14.05.2007 D.A Payo and A. BucolV32 DAP480 Sawang Reef, San Juan, Siquijor 15.05.2007 D.A Payo and A. BucolV32 DAP482 Sawang Reef, San Juan, Siquijor 15.05.2007 D.A Payo and A. BucolV32 DAP533 Sawang Reef, San Juan, Siquijor 17.06.2007 D.A Payo and A. BucolV32 DAP544 Sawang Reef, San Juan, Siquijor 17.06.2007 D.A Payo and A. BucolV32 DAP1342 Pagubagubaan Reef San Juan, Siquijor 30.06.2008 D.A. Payo and A. Bucol
Species delimitation and diversity pattern in the Philippines 57Table 3.2. List of genes sequenced and primer sequences and amplification conditions used.GenomiccompartmentMi<strong>to</strong>chondriaTargetcox2-3spacerPrimernamePrimer sequence (5’–3’) Reference PCR programcox2Fcox3RGTACCWTCTTTDRGRRKDAAATGTGATGCGGATCTACWAGATGRAAWGGATGTCZuccarello 1999Zuccarello 1999one cycle of 4 min at 94 °C; five cyclesof 1 min at 93 °C, 1 min at 45 °C and 1min at 72 °C, 30 cycles of 30s at 93 °C,30s at 50 °C and 30s at 72 °C and afinal cycle of 5 min at 72 °CChloroplast rbcL+spacer F993F GGTACTGTTGTAGGTAAATTAGAAGG Freshwater andRueness 1994F993nF TTCCGTCGTTATTTGTAAATGG This studyone cycle of 3 min at 94 °C, 35 cyclesof 1 min at 94 °C, 1 min at 46 °C and1.5 min at 72 °C and a final cycle of 10min at 72 °CrbcsR TGTGTTGCGGCCGCCCTTGTGTTAGTCTCA Freshwater andRueness 1994Nucleus EF2 L3Li2F CGYACNCTBCTBATGATGGG Le Gall 2007 one cycle of 4 min at 94 °C , 38 cyclesR2R GGRCCRAARCACCAGATCTT Le Gall 2007518F CGCACCCTTCTCATGATGGG This study722R GGTCACTGGGGTTCTTCGGTTC This study1046R ATCACGAGGAGTGACCTTGC This studyat 94 °C for 4 min, 38 cycles of 1 min at94 °C, 1 min at 50 °C, 2 min at 72 °C,and a final cycle of 7 min at 72 °C. PCRsuccess improved at an annealing of55 °CPCR products were verified by gel electrophoresis and successfulamplicons were purified using exonuclease I/shrimp alkaline phosphatase ExoSAP-ITs (USB Corp., Cleveland, OH, USA). Sequencing reactions were performed usingthe PCR primers with the Bigdye Termina<strong>to</strong>r v3.1 Cycle Sequencing Kit fromApplied Biosystems following manufacturer‘s instructions. Sequencing productswere analyzed with an ABI 3100 Prism Genetic Analyzer (PE Applied Biosystems,Foster City, CA, USA). DNA sequences were corrected by eye and aligned usingCLUSTAL X in BioEdit v.7.09 (Hall, 1999).3.2.3 Species delimitation and phylogenyGeneral Mixed Yule Coalescent ModelAs a first step Portieria species were delimited based on mi<strong>to</strong>chondrial cox2-3 spacer sequences of 68 specimens. We used a maximum likelihood approachdeveloped by Pons et al. (2006) and Monaghan et al. (2009). The method, using aGeneralized Mixed Yule Coalescent (GMYC) model, aims <strong>to</strong> detect the transition<strong>be</strong>tween micro- and macroevolutionary branching patterns in an ultrametric treeand hence define the species boundary. A maximum likelihood approach is used <strong>to</strong>optimise the shift in branching rates in an ultrametric gene tree from interspecificbranches (Yule model) <strong>to</strong> intraspecific branches (neutral coalescent model). Thisshift is recognizable as a sudden increase of diversification rate when ultrametricnode height is plotted against the num<strong>be</strong>r of nodes in a lineage-through-time plot.
58 CHAPTER 3To obtain an ultrametric tree, a Bayesian phylogenetic analysis was conducted inBEAST v1.6.1 (Drummond and Rambaut, 2007) under a GTR + I + G model withan uncorrelated lognormal (UCLN) relaxed molecular clock model (Drummond etal., 2006) and using a coalescence tree prior. A Markov Chain Monte Carlo(MCMC) analysis was run for 10 million generations, sampling every 1000generations. The output was diagnosed for convergence using Tracer v.1.5, andsummary statistics and trees were generated using the last five million generationswith TreeAnnota<strong>to</strong>r v1.5.3 (Rambaut and Drummond, 2007). GMYC analyses wereperformed under single- and multiple-threshold models (Monaghan et al., 2009),using the SPLITS package for R (http://r-forge.r-project.org/projects/splits/).GMYC-lineages from the single-threshold model were used as the basis <strong>to</strong> test ifthese entities reflect distinct evolutionary lineages by analyzing species boundariesusing multilocus data (descri<strong>be</strong>d <strong>be</strong>low).Gene trees and species tree estimationGene trees were estimated for the rbcL-spacer, EF2 and cox2-3 sequencesusing maximum likelihood (ML) and Bayesian inference (BI). The datasetscontained the same 68 specimens initially used for the GMYC analyses andcontained no missing data. The ML tree and associated rapid bootstrap supportwere obtained using the GTR + CAT model in the program RAxML v.7.2.8(Stamatakis, 2006; Stamatakis et al., 2008) at the Cy<strong>be</strong>rinfrastructure forPhylogenetic <strong>Research</strong> (CIPRES; http://www.phylo.org). Bayesian trees andposterior probabilities were estimated using MrBayes 3.1 (Ronquist andHuelsen<strong>be</strong>ck, 2003). Two parallel runs, each consisting of four incrementally heatedchains were run for 5 million generations, sampling every 1000th generation.Convergence of log-likelihoods and parameter values was assessed in Tracer v1.4(Rambaut and Drummond, 2007). A burnin sample of 1000 trees was removed<strong>be</strong>fore constructing the majority rule consensus tree. The individual gene trees werevisually inspected <strong>to</strong> identify reciprocal monophyletic groups that wereconcordantly supported by the three loci, or were well supported by at least onelocus but not contradicted by any other locus (Dettman et al., 2003).We used a recently developed Bayesian method <strong>to</strong> delimit species (Yang &Rannala 2010). The technique calculates posterior probabilities of potential speciesdelimitations given a user-supplied species tree and multilocus sequence data.Because, methods that fail <strong>to</strong> take in<strong>to</strong> account incomplete lineages sorting arelikely <strong>to</strong> produce an erroneous estimate of a species tree of recently divergedspecies (e.g. Degnan and Rosen<strong>be</strong>rg, 2006; Kubatko and Degnan, 2007; Degnan
Species delimitation and diversity pattern in the Philippines 59and Rosen<strong>be</strong>rg, 2009; Leache and Rannala, 2011), a species tree was estimated usinga recently developed method by Heled & Drummond (2010). *BEAST, based onthe multispecies coalescent estimates, coestimates multiple gene trees em<strong>be</strong>dded ina shared species tree along with the effective population size of both extant andancestral and allows for intraspecies polymorphism and incomplete lineage sorting.Specimens were a priori assigned <strong>to</strong> species based on the results of the cox2-3GMYC analyses. We unlinked all models for the three loci: GTR + I + Gsubstitution model, uncorrelated lognormal relaxed molecular clock model, andYule species tree model. Two independent MCMC analyses were run for 20 milliongenerations (sampling 1000 steps). Convergence of the runs was assessed by visualexamination of parameter traces and marginal densities using Tracer v.1.4 (Rambaut& Drummond 2007), and the posterior distribution of trees was summarized fromthe MCMC output excluding the first 10% as burn-in. Bayesian species delimitationwas performed using Bayesian Phylogenetics and Phylogeography, BP&P v.2.0(Yang & Rannala 2010) with the 68 taxon datasets of the three loci. Because atpresent BP&P can only handle 15 species at the most, we performed the analysesseparately for the two main clades of the species tree. Each species delimitationmodel was assigned equal prior probability, and we used algorithm 0 (Yang &Rannala 2010) with the fine-tuning parameter ε = 5. Because the prior distributionson the ancestral population size (Θ) and root age (τ 0) can affect the posteriorprobabilities for models, with large values for Θ and small values for τ 0 favouringconservative models containing fewer species (Yang & Rannala 2010), we ran theanalyses with three different combinations of prior as proposed by Leach & Fujita(2010). The first combination of priors assumed relatively large ancestral populationsizes and deep divergences: Θ ~ G(1, 10) and τ 0 ~ G(1, 10). The secondcombination of priors assumed relatively small ancestral population sizes andshallow divergences among species: Θ ~ G(2, 2000) and τ 0 ~ G(2, 2000). The thirdcombination assumed large ancestral populations sizes Θ ~ G(1, 10) and relativelyshallow divergences among species τ 0 ~ G(2, 2000), which is a conservativecombination of priors that should favour models containing fewer species (Leache& Fujita 2011). The rjMCMC analyses were run for 100000 generations (samplingfrequency of five) with a burn-in of 50000. Each analysis was performed twice(initiated with different starting seeds) <strong>to</strong> check for consistency of the results. Inorder <strong>to</strong> verify whether the GMYC analysis of the cox2-3 dataset mightunderestimate species diversity, we reran the BP&P analyses using the samesettings, but with the GMYC clusters of clade V1 subdivided in<strong>to</strong> multiple entities.
60 CHAPTER 33.2.4 Species ranges and <strong>to</strong>tal species richnessSpecies ranges were estimated using the entire cox2-3 dataset, containing265 specimens. Total species richness of Portieria in the Philippines was estimatedusing the incidence based first-order jackknife estima<strong>to</strong>r implemented in EstimateS8.2 (Colwell, 2009). The values derive from an extrapolation of diversity based onthe frequency of observing species restricted <strong>to</strong> a single locality. Diversity <strong>be</strong>yondthe current sample size is estimated by fitting various asymp<strong>to</strong>tic functions throughthe data. Model selection was based on the Akaike Information Criterion (AIC) (seeDengler, 2009; Williams et al., 2009). Non-linear regressions and model comparisonwere carried out in R (R Development Core Team, 2010).
Species delimitation and diversity pattern in the Philippines 613.3 Results3.3.1 Single locus GMYC approachWe analysed branch length dynamics in the ultrametric cox2-3 tree <strong>to</strong>delimit species. The alignment was 320 bp long and contained 136 variablepositions. The likelihood of the GMYC model was significantly higher than that ofthe null model of uniform (coalescent) branching rates (Table 3.3., Fig. 3.2). Usingthe single-threshold GMYC, the depth (T) from the branch tips at which thetransition occurred was 0.00529 substitutions per site and a lineage- through-timeplot exhibited a pronounced increase in branching rates at the tips of the linearizedtree (Fig. 3.2).The single threshold model estimates 22 putative species, with a confidenceinterval ranging from 19 <strong>to</strong> 24. The multiple-threshold model detected 25 species,although with a broader confidence interval, from 20-30. Differences <strong>be</strong>tween bothanalyses consisted of 3 clusters that were split under a multiple-threshold model(B5, V26 and V32). In the following analyses we used the most conservativeestimate for the num<strong>be</strong>r of species in the complex, the lineages resulting from thesingle-threshold analysis, as our testable hypothesis. Although V32b (DAP1342)resulted <strong>to</strong> a separate species in the GMYC analysis (Fig. 3.2a), we insteadconsidered this as an entity <strong>be</strong>longing <strong>to</strong> lineage V32. Gene trees on Fig. 3.3 reflectDAP1342 co-occuring in the same clade with samples of V32, and notindependently, as expected. Thus, only 21 GMYC clusters are considered species.Table 3.3. Lineage branching patterns fit <strong>to</strong> single- and multiple-threshold variants of the GMYC model. Modeloutputs include the threshold genetic distance from the branch tips where transition occurred (T, presented forsingle-threshold models), the num<strong>be</strong>r of putative species as the sum of sequence clusters and single<strong>to</strong>ns(NGMYC), and confidence intervals (CI). Likelihoods are presented for null (L0) and GMYC (LGMYC) models,where null likelihoods are the same for single and multiple threshold model comparisons. Significance of thelikelihood ratio (LR) was evaluated using a χ2 test with 3 degrees of freedom <strong>to</strong> compare GMYC and null models.*p < 0.001.Model T NGMYC CI L0 LGMYC LRGMYC single threshold 0.00529 22 19-24 4492557 4629208 27.32824*GMYC multiplethreshold— 25 20-30 4492567 4634238 28.33409*
62 CHAPTER 3Fig. 3.2. (a) Ultrametric tree of the Portieria based on a Bayesian analysis of cox2-3 spacer sequence data withdivergence times estimated under a relaxed molecular clock in BEAST. (b) The graph represents the correspondinglineage-through-time plot. The dotted vertical line indicates the maximum likelihood transition point of the switchin branching rates from interspecific <strong>to</strong> intraspecific events, as estimated by a general mixed Yule-coalescent(GMYC) model. The blue color indicates the confidence interval in the estimated num<strong>be</strong>r of species.
Species delimitation and diversity pattern in the Philippines 633.3.2 Multilocus species delimitationComparison of the gene trees, estimated separately for the rbcL-spacer,EF2 and cox2-3 datasets, resulted in the detection of 12 reciprocal monophyleticclades that were concordant among the three unlinked loci (Fig. 3.3). Incongruencewas mainly situated in the <strong>to</strong>pology of the V1-clade. Several of the cox2-3 lineagesdelineated by the GMYC analyses (V1A, V1B, V1C) were either para- orpolyphyletic in the EF2 and rbcL spacer trees. Bayesian inference of a species treesfrom the three-locus data, using the 21 GMYC clusters as pre-defined species,resulted in a highly supported phylogeny (Fig. 3.4), which was used as a guide treefor the Bayesian species delimitation analysis. The Bayesian species delimitationresults are shown in Fig. 3.4. When assuming that the 21 GMYC clusterscorrespond <strong>to</strong> species, the Bayesian species delimitation supported the guide treewith high speciation probabilities (0.99 or 1.0) on all nodes. Changing priordistributions for Θ and τ 0 did have a major effect on the outcome of the analysis.The prior combinations that assumed large ancestral population sizes (priorcombinations 1 and 3), resulted in a slight decrease of speciation probabilities onsome nodes.
64 CHAPTER 3Fig. 3.3. Gene trees inferred from (a) cox2-3 spacer (b) elongation fac<strong>to</strong>r 2 (EF2) (c) rbcL -spacer. Colors correspond <strong>to</strong>cox2-3 GMYC clusters <strong>to</strong> which a sample <strong>be</strong>longs. Branch support (posterior probabilities > 0.50 and bootstrapsupport >70 are indicated on the branches.
Species delimitation and diversity pattern in the Philippines 65Fig. 3.4. Bayesian species tree inferred using *BEAST with num<strong>be</strong>rs above branches representing posteriorprobability values. This 19-species guide tree was used as reference tree for the Bayesian species delimitation ofPortieria using BP&P. The speciation probabilities are provided for each node under each combination of priorsfor Θ and τ0: <strong>to</strong>p, Θ ~ G(1, 10) and τ0 ~ G(1, 10), middle, Θ ~ G(2, 2000) and τ0 ~ G(2, 2000), bot<strong>to</strong>m Θ ~ G(1,10) and τ0 ~ G(2, 2000).
66 CHAPTER 3The Bayesian species delimitation did not support guide trees where thenum<strong>be</strong>r of species had <strong>be</strong>en increased. For example, when subdividing the fourspecies in clade V1 in<strong>to</strong> 11 species, the BP&P analysis of the 11-species guide treeonly supported the nodes leading <strong>to</strong> the four main clades, while the remainingspeciation events were weakly supported and strongly influenced by the priors (Fig.3.5).Fig. 3.5. Bayesian species delimitation results after further splitting four V1 clades in<strong>to</strong> 11 species. Only the nodesleading <strong>to</strong> the four main clades are strongly supported while remaining speciation events are not supported.
Species delimitation and diversity pattern in the Philippines 673.3.3 Species richness and distributionsSpecies delimitation analyses resulted in the discovery of at least 21 Portieriaspecies in the Philippines. Not a single species was found throughout the studyarea. Twelve out of 21 species are confined <strong>to</strong> one or two localities, while only fourspecies were found on more than three localities (Table 3.4). The islands of Batanesappear very distinct from the other sites in the Philippines, with none of the species<strong>be</strong>ing found outside the area (Fig. 3.6). Likewise, none of the species found alongthe Central Pacific coast (Samar and Sorsogon) or the Central Visayas is found inBatanes. The Visayas share a single species (V32). Two species (S6 and S39) areshared <strong>be</strong>tween collecting sites on Sorsogon and Samar. Although difficult <strong>to</strong> statewith certainty due <strong>to</strong> uneven sampling size, the individual collecting sites appearmore species rich in Batanes with 3-6 species occurring at each site. In the Visayasmost sites harbour only a single, maximum two, species. Richness is intermediate inLuzon mainland, with a maximum of 5 species <strong>be</strong>ing found in Dapdap, Sorsogon.Given the small scale spatial distribution of most species, it is unlikely that oursampling strategy resulted in a complete coverage of Portieria diversity in thePhilippines. Using the first-order jackknife estima<strong>to</strong>r <strong>to</strong>tal richness was estimated <strong>to</strong><strong>be</strong> 33 (± 3) species.
Localities/speciesSpratleysSpratleysChanaryanWhite BeachChavayan,SabtangPier MahataoCoral, BascoPier BascoDadap, BulusanDancalan,BulusanMaydolongGuiuanCamiguinPalomponIsa<strong>be</strong>lSia<strong>to</strong>nBukabokPali<strong>to</strong>nPagubagubaanSawangDapdapDumagueteMaloLiloanApoAlcoy68 CHAPTER 3Table 3.4. Occurrence of 21 Portieria species in the Philippines. Species collected from a single site only areindicated in bold. Num<strong>be</strong>rs indicate the num<strong>be</strong>r of specimens collected from each site.Central VisayasMindanaoCentral Pacific CoastBatanesSP3 2 1B21 1 1 3 4 5 5B33 9 1 1 3B34 2 1B35 17 2 1 1 6 5 6B5 16 15 4 3B8 9 1 2 3 4S36 3 1S39 6 2 5 3S40 1 1 2S6 1 3 12 3S7 8 1V31 25 1V32 7 7 4 1 1 11 6V1A 1 1 3 3V1B 7 1V1C 6 1 2V1D 1 1V1E 1 2 2V26 1 5 2V27 5 1 2species/site2 1 1 1 1 2 1 1 2 1 2 1 1 1 2 3 5 2 2 3 3 4 6 4 1
Species delimitation and diversity pattern in the Philippines 69Fig. 3.6. Distribution of Portieria species in the Philippines. Num<strong>be</strong>r of samples (n) is indicated for each samplingsite. (a) Location of sampling sites. (b) Species found in the Batanes sites. (c) Species found in the Visayas,Sorsogon and Camiguin.
70 CHAPTER 3Fitting a curve through these points (rational function) <strong>to</strong> extrapolate <strong>to</strong>obtain an estimate <strong>be</strong>yond the current sample resulted in 45 (±5) species (Fig. 3.7).Fig. 3.7. Total species richness estimates of Portieria in the Philippines derived using the first order Jacknifeestima<strong>to</strong>r. Extrapolation of extant diversity involves use of existing frequency data of species per site and the fittingof various asymp<strong>to</strong>tic functions <strong>to</strong> determine diversity <strong>be</strong>yond current sample size.3.4 Discussion3.4.1 Species delimitationA reassessment of the diversity of the red algal genus Portieria in thePhilippines based on gene sequence data demonstrates that previous morphologybasedspecies circumscriptions dramatically underestimate the diversity in therespective region. Out of more than 31 literature records, all but two refer <strong>to</strong> P.hornemannii (Lynbye) Silva (references cited in Silva et al. 1987). Only Cordero(1977, 1984) recorded P. japonica (Harvey) Silva from Batanes, Luzon and NegrosOriental. The latter species, originally descri<strong>be</strong>d from Shimoda (Japan), is reportedfrom several locations in South East Asia (Korea, Japan, Vietnam and thePhilippines; Lee & Kang 2001; Silva et al. 1987; Tsutsui et al. 2005; Yoshida 1998)as well as Oman (Wynne 1999), but these records are obviously in need of a criticalre-examination following the insights on diversity in the genus presented in thispaper.
Species delimitation and diversity pattern in the Philippines 71Unveiling cryptic diversity in algae does not come as a surprise, but thedegree <strong>to</strong> which we do so here is unprecedented. The single-locus approach basedon the mi<strong>to</strong>chondrial encoded cox2-3 spacer region using a single threshold mixedYule coalescent model resulted in 21 clusters of specimens which were reciprocallymonophyletic and sufficiently distinct from other such lineages <strong>to</strong> regard them asseparately evolving lineages (‗species‘). Applying the multiple threshold optionincreased the num<strong>be</strong>r of species <strong>to</strong> 24, but also resulted in an increase of theconfidence interval (20-30). Comparing the lineages that were delineated using thecox2-3 dataset in the chloroplast encoded rbcL-spacer gene trees, we observed alarge degree of congruence. Nearly all mi<strong>to</strong>chondrial GMYC clusters are resolved asmonophyletic lineages in the chloroplast dataset. The only incongruence <strong>be</strong>tweenboth gene trees concerns the specimens from the Visayas la<strong>be</strong>lled ‗V1‘. In themi<strong>to</strong>chondrial gene tree 5 monophyletic clades (V1A-E) can <strong>be</strong> observed, while theV1A lineage is paraphyletic with respect <strong>to</strong> V1B and V1C in the plastid dataset.Comparing the nuclear encoded EF2 gene tree with the organelle gene treesincongruence is also restricted <strong>to</strong> the V1 clade. In the EF2 gene tree however noneof the V1 GMYC clusters is resolved as a monophyletic lineage. These resultsindicate that coalescence is faster for organelle data compared <strong>to</strong> nuclear encodedloci, an observation that is congruent with population genetic theory which predictsthat the effective population size of nuclear DNA is twice as high for diploidorganisms compared <strong>to</strong> organelle DNA which is uniparentally inherited (Hudson &Coyne 2002). Bayesian species delimitation using the multilocus dataset confirmedthe species boundaries based on the cox2-3 dataset. These results are evident for theclusters for which there was no conflict among the individual gene trees, but moreimportantly they support the splitting of the V1 clade in<strong>to</strong> 5 individual species,which did not meet the criterion of reciprocal monophyly over all markers. Theseresults are stable over a broad range of prior settings relating <strong>to</strong> effective populationsize and root ages. Further subdividing these lineages was strongly rejected.Posterior probabilities were significantly lower and analyses <strong>be</strong>came highly sensitive<strong>to</strong> prior settings.The congruence that we observe <strong>be</strong>tween the single-locus and multilocusspecies delimitation analyses is an important finding. First it gives credit <strong>to</strong> popularbarcoding initiatives which mostly rely on some sort exclusivity criterion and singlemarker datasets only. It is most likely safe <strong>to</strong> ignore problems relating <strong>to</strong> incompletelineage sorting and ancestral polymorphism in lineages which diverged long enoughfrom one another. Given enough time, these species will <strong>be</strong> recognized using thegenetic exclusivity criteria of reciprocal monophyly at each of the sampled loci
72 CHAPTER 3(Avise & Ball 1990; Hudson & Coyne 2002; Knowles & Carstens 2007). Recentlydiverged taxa, however, are more likely <strong>to</strong> go unnoticed using exclusivity criteria, i.e.they have a higher false-negative rate. In such cases it is of paramount importance<strong>to</strong> select markers which coalesce fast. In our data sets, the mi<strong>to</strong>chondrial genomeappeared <strong>to</strong> have a somewhat higher coalescent rate compared <strong>to</strong> the chloroplastgenome, but these results are perhaps entirely s<strong>to</strong>chastic since there appears <strong>to</strong> <strong>be</strong>no differences in heritability of both organelle genomes.3.4.2 Diversity and conservationThe various species of Portieria are not distributed randomly over the studyarea. For example none of the species occurring in Batanes is shared with the morecentrally located collecting sites. In bird‘s eye view these sites are separatedapproximately 800 and 1300 km. Likewise, there is limited species overlap <strong>be</strong>tweenVisayan collecting sites, which share only a single species (V32), and Sorsogon-Samar collecting sites which share two species (S6 and S39). The distribution ofspecies V32 presents the largest geographical range of an individual Portieria speciesin the region, which stretches slightly over 300 km from Dumaguete (Negros) inthe West <strong>to</strong> Guiuan (south of Samar Island) in the East. At smaller spatial scales,i.e. within each of the three regions, similarity in species composition is higher. Inthe Batanes region none of the species is confined <strong>to</strong> single locations, which are<strong>be</strong>tween 2 and 20 km apart. Likewise, in the Visayas all but two species are shared<strong>be</strong>tween localities that are 2 <strong>to</strong> 100 km apart. Only two species (V1B and V1D)have <strong>be</strong>en collected at a single location. Local diversity and geographic ranges of thespecies are more difficult <strong>to</strong> assess for the central Pacific coastline, which has not<strong>be</strong>en sampled as exhaustively.Our findings may have important consequences for marine conservationmanagement in tropical regions. A traditional view holds that marine species aremore resilient <strong>to</strong> extinction <strong>be</strong>cause of their large geographic ranges (Ro<strong>be</strong>rts andHawkins, 1999; Ro<strong>be</strong>rts et al., 2002) and therefore, conserving a limited num<strong>be</strong>r ofbiodiversity hotspots suffices <strong>to</strong> save most species from extinction (Myers et al.,2000). The lack of apparent dispersal barriers in the marine environment andplank<strong>to</strong>nic larval stages or propagules that characterize many species are thought <strong>to</strong>promote large geographic ranges (Nor<strong>to</strong>n, 1992; Palumbi, 1994; Carr et al., 2003;Paulay and Meyer, 2006). Particularly wide ranges and low archipelagic endemismare characteristic for the Indo-West Pacific, extending from the East African coast<strong>to</strong> the Hawaiian archipelago and Easter Island in the east-central Pacific (Randall,1998). Most species are characterized by subbasinal distributions, <strong>be</strong>ing widespread
Species delimitation and diversity pattern in the Philippines 73in either Indian or Pacific Ocean basin, while a substantial fraction spans the entireIWP. There are relatively few local endemics and most are confined <strong>to</strong> the mostisolated island groups in the central-eastern Pacific Ocean. This traditional view,however, is increasingly <strong>be</strong>ing challenged. There is now overwhelming evidencefrom gene sequence data that the traditional application of morphological speciesconcepts resulted in inappropriate species delineation irrespective of taxonomicgroup or biogeographical region (Knowl<strong>to</strong>n, 1993; Palumbi, 1994; Bickford et al.,2007; Pfenninger and Schwenk, 2007). While, a num<strong>be</strong>r of studies reveal that thecryptic species themselves are wide-ranging (e.g. Colborn et al., 2001; Lessios et al.,2001), there is accumulating evidence for the prevalence of geographically restrictedcryptic species in many allegedly widely distributed marine organisms. Proportionsof range restricted species are highest in the remote peripheral archipelagos (Eble etal., 2009; Malay and Paulay, 2009), but archipelagic endemism in the central IWPwas revealed by Paulay & Meyers (2002) and Meyers & Paulay (2005). In the latterstudy the authors demonstrated that the single morphospecies, Astraliumrhodos<strong>to</strong>mum, consists of nearly 30 cryptic species, all but one confined <strong>to</strong> a singlearchipelago. Similar observations in at least two other groups of marine gastropods(Paulay and Meyer, 2002; Kirkendale and Meyer, 2004) indicate that archipelagicendemism may <strong>be</strong> more common than previously anticipated. The diversity patternof Portieria in the Philippines demonstrates that species level diversity may <strong>be</strong>structured at a much smaller scale (
74 CHAPTER 3species are ecologically differentiated from another is of interest, since competitivetheory predicts that species that compete for the same resource cannot stablycoexist if other ecological fac<strong>to</strong>rs are constant (Amarasekare, 2003). So, how similarare those species in terms of their ecology, demography or interactions with otherspecies?3.5 AcknowledgementsThe authors are grateful <strong>to</strong> A. Bucol, B. Caliñajan, A. Candido, F. Fumar, Z. Generoso, J.Lucañas, R. Ladiao, A.D. Macansan<strong>to</strong>s, D. Payo and W. Villaver for field samplingassistance, Batanes MENRO Francis Domingo for field and dive assistance, and <strong>to</strong> M.Hommersand, D. and M. Littler for samples provided. We greatly appreciate the assistanceof Caroline Vlaeminck and Sofie D‘hondt on PCR and sequencing work. Funding for thisresearch was provided by the Flemish Interuniversity Council (VLIR) as part of the PhDGrant <strong>to</strong> D.A. Payo. Completion of this work was made possible by a grant <strong>to</strong> D.A. Payofrom the Belgian National Focal Point <strong>to</strong> the Global Taxonomy Initiative through Dr. YvesSamyn of the Royal Belgian Institute of Natural Sciences (RBINS).
Species delimitation and diversity pattern in the Philippines 753.6 ReferencesAgapow, P.M., Bininda-Emonds, O.R.P., Crandall, K.A., Gittleman, J.L., Mace, G.M., Marshall, J.C.,Purvis, A., 2004. The impact of species concept on biodiversity studies. Q. Rev. Biol. 79, 161-179.Amarasekare, P., 2003. Competitive coexistence in spatially structured environments: a synthesis. Ecol.Lett. 6, 1109-1122.Avise, J.C., Ball, R.M., 1990. Principles of genealogical concordance in species concepts and biologicaltaxonomy. Oxf Surv Evol Biol 7, 45-67.Balgos, M.C., 2005. Integrated coastal management and marine protected areas in the Philippines:Concurrent developments. Ocean Coast. Manage. 48, 972-995.Bickford, D., Lohman, D.J., Sodhi, N.S., Ng, P.K.L., Meier, R., Winker, K., Ingram, K.K., Das, I.,2007. Cryptic species as a window on diversity and conservation. Trends Ecol. Evol. 22, 148-155.Bittner, L., Halary, S., Payri, C., Cruaud, C., de Reviers, B., Lopez, P., Bapteste, E., 2010. Someconsiderations for analyzing biodiversity using integrative metagenomics and genenetworks. Biology Direct 5, 47.Carr, M.H., Neigel, J.E., Estes, J.A., Andelman, S., Warner, R.R., Largier, J.L., 2003. Comparingmarine and terrestrial ecosystems: Implications for the design of coastal marine reserves.Ecol. Appl. 13, S90-S107.Colborn, J., Crabtree, R.E., Shaklee, J.B., Pfeiler, E., Bowen, B.W., 2001. The evolutionary enigma ofbonefishes (Albula spp.): Cryptic species and ancient separations in a globally distributedshorefish. Evolution 55, 807-820.Colwell, R.K., 2009. EstimateS: Statistical estimation of species richness and shared species fromsamples. Version 8.2. User's Guide and application published at:http://purl.oclc.org/estimates.Cordero, P.A.J., 1977. Studies on Philippine marine red algae. Special Publications from the Se<strong>to</strong>Marine Biological Labora<strong>to</strong>ry 4, pp. 258, 268 figs, 227 plates.Cordero, P.A.J., 1984. Phycological observations, XX: marine algae in the vicinity of the Bureau ofFisheries and Aquatic Resources Marine Station, Bobon Bay, Ilocos Norte. Ilocos FisheriesJournal 1, 67-117.De Clerck, O., Bol<strong>to</strong>n, J.J., Anderson, R.J., Coppejans, E., 2005a. Guide <strong>to</strong> the algae of Kwazulu-Natal. Scr. Bot. Belg. 33, 294.De Clerck, O., Gavio, B., Fredericq, S., Barbara, I., Coppejans, E., 2005b. Systematics of Grateloupiafilicina (Halymeniaceae, Rhodophyta), based on rbcL sequence analyses and morphologicalevidence, including the reinstatement of G. minima and the description of G. capensis sp. nov.J. Phycol. 41, 391-410.De Queiroz, K., 1998. The general lineage concept of species, species criteria, and the process ofspeciation. In: Howard, D.J., Berlocher, S.H. (Eds.), Endless Forms: Species and Speciation.Oxford University Press, Oxford, pp. 57–75.De Queiroz, K., 2007. Species concepts and species delimitation. Symposium on Species Delimitation- New Approaches for Discovering Diversity, S<strong>to</strong>ny Brook, NY, pp. 879-886.Degnan, J.H., Rosen<strong>be</strong>rg, N.A., 2006. Discordance of species trees with their most likely gene trees.Plos Genetics 2, 762-768.Degnan, J.H., Rosen<strong>be</strong>rg, N.A., 2009. Gene tree discordance, phylogenetic inference and themultispecies coalescent. Trends Ecol. Evol. (Personal edition) 24, 332-340.Dengler, J., 2009. Which function descri<strong>be</strong>s the species-area relationship <strong>be</strong>st? A review and empiricalevaluation. J. Biogeogr. 36, 728-744.Dettman, J.R., Jacobson, D.J., Taylor, J.W., 2003. A multilocus genealogical approach <strong>to</strong> phylogeneticspecies recognition in the model eukaryote Neurospora. Evolution 57, 2703-2720.
76 CHAPTER 3Drummond, A., Rambaut, A., 2007. BEAST: Bayesian evolutionary analysis by sampling trees. BMCEvol. Biol. 7, 214.Drummond, A.J., Ho, S.Y.W., Phillips, M.J., Rambaut, A., 2006. Relaxed Phylogenetics and Datingwith Confidence. PLoS Biol. 4, e88.Eble, J.A., Toonen, R.J., Bowen, B.W., 2009. Endemism and dispersal: comparative phylogeographyof three surgeonfishes across the Hawaiian Archipelago. Mar. Biol. 156, 689-698.Ginsburg, D.W., Paul, V.J., 2001. Chemical defenses in the sea hare Aplysia parvula: importance of dietand sequestration of algal secondary metabolites. Mar. Ecol. Prog. Ser. 215, 261-274.Guiry, M.D., Guiry, G.M., 2010. Algaebase.World-wide electronic publication, National University ofIreland, Galway.http://www.algaebase.org; searched on 07 April 2010.Hall, T.A., 1999. BioEdit: a user-friendly biological sequence alignment edi<strong>to</strong>r and analysisprogram for Windows 95/98/NT. Nucl. Acids. Symp. Ser. 41.Harrison, R.G., 1998. Linking evolutionary pattern and process: the relevance of species concepts forthe study of speciation. In: Howard, D.J., Berlocher, S.H. (Eds.), Endless Forms, Speciesand Speciation. Oxford University Press, Oxford, pp. 19-31.He<strong>be</strong>rt, P.D.N., Cywinska, A., Ball, S.L., DeWaard, J.R., 2003. Biological identifications through DNAbarcodes. Proc. R. Soc. Lond. Biol.] 270, 313-321.He<strong>be</strong>rt, P.D.N., Pen<strong>to</strong>n, E.H., Burns, J.M., Janzen, D.H., Hallwachs, W., 2004. Ten species in one:DNA barcoding reveals cryptic species in the neotropical skipper butterfly Astraptesfulgera<strong>to</strong>r. Proc. Natl. Acad. Sci. U. S. A. 101, 14812-14817.Heled, J., Drummond, A.J., 2010. Bayesian Inference of Species Trees from Multilocus Data. Mol. Biol.Evol. 27, 570-580.Hickerson, M.J., Meyer, C.P., Moritz, C., 2006. DNA barcoding will often fail <strong>to</strong> discover new animalspecies over broad parameter space. Syst. Biol. 55, 729-739.Hudson, R.R., Coyne, J., 2002. Mathematical consequences of the genealogical species concept.Evolution 56, 1557-1565.Hudson, R.R., Turelli, M., 2003. S<strong>to</strong>chasticity overrules the "three-times rule": Genetic drift, geneticdraft, and coalescence times for nuclear loci versus mi<strong>to</strong>chondrial DNA. Evolution 57, 182-190.Kirkendale, L.A., Meyer, C.P., 2004. Phylogeography of the Patelloida profunda group (Gastropoda :Lottidae): diversification in a dispersal-driven marine system. Mol. Ecol. 13, 2749-2762.Knowles, L.L., Carstens, B.C., 2007. Delimiting species without monophyletic gene trees. Symposiumon Species Delimitation - New Approaches for Discovering Diversity, S<strong>to</strong>ny Brook, NY,pp. 887-895.Knowl<strong>to</strong>n, N., 1993. Sibling species in the sea. Annu. Rev. Ecol. Syst. 24, 189-216.Kubatko, L.S., Degnan, J.H., 2007. Inconsistency of phylogenetic estimates from concatenated dataunder coalescence. Syst. Biol. 56, 17-24.Leache, A.D., Fujita, M.K., 2010. Bayesian species delimitation in West African forest geckos(Hemidactylus fasciatus). Proc. R. Soc. Lond. [Biol.] 277, 3071-3077.Leache, A.D., Rannala, B., 2011. The accuracy of species tree estimation under simulation: Acomparison of methods. Syst. Biol. 60, 126-137.Lee, M.S.Y., 2003. Species concepts and species reality: Salvaging a Linnaean rank. J. Evol. Biol. 16,179-188.Lee, Y., Kang, S., 2001. A catalogue of the seaweeds in Korea. Cheju National University Press, Jeju.Lessios, H.A., Kessing, B.D., Pearse, J.S., 2001. Population structure and speciation in tropical seas:Global phylogeography of the sea urchin Diadema. Evolution 55, 955-975.Maddison, W.P., 1997. Gene trees in species trees. Syst. Biol. 46, 523-536.Malay, M.C.D., Paulay, G., 2009. Peripatric speciation drives diversification and distributional patternof reef hermit crabs (Decapoda: Diogenidae: Calcinus). Evolution 64, 634-662.Matlock, D.B., Ginsburg, D.W., Paul, V.J., 1999. Spatial variability in secondary metabolite productionby the tropical red alga Portieria hornemannii. Hydrobiologia 399, 267-273.
Species delimitation and diversity pattern in the Philippines 77Mayden, R.L., 1997. A hierarchy of species concepts: the denouement in the saga of the speciesproblem. In: Claridge, M.F., Dawah, H.A., Wilson, M.R. (Eds.), Species: The Units ofBiodiversity. Chapman and Hall, pp. 381–424.Meier, R., Shiyang, K., Vaidya, G., Ng, P.K.L., 2006. DNA barcoding and taxonomy in Diptera: A taleof high intraspecific variability and low identification success. Syst. Biol. 55, 715-728.Meyer, C.P., Geller, J.B., Paulay, G., 2005. Fine scale endemism on coral reefs: Archipelagicdifferentiation in turbinid gastropods. Evolution 59, 113-125.Meyer, C.P., Paulay, G., 2005. DNA barcoding: Error rates based on comprehensive sampling. PLoSBiol. 3, 2229-2238.Meyer, K.D., Paul, V.J., Sanger, H.R., Nelson, S.G., 1994b. Effects of seaweed extracts and secondarymetabolites on feeding by the herbivorous surgeonfish Naso lituratus. Coral Reefs 13, 105-112.Monaghan, M.T., Wild, R., Elliot, M., Fujisawa, T., Balke, M., Inward, D.J., Lees, D.C., Ranaivosolo,R., Eggle<strong>to</strong>n, P., Barraclough, T.G., Vogler, A.P., 2009. Accelerated species inven<strong>to</strong>ry onMadagascar using coalescent-based models of species delineation. Syst. Biol. 58, 298-311.Myers, N., Mittermeier, R.A., Mittermeier, C.G., da Fonseca, G.A.B., Kent, J., 2000. Biodiversityhotspots for conservation priorities. Nature 403, 853-858.Nor<strong>to</strong>n, T.A., 1992. Dispersal by macroalgae. Eur. J. Phycol. 27, 293-301.O'Meara, B.C., 2010. New heuristic methods for joint species delimitation and species tree inference.Syst. Biol. 59, 59-73.Palumbi, S.R., 1994. Genetic divergence, reproductive isolation, and marine speciation. Annu. Rev.Ecol. Syst. 25, 547-572.Paulay, G., Meyer, C., 2002. Diversification in the tropical pacific: Comparisons <strong>be</strong>tween marine andterrestrial systems and the importance of founder speciation. Integrative and ComparativeBiology 42, 922-934.Paulay, G., Meyer, C., 2006. Dispersal and divergence across the greatest ocean region: Do larvaematter? Integr. Comp. Biol. 46, 269-281.Pfenninger, M., Schwenk, K., 2007. Cryptic animal species are homogeneously distributed among taxaand biogeographical regions. BMC Evol. Biol. 7, 121.Pietra, F., 2002. Biodiversity and natural product diversity. Pergamon, Tren<strong>to</strong>.Pons, J., Barraclough, T.G., Gomez-Zurita, J., Cardoso, A., Duran, D.P., Hazell, S., Kamoun, S.,Sumlin, W.D., Vogler, A.P., 2006. Sequence-based species delimitation for the DNAtaxonomy of undescri<strong>be</strong>d insects. Syst. Biol. 55, 595-609.Puglisi, M.P., Paul, V.J., 1997. Intraspecific variation in the red alga Portieria hornemannii: Monoterpeneconcentrations are not influenced by nitrogen or phosphorus enrichment. Mar. Biol. 128,161-170.Rambaut, A., Drummond, A., 2007, Tracer v1.4. Available from http://<strong>be</strong>ast.bio.ed.ac.uk/TracerRandall, J.E., 1998. Zoogeography of shore fishes of the Indo-Pacific region. Zool. Stud. 37, 227-268.Ro<strong>be</strong>rts, C.M., Hawkins, J.P., 1999. Extinction risk in the sea. Trends Ecol. Evol. 14, 241-246.Ro<strong>be</strong>rts, C.M., McClean, C.J., Veron, J.E.N., Hawkins, J.P., Allen, G.R., McAllister, D.E., Mittermeier,C.G., Schueler, F.W., Spalding, M., Wells, F., Vynne, C., Werner, T.B., 2002. Marinebiodiversity hotspots and conservation priorities for tropical reefs. Science 295, 1280-1284.Ronquist, F., Huelsen<strong>be</strong>ck, J.P., 2003. MrBayes 3: Bayesian phylogenetic inference under mixedmodels. Bioinformatics 19, 1572-1574.Schmitz, F., 1889. Systematische Ü<strong>be</strong>rsicht der bisher <strong>be</strong>kannten Gattungen der Florideen. Flora oderAllgemeine botanische Zeitung 72, 435-456, pl. XXI.Silva, P.C., Basson, P.W., Moe, R.L., 1996, Catalogue of the Benthic Marine Algae of the IndianOcean. University of California press, London, p. 1259.Silva, P.C., Meñez, E.G., Moe, R.L., 1987. Catalog of the Benthic Marine Algae of the Philippines.Smithsonian Institution Press, Washing<strong>to</strong>n, D.C.Sites, J.W., Marshall, J.C., 2003. Delimiting species: a Renaissance issue in systematic biology. TrendsEcol. Evol. 18, 462-470.
78 CHAPTER 3Sites, J.W., Marshall, J.C., 2004. Operational criteria for delimiting species. Annu. Rev. Ecol. Evol. Syst.35, 199-227.Stamatakis, A., 2006. RAxML-VI-HPC: Maximum likelihood-based phylogenetic analyses withthousands of taxa and mixed models. Bioinformatics 22, 2688-2690.Stamatakis, A., Hoover, P., Rougemont, J., 2008. A rapid bootstrap algorithm for the RAxML webservers. Syst. Biol. 57, 758-771.Tsutsui, I., Huybh, Q.N., Nguyên, H.D., Arai, S., Yoshida, T., 2005. The Common Marine Plants ofSouthern Vietnam. Japan Seaweed Association, USA.Wiens, J.J., 2007. Species delimitation: New approaches for discovering diversity. Syst. Biol. 56, 875-878.Wiens, J.J., Penkrot, T.A., 2002. Delimiting species using DNA and morphological variation anddiscordant species limits in spiny lizards (Sceloporus). Syst. Biol. 51, 69-91.Williams, M.R., Lamont, B.B., Henstridge, J.D., 2009. Species-area functions revisited. J. Biogeogr. 36,1994-2004.Wiseman, D.R., 1973, Morphological and taxonomic studies of the red algal genera Och<strong>to</strong>des andChondrococcus. Department of Botany. Duke University, Durham, p. 223.Wynne, M.J., 1999. New records of <strong>be</strong>nthic marine algae from the Sultanate of Oman. Contr. Univ.Mich. Herb 22, 189-208.Yang, Z., Rannala, B., 2010. Bayesian species delimitation using multilocus sequence data. Proc. Natl.Acad. Sci. U.S.A. 107, 9264-9269.Yoshida, T., 1998. Marine Algae of Japan. Uchida Rokakuho Publishing Co., Ltd, Tokyo.Zuccarello, G.C., Burger, G., West, J.A., King, R.J., 1999. A mi<strong>to</strong>chondrial marker for red algalintraspecific relationships. Mol. Ecol. 8, 1443-1447.
4 EVOLUTION OF THE RED SEAWEEDPORTIERIA IN THE TROPICAL INDO-PACIFIC 1AbstractA wide range of tropical shallow water organisms reach their greatest species richness in theIndo-Malay Archipelago (IMA) or Coral Triangle. Several models have <strong>be</strong>en proposed <strong>to</strong>explain the origins of this biodiversity hotspot, including the center of origin and center ofaccumulation hypotheses. We examined species diversity, distributions and phylogeneticrelationships within the red alga Portieria <strong>to</strong> determine how his<strong>to</strong>rical processes havecontributed <strong>to</strong> present-day biodiversity patterns across the marine tropical Indo-Pacific.DNA-based species delimitation analysis revealed rampant cryptic diversity. Forty-ninePortieria species were delineated, which were all restricted <strong>to</strong> a single Ocean basin. Withinthe Philippines, several species display fine scale archipelagic and intra-archipelagicendemism, suggesting low dispersal capacity. The highest diversity was recovered in theIMA, with declining species num<strong>be</strong>rs when moving away, both longitudinally andlatitudinally, from the center. A species phylogeny implies a long term persistence of ancientlineages within confined regions of the Indo-Pacific, including the IMA. These resultssuggest that the long and complex geological his<strong>to</strong>ry of the IMA played an important role inshaping the diversity of Portieria in the IMA. The taxonomic richness in the IMA may haveresulted from a combination of species accumulation via island integration through tec<strong>to</strong>nicmovement, in combination with diversification at small spatial scales within the IMA as aresult of increased geographical complexity of the region during the Oligo-Miocene andPleis<strong>to</strong>cene periods of glacially lowered sea level. This study thus supports both the centerof origin and center of accumulation hypothesis, and highlights that there may <strong>be</strong> not oneunifying model <strong>to</strong> explain the biological diversity within the IMA.Keywords: Portieria, evolution, Indo-Pacific, Indo-Malayan Archipelago, center of origin,accumulation1 Unpublished manuscript: Payo D.A., Leliaert F., Verbruggen H., Lin, S.M., Calumpong H. & De Clerck O.Evolution of the red seaweed Portieria in the tropical Indo-Pacific79
80 CHAPTER 44.1 IntroductionA global maximum of marine biodiversity is observed in the Indo-MalayArchipelago (IMA, also known as Coral Triangle), a region in the central Indo-WestPacific bounded by the Philippines, Indonesia and Papua New Guinea (Hoeksema,2007, Briggs, 2009, Bellwood & Meyer, 2009b, Bar<strong>be</strong>r, 2009, Connolly et al., 2003).A broad range of tropical coastal organisms, including corals, coastal fishes, severalgastropod and crustacean groups, marine angiosperms and some seaweeds, reachtheir greatest species richness here, with declining diversity gradients when movingaway, both longitudinally and latitudinally, from the center (Briggs, 1999, Bellwood& Hughes, 2001, Hoeksema, 2007, Williams & Reid, 2004, Kerswell, 2006,Tittensor et al., 2010).The IMA biodiversity hotspot has intrigued ecologists and evolutionarybiologists for years. Multiple hypotheses, which are not mutually exclusive, have<strong>be</strong>en proposed <strong>to</strong> explain the origins of taxonomic richness in the IMA, includingthe center of origin, center of (bio)accumulation and area of overlap hypotheses(Halas & Winterbot<strong>to</strong>m, 2009, Bar<strong>be</strong>r, 2009, Connolly et al., 2003).The center of origin hypothesis posits that the high diversity arises throughhigh local speciation rates, followed by dispersal <strong>to</strong> the periphery (Ekman, 1953,Briggs, 2000, Mora et al., 2003). In this view, the IMA is regarded as a source(speciation pump) supplying species throughout the remainder of the Indo-Pacific.Pleis<strong>to</strong>cene sea-level changes and the complex geography of the region have <strong>be</strong>enregarded as important drivers of speciation (Briggs, 2000, Hoeksema, 2007, Mora etal., 2003).The center of accumulation hypothesis states that speciation occurs mostlyoutside the biodiversity hotspot, such as peripheral islands in the Indian and PacificOceans, and that the high diversity within the IMA is a consequence ofaccumulation of species via dispersal <strong>to</strong>wards the IMA (Ladd, 1960, Connolly et al.,2003). This hypothesis is based on the notion that several central Pacific islandsdate back <strong>to</strong> at least the Cretaceous, allowing for a long his<strong>to</strong>ry of speciesformation, and that dispersal via prevailing westward ocean currents results inaccumulation of species within the IMA (Jokiel & Martinelli, 1992). Because theIMA encompasses one of the most extensive and heterogeneous tropical shallowwater environments with large reef areas, many marine taxa may have found refugein this region (Bellwood & Hughes, 2001, Bellwood & Meyer, 2009b, Hoeksema,2007, Gas<strong>to</strong>n, 2000). Accumulation of species may also have resulted fromintegration of distinct biotas by tec<strong>to</strong>nic movement (Rosen & Smith, 1988, Renema
Evolution of the red seaweed Portieria in the tropical Indo-Pacific 81et al., 2008). The IMA is a geologically complex region, formed by several tec<strong>to</strong>nicelements that arrived from different directions over the past 50 million years (Hall,1998, Hall, 2002). Closely related <strong>to</strong> the center of accumulation hypothesis is thearea of overlap hypothesis, which suggests that the high biodiversity within theIMA is a consequence of overlap as a result range expansion of Pacific and IndianOcean sister taxa (Woodland, 1983, Bellwood & Meyer, 2009b).The relative importance of the different processes in contribution <strong>to</strong> thehigh diversity in the IMA is hotly debated (Briggs, 2009, Bellwood & Meyer, 2009a).Molecular phylogenies in combination with distribution data of Indo-Pacific specieshave provided valuable insights in<strong>to</strong> the mechanisms that have contributed <strong>to</strong> theIMA diversity hotspot. Genetic data, mainly from <strong>be</strong>nthic and coastal pelagicanimals, have provided evidence for both the center of origin (e.g., Bar<strong>be</strong>r et al.,2006) and center of accumulation hypothesis (e.g., Drew et al., 2008). Severalmolecular phylogenetic studies indicate that speciation occurs throughout the Indo-Pacific region, both within and outside the IMA (Santini & Winterbot<strong>to</strong>m, 2002,Williams & Reid, 2004, Meyer et al., 2005, Bar<strong>be</strong>r & Bellwood, 2005).Seaweeds are highly diverse and important components of tropical coastalecosystems but, compared <strong>to</strong> marine metazoan groups, their phylogeneticrelationships and geographical distributions within the Indo-Pacific have <strong>be</strong>enno<strong>to</strong>riously understudied. In this study we focus on the red seaweed Portieria, whichis commonly found in coral reefs and is widely distributed in the Indo-Pacific,ranging from the East African coast <strong>to</strong> the Hawaiian archipelago. Althoughtraditionally, only a single species (P. hornemannii) has <strong>be</strong>en recognized based on abroad morphological species concept (Wiseman, 1975), DNA sequence data hasindicated extremely high cryptic diversity, with at least 21 species occurring in thePhilippines (see chapter 3).In this study we expanded our Philippine dataset by including specimenssampled from the entire geographical range of Portieria. We used a mi<strong>to</strong>chondrialcox2-3 spacer dataset of 319 specimens <strong>to</strong> examine species diversity andgeographical patterns of species richness. Phylogenetic reconstructions of speciesdivergences were inferred from a five-locus dataset, and a temporal framework forspecies divergence times was based on molecular clock estimates. We wereespecially interested <strong>to</strong> know whether the high diversity observed within the IMAresulted from recent speciation events within the hotspot (center of originhypothesis), or resulted from speciation outside the IMA and dispersal <strong>to</strong>wards thediversity hotspot (center of accumulation hypothesis).
82 CHAPTER 44.2 Materials and methods4.2.1 Taxon samplingA <strong>to</strong>tal of 319 Portieria specimens were collected from South Africa,Tanzania, Kenya, Socotra, Oman, Sri Lanka, the Maldives, Japan, Taiwan, thePhilippines, Indonesia, Papua New Guinea, Pacific Australia and Hawaii, providinggood geographical coverage throughout the distribution of Portieria (Fig. 4.1).Samples were collected by snorkelling or SCUBA diving and were preserved asherbarium specimens and in silica gel. Herbarium vouchers are deposited in the<strong>Ghent</strong> University Herbarium. A complete list of specimens and collection data isprovided in Table S4.1.4.2.2 DNA extraction, amplification and sequencingDNA was extracted from silica- or herbarium-dried specimens as descri<strong>be</strong>din chapter 3. For each specimen, the mi<strong>to</strong>chondrial cox2-3 spacer was amplified andsequenced. In addition, the mi<strong>to</strong>chondrial cox1 gene, the plastid encoded rbcL andrbcL-rbcS spacer and the nuclear encoded elongation fac<strong>to</strong>r 2 (EF2) were sequencedfor a selection of the samples (Table S4.1). The EF2 gene was sequenced in twoparts. PCR conditions and primer sequences are detailed in Table S4.2. PCRamplification and sequencing was performed as descri<strong>be</strong>d in chapter 3. DNAsequences were edited by eye and aligned using CLUSTAL X in BioEdit v.7.09(Hall 1999).
Evolution of the red seaweed Portieria in the tropical Indo-Pacific 83Fig. 4.1. Map showing the location of collecting sites (black dots). The blue area illustrates the known distributionrange of Portieria (Guiry & Guiry, 2011), and the five coloured areas show the geographical regions used in thisstudy: orange (Western and Central Indian Ocean), dark green (Indo-Malay Archipelago), light green (Japan), cyan(E Australia), purple (Hawaii).4.2.3 DNA-based species delimitationBecause Portieria species are no<strong>to</strong>riously difficult <strong>to</strong> distinguishmorphologically (chapters 5), species were delimited based on DNA-sequenceanalysis. General mixed Yule-coalescent (GMYC) model analysis of cox2-3 spacersequences has <strong>be</strong>en shown <strong>to</strong> provide accurate delimitation of species in Portieria(chapter 4). This approach estimates species boundaries directly from branchingrates in mixed population-phylogenetic ultrametric trees without the need for anyprior definition of populations or species (Monaghan et al., 2009, Pons et al., 2006,Leliaert et al., 2009). An ultrametric tree was obtained by Bayesian phylogeneticanalysis of an alignment of unique sequences in BEAST v.1.6.1 (Drummond &Rambaut, 2007), under a GTR + I + G model with an uncorrelated lognormalrelaxed molecular clock model and a coalescence tree prior. A Markov ChainMonte Carlo (MCMC) analysis was run for 10 million generations, sampling every1000 generations. The output was diagnosed for convergence using Tracer v.1.5,and summary statistics and trees were generated using the last 9 million generationswith TreeAnnota<strong>to</strong>r v1.5.3 (Rambaut & Drummond, 2007a). GMYC analyses were
84 CHAPTER 4performed under single-threshold models (Monaghan et al., 2009), using theSPLITS package for R (http://r-forge.r-project.org/projects/splits/).4.2.4 Phylogenetic analysisA species-level phylogeny was inferred from a multilocus alignmentconsisting of a single representative of each GMYC cluster. Five loci (cox1: 639 bp;cox2-3 spacer: 345 bp; rbcL: 1044 bp; rbcL-spacer: 555 bp; EF2: 1199 bp) wereconcatenated, yielding an alignment of 3782 positions. Table S4.3 graphicallyrepresents the data matrix. Maximum likelihood (ML) analysis and Bayesianphylogenetic inference (BI) were performed using five partitions [cox1, cox2-3spacer, rbcL, rbcL-spacer, EF2]. Maximum likelihood (ML) analysis was performedusing RAxML rapid bootstrapping (Stamatakis et al., 2008), using a GTR + CATmodel for each partition. Bayesian phylogenetic inference was carried out withMrBayes 3.1.2 (Ronquist & Huelsen<strong>be</strong>ck, 2003) with unlinked GTR models withgamma distribution and four rate categories (GTR + G) selected for each partition.Two parallel runs, each consisting of four incrementally heated chains, were run for5 million generations, sampling every 1000 generations. Convergence of loglikelihoodsand parameter values was assessed in Tracer v1.4 (Rambaut &Drummond, 2007b). A burn-in sample of 1 million generations was removed<strong>be</strong>fore constructing a majority rule tree including all compatible bipartitions.Och<strong>to</strong>des was selected as outgroup based on molecular phylogenetic data, showingthat this genus represents the sister genus of Portieria (Chapter 2).The phylogeny was calibrated in time using two independent methods.First, divergence times were estimated based on the ‗universal‘ cox2‐ 3 calibrationreported in Zuccarello & West, 2002, <strong>be</strong>ing 0.25‐ 0.3 % divergence/Ma. Secondly,a time-calibrated phylogeny was inferred using BEAST based on the same matrixused for the ML and BI analyses. In the absence of reliable Portieria fossils, twonodes in the tree were constrained in geological time based on a red algal timecalibratedphylogeny, which was constructed as follows. First an ML tree of Portieriarepresentatives and related genera (Och<strong>to</strong>des, Nesophila and Contarinia) wasconstructed based on a concatenated dataset of EF2 and rbcL sequences usingPhyML (Guindon & Gascuel, 2003), under a GTR + G model. This tree wasgrafted in<strong>to</strong> the red algal multilocus phylogeny of Verbruggen et al. (2010), followedby ML branch optimization in RAxML. Divergence times were estimated using r8sv1.7 (Sanderson, 2002) by rate-smoothing the ML tree using penalized likelihoodand a log-smoothing parameter of 3. Eight fossil calibration points were used,which are detailed in Table S4.4. Based on these results, the split <strong>be</strong>tween Portieria
Evolution of the red seaweed Portieria in the tropical Indo-Pacific 85and Och<strong>to</strong>des was constrained at 100 Ma and the root of the Portieria clade wasconstrained at 40 Ma (Fig S4.2), both using normal priors with a standard deviationof 5. Shifts in diversification rates across the chronogram were tested using therelative cladogenesis statistic implemented in GEIGER (Harmon et al., 2008).Lineage through time (LTT) plots were generated using APE (Paradis et al., 2004).Both packages run in the R environment for statistical computing and graphics (RDevelopment Core Team, 2009).4.3 Results4.3.1 Species diversity and geographical distributionThe GMYC model analysis of 319 cox2-3 spacer sequences showed that thelikelihood of the GMYC model was significantly higher than that of the null modelof uniform (coalescent) branching rates (L0 = 805.5, LGMYC = 822.6, LR = 34.2,p < 0.001). The single-threshold GMYC analysis estimated 49 putative Portieriaspecies (Fig. 4.2), with a confidence interval of 38-52 species. Two additionalspecies were identified based on specimens for which only rbcL sequences wereavailable (Table S4.1).Thirty-three species were found in the Indo-Malay Archipelago (includingTaiwan), 13 species in the Western Indian Ocean, 2 in Japan, 2 in Australia and 1 inHawaii (Fig. 4.1). All species were entirely restricted <strong>to</strong> these five regions. Withinthe regions, most species appeared <strong>to</strong> have very narrow geographical ranges, <strong>be</strong>ingrestricted <strong>to</strong> a single island, island group or short coastal stretch (Table S4.1). Onlythree species are more widely distributed in the Indian Ocean: species 18 occurs inKenya, Socotra and Oman, species 20 ranges from Kenya <strong>to</strong> Sri Lanka, and species22 was found in Tanzania and Sri Lanka. Fine scale endemism was observed withinthe Philippines, with most species having very narrow ranges or even occurring inlocalized populations. Only three species (V32, S39 and S6) were more widelydistributed within the Philippines (Fig. 4.2).
86 CHAPTER 4Fig. 4.2. Ultrametric tree of the Portieria based on a Bayesian analysis of cox2-3 spacer sequence data withdivergence times estimated under a relaxed molecular clock in BEAST. The dotted vertical line indicates themaximum likelihood transition point of the switch in branching rates from interspecific <strong>to</strong> intraspecific events, asestimated by a general mixed Yule-coalescent (GMYC) model.
Evolution of the red seaweed Portieria in the tropical Indo-Pacific 87Fig. 4.3. Map of the Philippines illustrating the geographical distributions of species within the archipelago. Mostspecies exhibit intra-archipelagic endemism, with only three species <strong>be</strong>ing more widely distributed within thearchipelago (S6, S39 and V32).
88 CHAPTER 44.3.2 Species-level phylogenyThe concatenated alignment of 5 loci consisted of 51 species and 3782positions and was 73% filled (Table S4.3). ML and BI yielded almost identical tree<strong>to</strong>pologies with general good nodal support, except for the basal divergences, whichreceived moderate <strong>to</strong> low support in both analyses. The phylogenetic tree obtainedfrom the ML analysis, with indication of ML bootstrap values and BI posteriorprobabilities, is shown in Fig S4.1. The time-calibrated phylogeny (Fig 4.4 and Fig.4.5) differed only in the basal divergences of clade 1 and in the position of clade 5;these relationships were poorly supported in all analyses.Phylogenetic analyses recovered nine main, well supported clades (Fig S4.1and Fig. 4.4). A strong biogeographical signal was recovered with five clades (2, 3,5, 8, 9) <strong>be</strong>ing confined <strong>to</strong> a single geographical region. Three large clades (3, 6 and8) were exclusively, or almost exclusively, composed of species from the IMA.
Evolution of the red seaweed Portieria in the tropical Indo-Pacific 89Fig. 4.4. Time-calibrated phylogeny of Portieria based on Bayesian analysis of a five-locus data set with divergencetimes estimated under a relaxed molecular clock in BEAST. Support values are posterior probabilities (PP); onlyvalues > 0.90 are shown. Uncertainty in divergence times are indicated by grey bars on internal nodes,corresponding <strong>to</strong> the 95% highest posterior density (HPD) of node ages. Time is given in millions of years <strong>be</strong>forepresent. Stars indicate significant diversification shifts using the relative cladogenesis statistic (see key in figure).
90 CHAPTER 4Fig. 4.5. Lineage through time (LTT) plot based on the chronogram in Fig. 4.4, showing a near constant rate ofdiversification.The origin of the genus Portieria was inferred <strong>to</strong> <strong>be</strong> in the middle <strong>to</strong> lateEocene, around 40 Ma (Fig. 4.4). The nine main clades originated mainly in theOligocene, and diversification within these clades occurred largely in the Miocene.More recent diversifications events (late Miocene <strong>to</strong> Pleis<strong>to</strong>cene) occurred withinIMA clusters in clades 1, 3 and 6. Widely distributed species in the Indian Ocean orwithin the Philippines were not necessarily older than species with more narrowdistributions (Fig S4.1 and Fig. 4.4). Divergence times estimated based on the‗universal‘ cox2-3 calibration reported in (Zuccarello & West, 2002) were slightlyyounger, but fell in the same range (Fig S4.3).The only significant increases in diversification rate (p=0.01), estimatedusing the relative cladogenesis statistic, were identified in a relatively young cladecomprising species V1A-V1E (Fig. 4.4). An additional shift in diversification rate(p=0.05) was identified on the branch leading <strong>to</strong> clades 1-5.4.4 Discussion4.4.1 Diversity, distribution and endemismA striking observation is the high observed species diversity within Portieria.Species boundaries within the genus have long <strong>be</strong>en unclear (Chapters 3 and 5).Seven species are currently accepted (Guiry & Guiry, 2011, Silva and Menez, 1987),although Wiseman (1975) recognized only a single, polymorphic species, P.hornemannii. The DNA-based species delimitation approach applied in this studyidentifies 51 species, thereby revealing a much greater diversity than previouslyenvisaged. Morphometric analyses indicate that a few species (e.g. V32, B21, B5 and
Evolution of the red seaweed Portieria in the tropical Indo-Pacific 91V1) can <strong>be</strong> distinguished by subtle morphological differences, while most otherspecies reveal a morphological continuum (Chapter 5). The 51 species can therefore<strong>be</strong> regarded as cryptic or pseudocryptic species.Cryptic speciation results from decoupling of morphological and geneticdivergence and is prevalent in a wide variety of marine organisms, includingseaweeds (Knowl<strong>to</strong>n, 1993, Bickford et al., 2007, Saunders, 2005, Leliaert et al.,2009, Verbruggen et al., 2007, Zuccarello & West, 2003, Saunders, 2008, Le Gall &Saunders, 2010). Cryptic diversity may <strong>be</strong> more common in organisms with asimple body plan, such as algae (Verbruggen et al., 2009). In addition, crypticspecies have <strong>be</strong>en predicted <strong>to</strong> <strong>be</strong> particularly frequent in the sea <strong>be</strong>cause manymarine organisms, including seaweeds, rely on chemical (i.e., non-visual) signals forgamete recognition, thereby reducing the role of sexual selection in drivingmorphological divergence (Palumbi, 1994, Knowl<strong>to</strong>n, 1993). Cryptic species tha<strong>to</strong>ccur sympatrically often display niche partitioning, either by exhibiting distinctecological preferences (e.g., depth, exposure or substrate) or by displaying temporalpartitioning of resources in response <strong>to</strong> seasonality (Knowl<strong>to</strong>n, 1993). For example,co-occurring cryptic species of the brown seaweed Dictyota have <strong>be</strong>en found <strong>to</strong>exhibit ecological differences related <strong>to</strong> wave exposure as well as seasonaldifferences in growth and gamete release (Tronholm et al., 2010). In Portieria, spatialor temporal niche partitioning is for now only partly revealed (Chapter 7).Our study shows that the allegedly widespread morpho-species P.hornemannii consists of multiple species with much narrower geographicaldistributions. All Portieria species are confined <strong>to</strong> a single Ocean basin, and most arerestricted <strong>to</strong> a single archipelago or short coastal stretch. Similar patterns ofgeographically restricted cryptic species in allegedly widely distributed marineorganisms have <strong>be</strong>en reported in other taxa (e.g. Leliaert et al., 2009, Kooistra et al.,2008, Verbruggen et al., 2005, Xavier et al., 2010). Studies focusing on marineinvertebrates and fishes have shown that range restricted species are mostcommonly found in remote peripheral archipelagos (Eble et al., 2009, Malay &Paulay, 2009), but similar <strong>to</strong> the situation in Portieria, endemism has also <strong>be</strong>enshown in the central IWP, indicating that archipelagic endemism may <strong>be</strong> morecommon than previously anticipated (Paulay & Meyer, 2002, Meyer et al., 2005,Kirkendale & Meyer, 2004). Nonetheless, the extreme small range sizes found insome Portieria species are striking. Within the Philippines, fine-scale endemism wasobserved for several species and some even appear <strong>to</strong> occur in localizedpopulations (chapter 3 and this study). This contrasts with most marine shallowwaterorganisms in the reef rich Indo-West Pacific, which have wider species ranges
92 CHAPTER 4(Paulay & Meyer, 2002, Kerswell, 2006). The range sizes found in the PhilippinePortieria species are unseen for marine <strong>be</strong>nthic organisms and seaweeds in particular,and are reminiscent of the distribution patterns in many groups of terrestrialorganisms where examples of intra-island and intra-archipelagic endemism abound(e.g., Cowie & Holland, 2008, Sarnat & Moreau, 2011).Compared <strong>to</strong> most marine invertebrates and fish, seaweeds are consideredpoor dispersers (Shanks et al., 2003, Kinlan & Gaines, 2003). Although the dispersalcapacity likely shows variation coinciding with the taxonomic and ecologicaldiversity of seaweeds, the spores or zygotes of most marine seaweeds are typicallyshort-lived and often negatively buoyant (Lüning, 1990, Des<strong>to</strong>m<strong>be</strong> et al., 1992). Inthe absence of detached and rafting reproductive thalli, this limited dispersalcapacity may reflect strongly on the spatial scale at which speciation takes place.Although, a drifting Portieria has <strong>be</strong>en observed in the field in two occasions(particularly, the more widespread species V32), there are no known reports forlarge scale drifting or any means of dispersal for this macroalga. Our results showthat genetic divergence and speciation in the sea can occur over much finer spatialscales than generally accepted.A clear pattern of maximum diversity of Portieria species was observed inthe IMA, with declining diversity when moving away from the central Indo-Pacific.This species richness pattern is similar across many other tropical coastalorganisms, including several seaweeds (Briggs, 1999, Bellwood & Hughes, 2001,Hoeksema, 2007, Williams & Reid, 2004, Kerswell, 2006, Tittensor et al., 2010).However, the distributions of Portieria species contrast <strong>to</strong> that many other tropicalseaweeds, where small-ranged taxa are mostly clustered in peripheral locations andthe high diversity in the central Indo-West Pacific is a consequence of overlap ofwidespread tropical taxa (Kerswell, 2006).4.4.2 Evolutionary his<strong>to</strong>ry of Portieria in the Indo-PacificOur phylogenetic analyses indicate that the early diversification of thePortieria clade <strong>to</strong>ok place around 30-45 Ma, predating the physical separation of theIndo-West Pacific from other biogeographical regions through the final closure ofthe Tethys Sea (18-19 Ma). Similar results have <strong>be</strong>en found in other Indo-WestPacific marine organisms (Williams, 2007, Williams & Duda, 2008).A clear biogeographical signal was observed in our phylogeny, reflectingthe limited dispersal of Portieria species over long evolutionary time scales. Threemain clades are almost entirely restricted <strong>to</strong> the IMA, and one clade consistsexclusively of Indian Ocean species. The estimate ages of these clades range
Evolution of the red seaweed Portieria in the tropical Indo-Pacific 93<strong>be</strong>tween 15 and 40 Ma, a time frame which is consistent <strong>to</strong> the long term geologicalformation of the IMA (Hall, 2002, Hall, 1998), and the emergence of the IMAbiodiversity hotspot (Renema et al., 2008). Phylogenetic analyses of several othermarine groups show similar patterns, in which lineages and diversification eventswithin IMA clades pre-date the geological formation of the IMA (Renema et al.,2008, Hall, 2002).Our Portieria phylogeny provides evidence relevant <strong>to</strong> the mechanisms thatproduced the IMA diversity hotspot. The ancientness of the main Portieria cladesand the presence of more recent diversifications within these clades suggest that thehigh diversity of Portieria species in the IMA resulted from two processes: 1)accumulation and diversification over a geological time frame of tens of millions ofyears and 2) more recent speciation events within the IMA. Our findings are thusconsistent with both the center of origin and center of accumulation models, actingover long temporal scales. Similar long evolutionary his<strong>to</strong>ries within the centralIndo-Pacific have <strong>be</strong>en found in fishes and invertebrates (Bellwood et al., 2004,Bar<strong>be</strong>r & Bellwood, 2005, Williams, 2007, Williams & Duda, 2008).Accumulation of species possibly resulted through integration and collisionof varied tec<strong>to</strong>nic plate elements from Eurasia, Australia and the Philippines overthe last 50 million years (Hall, 2002). Similar accumulation models throughintegration of multiple distinct biotas by tec<strong>to</strong>nic movement have <strong>be</strong>en proposedfor marine invertebrates and fishes (Rosen & Smith, 1988, Renema et al., 2008,Santini & Winterbot<strong>to</strong>m, 2002, Carpenter & Springer, 2005). The long and complexgeological his<strong>to</strong>ry of the region likely also provided opportunities for diversificationwithin the main Portieria clades. Several important tec<strong>to</strong>nic events during the Oligo-Miocene caused significant geological changes in the central IWP along withchanges in ocean currents (Hall, 1998). These geological changes resulted in theemergence of a broad zone of shallow water, and likely increased the rate ofemergence of islands in the IMA. The increased geographical complexity of theregion, formation of island barriers and the increased availability of habitats (e.g.,coral-carbonate platforms) during the Neogene likely provided opportunities forisolation and speciation (Wilson & Rosen, 1998, Williams & Duda, 2008, Carpenter& Springer, 2005).Concentrated speciation at small spatial scales within the IMA possibly<strong>to</strong>ok place during the Pleis<strong>to</strong>cene periods of glacially lowered sea level when seas(e.g., the South China, Sulu, Philippine, Cele<strong>be</strong>s, Molucca, and Banda seas) or largelagoons <strong>be</strong>came landlocked (Palumbi, 1994, Carpenter & Springer, 2005). Duringthese periods, Portieria populations may have experienced prolonged geographical
94 CHAPTER 4isolation, which may have led <strong>to</strong> speciation (So<strong>be</strong>l et al., 2010, Dawson & Hamner,2005). In addition, creation and colonization of empty niches associated withPleis<strong>to</strong>cene cycles of sea level rise-and-fall likely accelerated speciation rates. Ourresults are concordant with a large num<strong>be</strong>r of studies, which demonstrate thatgenetic differentiation and speciation in the sea occur over much smaller spatialscales than previously thought (Worheide et al., 2008, Meyer et al., 2005). Overall,our results are in agreement with several studies on marine invertebrates, whichshow that speciation events are concentrated in the central IWP over longgeological time frames, starting in the late Eocene or Oligocene (Williams & Duda,2008, Alfaro et al., 2007).The center of origin hypothesis posits that the large-scale gradient inspecies richness in the Indo-Pacific is the result of speciation within the IMA,followed by dispersal <strong>to</strong>wards other regions (Briggs, 1999, Mora et al., 2003).Although our study partly supports the center of origin model, we did not findevidence for recent or ongoing dispersal of Portieria species from the IMA center oforigination <strong>to</strong>wards the rest of the Indo-Pacific. Instead the diversity in the otherIndo-Pacific regions, such as the central and western Indian Ocean, likely resultedfrom ancient diversifications, which <strong>to</strong>ok place independently from speciationevents within the IMA.4.5 ConclusionsAlthough several tropical taxa exhibit highly congruent patterns ofbiodiversity, with a prominent hotspot in the IMA, there may <strong>be</strong> no singleexplanation for this pattern. Given the age and complex geological his<strong>to</strong>ry, alongwith the vast biological diversity of the IMA, it is likely that multiple processes haveprobably <strong>be</strong>en at work over long temporal scales (Bar<strong>be</strong>r, 2009, Halas &Winterbot<strong>to</strong>m, 2009). Our phylogenetic analysis of Portieria in the Indo-Pacificreflect the long and complex evolutionary his<strong>to</strong>ry of this seaweed and suggests thatthe observed biogeographical patterns are a combination of long-term persistenceof ancient lineages within confined geographical regions, including the IMA, alongwith more recent speciation events, possibly related <strong>to</strong> the climatic changes in thePleis<strong>to</strong>cene.The IMA biodiversity hotspot has provided a focus for numerousevolutionary and ecological studies, which have in their turn supported strategiesfor conservation efforts (Carpenter et al., 2008). Our study adds <strong>to</strong> the growingbody of evidence that the present-day species richness within the IMA hotspotresults from long and intricate evolutionary trajec<strong>to</strong>ries. For many organismal
Evolution of the red seaweed Portieria in the tropical Indo-Pacific 95groups, the IMA likely serve as both a species pump and a cradle of biodiversity,harbouring ancient lineages that were formed prior <strong>to</strong> the geological formation ofthe coral triangle. This study shows the importance of species boundaries inelucidating cryptic species and how it can impact our understanding on thedistribution and diversification of tropical seaweeds. Given this understanding, it istherefore, of utmost necessity that clarification on the boundaries of conservationcandidateentities has <strong>to</strong> <strong>be</strong> made, including its ranges, so that effectiveconservation measures and policies are launched.4.6 AcknowledgementsThe authors are grateful <strong>to</strong> A. Bucol, B. Caliñajan, F. Fumar, Z. Generoso, J. Lucañas, R.Ladiao, A.D. Macansan<strong>to</strong>s, D.G. Payo and W. Villaver for field sampling assistance, BatanesMENRO Francis Domingo for field and dive assistance, and <strong>to</strong> T. Cowling, E. Coppejans,S. Draisma, M. Hommersand, D. and M. Littler, R. Naguit, A. Sherwood, W. Tisera, W.Prud‘homme Van Reine for samples provided. We greatly appreciate the assistance ofCaroline Vlaeminck and Sofie D‘hondt on PCR and sequencing work. Funding for thisresearch was provided by the Flemish Interuniversity Council (VLIR) as part of the PhDGrant <strong>to</strong> D.A. Payo. Completion of this work was made possible by a grant <strong>to</strong> D.A. Payofrom the Belgian National Focal Point <strong>to</strong> the Global Taxonomy Initiative through Dr. YvesSamyn of the Royal Belgian Institute of Natural Sciences (RBINS).
96 CHAPTER 44.7 Supplementary figuresFig. S4.1. ML species tree of Portieria, with indication of ML bootstrap values (above branches) and BI posteriorprobabilities (<strong>be</strong>low branches).
Evolution of the red seaweed Portieria in the tropical Indo-Pacific 97Fig. S4.2. Time-calibrated phylogeny of the red algae.
98 CHAPTER 4Fig. S4.3. Portieria divergence based on the ‗universal‘ cox2-3 calibration reported in Zuccarello & West (2002),<strong>be</strong>ing 0.25-0.3 % divergence/Ma.
Evolution of the red seaweed Portieria in the tropical Indo-Pacific 994.8 Supplementary tablesTable S4.1. List of specimens, site of collection and available sequence data.Species Voucher Field ID Location cox 1 cox 23 EF2_1 EF2_3 rbc L rbc L- sp4 HEC11802 Portieria hornemannii Beruw ela, Sri Lanka x x x x9 BER16 Portieria hornemannii Maratua, N.E. Coast, Borneo, Indonesia x x x x9 BER17 Portieria hornemannii Maratua, N.E. Coast, Borneo, Indonesia x x x x10 HEC6584 Portieria hornemannii Boisa Island, Madang Province,Papua New Guinea x x11 HEC12085 Portieria hornemannii Zanzibar - Matemw e, Tanzania x x x x12 HEC12155 Portieria hornemannii Borabo reef, Tanzania x x13 HEC4280 Portieria hornemannii Laing Island, Besalpap, Papua New Guinea x x x13 HEC13421B Portieria hornemannii Madang - Pig Island, Papua New Guinea x14 HEC12499 Portieria hornemannii Arraw arra <strong>be</strong>ach - drift specimens, Australia x x x x15 POR004 Portieria hornemannii North Keppel Is., Australia x x x16 ODC1160 Portieria tripinnata Palm Beach, Kw azulu-Natal, South Africa x x x x x16 KZN27 Portieria tripinnata Zinkw azi, Black Rock Park, South Africa x x x x17 KZN2310 Portieria hornemannii Isipingo, South Africa x x x x x17 HEC11004 Portieria hornemannii Mission Rocks, St. Lucia, Kw azulu-Natal, South Africa x x17 KZN852 Portieria hornemannii Palm Beach, South Africa x x18 HEC8490 Portieria hornemannii Diani, Kenya x18 MAS5050 Portieria hornemannii Masirah, Oman x x18 ODC1609 Portieria hornemannii Mc Kenzie Pt, Nyali, Mombasa, Kenya x x x18 SOC030 Portieria hornemannii Socotra, Yemen x18 SOC154 Portieria hornemannii Socotra, Yemen x x x18 HEC14316 Portieria hornemannii Tangalle, Sri Lanka x x19 KZN24 Portieria hornemannii Mabibi, Kw azulu Natal, South Africa x x x x20 BAH4012 Portieria hornemannii Barr Al Hikman, Ash Sharqiyyah, Oman x x20 SOC394 Portieria hornemannii Bidhola, Nojid, Socotra Archipelago, Yemen x x20 ODC1589 Portieria hornemannii Kinondo Reef, Kenya x x x x20 ODC1592 Portieria hornemannii Kinondo Reef, Kenya x x x20 ODC1595 Portieria hornemannii Kinondo Reef, Kenya x x20 ODC1596 Portieria hornemannii Kinondo Reef, Kenya x x x20 MAS5060 Portieria hornemannii Masirah, Oman x x20 HEC7191 Portieria hornemannii McKenzie Pt., Mombasa, Kenya x20 SOC374 Portieria hornemannii Steroh, Nojid, Socotra Archipelago, Yemen x22 ODC1590 Portieria hornemannii Kinondo Reef, Kenya x x x x x22 ODC1591 Portieria hornemannii Kinondo Reef, Kenya x x x x22 ODC1593 Portieria hornemannii Kinondo Reef, Kenya x x x22 ODC1597 Portieria hornemannii Kinondo Reef, Kenya x x22 HEC12055 Portieria hornemannii Zanzibar - Matemw e - Mnemba Reef, Kichw ani, Tanzania x x23 ODC1665 Portieria hornemannii Gazi, Chale Island, Kenya x x24 HEC16081 Portieria hornemannii Beruw ela, Sri Lanka x x x24 HEC15980 Portieria hornemannii Kalpitiya Reef, Sri Lanka x x24 HEC11748 Portieria hornemannii Mafia Island, Chole Bay, Tanzania x25 HEC10175 Portieria hornemannii Port Moresby area, Motupore Island, Papua New Guinea x x x28 HEC6120 Portieria hornemannii Bi Ya Doo Island, The Maldives x28 HEC12561 Portieria hornemannii Ellaidhoo, Maldives x x x x29 ODC906 Portieria hornemannii Kaalaw ai, Oahu, Haw aii x x x x
100 CHAPTER 4Table S4.1. Continued.Species Voucher Field ID Location cox 1 cox 23 EF2_1 EF2_3 rbc L rbc L- sp29 HAW001 Portieria hornemannii Waikiki, Haw aii x x x x x30 POR001 Portieria japonica Tokaw a, Choshi, Chiba, Japan x x x x31 MAY011 Portieria hornemannii Pasig reef, Maydolong, Eastern Samar, Philippines x x31 MAY012 Portieria hornemannii Pasig reef, Maydolong, Eastern Samar, Philippines x x35 DAP1393 Portieria hornemannii Pier Basco, Batanes, Philippines x35 DAP1394 Portieria hornemannii Pier Basco, Batanes, Philippines x35 DAP1450 Portieria hornemannii Pier Mahatao,Batanes, Philippines x38 DAP1427 Portieria hornemannii Coral, Basco, Batanes, Philippines x x x x x42 TAI04B Portieria hornemannii Sail Rook, Kenting National Park, Southern Taiw an x x44 TAI01A Portieria hornemannii Ho Ping Island, Keelung City, N.E. Taiw an x x x x x x44 TAI02A Portieria hornemannii Ho Ping Island, Keelung City, N.E. Taiw an x x x x x x44 TAI03A Portieria hornemannii Ho Ping Island, Keelung City, N.E. Taiw an x x x x x x44 TAI04A Portieria hornemannii Ho Ping Island, Keelung City, N.E. Taiw an x44 TAI05A Portieria hornemannii Ho Ping Island, Keelung City, N.E. Taiw an x44 TAI06A Portieria hornemannii Ho Ping Island, Keelung City, N.E. Taiw an x45 BUN001 Portieria hornemannii Bunaken Island, Manado, Indonesia x45 BUN002 Portieria hornemannii Bunaken Island, Manado, Indonesia x45 BUN003 Portieria hornemannii Bunaken Island, Manado, Indonesia x46 TAI01B Portieria hornemannii Sail Rook, Kenting National Park, Southern Taiw an x x x x x46 TAI02B Portieria hornemannii Sail Rook, Kenting National Park, Southern Taiw an x x x x x46 TAI03B Portieria hornemannii Sail Rook, Kenting National Park, Southern Taiw an x x x x46 TAI05B Portieria hornemannii Sail Rook, Kenting National Park, Southern Taiw an x46 TAI06B Portieria hornemannii Sail Rook, Kenting National Park, Southern Taiw an x47 U04215 Portieria_hornemannii NCBI x48 AF212185 Portieria_hornemannii NCBI xB21 DAP364 Portieria hornemannii Chanaryan, Basco, Batanes, Philippines x xB21 DAP367 Portieria hornemannii Chanaryan, Basco, Batanes, Philippines x x x xB21 DAP369 Portieria hornemannii Chanaryan, Basco, Batanes, Philippines x x x x x xB21 DAP374 Portieria hornemannii Chanaryan, Basco, Batanes, Philippines x xB21 DAP375 Portieria hornemannii Chanaryan, Basco, Batanes, Philippines x xB21 DAP1466 Portieria hornemannii Chavayan, Sabtang, Batanes, Philippines x x xB21 DAP1471 Portieria hornemannii Chavayan, Sabtang, Batanes, Philippines x x xB21 DAP1472 Portieria hornemannii Chavayan, Sabtang, Batanes, Philippines xB21 DAP1422 Portieria hornemannii Coral, Basco, Batanes, Philippines x xB21 DAP1449 Portieria hornemannii Pier Mahatao,Batanes, Philippines x x xB21 DAP1434 Portieria hornemannii White Beach, Mahatao, Batanes, Philippines x xB21 DAP1437 Portieria hornemannii White Beach, Mahatao, Batanes, Philippines x xB21 DAP1442 Portieria hornemannii White Beach, Mahatao, Batanes, Philippines x x xB21 DAP339 Portieria hornemannii White Beach, Mahatao, Batanes, Philippines x x x xB33 DAP1419 Portieria hornemannii Coral, Basco, Batanes, Philippines x xB33 DAP1420 Portieria hornemannii Coral, Basco, Batanes, Philippines x xB33 DAP1424 Portieria hornemannii Coral, Basco, Batanes, Philippines xB33 DAP1425 Portieria hornemannii Coral, Basco, Batanes, Philippines x xB33 DAP1426 Portieria hornemannii Coral, Basco, Batanes, Philippines xB33 DAP1428 Portieria hornemannii Coral, Basco, Batanes, Philippines xB33 DAP1429 Portieria hornemannii Coral, Basco, Batanes, Philippines xB33 DAP1430 Portieria hornemannii Coral, Basco, Batanes, Philippines x xB33 DAP1431 Portieria hornemannii Coral, Basco, Batanes, Philippines xB33 DAP1432 Portieria hornemannii White Beach, Mahatao, Batanes, Philippines xB34 DAP337 Portieria hornemannii White Beach, Mahatao, Batanes, Philippines x x x x x xB34 DAP338 Portieria hornemannii White Beach, Mahatao, Batanes, Philippines x x x x x
Evolution of the red seaweed Portieria in the tropical Indo-Pacific 101Table S4.1. Continued.Species Voucher Field ID Location cox 1 cox 23 EF2_1 EF2_3 rbc L rbc L- spB33 DAP1428 Portieria hornemannii Coral, Basco, Batanes, Philippines xB33 DAP1429 Portieria hornemannii Coral, Basco, Batanes, Philippines xB33 DAP1430 Portieria hornemannii Coral, Basco, Batanes, Philippines x xB33 DAP1431 Portieria hornemannii Coral, Basco, Batanes, Philippines xB33 DAP1432 Portieria hornemannii White Beach, Mahatao, Batanes, Philippines xB34 DAP337 Portieria hornemannii White Beach, Mahatao, Batanes, Philippines x x x x x xB34 DAP338 Portieria hornemannii White Beach, Mahatao, Batanes, Philippines x x x x xB35 DAP363 Portieria hornemannii Chanaryan, Basco, Batanes, Philippines x x x xB35 DAP368 Portieria hornemannii Chanaryan, Basco, Batanes, Philippines x x x xB35 DAP371 Portieria hornemannii Chanaryan, Basco, Batanes, Philippines x x x x xB35 DAP372 Portieria hornemannii Chanaryan, Basco, Batanes, Philippines x xB35 DAP377 Portieria hornemannii Chanaryan, Basco, Batanes, Philippines x xB35 DAP1467 Portieria hornemannii Chavayan, Sabtang, Batanes, Philippines xB35 DAP1421 Portieria hornemannii Coral, Basco, Batanes, Philippines x xB35 DAP1423 Portieria hornemannii Coral, Basco, Batanes, Philippines xB35 DAP1395 Portieria hornemannii Pier Basco, Batanes, Philippines xB35 DAP1398 Portieria hornemannii Pier Basco, Batanes, Philippines xB35 DAP1399 Portieria hornemannii Pier Basco, Batanes, Philippines xB35 DAP1400 Portieria hornemannii Pier Basco, Batanes, Philippines x xB35 DAP1403 Portieria hornemannii Pier Basco, Batanes, Philippines x xB35 DAP1404 Portieria hornemannii Pier Basco, Batanes, Philippines x xB35 DAP1405 Portieria hornemannii Pier Basco, Batanes, Philippines xB35 DAP1409 Portieria hornemannii Pier Basco, Batanes, Philippines xB35 DAP1410 Portieria hornemannii Pier Basco, Batanes, Philippines xB35 DAP1411 Portieria hornemannii Pier Basco, Batanes, Philippines xB35 DAP1412 Portieria hornemannii Pier Basco, Batanes, Philippines x xB35 DAP1413 Portieria hornemannii Pier Basco, Batanes, Philippines xB35 DAP1414 Portieria hornemannii Pier Basco, Batanes, Philippines xB35 DAP1415 Portieria hornemannii Pier Basco, Batanes, Philippines xB35 DAP1417 Portieria hornemannii Pier Basco, Batanes, Philippines xB35 DAP1443 Portieria hornemannii White Beach, Mahatao, Batanes, Philippines x xB35 DAP1447 Portieria hornemannii White Beach, Mahatao, Batanes, Philippines xB35 DAP340 Portieria hornemannii White Beach, Mahatao, Batanes, Philippines x x xB35 DAP342 Portieria hornemannii White Beach, Mahatao, Batanes, Philippines xB35 DAP347 Portieria hornemannii White Beach, Mahatao, Batanes, Philippines x xB5 DAP352 Portieria hornemannii Chanaryan, Basco, Batanes, Philippines xB5 DAP365 Portieria hornemannii Chanaryan, Basco, Batanes, Philippines xB5 DAP370 Portieria hornemannii Chanaryan, Basco, Batanes, Philippines xB5 DAP373 Portieria hornemannii Chanaryan, Basco, Batanes, Philippines xB5 DAP1451 Portieria hornemannii Chavayan, Sabtang, Batanes, Philippines x xB5 DAP1452 Portieria hornemannii Chavayan, Sabtang, Batanes, Philippines x xB5 DAP1453 Portieria hornemannii Chavayan, Sabtang, Batanes, Philippines xB5 DAP1454 Portieria hornemannii Chavayan, Sabtang, Batanes, Philippines xB5 DAP1455 Portieria hornemannii Chavayan, Sabtang, Batanes, Philippines x xB5 DAP1456 Portieria hornemannii Chavayan, Sabtang, Batanes, Philippines xB5 DAP1457 Portieria hornemannii Chavayan, Sabtang, Batanes, Philippines xB5 DAP1458 Portieria hornemannii Chavayan, Sabtang, Batanes, Philippines xB5 DAP1459 Portieria hornemannii Chavayan, Sabtang, Batanes, Philippines x xB5 DAP1460 Portieria hornemannii Chavayan, Sabtang, Batanes, Philippines xB5 DAP1462 Portieria hornemannii Chavayan, Sabtang, Batanes, Philippines xB5 DAP1463 Portieria hornemannii Chavayan, Sabtang, Batanes, Philippines x
102 CHAPTER 4Table S4.1. Continued.Species Voucher Field ID Location cox 1 cox 23 EF2_1 EF2_3 rbc L rbc L- spB5 DAP1464 Portieria hornemannii Chavayan, Sabtang, Batanes, Philippines x xB5 DAP1465 Portieria hornemannii Chavayan, Sabtang, Batanes, Philippines xB5 DAP1469 Portieria hornemannii Chavayan, Sabtang, Batanes, Philippines xB5 DAP1470 Portieria hornemannii Chavayan, Sabtang, Batanes, Philippines xB5 DAP1435 Portieria hornemannii White Beach, Mahatao, Batanes, Philippines xB5 DAP1436 Portieria hornemannii White Beach, Mahatao, Batanes, Philippines x x xB5 DAP1438 Portieria hornemannii White Beach, Mahatao, Batanes, Philippines xB5 DAP1440 Portieria hornemannii White Beach, Mahatao, Batanes, Philippines x xB5 DAP1441 Portieria hornemannii White Beach, Mahatao, Batanes, Philippines x xB5 DAP1445 Portieria hornemannii White Beach, Mahatao, Batanes, Philippines x xB5 DAP1446 Portieria hornemannii White Beach, Mahatao, Batanes, Philippines x xB5 DAP318 Portieria hornemannii White Beach, Mahatao, Batanes, Philippines xB5 DAP321 Portieria hornemannii White Beach, Mahatao, Batanes, Philippines xB5 DAP333 Portieria hornemannii White Beach, Mahatao, Batanes, Philippines x x x x x xB5 DAP334 Portieria hornemannii White Beach, Mahatao, Batanes, Philippines x x x x xB5 DAP343 Portieria hornemannii White Beach, Mahatao, Batanes, Philippines x xB5 DAP344 Portieria hornemannii White Beach, Mahatao, Batanes, Philippines x x xB5 DAP346 Portieria hornemannii White Beach, Mahatao, Batanes, Philippines x x x x xB8 DAP1439 Portieria hornemannii White Beach, Mahatao, Batanes, Philippines x x x x xB8 DAP1444 Portieria hornemannii White Beach, Mahatao, Batanes, Philippines x x x x xB8 DAP1461 Portieria hornemannii Chavayan, Sabtang, Batanes, Philippines x x x x x xB8 DAP1468 Portieria hornemannii Chavayan, Sabtang, Batanes, Philippines xB8 DAP1396 Portieria hornemannii Pier Basco, Batanes, Philippines x x x x xB8 DAP1397 Portieria hornemannii Pier Basco, Batanes, Philippines x x x x xB8 DAP1401 Portieria hornemannii Pier Basco, Batanes, Philippines xB8 DAP1402 Portieria hornemannii Pier Basco, Batanes, Philippines xB8 DAP1406 Portieria hornemannii Pier Basco, Batanes, Philippines xB8 DAP1407 Portieria hornemannii Pier Basco, Batanes, Philippines xB8 DAP1408 Portieria hornemannii Pier Basco, Batanes, Philippines xB8 DAP1416 Portieria hornemannii Pier Basco, Batanes, Philippines xB8 DAP1418 Portieria hornemannii Pier Basco, Batanes, Philippines x x xB8 DAP1448 Portieria hornemannii Pier Mahatao,Batanes, Philippines x x x xB8 DAP336 Portieria hornemannii White Beach, Mahatao, Batanes, Philippines x x x x xB8 DAP345 Portieria hornemannii White Beach, Mahatao, Batanes, Philippines x x x x xS2 DAP1501 Portieria hornemannii Dapdap, Bulusan, Sorsogon, Philippines xS36 DAP1482 Portieria hornemannii Dancalan, Bulusan, Sorsogon, Philippines x x x x x xS36 DAP1487 Portieria hornemannii Dancalan, Bulusan, Sorsogon, Philippines x x x x x xS36 DAP1490 Portieria hornemannii Dancalan, Bulusan, Sorsogon, Philippines x x x x x xS39 GUI004 Portieria hornemannii Binuthan, Guiuan, Eastern Samar, Philippines xS39 GUI010 Portieria hornemannii Binuthan, Guiuan, Eastern Samar, Philippines xS39 GUI013 Portieria hornemannii Binuthan, Guiuan, Eastern Samar, Philippines xS39 GUI016 Portieria hornemannii Binuthan, Guiuan, Eastern Samar, Philippines xS39 GUI017 Portieria hornemannii Binuthan, Guiuan, Eastern Samar, Philippines xS39 GUI019 Portieria hornemannii Binuthan, Guiuan, Eastern Samar, Philippines xS39 DAP1476 Portieria hornemannii Dancalan, Bulusan, Sorsogon, Philippines x x x xS39 DAP1480 Portieria hornemannii Dancalan, Bulusan, Sorsogon, Philippines x x x xS39 DAP1483 Portieria hornemannii Dancalan, Bulusan, Sorsogon, Philippines xS39 DAP1491 Portieria hornemannii Dancalan, Bulusan, Sorsogon, Philippines x xS39 DAP1492 Portieria hornemannii Dancalan, Bulusan, Sorsogon, Philippines xS39 DAP290 Portieria hornemannii Pasig reef, Maydolong, Eastern Samar, Philippines x x x xS39 DAP297 Portieria hornemannii Pasig reef, Maydolong, Eastern Samar, Philippines x
Evolution of the red seaweed Portieria in the tropical Indo-Pacific 103Table S4.1. Continued.Species Voucher Field ID Location cox 1 cox 23 EF2_1 EF2_3 rbc L rbc L- spS40 DAP1473 Portieria hornemannii Dancalan, Bulusan, Sorsogon, Philippines x x x x x xS40 DAP1493 Portieria hornemannii Dapdap, Bulusan, Sorsogon, Philippines x x x xS6 DAP1474 Portieria hornemannii Dancalan, Bulusan, Sorsogon, Philippines x xS6 DAP1475 Portieria hornemannii Dancalan, Bulusan, Sorsogon, Philippines x xS6 DAP1484 Portieria hornemannii Dancalan, Bulusan, Sorsogon, Philippines x x x x x xS6 DAP1502 Portieria hornemannii Dancalan, Bulusan, Sorsogon, Philippines xS6 DAP1503 Portieria hornemannii Dapdap, Bulusan, Sorsogon, Philippines x x x x x xS6 DAP1504 Portieria hornemannii Dapdap, Bulusan, Sorsogon, Philippines xS6 DAP1505 Portieria hornemannii Dapdap, Bulusan, Sorsogon, Philippines x xS6 DAP1506 Portieria hornemannii Dapdap, Bulusan, Sorsogon, Philippines x xS6 DAP1507 Portieria hornemannii Dapdap, Bulusan, Sorsogon, Philippines xS6 DAP1508 Portieria hornemannii Dapdap, Bulusan, Sorsogon, Philippines xS6 DAP1509 Portieria hornemannii Dapdap, Bulusan, Sorsogon, Philippines x xS6 DAP1510 Portieria hornemannii Dapdap, Bulusan, Sorsogon, Philippines xS6 DAP1511 Portieria hornemannii Dapdap, Bulusan, Sorsogon, Philippines x x x x xS6 DAP1512 Portieria hornemannii Dapdap, Bulusan, Sorsogon, Philippines xS6 POR003 Portieria hornemannii Dapdap, Bulusan, Sorsogon, Philippines x x x xS6 MAY002 Portieria hornemannii Pasig reef, Maydolong, Eastern Samar, Philippines xS7 DAP1477 Portieria hornemannii Dancalan, Bulusan, Sorsogon, Philippines x x x x x xS7 DAP1478 Portieria hornemannii Dancalan, Bulusan, Sorsogon, Philippines x xS7 DAP1481 Portieria hornemannii Dancalan, Bulusan, Sorsogon, Philippines x x x x x xS7 DAP1485 Portieria hornemannii Dancalan, Bulusan, Sorsogon, Philippines x x x x x xS7 DAP1488 Portieria hornemannii Dancalan, Bulusan, Sorsogon, Philippines xS7 DAP1489 Portieria hornemannii Dancalan, Bulusan, Sorsogon, Philippines xS7 POR002 Portieria hornemannii Dancalan, Bulusan, Sorsogon, Philippines x x x xSP3 SCS105 Portieria hornemannii Spratley Islands x x x x xSP3 SCS109 Portieria hornemannii Spratley Islands x x x xV1A DAP108 Portieria hornemannii Bukabok, Tambisan, San Juan, Siquijor, Philippines x x xV1A DAP102 Portieria hornemannii Dapdap, Siquijor, Siquijor, Philippines x xV1A DAP103 Portieria hornemannii Dapdap, Siquijor, Siquijor, Philippines x x xV1A DAP104 Portieria hornemannii Dapdap, Siquijor, Siquijor, Philippines x xV1A DAP210 Portieria hornemannii Dapdap, Siquijor, Siquijor, Philippines x x xV1A DAP213 Portieria hornemannii Dapdap, Siquijor, Siquijor, Philippines x x x x xV1A DAP214 Portieria hornemannii Dapdap, Siquijor, Siquijor, Philippines x x xV1A DAP439 Portieria hornemannii Dapdap, Siquijor, Siquijor, Philippines x x xV1A DAP442 Portieria hornemannii Dapdap, Siquijor, Siquijor, Philippines x xV1A DAP445 Portieria hornemannii Dapdap, Siquijor, Siquijor, Philippines x x xV1A DAP450 Portieria hornemannii Dapdap, Siquijor, Siquijor, Philippines x xV1A DAP058 Portieria hornemannii Malo,Sia<strong>to</strong>n, Philippines x x x x xV1A DAP070 Portieria hornemannii Malo,Sia<strong>to</strong>n, Philippines x x xV1A DAPSTN1 Portieria hornemannii Malo,Sia<strong>to</strong>n, Philippines xV1B DAP247 Portieria hornemannii Bantayan, Dumaguete, Philippines x x xV1B DAP248 Portieria hornemannii Bantayan, Dumaguete, Philippines x x xV1B DAP249 Portieria hornemannii Bantayan, Dumaguete, Philippines x x xV1B DAP250 Portieria hornemannii Bantayan, Dumaguete, Philippines x x x x xV1B DAP251 Portieria hornemannii Bantayan, Dumaguete, Philippines x x xV1B DAP087 Portieria hornemannii Silliman Beach, Bantayan, Dumaguete City, Philippines x xV1B DAP088 Portieria hornemannii Silliman Beach, Bantayan, Dumaguete City, Philippines x xV1C DAP167 Portieria hornemannii Daang Lungsod, Alcoy, Cebu, Philippines x x x xV1C DAP168 Portieria hornemannii Daang Lungsod, Alcoy, Cebu, Philippines x x x x xV1C DAP170 Portieria hornemannii Daang Lungsod, Alcoy, Cebu, Philippines x x x
104 CHAPTER 4Table S4.1. Continued.Species Voucher Field ID Location cox 1 cox 23 EF2_1 EF2_3 rbc L rbc L- spV1C DAP171 Portieria hornemannii Daang Lungsod, Alcoy, Cebu, Philippines x x xV1C DAP185 Portieria hornemannii Daang Lungsod, Alcoy, Cebu, Philippines x x xV1C DAP186 Portieria hornemannii Daang Lungsod, Alcoy, Cebu, Philippines x x xV1C DAP211 Portieria hornemannii Dapdap, Siquijor, Siquijor, Philippines x xV1E PAL001 Portieria hornemannii Palompon, Leyte, Philippines xV1E PAL002 Portieria hornemannii Palompon, Leyte, Philippines xV1E DAP144 Portieria hornemannii Tolingon, Isa<strong>be</strong>l, Leyte, Philippines xV1E DAP145 Portieria hornemannii Tolingon, Isa<strong>be</strong>l, Leyte, Philippines x xV1E DAP146 Portieria hornemannii Tolingon, Isa<strong>be</strong>l, Leyte, Philippines xV1E DAP148 Portieria hornemannii Tolingon, Isa<strong>be</strong>l, Leyte, Philippines x xV1E DAP151 Portieria hornemannii Tolingon, Isa<strong>be</strong>l, Leyte, Philippines x x xV1E DAP152 Portieria hornemannii Tolingon, Isa<strong>be</strong>l, Leyte, Philippines x x xV1E DAP153 Portieria hornemannii Tolingon, Isa<strong>be</strong>l, Leyte, Philippines x x xV1E DAP154 Portieria hornemannii Tolingon, Isa<strong>be</strong>l, Leyte, Philippines x x x x xV1E DAP155 Portieria hornemannii Tolingon, Isa<strong>be</strong>l, Leyte, Philippines x xV1E DAP156 Portieria hornemannii Tolingon, Isa<strong>be</strong>l, Leyte, Philippines x x x x xV26 DAP184 Portieria hornemannii Daang Lungsod, Alcoy, Cebu, Philippines x xV26 DAP052 Portieria hornemannii Malo,Sia<strong>to</strong>n, Philippines x x x x x xV26 DAP054 Portieria hornemannii Malo,Sia<strong>to</strong>n, Philippines x x x x x xV26 DAP055 Portieria hornemannii Malo,Sia<strong>to</strong>n, Philippines x x x xV26 DAPSTN2 Portieria hornemannii Malo,Sia<strong>to</strong>n, Philippines xV27 DAP187 Portieria hornemannii Apo, Dauin, Negros Oriental, Philippines x xV27 DAP188 Portieria hornemannii Apo, Dauin, Negros Oriental, Philippines x x x xV27 DAP189 Portieria hornemannii Apo, Dauin, Negros Oriental, Philippines x xV27 DAP190 Portieria hornemannii Apo, Dauin, Negros Oriental, Philippines x x x x xV27 DAP191 Portieria hornemannii Apo, Dauin, Negros Oriental, Philippines x x x x xV27 DAP468 Portieria hornemannii Pali<strong>to</strong>n, Siquijor, Philippines x xV31 DAP286 Portieria hornemannii Pasig reef, Maydolong, Eastern Samar, Philippines x x x x x xV31 DAP288 Portieria hornemannii Pasig reef, Maydolong, Eastern Samar, Philippines x x x x x xV31 DAP291 Portieria hornemannii Pasig reef, Maydolong, Eastern Samar, Philippines xV31 DAP293 Portieria hornemannii Pasig reef, Maydolong, Eastern Samar, Philippines x xV31 DAP294 Portieria hornemannii Pasig reef, Maydolong, Eastern Samar, Philippines x xV31 DAP295 Portieria hornemannii Pasig reef, Maydolong, Eastern Samar, Philippines xV31 DAP296 Portieria hornemannii Pasig reef, Maydolong, Eastern Samar, Philippines xV31 MAY001 Portieria hornemannii Pasig reef, Maydolong, Eastern Samar, Philippines xV31 MAY003 Portieria hornemannii Pasig reef, Maydolong, Eastern Samar, Philippines xV31 MAY004 Portieria hornemannii Pasig reef, Maydolong, Eastern Samar, Philippines xV31 MAY006 Portieria hornemannii Pasig reef, Maydolong, Eastern Samar, Philippines xV31 MAY007 Portieria hornemannii Pasig reef, Maydolong, Eastern Samar, Philippines xV31 MAY008 Portieria hornemannii Pasig reef, Maydolong, Eastern Samar, Philippines xV31 MAY009 Portieria hornemannii Pasig reef, Maydolong, Eastern Samar, Philippines xV31 MAY010 Portieria hornemannii Pasig reef, Maydolong, Eastern Samar, Philippines xV31 MAY013 Portieria hornemannii Pasig reef, Maydolong, Eastern Samar, Philippines xV31 MAY014 Portieria hornemannii Pasig reef, Maydolong, Eastern Samar, Philippines xV31 MAY015 Portieria hornemannii Pasig reef, Maydolong, Eastern Samar, Philippines xV31 MAY016 Portieria hornemannii Pasig reef, Maydolong, Eastern Samar, Philippines xV31 MAY017 Portieria hornemannii Pasig reef, Maydolong, Eastern Samar, Philippines xV31 MAY018 Portieria hornemannii Pasig reef, Maydolong, Eastern Samar, Philippines xV31 MAY019 Portieria hornemannii Pasig reef, Maydolong, Eastern Samar, Philippines xV32 GUI001 Portieria hornemannii Binuthan, Guiuan, Eastern Samar, Philippines x
Evolution of the red seaweed Portieria in the tropical Indo-Pacific 105Table S4.1. Continued.Species Voucher Field ID Location cox 1 cox 23 EF2_1 EF2_3 rbc L rbc L- spV32 GUI002 Portieria hornemannii Binuthan, Guiuan, Eastern Samar, Philippines xV32 GUI003 Portieria hornemannii Binuthan, Guiuan, Eastern Samar, Philippines xV32 GUI005 Portieria hornemannii Binuthan, Guiuan, Eastern Samar, Philippines xV32 GUI006 Portieria hornemannii Binuthan, Guiuan, Eastern Samar, Philippines xV32 GUI007 Portieria hornemannii Binuthan, Guiuan, Eastern Samar, Philippines xV32 GUI008 Portieria hornemannii Binuthan, Guiuan, Eastern Samar, Philippines xV32 GUI009 Portieria hornemannii Binuthan, Guiuan, Eastern Samar, Philippines xV32 GUI011 Portieria hornemannii Binuthan, Guiuan, Eastern Samar, Philippines xV32 GUI014 Portieria hornemannii Binuthan, Guiuan, Eastern Samar, Philippines xV32 GUI018 Portieria hornemannii Binuthan, Guiuan, Eastern Samar, Philippines xV32 CAM001 Portieria hornemannii Camiguin Island, Philippines xV32 DAP1388 Portieria hornemannii Liloan, Santander, Cebu, Philippines xV32 DAP1389 Portieria hornemannii Liloan, Santander, Cebu, Philippines xV32 DAP1390 Portieria hornemannii Liloan, Santander, Cebu, Philippines xV32 DAP1391 Portieria hornemannii Liloan, Santander, Cebu, Philippines xV32 DAP1392 Portieria hornemannii Liloan, Santander, Cebu, Philippines xV32 DAP1393a Portieria hornemannii Liloan, Santander, Cebu, Philippines xV32 DAP1394a Portieria hornemannii Liloan, Santander, Cebu, Philippines xV32 DAP1338 Portieria hornemannii Pagubagubaan Reef, San Juan, Siquijor, Philippines x xV32 DAP1342 Portieria hornemannii Pagubagubaan Reef, San Juan, Siquijor, Philippines x x x x xV32 DAP1346 Portieria hornemannii Pagubagubaan Reef, San Juan, Siquijor, Philippines x xV32 DAP1351 Portieria hornemannii Pagubagubaan Reef, San Juan, Siquijor, Philippines x x xV32 DAP1352 Portieria hornemannii Pagubagubaan Reef, San Juan, Siquijor, Philippines x xV32 DAP455 Portieria hornemannii Pali<strong>to</strong>n, Siquijor, Philippines xV32 DAP202 Portieria hornemannii Saw ang Reef, San Juan, Siquijor, Philippines x x x x x xV32 DAP204 Portieria hornemannii Saw ang Reef, San Juan, Siquijor, Philippines x x x x x xV32 DAP480 Portieria hornemannii Saw ang Reef, San Juan, Siquijor, Philippines x xV32 DAP482 Portieria hornemannii Saw ang Reef, San Juan, Siquijor, Philippines x xV32 DAP533 Portieria hornemannii Saw ang Reef, San Juan, Siquijor, Philippines x xV32 DAP544 Portieria hornemannii Saw ang Reef, San Juan, Siquijor, Philippines xog DML30919 Och<strong>to</strong>des secundiramea Rocher du Diamant, Martinique x x x x x
106 CHAPTER 4Table S4.2. Amplified genes, primer sequences and pcr conditions used.Genomic TargetcompartmentPrimernamePrimer sequence (5’–3’) Reference PCR programMi<strong>to</strong>chondria cox 2-3 spacer cox2F GTACCWTCTTTDRGRRKDAAATGTGATGC Zuccarello 1999 one cycle of 4 min at 94 °C; five cycles of 1 min atcox3R GGATCTACWAGATGRAAWGGATGTC Zuccarello 1999 93 °C, 1 min at 45 °C and 1 min at 72 °C, 30 cyclesof 30s at 93 °C, 30s at 50 °C and 30s at 72 °C and afinal cycle of 5 min at 72 °Ccox 1 GazF1 TCAACAAATCATAAAGATATTGG Saunders 2005GazR1 ACTTCTGGATGTCCAAAAAAYCA Saunders 2005Chloroplast rbc L+spacer F993F GGTACTGTTGTAGGTAAATTAGAAGG Freshwater andRueness 1994 one cycle of 3 min at 94 °C, 35 cycles of 1 min at 94F993nF TTCCGTCGTTATTTGTAAATGGThis study °C, 1 min at 46 °C and 1.5 min at 72 °C and a finalrbcsR TGTGTTGCGGCCGCCCTTGTGTTAGTCTCA Freshwater and cycle of 10 min at 72 °CRueness 1994rbc L F8 GGTGAATTCCATACGCTA AAATGWang et al.,F481 GTAGAACGTGAGCGTATGGA2000; Wilkes etF765 TGAAAGAGCTGAATTYGCTAAal.,2005R1381 ATCTTTCCATAAATCTAAAGCF481n GTAGAACGTGAGCGIATGGA This studyNucleus EF2 L3Li2F CGY ACN CTB CTB ATG ATG GG Le Gall 2007R2R GGR CCR AAR CAC CAG ATC TT Le Gall 2007518F CGC ACC CTT CTC ATG ATG GG This study722R GGTCACTGGGGTTCTTCGGTTC This study1046R ATCACGAGGAGTGACCTTGC This studyone cycle of 1 min at 94 °C; five cycles of1 min at94 °C, 1.5 min at 45 °C and 1.5 min at 72 °C; 35cycles of 1 min at 94 °C, 1.5 min at 50 °C and 1 minat 72 °C and a final cycle of 5 min at 72 °Cone cycle of 3 min at 94 °C; 35 cycles of 1 min at94 °C, 1 min at 46 °C and 1.5 min at 72 °C and afinal cycle of 10 min at 72 °Cone cycle of 4 min at 94 °C , 38 cycles at 94 °C for4 min, 38 cycles of 1 min at 94 °C, 1 min at 50 °C, 2min at 72 °C, and a final cycle of 7 min at 72 °C.PCR success improved at an annealing of 55 °C
Evolution of the red seaweed Portieria in the tropical Indo-Pacific 107Table S4.3. Graphical representation of the concatenated alignment, showing the availability of sequence data forthe 51 Portieria species and outgroup. The colours of column and row headers indicate the amount of data availablefor that column or row. Green indicates high data availability, red indicates low data availability and yellow/orangerepresents intermediate data availability.EF1st.fas EF3rd.fas cox1.fas cox23.fas rbcL.fas rbcLsp.fasOch<strong>to</strong>des sp.(outgroup)Portieria sp. 02Portieria sp. 04Portieria sp. 09Portieria sp. 10Portieria sp. 11Portieria sp. 12Portieria sp. 13Portieria sp. 14Portieria sp. 15Portieria sp. 16Portieria sp. 17Portieria sp. 18Portieria sp. 19Portieria sp. 20Portieria sp. 22Portieria sp. 23Portieria sp. 24Portieria sp. 25Portieria sp. 28RDDMTQstrain: DML30919length: 459 ntRDDMTQstrain: DML30919length: 528 ntKZNSAFstrain: ODC1160length: 486 ntISPSAFstrain: KZN2310length: 495 ntKENYAstrain: ODC1592length: 486 ntKENYAstrain: ODC1590length: 490 ntRDDMTQstrain: DML30919length: 626 ntBERSRIstrain: HEC11802length: 584 ntBERINDstrain: BER16length: 628 ntZANTANstrain: HEC12085length: 627 ntARRAUSstrain: HEC12499length: 628 ntKEPAUSstrain: POR004length: 628 ntKZNSAFstrain: ODC1160length: 628 ntISPSAFstrain: KZN2310length: 628 ntKENYAstrain: ODC1609length: 628 ntKZNSAFstrain: KZN24length: 628 ntKENYAstrain: ODC1589length: 628 ntKENYAstrain: ODC1591length: 626 ntMOTPNGstrain: HEC10175length: 626 ntMALDVSstrain: HEC12561length: 628 ntRDDMTQstrain: DML30919length: 310 ntDAPBULstrain: DAP1501length: 281 ntBERSRIstrain: HEC11802length: 307 ntBERINDstrain: BER17length: 309 ntMADPNGstrain: HEC6584length: 309 ntZANTANstrain: HEC12085length: 311 ntBORTANstrain: HEC12155length: 300 ntLAIPNGstrain: HEC4280length: 307 ntARRAUSstrain: HEC12499length: 305 ntKEPAUSstrain: POR004length: 304 ntKZNSAFstrain: ODC1160length: 307 ntISPSAFstrain: KZN2310length: 308 ntDIAKENstrain: HEC8490length: 310 ntKZNSAFstrain: KZN24length: 307 ntKENYAstrain: ODC1589length: 306 ntZANTANstrain: HEC12055length: 307 ntKENYAstrain: ODC1665length: 307 ntBERSRIstrain: HEC16081length: 308 ntMOTPNGstrain: HEC10175length: 306 ntMALDVSstrain: HEC12561length: 307 ntBERSRIstrain: HEC11802length: 1029 ntBERINDstrain: BER17length: 1029 ntZANTANstrain: HEC12085length: 1029 ntBORTANstrain: HEC12155length: 1029 ntLAIPNGstrain: HEC4280length: 994 ntARRAUSstrain: HEC12499length: 1029 ntKZNSAFstrain: ODC1160length: 1029 ntISPSAFstrain: KZN2310length: 1029 ntSOCYEMstrain: SOC154length: 1029 ntKZNSAFstrain: KZNbPhorlength: 1029 ntKENYAstrain: ODC1596length: 1027 ntKENYAstrain: ODC1590length: 1026 ntBERSRIstrain: HEC16081length: 1026 ntMALDVSstrain: HEC12561length: 1029 ntRDDMTQstrain: DML30919length: 527 ntBERSRIstrain: HEC11802length: 524 ntBERINDstrain: BER17length: 538 ntMADPNGstrain: HEC6584length: 503 ntZANTANstrain: HEC12085length: 538 ntBORTANstrain: HEC12115length: 501 ntPIGPNGstrain: HEC13421Blength: 515 ntARRAUSstrain: HEC12499length: 522 ntKEPAUSstrain: POR004length: 538 ntKZNSAFstrain: ODC1160length: 529 ntPLMSAFstrain: KZN852length: 537 ntMASOMNstrain: MAS5050length: 538 ntKZNSAFstrain: KZN24length: 519 ntKENYAstrain: ODC1596length: 538 ntKENYAstrain: ODC1590length: 538 ntKENYAstrain: ODC1665length: 538 ntBERSRIstrain: HEC16081length: 532 ntMOTPNGstrain: HEC10175length: 533 ntMALDVSstrain: HV1829length: 542 nt
108 CHAPTER 4Table S4.3. Continued.Portieria sp. 29Portieria sp. 30Portieria sp. 37Portieria sp. 38Portieria sp. 42Portieria sp. 43Portieria sp. 44Portieria sp. 45Portieria sp. 46Portieria sp. 47Portieria sp. 48Portieria sp. B21Portieria sp. B33Portieria sp. B34Portieria sp. B35Portieria sp. B5Portieria sp. B8Portieria sp. S36Portieria sp. S39Portieria sp. S40Portieria sp. S6Portieria sp. S7Portieria sp. SP3PSGMAYstrain: DAP290length: 479 ntCORBASstrain: DAP1427length: 316 ntNORTAIstrain: TAI01Alength: 532 ntSOUTAIstrain: TAI02Blength: 521 ntPIEMHTstrain: DAP1449length: 485 ntCHABASstrain: DAP366length: 485 ntWBCMHTstrain: DAP337length: 482 ntCORBASstrain: DAP1421length: 288 ntWBCMHTstrain: DAP333length: 482 ntPIEBASstrain: DAP1418length: 234 ntDANBULstrain: DAP1490length: 479 ntDANBULstrain: DAP1473length: 263 ntDANBULstrain: DAP1484length: 444 ntDANBULstrain: DAP1477length: 294 ntWAIHAWstrain: HAW001length: 481 ntSOUTAIstrain: TAI04Blength: 480 ntNORTAIstrain: TAI01Alength: 588 ntSOUTAIstrain: TAI03Blength: 608 ntCHABASstrain: DAP369length: 549 ntCORBASstrain: DAP1430length: 535 ntWBCMHTstrain: DAP337length: 533 ntPIEBASstrain: DAP1400length: 559 ntWBCMHTstrain: DAP1436length: 550 ntWBCMHTstrain: DAP345length: 553 ntDANBULstrain: DAP1482length: 554 ntDANBULstrain: DAP1480length: 548 ntDAPBULstrain: DAP1493length: 553 ntDANBULstrain: DAP1484length: 553 ntDANBULstrain: DAP1485length: 526 ntSPRSCSstrain: SCS105length: 569 ntOAHHAWstrain: ODC906length: 628 ntTKWJPNstrain: POR001length: 523 ntPSGMAYstrain: DAP290length: 624 ntCORBASstrain: DAP1427length: 633 ntBINGUIstrain: G013length: 639 ntNORTAIstrain: TAI02Alength: 620 ntSOUTAIstrain: TAI03Blength: 633 ntCHABASstrain: DAP369length: 628 ntCHABASstrain: DAP366length: 626 ntWBCMHTstrain: DAP337length: 628 ntCHABASstrain: DAP371length: 628 ntWBCMHTstrain: DAP333length: 628 ntWBCMHTstrain: DAP336length: 618 ntDANBULstrain: DAP1490length: 628 ntDANBULstrain: DAP1480length: 624 ntDANBULstrain: DAP1473length: 624 ntDAPSORstrain: POR003length: 628 ntDANBULstrain: DAP1481length: 629 ntSPRSCSstrain: SCS105length: 614 ntOAHHAWstrain: ODC906length: 308 ntTKWJPNstrain: POR001length: 307 ntPSGMAYstrain: DAP297length: 306 ntCORBASstrain: DAP1427length: 256 ntSOUTAIstrain: TAI04Blength: 296 ntBINGUIstrain: GUI019length: 317 ntNORTAIstrain: TAI04Alength: 293 ntMANINDstrain: BUN003length: 307 ntSOUTAIstrain: TAI01Blength: 293 ntCHABASstrain: DAP364length: 307 ntCHABASstrain: DAP366length: 309 ntWBCMHTstrain: DAP337length: 306 ntCHABASstrain: DAP372length: 307 ntCHABASstrain: DAP373length: 308 ntWBCMHTstrain: DAP336length: 317 ntDANBULstrain: DAP1487length: 269 ntDANBULstrain: DAP1492length: 292 ntDAPBULstrain: DAP1493length: 289 ntPSGMAYstrain: MAY002length: 324 ntBULSORstrain: POR002length: 316 ntSPRSCSstrain: SCS105length: 307 ntOAHHAWstrain: ODC906length: 1029 ntTKWJPNstrain: POR001length: 952 ntCORBASstrain: DAP1427length: 797 ntNORTAIstrain: TAI01Alength: 1039 ntNCBIstrain: U04215length: 1020 ntNCBIstrain: AF212185length: 1029 ntCHABASstrain: DAP369length: 1029 ntCHABASstrain: DAP366length: 1029 ntWBCMHTstrain: DAP338length: 1029 ntWBCMHTstrain: DAP340length: 1029 ntWBCMHTstrain: DAP334length: 1029 ntWBCMHTstrain: DAP336length: 1029 ntDANBULstrain: DAP1490length: 858 ntDANBULstrain: DAP1473length: 746 ntDAPSORstrain: POR003length: 1029 ntBULSORstrain: POR002length: 1029 ntSPRSCSstrain: SCS105length: 1029 ntWAIHAWstrain: HAW001length: 538 ntTKWJPNstrain: POR001length: 533 ntPSGMAYstrain: DAP290length: 540 ntCORBASstrain: DAP1427length: 533 ntNORTAIstrain: TAI02Alength: 545 ntSOUTAIstrain: TAI03Blength: 541 ntCHABASstrain: DAP374length: 538 ntCHABASstrain: DAP366length: 539 ntWBCMHTstrain: DAP337length: 538 ntWBCMHTstrain: DAP341length: 538 ntWBCMHTstrain: DAP334length: 538 ntCHASABstrain: DAP1461length: 539 ntDANBULstrain: DAP1487length: 531 ntDANBULstrain: DAP1480length: 541 ntDANBULstrain: DAP1473length: 540 ntDAPBULstrain: DAP1511length: 539 ntDANBULstrain: DAP1485length: 539 ntSPRSCSstrain: SCS105length: 538 nt
Evolution of the red seaweed Portieria in the tropical Indo-Pacific 109Table S4.3. Continued.Portieria sp. V1APortieria sp. V1BPortieria sp. V1CPortieria sp. V1DPortieria sp. V1EPortieria sp. V26Portieria sp. V27Portieria sp. V31Portieria sp. V32MALSTNstrain: DAP058length: 479 ntAIRDGTstrain: DAP250length: 471 ntDAAALCstrain: DAP168length: 467 ntTOLISBstrain: DAP156length: 528 ntMALSTNstrain: DAP054length: 482 ntAPODAUstrain: DAP188length: 481 ntPSGMAYstrain: DAP283length: 496 ntSAWSJNstrain: DAP204length: 447 ntDAPSIQstrain: DAP213length: 543 ntAIRDGTstrain: DAP250length: 532 ntDAAALCstrain: DAP168length: 536 ntMALPHIstrain: HV584length: 480 ntTOLISBstrain: DAP156length: 527 ntMALSTNstrain: DAP052length: 530 ntAPODAUstrain: DAP188length: 527 ntPSGMAYstrain: DAP288length: 531 ntSAWSJNstrain: DAP204length: 523 ntMALSTNstrain: DAP054length: 627 ntAPODAUstrain: DAP191length: 616 ntPSGMAYstrain: DAP283length: 628 ntSAWSJNstrain: DAP204length: 628 ntDAPSIQstrain: DAP103length: 304 ntBANDGTstrain: DAP087length: 304 ntDAAALCstrain: DAP185length: 304 ntMALPHIstrain: HV584length: 304 ntPALLEYstrain: PAL001length: 311 ntMALSTNstrain: DAP054length: 307 ntAPODAUstrain: DAP191length: 306 ntPSGMAYstrain: MAY008length: 325 ntBINGUIstrain: GUI018length: 320 ntDAPSIQstrain: DAP213length: 1029 ntAIRDGTstrain: DAP250length: 1029 ntDAAALCstrain: DAP168length: 1029 ntMALPHIstrain: HV584length: 1029 ntTOLISBstrain: DAP156length: 1029 ntDAAALCstrain: DAP184length: 1029 ntAPODAUstrain: DAP191length: 1029 ntPSGMAYstrain: DAP288length: 1029 ntSAWSJNstrain: DAP202length: 1029 ntDAPSIQstrain: DAP103length: 537 ntBANDGTstrain: DAP087length: 537 ntDAAALCstrain: DAP185length: 537 ntMALPHIstrain: HV584length: 532 ntTOLISBstrain: DAP154length: 537 ntMALSTNstrain: DAP052length: 537 ntPALSJNstrain: DAP468length: 537 ntPSGMAYstrain: DAP286length: 521 ntSAWSJNstrain: DAP480length: 540 ntTable S4.4. List of calibration points used <strong>to</strong> date the red algal phylogenetic tree. The nodes <strong>to</strong> which the ageconstraints are applied (first column) are indicated on the tree in Fig. S2.Node Name Fossil Period Age (Ma) Referencesa Rhodophyta crown interpretation of early eukaryotic diversification max 1400 (Porter, 2004, Knoll et al. , 2006)b Bangiophyceae s.l. crown Bangiomorpha pu<strong>be</strong>scens Mesoproterozoic min 1174 (Butterfield, 2000)c Bangiales stem Palaeoconchocelis starmachii Upper Silurian min 419 (Camp<strong>be</strong>ll, 1980)d Nemaliales stem Gymnocodium Asselian min 294.6 (Mamet & Zhu, 2005)e Corallinophycidae stem Arenigiphyllum & Halysis Arenig min 471.8 (Riding et al. , 1998, Riding & Braga, 2005)f Sporolithaceae stem Archaeolithothamnion rude Hauterivian min 130 (Arias et al. , 1995)g Corallinaceae stem various taxa Upper Jurassic min 145.5 (Aguirre et al. , 2000)h Peyssonneliaceae stem no name given Hauterivian min 130 (Aguirre et al. , 2000)
110 CHAPTER 4
Evolution of the red seaweed Portieria in the tropical Indo-Pacific 1114.9 ReferencesAguirre, J., Riding, R. & Braga, J. C. 2000. Diversity of coralline red algae: origination and extinctionpatterns from the Early Cretaceous <strong>to</strong> the Pleis<strong>to</strong>cene. Paleobiology 26:651-67.Alfaro, M. E., Santini, F. & Brock, C. D. 2007. Do reefs drive diversification in marine teleosts?Evidence from the pufferfish and their allies (order Tetraodontiformes). Evolution 61:2104-26.Arias, C., Masse, J. P. & Vilas, L. 1995. Hauterivian shallow marine calcareous biogenic mounds: SESpain. Palaeogeogr. Palaeoclima<strong>to</strong>l. Palaeoecol. 119:3-17.Bar<strong>be</strong>r, P. H. 2009. The challenge of understanding the Coral Triangle biodiversity hotspot. J. Biogeogr.36:1845-46.Bar<strong>be</strong>r, P. H. & Bellwood, D. R. 2005. Biodiversity hotspots: evolutionary origins of biodiversity inwrasses (Halichoeres: Labridae) in the Indo-Pacific and new world tropics. Mol. Phylogenet.Evol. 35:235-53.Bar<strong>be</strong>r, P. H., Erdmann, M. V. & Palumbi, S. R. 2006. Comparative phylogeography of threecodistributed s<strong>to</strong>ma<strong>to</strong>pods: Origins and timing of regional lineage diversification in thecoral triangle. Evolution 60:1825-39.Bellwood, D. R., Herwerden, L. v. & Konow, N. 2004. Evolution and biogeography of marineangelfishes (Pisces: Pomacanthidae). Mol. Phylogenet. Evol. 33:140-55.Bellwood, D. R. & Hughes, T. P. 2001. Regional-scale assembly rules and biodiversity of coral reefs.Science 292:1532-35.Bellwood, D. R. & Meyer, C. P. 2009a. Endemism and evolution in the Coral Triangle: a call forclarity. J. Biogeogr. 36:2011-12.Bellwood, D. R. & Meyer, C. P. 2009b. Searching for heat in a marine biodiversity hotspot. J. Biogeogr.36:569-76.Bickford, D., Lohman, D. J., Sodhi, N. S., Ng, P. K. L., Meier, R., Winker, K., Ingram, K. K. & Das, I.2007. Cryptic species as a window on diversity and conservation. Trends Ecol. Evol. 22:148-55.Briggs, J. C. 1999. Coincident biogeographic patterns: Indo-West Pacific Ocean. Evolution 53:326-35.Briggs, J. C. 2000. Centrifugal speciation and centers of origin. J. Biogeogr. 27:1183-88.Briggs, J. C. 2009. Diversity, endemism and evolution in the Coral Triangle. J. Biogeogr. 36:2009-10.Butterfield, N. J. 2000. Bangiomorpha pu<strong>be</strong>scens n. gen., n. sp.: Implications for the evolution of sex,multicellularity, and the Mesoproterozoic/Neoproterozoic radiation of eukaryotes.Paleobiology 26:386-404.Camp<strong>be</strong>ll, S. E. 1980. Palaeoconchocelis starmachii, a carbonate boring microfossil from the UpperSilurian of Poland (425 million years old): implications for the evolution of the Bangiaceae(Rhodophyta). Phycologia 19:25-36.Carpenter, K. E., Abrar, M., Aeby, G., Aronson, R. B., Banks, S., Bruckner, A., Chiriboga, A., Cortes,J., Del<strong>be</strong>ek, J. C., DeVantier, L., Edgar, G. J., Edwards, A. J., Fenner, D., Guzman, H. M.,Hoeksema, B. W., Hodgson, G., Johan, O., Licuanan, W. Y., Livings<strong>to</strong>ne, S. R., Lovell, E.R., Moore, J. A., Obura, D. O., Ochavillo, D., Polidoro, B. A., Precht, W. F., Quibilan, M.C., Rebo<strong>to</strong>n, C., Richards, Z. T., Rogers, A. D., Sanciangco, J., Sheppard, A., Sheppard, C.,Smith, J., Stuart, S., Turak, E., Veron, J. E. N., Wallace, C., Weil, E. & Wood, E. 2008. Onethirdof reef-building corals face elevated extinction risk from climate change and localimpacts. Science 321:560-63.Carpenter, K. E. & Springer, V. G. 2005. The center of the center of marine shore fish biodiversity:the Philippine Islands. Environ. Biol. Fishes 72:467-80.Connolly, S. R., Bellwood, D. R. & Hughes, T. P. 2003. Indo-Pacific biodiversity of coral reefs:Deviations from a mid-domain model. Ecology 84:2178-90.Cowie, R. H. & Holland, B. S. 2008. Molecular biogeography and diversification of the endemicterrestrial fauna of the Hawaiian Islands. Philos. Trans. R. Soc. Lond. B Biol. Sci. 363:3363-76.
112 CHAPTER 4Dawson, M. N. & Hamner, W. M. 2005. Rapid evolutionary radiation of marine zooplank<strong>to</strong>n inperipheral environments. Proc. Natl. Acad. Sci. U.S.A. 102:9235-40.Des<strong>to</strong>m<strong>be</strong>, C., Godin, J., Lefebvre, C., Dehorter, O. & Vernet, P. 1992. Differences in dispersalabilities of haploid and diploid spores of Gracilaria verrucosa (Gracilariales, Rhodophyta). Bot.Mar. 35:93-98.Drew, J., Allen, G. R., Kaufman, L. & Bar<strong>be</strong>r, P. H. 2008. Endemism and regional color and geneticdifferences in five putatively cosmopolitan reef fishes. Conserv. Biol. 22:965-75.Drummond, A. J. & Rambaut, A. 2007. BEAST: Bayesian evolutionary analysis by sampling trees.BMC Evol. Biol. 7:214.Eble, J. A., Toonen, R. J. & Bowen, B. W. 2009. Endemism and dispersal: comparativephylogeography of three surgeonfishes across the Hawaiian Archipelago. Mar. Biol. 156:689-98.Ekman, S. 1953. Zoogeography of the sea. Sidgwick and Jackson, London. XIV, 417 pp.Gas<strong>to</strong>n, K. J. 2000. Global patterns in biodiversity. Nature 405:220-27.Guindon, S. & Gascuel, O. 2003. A simple, fast, and accurate algorithm <strong>to</strong> estimate large phylogeniesby maximum likelihood. Syst. Biol. 52:696-704.Guiry, M. D. & Guiry, G. M. 2010. AlgaeBase. World-wide electronic publication, National Universityof Ireland, Galway. http://www.algaebase.org; searched on 10 Decem<strong>be</strong>r 2010.Halas, D. & Winterbot<strong>to</strong>m, R. 2009. A phylogenetic test of multiple proposals for the origins of theEast Indies coral reef biota. J. Biogeogr. 36:1847-60.Hall, R. 1998. The plate tec<strong>to</strong>nics of Cenozoic SE Asia and the distribution of land and sea. In: Hall,R. & Holloway, J. D. [Eds.] Biogeography and geological evolution of SE Asia. BackhuysPublishers, Leiden, pp. 99-131.Hall, R. 2002. Cenozoic geological and plate tec<strong>to</strong>nic evolution of SE Asia and the SW Pacific:computer-based reconstructions, model and animations. J. Asian Earth Sci. 20:353-431.Harmon, L. J., Weir, J. T., Brock, C. D., Glor, R. E. & Challenger, W. 2008. GEIGER: investigatingevolutionary radiations. Bioinformatics 24:129-31.Hoeksema, B. 2007. Delineation of the Indo-Malayan center of maximum marine biodiversity: TheCoral Triangle. In: Renema, W. [Ed.] Biogeography, Time, and Place: Distributions,Barriers, and Islands. Springer Netherlands, pp. 117-78.Jokiel, P. & Martinelli, F. J. 1992. The vortex model of coral reef biogeography. J. Biogeogr. 19:449-58.Kerswell, A. P. 2006. Global biodiversity patterns of <strong>be</strong>nthic marine algae. Ecology 87:2479-88.Kinlan, B. P. & Gaines, S. D. 2003. Propagule dispersal in marine and terrestrial environments: Acommunity perspective. Ecology 84:2007-20.Kirkendale, L. A. & Meyer, C. P. 2004. Phylogeography of the Patelloida profunda group (Gastropoda :Lottidae): diversification in a dispersal-driven marine system. Mol. Ecol. 13:2749-62.Knoll, A. H., Javaux, E. J., Hewitt, D. & Cohen, P. 2006. Eukaryotic organisms in Proterozoic oceans.Philos. Trans. R. Soc. Lond. B Biol. Sci. 361:1023-38.Knowl<strong>to</strong>n, N. 1993. Sibling species in the sea. Annu. Rev. Ecol. Syst. 24:189-216.Kooistra, W., Sarno, D., Balzano, S., Gu, H. F., Andersen, R. A. & Zingonea, A. 2008. Globaldiversity and biogeography of Skele<strong>to</strong>nema species (Bacillariophyta). Protist 159:177-93.Ladd, H. S. 1960. Origin of the Pacific Island molluscan fauna. Am. J. Sci. 258A:137-50.Le Gall, L. & Saunders, G. W. 2010. DNA barcoding is a powerful <strong>to</strong>ol <strong>to</strong> uncover algal diversity: acase study of the Phyllophoraceae (Gigartinales, Rhodophyta) in the Canadian flora. J.Phycol. 46:374-89.Leliaert, F., Verbruggen, H., Wysor, B. & De Clerck, O. 2009. DNA taxonomy in morphologicallyplastic taxa: Algorithmic species delimitation in the Boodlea complex (Chlorophyta:Cladophorales). Mol. Phylogenet. Evol. 53:122-33.Lüning, K. 1990. Seaweeds: their environment, biogeography and ecophysiology. Wiley-Interscience, New York,Mamet, B. & Zhu, Z. 2005. Carboniferous and Permian algal microflora, Tarim Basin (China). Geol.Belg. 8:3-13.
Evolution of the red seaweed Portieria in the tropical Indo-Pacific 113Malay, M. C. D. & Paulay, G. 2009. Peripatric speciation drives diversification and distributionalpattern of reef Hermit Crabs (Decapoda: Diogenidae: Calcinus). Evolution 64:634-62.Meyer, C. P., Geller, J. B. & Paulay, G. 2005. Fine scale endemism on coral reefs: Archipelagicdifferentiation in turbinid gastropods. Evolution 59:113-25.Monaghan, M. T., Wild, R., Elliot, M., Fujisawa, T., Balke, M., Inward, D. J., Lees, D. C., Ranaivosolo,R., Eggle<strong>to</strong>n, P., Barraclough, T. G. & Vogler, A. P. 2009. Accelerated Species Inven<strong>to</strong>ry onMadagascar Using Coalescent-Based Models of Species Delineation. Syst. Biol. 58:298-311.Mora, C., Chittaro, P. M., Sale, P. F., Kritzer, J. P. & Ludsin, S. A. 2003. Patterns and processes in reeffish diversity. Nature 421:933-36.Palumbi, S. R. 1994. Genetic divergence, reproductive isolation and marine speciation. Annu. Rev. Ecol.Syst. 25:547-72.Paradis, E., Claude, J. & Strimmer, K. 2004. APE: analyses of phylogenetics and evolution in Rlanguage. Bioinformatics 20:289-90.Paulay, G. & Meyer, C. 2002. Diversification in the tropical pacific: Comparisons <strong>be</strong>tween marine andterrestrial systems and the importance of founder speciation. Integr. Comp. Biol. 42:922-34.Pons, J., Barraclough, T. G., Gomez-Zurita, J., Cardoso, A., Duran, D. P., Hazell, S., Kamoun, S.,Sumlin, W. D. & Vogler, A. P. 2006. Sequence-based species delimitation for the DNAtaxonomy of undescri<strong>be</strong>d insects. Syst. Biol. 55:595-609.Porter, S. M. 2004. The fossil record of early eukaryotic diversification. In: Lipps, J. H. & Waggoner,B. [Eds.] The Paleon<strong>to</strong>logical Society Papers 10: Neoproterozoic-Cambrian BiologicalRevolutions. Paleon<strong>to</strong>logical Society, New Haven, pp. 35-50.R_Development_Core_Team 2009. R: A Language and Environment for Statistical ComputingRambaut, A. & Drummond, A. 2007a. Tracer v1.4. Available from http://<strong>be</strong>ast.bio.ed.ac.uk/Tracer1.4 ed.Rambaut, A. & Drummond, A. J. 2007b. Tracer. 1.4 ed.Renema, W., Bellwood, D. R., Braga, J. C., Bromfield, K., Hall, R., Johnson, K. G., Lunt, P., Meyer, C.P., McMonagle, L. B., Morley, R. J., O'Dea, A., Todd, J. A., Wesselingh, F. P., Wilson, M. E.J. & Pandolfi, J. M. 2008. Hopping hotspots: Global shifts in marine Biodiversity. Science321:654-57.Riding, R. & Braga, J. C. 2005. Halysis Hoeg, 1932 - An Ordovician coralline red alga? J. Paleon<strong>to</strong>l.79:835-41.Riding, R., Cope, J. C. W. & Taylor, P. D. 1998. A coralline-like red alga from the lower Ordovician ofWales. Paleon<strong>to</strong>logy 41:1069-76.Ronquist, F. & Huelsen<strong>be</strong>ck, J. P. 2003. MrBayes 3: Bayesian phylogenetic inference under mixedmodels. Bioinformatics 19:1572-74.Rosen, B. R. & Smith, A. B. 1988. Tec<strong>to</strong>nics from fossils? Analysis of reef coral and sea urchindistributions from late Cretaceous <strong>to</strong> Recent, using a new method. In: Audley-Charles, M.G. & Hallam, A. [Eds.] Gondwana and Tethys. Oxford University Press, Oxford, pp. 275-306.Sanderson, M. J. 2002. Estimating absolute rates of molecular evolution and divergence times: apenalized likelihood approach. Mol. Biol. Evol. 19:101-09.Santini, F. & Winterbot<strong>to</strong>m, R. 2002. His<strong>to</strong>rical biogeography of Indo-western Pacific coral reef biota:is the Indonesian region a center of origin? J. Biogeogr. 29:189-205.Sarnat, E. M. & Moreau, C. S. 2011. Biogeography and morphological evolution in a Pacific island antradiation. Mol. Ecol. 20:114-30.Saunders, G. W. 2005. Applying DNA barcoding <strong>to</strong> red macroalgae: a preliminary appraisal holdspromise for future applications. Philos. Trans. R. Soc. Lond. B Biol. Sci. 360:1879-88.Saunders, G. W. 2008. A DNA barcode examination of the red algal family Dumontiaceae inCanadian waters reveals substantial cryptic species diversity. 1. The foliose Dilsea-Neodilseacomplex and Weeksia. Botany-Botanique 86:773-89.Shanks, A. L., Grantham, B. A. & Carr, M. H. 2003. Propagule dispersal distance and the size andspacing of marine reserves. Ecol. Appl. 13:S159-S69.
114 CHAPTER 4So<strong>be</strong>l, J. M., Chen, G. F., Watt, L. R. & Schemske, D. W. 2010. The biology of speciation. Evolution64:295-315.Stamatakis, A., Hoover, P. & Rougemont, J. 2008. A rapid bootstrap algorithm for the RAxML webservers. Syst. Biol. 57:758-71.Tittensor, D. P., Mora, C., Jetz, W., Lotze, H. K., Ricard, D., Berghe, E. V. & Worm, B. 2010. Globalpatterns and predic<strong>to</strong>rs of marine biodiversity across taxa. Nature 466:1098-101.Tronholm, A., Sanson, M., Afonso-Carrillo, J., Verbruggen, H. & de Clerck, O. 2010. Nichepartitioning and the coexistence of two cryptic Dictyota (Dictyotales, Phaeophyceae) speciesfrom the Canary Islands. J. Phycol. 46:1075-87.Verbruggen, H., De Clerck, O., Schils, T., Kooistra, W. & Coppejans, E. 2005. Evolution andphylogeography of Halimeda section Halimeda (Bryopsidales, Chlorophyta). Mol. Phylogenet.Evol. 37:789-803.Verbruggen, H., Leliaert, F., Maggs, C. A., Shimada, S., Schils, T., Provan, J., Booth, D., Murphy, S.,De Clerck, O., Littler, D. S., Littler, M. M. & Coppejans, E. 2007. Species boundaries andphylogenetic relationships within the green algal genus Codium (Bryopsidales) based onplastid DNA sequences. Mol. Phylogenet. Evol. 44:240-54.Verbruggen, H., Maggs, C., Saunders, G., Le Gall, L., Yoon, H. & De Clerck, O. 2010. Data miningapproach identifies research priorities and data requirements for resolving the red algal treeof life. BMC Evol. Biol. 10:16.Verbruggen, H., Vlaeminck, C., Sauvage, T., Sherwood, A. R., Leliaert, F. & De Clerck, O. 2009.Phylogenetic analysis of Pseudochlorodesmis strains reveals cryptic diversity above the familylevel in the siphonous green algae (Bryopsidales, Chlorophyta). J. Phycol. 45:726-31.Williams, S. T. 2007. Origins and diversification of Indo-West Pacific marine fauna: evolutionaryhis<strong>to</strong>ry and biogeography of turban shells (Gastropoda, Turbinidae). Biol. J. Linn. Soc.92:573-92.Williams, S. T. & Duda, T. F. 2008. Did tec<strong>to</strong>nic activity stimulate Oligo-Miocene speciation in theIndo-West Pacific? Evolution 62:1618-34.Williams, S. T. & Reid, D. G. 2004. Speciation and diversity on tropical rocky shores: A globalphylogeny of snails of the genus Echinolit<strong>to</strong>rina. Evolution 58:2227-51.Wilson, M. E. J. & Rosen, B. R. 1998. Implications of paucity of corals in the Paleogene of SE Asia:plate tec<strong>to</strong>nics or center of origin? In: Hall, R. & Holloway, J. D. [Eds.] Biogeography andgeological evolution of SE Asia. Backhuys Publishers, Leiden, pp. 165-95.Wiseman, D. R. 1975. On the status of the red algal family, the Rhizophyllidaceae (Gigartinales).Taxon 24:489-90.Woodland, D. J. 1983. Zoogeography of the Siganidae (Pisces): An interpretation of distribution andrichness patterns. Bull. Mar. Sci. 33:713-17.Worheide, G., Epp, L. & Macis, L. 2008. Deep genetic divergences among Indo-Pacific populationsof the coral reef sponge Leucetta chagosensis (Leucettidae): Founder effects, vicariance, orboth? BMC Evol. Biol. 8:24.Xavier, J. R., Rachello-Dolmen, P. G., Parra-Velandia, F., Schön<strong>be</strong>rg, C. H. L., Breeuwer, J. A. J. &van Soest, R. W. M. 2010. Molecular evidence of cryptic speciation in the "cosmopolitan"excavating sponge Cliona celata (Porifera, Clionaidae). Mol. Phylogenet. Evol. 56:13-20.Zuccarello, G. C. & West, J. A. 2002. Phylogeography of the Bostrychia calliptera-B-pinnata complex(Rhodomelaceae, Rhodophyta) and divergence rates based on nuclear, mi<strong>to</strong>chondrial andplastid DNA markers. Phycologia 41:49-60.Zuccarello, G. C. & West, J. A. 2003. Multiple cryptic species: Molecular diversity and reproductiveisolation in the Bostrychia radicans/B. moritziana complex (Rhodomelaceae, Rhodophyta) withfocus on North American isolates. J. Phycol. 39:948-59.
5 MORPHOMETRIC CHARACTERIZATION OFTHE PORTIERIA-COMPLEX IN THEPHILIPPINES 1AbstractMolecular systematic studies have recently shown that the red alga Portieria hornemanniiconsists of multiple species, which, at first sight, fall within a morphological continuum.These findings raise the question whether the diversification of this species complexcoincided with morphological differentiation. We applied different morphometrictechniques, including discriminant function analyses of fractal parameters, non-conventionaland conventional measurements of branch apices, <strong>to</strong> detect patterns of morphologicaldifferentiation <strong>be</strong>tween species. Results show that conventional measurements outperformthose of fractal and non-conventional variables in the discrimination of lineages. Acombination of these variable types resulted in the <strong>be</strong>st discrimina<strong>to</strong>ry power. Fractalanalyses resulted in low <strong>to</strong> moderate classification success (21-71%) of branch apices in<strong>to</strong>the correct lineage grouping. Classification success was higher for conventionalmeasurements (70-100%). When combined, fractal variables and conventionalmeasurements resulted in high <strong>to</strong> very high classification success (83-100 %). These resultsindicate that although it may not <strong>be</strong> possible <strong>to</strong> assign each individual specimen <strong>to</strong> thecorrect lineage, the different lineages are, at least <strong>to</strong> some degree, morphologicallydifferentiated.Keywords: Portieria; Rhizophyllidaceae; Phylogeny; Morphometrics, Fractal dimension,FracLac, Discriminant Analysis1 Unpublished manuscript: Payo D.A., Colo J., Leliaert F., Calumpong H. & De Clerck O. Morphometriccharacterization of the Portieria-complex (Gigartinales: Rhizophyllidaceae) in the Philippines.115
116 CHAPTER 55.1 IntroductionTraditional descriptions of macroalgal species usually include acharacterization of the overall thallus morphology combined with details ofana<strong>to</strong>mical structures and measurements of specific structures. This approach,however, largely fails <strong>to</strong> detect subtle differences that may exist <strong>be</strong>tween specieswith highly similar morphologies (i.e., cryptic or pseudocryptic species).Morphometric analysis, the mathematical investigation of shape, allows a moredetailed and statistically sound evaluation of possible morphological differentiation<strong>be</strong>tween (pseudo)cryptic species (Verbruggen et al., 2005a). Conventionalmorphometric techniques include measurements of morphological and ana<strong>to</strong>micalstructures, which can <strong>be</strong> analyzed using multivariate statistical <strong>to</strong>ols <strong>to</strong> detectpatterns of morphological differentiation <strong>be</strong>tween species. Such an approachnowadays relies heavily on molecular data, whereby species are first delineated usinggene sequence data and subsequently the morphology is studied in an attempt <strong>to</strong>discover diagnostic characters. Morphometric techniques are increasingly used inmacroalgal studies <strong>to</strong> test congruence <strong>be</strong>tween morphological and phylogeneticspecies concepts (Sherwood and Sheath, 1999, 2000; Kraan et al., 2001; Hubbardand Garbary, 2002; Sherwood and Sheath, 2003; Yano et al., 2004; Verbruggen etal., 2005b; Yano et al., 2006; Leliaert et al., 2007; Tronholm et al., 2010), <strong>to</strong> descri<strong>be</strong>seasonal morphological changes (Montañes et al., 2006), and <strong>to</strong> demonstratemorphological plasticity (Altamirano-Cerecedo and Riosmena-Rodríguez, 2007). Insome cases traditional measurements have <strong>be</strong>en complemented by shape and sizedescrip<strong>to</strong>rs such as landmark analysis (Verbruggen et al., 2005a). The lattertechniques may provide indications of morphological variation and differentiationthat went unnoticed by conventional measurements.Species boundaries and diversity in the red alga Portieria have <strong>be</strong>en difficult<strong>to</strong> assess based on conventional morphological criteria. Several species have <strong>be</strong>endistinguished, often based on vague and inconsistent morphological bases. Acomprehensive study on the morphology and diversity of Portieria let Wiseman(1975) <strong>to</strong> conclude that there was only one, morphologically variable species, P.hornemannii. DNA sequence data analysis has recently shown that P. hornemannii infact consists of multiple species that are morphologically highly similar (Chapter 3and 4). In this study we applied fractal analyses <strong>to</strong> characterize the morphology ofthe various species. Portieria is a modular organism (i.e. an organism built ofrepeated units, see Kaandorp and Kübler, 2001), with a complex branching pattern.The thallus consists of a basal holdfast that gives rise <strong>to</strong> several compressed axesbranching alternately up <strong>to</strong> four <strong>to</strong> five orders (Fig. 5.1). Fractals refer <strong>to</strong> self-similar
Morphometric characterization of the Portieria-complex in the Philippines 117patterns with non-linear scaling rules (Mandelbrot, 1975; Karperien, 1999-2007).The branching pattern of Portieria exhibits a certain degree of self- similarity whichlends itself well <strong>to</strong> <strong>be</strong>ing characterized using fractal dimensions (Alados et al., 1999).Fractal dimensions are used <strong>to</strong> quantify complexity in physical forms or nonphysicalpatterns (temporal or spatial) expressed as a scaling rule based on thenum<strong>be</strong>r of new self-similar parts produced from the scale applied (Karperien, 1999-2007). Compared <strong>to</strong> landmark analyses, fractal analyses are less troubled by therequirements of unambiguously defined homologous points. Fractal dimension has<strong>be</strong>en successfully utilized in characterizing biological forms. For example, fractaldimensions have <strong>be</strong>en successfully applied <strong>to</strong> distinguish coral species (Martin-Garin et al., 2007), <strong>to</strong> show plasticity of sponges in response <strong>to</strong> water movement(Abraham, 2001), <strong>to</strong> demonstrate increasing shape complexity during macroalgaldevelopment (Corbit and Garbary, 1995), and <strong>to</strong> show temperature dependentmorphological plasticity in the red seaweed Chondrus (Kubler and Dudgeon, 1996).Fractal analyses have also <strong>be</strong>en applied in a variety of other disciplines includingmedical research (Karperien et al., 2005; Goutzanis et al., 2008). Apart from themacroalgal studies mentioned, the technique has not yet <strong>be</strong>en explored inphycology.We use both conventional and fractal parameters in an attempt <strong>to</strong>characterize species within the Portieria-complex. Gross morphological observationstend <strong>to</strong> support the notion of a morphological continuum of forms that are difficult<strong>to</strong> separate Wiseman (1975). This makes fractal analysis an attractive <strong>to</strong>ol forunderstanding the patterns of form variation contained within this diversity. Weaim <strong>to</strong> 1.) detect morphological differences <strong>be</strong>tween Portieria species on the basis ofconventional and fractal parameters, and 2) evaluate the taxonomic value ofconventional and fractal parameters in detecting and delineating morphotypes thatcorrespond <strong>to</strong> particular phylogenetic lineages.5.2 Materials and methods5.2.1 Specimen sampling, image preparation and acquisitionPortieria samples were collected from intertidal <strong>to</strong> shallow subtidal sites inthe Philippines. The specimens used were collected from five sites (Basco,Chanaryan, Coral, Mahatao, Chavayan) in the northern islands of Batanes and sixsites (Dapdap, Siquijor; Sawang, San Juan, Siquijor; Pagubagubaan, San Juan,Siquijor; Malo, Sia<strong>to</strong>n; Bantayan, Dumaguete; Liloan, Santander) in the central
118 CHAPTER 5islands of the Visayas, Philippines. See Table 5.1 for a complete listing of thesamples.Table 5.1. List of Portieria specimens used in fractal (FA) and conventional morphometric (CM) analyses. DNAsequences of the cox2-3 gene were also were also obtained from the samples. The symbol (*) indicates presence ofdata or availability of a sequence.Specimen Clade SiteFA CM DNADAP058 V1 Malo,Sia<strong>to</strong>n, Philippines * *DAP070 V1 Malo,Sia<strong>to</strong>n, Philippines * *DAP103 V1 Dapdap, Siquijor, Siquijor, Philippines * * *DAP104 V1 Dapdap, Siquijor, Siquijor, Philippines * * *DAP146 V1 Tolingon, Isa<strong>be</strong>l, Leyte, Philippines *DAP154 V1 Tolingon, Isa<strong>be</strong>l, Leyte, Philippines * *DAP167 V1 Daang Lungsod, Alcoy, Cebu, Philippines * *DAP171 V1 Daang Lungsod, Alcoy, Cebu, Philippines * *DAP202 V32 Saw ang, Tambisan, San Juan, Siquijor, Philippines * * *DAP204 V32 Saw ang, Tambisan, San Juan, Siquijor, Philippines * * *DAP480 V32 Saw ang, Tambisan, San Juan, Siquijor, Philippines * *DAP210 V1 Dapdap, Siquijor, Siquijor, Philippines * * *DAP212 V1 Dapdap, Siquijor, Siquijor, Philippines * *DAP213 V1 Dapdap, Siquijor, Siquijor, Philippines * * *DAP214 V1 Dapdap, Siquijor, Siquijor, Philippines * * *DAP247 V1 Bantayan, Dumaguete, Philippines * * *DAP248 V1 Bantayan, Dumaguete, Philippines * * *DAP249 V1 Bantayan, Dumaguete City, Philippines * *DAP250 V1 Bantayan, Dumaguete, Philippines * * *DAP251 V1 Bantayan, Dumaguete, Philippines * *F001 V1 Bantayan, Dumaguete City, Philippines *F002 V1 Bantayan, Dumaguete City, Philippines * *F003 V1 Bantayan, Dumaguete City, Philippines *F006 V1 Bantayan, Dumaguete City, Philippines * *
Morphometric characterization of the Portieria-complex in the Philippines 119Table 5.1. (Continued.)Specimen Clade SiteFA CM DNADAP283 V31 Pasig reef, Maydolong, Eastern, Samar, Philippines *DAP286 V31 Pasig reef, Maydolong, Eastern, Samar, Philippines * *DAP288 V31 Pasig reef, Maydolong, Eastern, Samar, Philippines * *DAP294 V31 Pasig reef, Maydolong, Eastern, Samar * *DAP295 V31 Pasig reef, Maydolong, Eastern, Samar * *DAP296 V31 Pasig reef, Maydolong, Eastern, Samar * *DAP334 B5 White Beach, Mahatao, Batanes, Philippines * *DAP339 B21 White Beach, Mahatao, Batanes, Philippines * * *DAP340 B35 White Beach, Mahatao, Batanes, Philippines * *DAP344 B5 White Beach, Mahatao, Batanes, Philippines * * *DAP346 B5 White Beach, Mahatao, Batanes, Philippines * * *DAP347 B35 White Beach, Mahatao, Batanes, Philippines * *DAP352 B5 Chanaryan, Basco, Batanes, Philippines * * *DAP364 21 Chanaryan, Basco, Batanes, Philippines * * *DAP367 21 Chanaryan, Basco, Batanes, Philippines * * *DAP369 21 Chanaryan, Basco, Batanes, Philippines * * *DAP371 B35 Chanaryan, Basco, Batanes, Philippines * *DAP373 B5 Chanaryan, Basco, Batanes, Philippines * * *DAP438 V1 Dapdap, Siquijor, Siquijor, Philippines * *DAP441 V1 Dapdap, Siquijor, Siquijor, Philippines * *DAP442 V1 Dapdap, Siquijor, Siquijor, Philippines *DAP443 V1 Dapdap, Siquijor, Siquijor, Philippines *DAP449 V1 Dapdap, Siquijor, Siquijor, Philippines *DAP450 V1 Dapdap, Siquijor, Siquijor, Philippines * *HV646 V32 SE of Olango Island, Cebu, Philippines * * +Specimens were preserved in a 5% formalin-seawater solution and thallusclippings were preserved in silica gel for molecular characterization. Undamagedbranch tips were carefully selected for image acquisition. Thallus tips(approximately 10 mm) were cut and carefully mounted on a microscope slide suchthat the inrolled side of the tip <strong>to</strong>uched the cover slip (Fig. 5.1). Three <strong>to</strong> eightbranch tips were used as replicates for every individual sample. The prepared tipswere pho<strong>to</strong>graphed under 8x magnification using Wild stereomicroscpe equippedwith Olympus DP50 digital camera. To verify the life-his<strong>to</strong>ry stage, specimens wereexamined under the microscope for reproductive structures.
120 CHAPTER 5Fig. 5.1. Collection of conventional parameter measurements. (a) General branching pattern of Portieria. (b) A 10-mm branch tip with the gray area marking the measurement spot. (c) Num<strong>be</strong>rs assigned <strong>to</strong> branchlets. (d) Lengthand width measurements collected. (e) Location of angles measured. Num<strong>be</strong>rs on (d) and (e) are further defined inTable 5.3.
Morphometric characterization of the Portieria-complex in the Philippines 1215.2.2 DNA-based species assignmentSamples used in the morphometric analyses were assigned <strong>to</strong> the speciesdefined in Chapter 3 based on analysis of cox2-3 sequences. DNA extraction, PCRamplification and sequencing were performed as descri<strong>be</strong>d in Chapter 3. DNAsequences generated were edited using BIOEDIT 7.0.9.0 (Hall, 1999) and werealigned using MAFFT (Multiple Alignment using Fast Fourier Transform) (Ka<strong>to</strong>het al., 2002). The alignment included 344 bases of 63 P. hornemannii and two Och<strong>to</strong>dessecundiramea sequences. This was submitted <strong>to</strong> the University of Oslo BIOPORTAL(http://www.bioportal.uio.no/) for Bayesian phylogenetic tree construction usingMrBayes v3.1.2 (Huelsen<strong>be</strong>ck and Ronquist, 2001). Bayesian analysis wasperformed using a GTR + I + Γ model. Posterior probabilities were estimatedusing a Metropolis-coupled Markov chain Monte Carlo approach with samplingaccording <strong>to</strong> the Metropolis–Hastings algorithm. The analysis used four chains, onecold and three incrementally heated. Each run consisted of 3000000 generationsand was sampled every 1000 generation. Burnin value was determined usingTRACER V1.4 (Rambaut and Drummond, 2007) and was set at 750 generations.PhyML (Guindon et al., 2009) was used for Maximum Likelihood analysis (ML).The model of nucleotide substitution used for ML was General Time Reversible(GTR). PhyML was set <strong>to</strong> estimate the proportion of invariable sites, consider 4substitution rate categories, estimate the gamma distribution parameter, use BIONJas an input tree, and <strong>to</strong> conduct a non-parametric bootstrap analysis of 1000replicates.5.2.3 Fractal analysisJPEG images with a resolution of 314 dpi were converted <strong>to</strong> a binaryimage and saved in bitmap format using ImageJ 1.42q (Rasband, 1997-2009).Fractal analysis was conducted using the ImageJ plugin FracLac (Karperien, 1999-2007). Two fractal dimensions were measured box-counting dimension (D B) andlacunarity (Λ). Box counting dimension (D B) is defined as the negative limit of theratio of the log of the num<strong>be</strong>r of boxes at a certain scale over the log of that scale(Karperien, 1999-2007). In a box counting scan complexity is measured by layingseveral grids of decreasing cali<strong>be</strong>r over an image and counting the num<strong>be</strong>r of boxescontaining pixels for each grid. In this case, four grids of varying sizes weresuperimposed on the images. Mean lacunarity (Λ) is a measure of heterogeneity,‗gappiness‘ or visual texture. It is derived from the variation in pixel density at
122 CHAPTER 5different grid cali<strong>be</strong>rs, using the coefficient of variation (CV) in pixel distribution.CV is computed from the standard deviation over the mean in pixel density (σ/µ).Lacunarity is aimed at supplementing the D B as some patterns may have identicalD Bs but a different lacunarity value (Karperien, 1999-2007). Other non-fractalparameters measured using FracLac are the following: foreground pixels, density,span ratio, maximum span, hull area, hull perimeter or convex hull, and circularity.Definition of fractal and non-fractal parameters is as provided in the FracLacdocumentation and Karperien et al. (2005). For quick reference, definitions ofspecific parameters used here are provided in Table 5.2.Table 5.2. Definition of fractal and FracLac-derived (non-conventional) parameters.ParameterBox countingdimension (DB)Lacunarity ΛDForegroundpixelsDensitySpan ratioMaximum spanHull areaHull perimeteror convex hullCircularityDefinitionMeasured from ratio of increasing detail (N, num<strong>be</strong>r of parts) over increasing scale (ε). Severalgrids of decreasing box size are placed over the image and the num<strong>be</strong>rs of boxes containingpixels are counted for each grid. DB = -lim [log Nε/log ε]; = negative limit of the ratio of thelog of the num<strong>be</strong>r of boxes at a certain scale over the log of that scale.Gappiness or visual texture. Measure of heterogeneity, translational or rotational invariance inan image. Calculated as the variation in pixel density at different box sizes, using the coefficien<strong>to</strong>f variation (CV) for pixel distribution.The num<strong>be</strong>r of pixels deemed foreground.Foreground Pixels/Hull Area; the unit is pixels/pixels2 or pixels-1The ratio of the major over the minor axes of the convex hull.The maximum distance in pixels <strong>be</strong>tween points across the convex hull.The area, in pixels2, of the convex hull.A connected series of straight segments convexly enclosing all of the foreground pixels of abinary image.The smallest circle enclosing all of the foreground pixels of a binary image, calculated using themaximum span across or else the three points defining the smallest circle around the convexhull
Morphometric characterization of the Portieria-complex in the Philippines 1235.2.4 Conventional morphometric measurementsFor conventional morphometric measurements, we used the same imagesacquired for fractal analysis. A <strong>to</strong>tal of 25 parameters were measured using ImageJ.These parameters are classified as conventional as they are typical linearmeasurements used in characterizing macroalga and other plants. Table 5.3provides the definition of the different measurements. For ease, areas of interestwere marked and traced with lines <strong>to</strong> serve as measurement guides (Fig. 5.1a-e).Measurements were based on the first five lateral branchlets <strong>be</strong>ginning from theapex of the branch. The first lateral branchlet appearing at the right of the apical tipwas designated as the first order lateral branchlet. The second order lateralbranchlet was the second branchlet occurring after and subopposite <strong>to</strong> the firs<strong>to</strong>rder branchlet. The succeeding branchlets are ordered in the same manner.However, in some cases when a branchlet is absent in the expected position (forexample, 1st branch), the measurement indicated is zero. In instances where overlapamong branches is unavoidable and measurement is not possible, no value isindicated. The scale for the measurements were set at 314 distance in pixels; 1known distance; 1.0 pixel aspect ratio; and unit length in mm.
124 CHAPTER 5Table 5.3. Definition of conventional measurements.VariableDescription1 L_br_1 Length of the first order lateral branchlet2 L_br_2 Length of the second order lateral branchlet3 L_br_3 Length of the third order lateral branchlet4 L_br_4 Length of the fourth order lateral branchlet5 L_br_5 Length of the fifth order lateral branchlet6 W_br_1 Width of the first order lateral branchlet7 W_br_2 Width of the second order lateral branchlet8 W_br_3 Width of the third order lateral branchlet9 W_br_4 Width of the fourth order lateral branchlet10 W_br_5 Width of the fifth order lateral branchlet11 A_br_1 Angle of the first order lateral branchlet from the apex12 A_br_2 Angle <strong>be</strong>tween the first and second order lateral branchlet13 A_br_3 Angle <strong>be</strong>tween the second and third order lateral branchlet14 A_br_4 Angle <strong>be</strong>tween the third and fourth order lateral branchlet15 A_br_5 Angle <strong>be</strong>tween the fourth and fifth order lateral branchlet16 Flx_axs_1 Flex of axis in the first order lateral branchlet17 Flx_axs_2 Flex of axis in the second order lateral branchlet18 Flx_axs_3 Flex of axis in the third order lateral branchlet19 Flx_axs_4 Flex of axis in the fourth order lateral branchlet20 Flx_axs_5 Flex of axis in the fifth order lateral branchlet21 L_<strong>be</strong>t_br3 Length of the main axis <strong>be</strong>tween the second branchlet and thirdorder lateral22 L_<strong>be</strong>t_br4 Length of the main axis <strong>be</strong>tween the third and branchlet fourthorder lateral23 L_<strong>be</strong>t_br5 Length of the main axis <strong>be</strong>tween the fourth and fifth order lateral24 L_axs_br5 Length of the main axis from the apex <strong>to</strong> the fifth order branchlet25 W_axs_br5 Width of the main axis at the fifth order branchlet
Morphometric characterization of the Portieria-complex in the Philippines 1255.2.5 Statistical analysesA forward stepwise discriminant function analysis (DA) was performedusing STATISTICA 7.0 (StatSoft Inc., Tulsa, OK, USA) <strong>to</strong> assess the potential offractal and conventional morphometric variables in discriminating and predictingcluster mem<strong>be</strong>rship among samples. The method tries <strong>to</strong> find the <strong>be</strong>st set ofpredic<strong>to</strong>rs that will <strong>be</strong>st differentiate groups in the categorical dependent variable.Variables were entered using the default forward stepwise options in STATISTICA.A priori groups were defined according <strong>to</strong> the clusters found in the cox2-3 spacerphylogeny and the life stages of Portieria. Variables were checked if assumptions setfor DA were met. Some variables failed <strong>to</strong> meet the normality criterion, but sinceviolations of normality are not critical (Tabachnick and Fidell, 2006) as long as nonnormalityis caused by skewness and not outliers, we used untransformed values.Assumption of homoscedasticity (homogeneity of variances) was tested usingLevene‘s test and Cochran C. This assumption was met except for two variables.But since DA is fairly robust against violation of this assumption (Verbruggen et al.,2005a), this violation was disregarded. An important assumption is correlation<strong>be</strong>tween means and variances which can threaten validity of a significance test(StatSoft, 2010). No violation of this assumption was observed. Variables obtainedusing FracLac and those obtained by traditional morphometric measurements wereanalyzed separately as well as combined.5.3 Results5.3.1 Phylogenetic AnalysesThe cox2-3 alignment consisted of 63 Portieria sequences and Och<strong>to</strong>dessecundiramea was used as outgroup. Out of the 344 sites, 137 were parsimonyinformative while 203 sites were non-polymorphic. Fig. 5.2 shows the BI treeindicating very high support in most branches. Specimens from the Visayas <strong>be</strong>long<strong>to</strong> at least three clusters (V1, V31, and V32) while those of Batanes <strong>be</strong>long <strong>to</strong> atleast five lineages (B5, B8, B35, B33, and B21).
126 CHAPTER 5Fig. 5.2. Phylogenetic tree reconstructed using Bayesian inference based on the mi<strong>to</strong>chondrial cox2-3 spacer ofPortieria specimens collected from Batanes (B) and Visayas (V) Islands in the Philippines. ML analysis generatedidentical groupings. Posterior probabilities ≥ 0.5 are indicated at the branches.
Morphometric characterization of the Portieria-complex in the Philippines 127Specimens <strong>be</strong>longing <strong>to</strong> six clades (V1, B5, B35, V31, V32 and B21) wereused in the morphometric analysis. Of special interest in this phylogeny are thosesamples from clade V1. There are five clear subclades <strong>be</strong>longing <strong>to</strong> V1. These wererecognized as separate species following a general mixed Yule-coalescent (GMYC)model analysis of a cox2-3 dataset and a multilocus coalescent analysis (see Chapter3). For the purpose of the morphometric analyses, however, we treat these recentlydiverged lineages as a single entity. This decision was due <strong>to</strong> sequencing failure ofseveral specimens used for morphometric measurements. These specimens weremostly from sites where species <strong>be</strong>longing <strong>to</strong> clade V1 abounds. These particularspecimens could therefore not <strong>be</strong> unequivocally assigned <strong>to</strong> these subclades (V1A-E).5.3.2 Form variation <strong>be</strong>tween genetic clustersFractal dimension and non-conventional parametersA <strong>to</strong>tal of 191 images of Portieria apices from 42 individuals <strong>be</strong>longing <strong>to</strong>six clades (Fig. 5.2; V1, B5, B35, V31, V32 and B21) were analyzed. Two fractalparameters, box-counting dimension (D B) and lacunarity (Λ), and eight nonconventionalmorphometric parameters were scored and analyzed by discriminantanalysis. Fig. 5.3a-f shows the mean values for all measured parameters for eachclade. The mean D B value is 1.728 ± 0.003 while mean lacunarity is 1.931±0.005.Lacunarity increases with D B and a high correlation (r=0.91) was observed <strong>be</strong>tweenthese two variables. Nonetheless, none of these two variables were foundredundant in the discriminant analysis.
128 CHAPTER 5Fig. 5.3. Boxplot of mean values for all measured parameters for each clade and for all the clades.
Morphometric characterization of the Portieria-complex in the Philippines 129Fig. 5.4a-i illustrates the relationship of D B and Λ and the branchingpattern. Higher num<strong>be</strong>r of wide branches produces higher fractal dimension (D B)while fewer branching orders and/or thinner branches resulted <strong>to</strong> a lower D B.Fig. 5.4. Images of branches demonstrating an increasing box-counting dimension (DB) with lacunarity.The DA included all but two parameters (span ratio and foreground pixelswere excluded) in the model set <strong>to</strong> predict group mem<strong>be</strong>rship. Only two variablespixel density and hull perimeter had a significant contribution (p0.05) contribution in
130 CHAPTER 5discriminating the samples in<strong>to</strong> groups. Wilks‘ lambda (1.0 no discrimina<strong>to</strong>rypower; 0.0 perfect discrimina<strong>to</strong>ry power), indicates that all seven variables showed arelatively even degree of discrimina<strong>to</strong>ry power (0.3741-0.4215) (Table 5.4).Circularity and DB have the highest discrimina<strong>to</strong>ry power of all the variablesanalyzed. Pixel density was also found <strong>to</strong> have the most unique contribution (partiallambda 0.8591) <strong>to</strong> the discrimination <strong>be</strong>tween groups.Table 5.4. Summary of the Stepwise Discriminant Function Analysis of fractal and non-conventional parametersshowing the independent contributions of each variable <strong>to</strong> the overall discrimination of groups. Wilks lambdavalues ranges from 0.0 (indicating perfect discrimina<strong>to</strong>ry power) <strong>to</strong> 1.0 (indicating the absence of discrimina<strong>to</strong>rypower). Partial Wilks‘ Lambda indicates for the unique contribution of a variable <strong>to</strong> group discrimination. Thelower the value of Partial Wilks‘, the greater is the unique discrimina<strong>to</strong>ry power of the respective variable.N = 191Wilks'LambdaPartialLambdaF-remove(5,179)p-levelToler.1-Toler. (R-Sqr.)Density 0.421486 0.859108 5.871133 0.000048 0.377016 0.622984HullPerimeter0.385786 0.938608 2.341576 0.043403 0.012394 0.987606Hull Area 0.380772 0.950968 1.845841 0.106149 0.009245 0.990755MaximumSpanMeanLacunarity0.383649 0.943837 2.130274 0.063868 0.165300 0.8347000.382064 0.947752 1.973594 0.084655 0.156450 0.843550D B 0.374511 0.966868 1.226782 0.298380 0.164119 0.835882Circularity 0.374069 0.968010 1.183073 0.319256 0.082563 0.917437Canonical analysis resulted in statistically significant canonical roots or discriminantfunctions (p=0.0000 and p= 0.0140). The first root is weighted most heavily by hullperimeter and hull area while the second is weighted more by hull area and D B asreflected by the resulting standardized coefficients (Table 5.5). The first and secondroot accounts for 72% and 15% of the explained variance respectively. The firstcanonical root discriminates mostly samples <strong>be</strong>longing <strong>to</strong> V32 and B35 while thesecond discriminates samples <strong>be</strong>longing <strong>to</strong> B35 and V31 (Table 5.6).
Morphometric characterization of the Portieria-complex in the Philippines 131Table 5.5. Standardized b coefficients derived from canonical analysis of fractal and non-conventional variables,showing the optimal combination of variables so that the first function provides the most overall discrimination<strong>be</strong>tween groups. The larger the standardized b coefficient, the larger the respective variable's unique contribution<strong>to</strong> the discrimination specified by the respective discriminant function.Parameter Root 1 Root 2Density 0.82523 -0.123152Hull Perimeter 2.91160 -0.143495Hull Area -2.38983 -0.730742Maximum Span -0.47189 -0.194247Mean Lacunarity 0.60533 -0.105021D B -0.30592 0.422666Circularity 0.07332 0.162905Eigenval 0.93970 0.197757Cum.Prop 0.72030 0.871883Table 5.6. Means of canonical variables (from canonical analysis of fractal and non-conventional variables)indicating which groups are <strong>be</strong>st distinguished in each function or root.Clade Root 1 Root 2V1 0.52217 -0.283916B5 0.45161 0.179798B21 0.30530 0.549598V31 -0.68423 -0.648639V32 -1.87988 0.360831B35 1.26652 0.763441However, the plot of canonical scores reveals a very poor discrimination<strong>be</strong>tween the six groups (Fig. 5.5a). The poor morphological discrimination of therespective lineages based on fractal analyses is confirmed by the results of theclassification analyses. When a priori classification probabilities were the same forall groups, classification results were low <strong>to</strong> mediocre. In <strong>to</strong>tal, less than half of thespecimens (42.9%) were correctly classified. Only lineage V32 had a slightly higherpercentage (71%) of correctly assigned specimens (Table 5.7).
Fig. 5.5. Scatter plots of discriminant scores derived from significant discriminant (canonical) roots. (a) Scatter plot of discriminant scores derived from fractal and nonconventional(FracLac-derived) variables. (b) Scatter plot of discriminant scores derived from conventional variables. (c) Scatter plot of discriminant scores derived fromcombined FracLac-derived and conventional variables.
Morphometric characterization of the Portieria-complex in the Philippines 133Table 5.7. Classification matrix (from DA of fractal and non-conventional variables) indicating the percentage ofcases correctly classified for each group when a priori classification probabilities are the same for all groups.Clade%CorrectV1p=.16667V5p=.16667V21p=.16667V31p=.16667V32p=.16667V35p=.16667NV1 21.3 16 16 11 13 3 16B5 33.3 3 8 9 2 0 2V21 52.6 2 2 10 2 0 3V31 65.4 2 2 2 17 3 0V32 71.0 0 1 1 7 22 0V35 56.3 2 1 3 0 1 9Total 42.9 25 30 36 41 29 30752419263116191Conventional measurementsA <strong>to</strong>tal of 127 images of Portieria apices from 30 individuals <strong>be</strong>longing <strong>to</strong>four clades (Fig. 5.2) were analyzed. Twenty-five parameters were scored providinginformation on the length, width, angle and flex of the 5 branchlets situated mostclosely <strong>to</strong> the tip of a Portieria branch (Fig. 5.1). Mean substitution was used <strong>to</strong>account for missing data. The mean of the measurements for each clade are listed inTable 5.8. Measurements of the first 5 branchlets for all the four lineages rangedfrom 0.2805 mm <strong>to</strong> 0.8783 mm in mean length and 0.0821 <strong>to</strong> 0.1836 mm in meanwidth. The angle <strong>be</strong>tween successive branches ranged from 29.9⁰ <strong>to</strong> 38.3⁰ .Branchlets are flexed from the axis at angles ranging from 88.6⁰ <strong>to</strong> 108.4⁰ . Meanlength of the axis <strong>be</strong>tween successive branchlets 3-5 ranged from 0.3466 <strong>to</strong> 1.2509mm. Mean width of the axis of branch 5 was 0.3330 mm.
134 CHAPTER 5Table 5.8. Means of the 25 conventional measurements measured. Length and width measurements are in mm.Clade L_br_1 L_br_2 L_br_3 L_br_4 L_br_5 W_br_1 W_br_2 W_br_3 W_br_4 W_br_5 A_br_1 A_br_2 A_br_3V1 0.2939 0.5072 0.7372 0.8219 0.9116 0.0886 0.1363 0.1778 0.1913 0.2059 27.9 33.7 37.1B5 0.2917 0.5269 0.6780 0.6221 0.7025 0.0756 0.1142 0.1452 0.1569 0.1633 18.0 20.0 20.6B21 0.2780 0.4373 0.6549 0.7092 0.8752 0.0727 0.0969 0.1203 0.1268 0.1336 22.5 14.4 21.3V32 0.2356 0.4424 0.6520 0.8004 0.9181 0.0755 0.1144 0.1388 0.1644 0.1713 48.6 61.1 60.7All Grps 0.2805 0.4884 0.7017 0.7744 0.8783 0.0821 0.1238 0.1581 0.1727 0.1836 29.7 34.4 37.1Clade A_br_4 A_br_5 Flx_axs_1 Flx_axs_2 Flx_axs_3 Flx_axs_4 Flx_axs_5 L_<strong>be</strong>t_br3 L_<strong>be</strong>t_br4 L_<strong>be</strong>t_br5 L_axs_br5 W_axs_br5 NV1 38.7 38.7 96.8 117.1 124.1 123.4 117.9 0.3552 0.2688 0.3676 13.747 0.3818 68B5 18.7 20.6 63.4 77.6 73.7 73.6 72.0 0.3757 0.2465 0.3925 0.7326 0.2998 18B21 20.7 21.6 51.1 67.8 66.0 67.8 67.4 0.3314 0.2776 0.2921 0.8320 0.2379 17V32 62.0 62.3 110.7 136.4 137.7 139.2 137.9 0.3112 0.3387 0.4200 16.248 0.2874 24All Grps 37.9 38.3 88.6 108.6 111.8 111.9 108.4 0.3466 0.2800 0.3709 12.583 0.3330 127Of the 25 variables, only 13 were finally included in the DA model (Table5.9). Variables with the least unique contribution <strong>to</strong> the discrimination wereexcluded (partial lambda ≥0.9790). Six out of 13 variables had significantcontribution in discriminating the samples in<strong>to</strong> different groups (W_axs_br5,A_br2, A_br_3, L_<strong>be</strong>t_br5, A_br4, and L_br_5). Of the variables in the model,Flx_axs_3 and W_br_5 have the highest discrimina<strong>to</strong>ry power (0.1397 and 0.1416,respectively). A_br_4 had the highest discrimina<strong>to</strong>ry power (0.1469) among thesignificant variables. W_axs_br5 had the most unique contribution (0.6776) in thediscrimination of cases but with the least discrimina<strong>to</strong>ry power.Two significant discriminant functions (canonical roots, p=0.0000) emergefrom the canonical analysis. The first and second root account for 55% and 42%,respectively, of the explained variance. Of the 13 variables, the angles, A_br_3 andA_br_4, contribute most <strong>to</strong> the prediction of group mem<strong>be</strong>rship in root 1 andW_axs_br5 and A_br2 for root 2 (Table 5.10).
Morphometric characterization of the Portieria-complex in the Philippines 135Table 5.9. Summary of the Stepwise Discriminant Function Analysis of conventional parameters showing theindependent contributions of each variable <strong>to</strong> the overall discrimination of groups.ParameterN= 127Wilks'LambdaPartialLambdaF-remove(3,111)p-levelToler.1-Toler. (R-Sqr.)W_axs_br5 0.201629 0.677596 17.60478 0.000000 0.594671 0.405330A_br_2 0.156941 0.870538 5.50248 0.001464 0.279724 0.720276Flx_axs_2 0.144954 0.942526 2.25622 0.085814 0.282692 0.717308A_br_3 0.151660 0.900850 4.07230 0.008717 0.189101 0.810899Flx_axs_3 0.139771 0.977477 0.85255 0.468112 0.114396 0.885604L_<strong>be</strong>t_br5 0.156701 0.871872 5.43743 0.001587 0.638395 0.361605L_<strong>be</strong>t_br4 0.143435 0.952509 1.84478 0.143199 0.691522 0.308478A_br_4 0.146915 0.929946 2.78726 0.044034 0.151386 0.848614L_br_1 0.143916 0.949327 1.97498 0.121862 0.835061 0.164939L_br_5 0.147687 0.925084 2.99637 0.033829 0.540631 0.459370Flx_axs_4 0.143235 0.953842 1.79050 0.153125 0.093875 0.906125A_br_5 0.142185 0.960884 1.50622 0.216892 0.204426 0.795574W_br_5 0.141650 0.964514 1.36128 0.258407 0.476849 0.523151The first and second roots discriminate mostly samples from V32 and B21(Table 5.11). Fig. 5b illustrates a large overlap in canonical scores <strong>be</strong>tween the fourgroups, <strong>be</strong> it that V32 is moderately well discriminated along the first canonical axis.Classification success was moderate <strong>to</strong> high, ranging from 70.6% (N=17) <strong>to</strong> 100%(N=24) if a priori probabilities where made equal among groups (Table 5.12).
136 CHAPTER 5Table 5.10. Standardized b coefficients derived from canonical analysis of conventional variables, showing theoptimal combination of variables so that the first function provides the most overall discrimination <strong>be</strong>tweengroups. The larger the standardized b coefficient, the larger is the respective variable's unique contribution <strong>to</strong> thediscrimination specified by the respective discriminant function.Parameter Root 1 Root 2W_axs_br5 0.089935 -0.963490A_br_2 0.564458 -0.489482Flx_axs_2 -0.504456 -0.260415A_br_3 0.846353 0.318045Flx_axs_3 -0.495866 -0.210390L_<strong>be</strong>t_br5 0.338452 0.380495L_<strong>be</strong>t_br4 0.170343 0.269753A_br_4 0.652460 -0.079111L_br_1 -0.241545 0.200309L_br_5 0.085602 0.342049Flx_axs_4 -0.695412 -0.316343A_br_5 0.312262 0.472667W_br_5 0.091965 -0.338047Eigenval 1.799940 1.357267Cum.Prop 0.551085 0.966638Table 5.11. Means of canonical variables (conventional) indicating which groups are <strong>be</strong>st distinguished in eachfunction or root composed of conventional variables.Clade Root 1 Root 2V1 -0.24017 -0.992647B5 -1.26998 0.715447B21 -1.32417 2.118575V32 2.57092 0.775256Table 5.12. Classification matrix (from DA of conventional variables) indicating the percentage of cases correctlyclassified for each group when a priori classification probabilities are the same for all groups.Clade%CorrectV1p=.25000B5p=.25000B21p=.25000V32p=.25000V1 72.1 49 12 2 5 68B5 72.2 2 13 3 0 18B21 70.6 2 3 12 0 17V32 100.0 0 0 0 24 24Total 77.2 53 28 17 29 127N
Morphometric characterization of the Portieria-complex in the Philippines 137Combined parametersA <strong>to</strong>tal of 100 apices of Portieria from 23 individuals <strong>be</strong>longing <strong>to</strong> fourlineages (Fig. 5.2) were analyzed. All non-conventional and conventional parametersexcept for hull area were used for DA. The <strong>to</strong>lerance value of the hull area failed <strong>to</strong>reach the minimum limit (0.01) and was highly correlated with hull perimeter. TheDA model contained nineteen variables which included component parametersnearly identical <strong>to</strong> the two previous analyses. However, foreground pixels wasincluded while D B and hull area were excluded in this model. This was not the casein the first DA analysis (under fractal and non-conventional parameters) whichrecorded D B with the second highest discrimina<strong>to</strong>ry power (Table 5.4). Eightconventional and one non-conventional variable (circularity) were found <strong>to</strong> havesignificant contribution <strong>to</strong> the discrimination of samples. The 13 variables showednearly even discrimina<strong>to</strong>ry powers (0.0482-0.0589). W_axs_br5 had the mostunique contribution in the discrimina<strong>to</strong>ry power of all 13 variables.The analysis yielded three discriminant functions (canonical roots),accounting for 58%, 34%, and 8% of the explained variance, respectively. Roots 1,2 and 3 are weighted most heavily by variables A_br_4, density, maximum span,circularity, hull perimeter and foreground pixels. Based from the means ofcanonical variables, root 1 discriminates mostly samples from B21 and V32. Root 2discriminates V32 and V1 while root 3 discriminates B5 and B21 samples. On Fig.5.5c, samples <strong>be</strong>longing <strong>to</strong> V32 are well-separated at the positive side of the scatterplot. The samples from V1 are partially separated but those from B5 and B21clearly overlap. Successful group classification of cases ranged from 83.3 %( N=18)<strong>to</strong> 100% (N =21) when a priori probabilities where equal along groups (Table 5.13).Table 5.13. Classification matrix derived from combined variables indicating the percentage of cases correctlyclassified for each group when a priori classification probabilities are the same for all groups.V1 B5 V21 V32Clade%Correctp=.25000 p=.25000 p=.25000 p=.25000NV1 85.1 40 2 1 4 47B5 83.3 1 15 2 0 18V21 92.9 0 1 13 0 14V32 100.0 0 0 0 21 21Total 89.0 41 18 16 25 100
138 CHAPTER 55.4 DiscussionIn this study we aimed <strong>to</strong> assess whether it is possible <strong>to</strong> distinguish<strong>be</strong>tween Portieria species on the basis of morphometric variables. Fractal analysesresulted in low <strong>to</strong> moderate classification success. The maximum percentage ofcorrectly classified cases was 71% for lineage V32. Classification success was higherfor conventional measurements, ranging from 70 <strong>to</strong> 100%. When combined, fractalvariables and conventional measurements resulted in high <strong>to</strong> very high classificationsuccess (83-100 %). These results indicate that although it may not <strong>be</strong> possible <strong>to</strong>assign each individual specimen or apex <strong>to</strong> the correct lineage, some Portieria speciesare morphologically differentiated from one another. Misclassification of individualspecimens was highest for B5, B21 and V1, while specimens of V32 appeared <strong>to</strong> <strong>be</strong>morphologically more differentiated from the others. Regardless of techniques used(fractal analyses, conventional measurements, or the combined data set) theirclassification success was markedly higher. The fractal and non-conventionalcharacters that set them apart from the rest were D B and circularity while, pixeldensity provided a unique discrimina<strong>to</strong>ry power. The conventional variables, flex ofaxis in the third order lateral branchlet (Flx_axs_3) and width of the fifth orderlateral branchlet (W_br_5) have the highest discrimina<strong>to</strong>ry power. Width of thefifth order lateral branchlet (W_axs_br5) had the most unique contribution in thediscrimination. Conventional measurements outperform the parameters derivedfrom the fractal analysis. In addition, conventional measurements have theadvantage that their interpretation is more straightforward compared <strong>to</strong> thesomewhat abstract parameters resulting from fractal analyses. The combination ofboth, however, results in the <strong>be</strong>st discrimina<strong>to</strong>ry power.These results show the utility of simple linear and branch anglemeasurements in capturing differences among macroalgal sister species. Thissuggests that the method can <strong>be</strong> carried on <strong>to</strong> future morphometric investigationsin Portieria and possibly, similarly branched seaweeds (e.g. Plocamium). It should also<strong>be</strong> noted that more meaningful measurements can <strong>be</strong> obtained around olderbranchlets, as suggested by the parameters retained in the DA and those with thehighest discrimina<strong>to</strong>ry power. Since combined fractal, non-conventional andconventional variables improve discrimination and classification, futuremorphometric studies, should focus on the 20 variables (D B, density, hull perimeter,hull area, maximum span, mean lacunarity, circularity, W_axs_br5, A_br_2,Flx_axs_2, A_br_3, Flx_axs_3, L_<strong>be</strong>t_br5, L_<strong>be</strong>t_br4, A_br_4, L_br_1, L_br_5,Flx_axs_4, A_br_5, W_br_5) found <strong>to</strong> contribute in the discrimination <strong>be</strong>tween
Morphometric characterization of the Portieria-complex in the Philippines 139Portieria species. The robustness of these variables may <strong>be</strong> further tested with theclassification of more samples from the lineages in this study. In fractal analysis, <strong>to</strong>obtain the true value of a fractal dimension care should <strong>be</strong> taken that noise fromdust, particles and epiphytes are removed since these pixels are included in theanalysis. In the same way, damaged specimens should also <strong>be</strong> avoided so as <strong>to</strong>capture the real shape of a specimen.Although it is clear that Portieria lineages exhibited little morphologicalchange over time, we show that diversification in Portieria did coincide with subtlemorphological differentiation which is detectable through morphometric analyses.At least the species compared in this study (B5, B21, B31, B35, V1, V32) are notentirely cryptic, <strong>be</strong>cause we are able show morphological differences post hoc, that isafter species had <strong>be</strong>en delineated based on DNA sequence data. Hence, we wouldclassify them as <strong>be</strong>ing pseudocryptic (see Knowl<strong>to</strong>n, 1993; Sáez et al., 2003). Theclades selected for the morphometric analyses are however not sister taxa. They areoften more closely related <strong>to</strong> other species occurring within or outside thePhilippines (see Chapter 4). The scale and tempo, at which morphologicaldifferences <strong>be</strong>come established, however, remain <strong>to</strong> <strong>be</strong> determined using fine-scaleinvestigations <strong>be</strong>tween closely related lineages. Especially, the V1 clade which wehave shown <strong>to</strong> <strong>be</strong> composed of at least 5 distinct lineages all present in the Visayas,could present an interesting test case. These subclades, identified as distinct speciesby various algorithmic species delimitation analyses, diverged at small spatial scalesin the Visayas during the last 5 My. In this paper, we united the various subclades,but it would <strong>be</strong> interesting <strong>to</strong> investigate if morphological differences exist <strong>be</strong>tweenthese recently diverged species.5.5 AcknowledgementsFunding was provided by the Flemish Interuniversity Council (VLIR) as a PhD grant <strong>to</strong> DAPayo. Sincere gratitude goes <strong>to</strong> Abner Bucol, Zacharias Generoso and Jacinta Lucañas ofIEMS- Silliman University, Rey Ladiao of Leyte Normal University and Flora<strong>be</strong>l Fumar ofthe University of the Philippines, William Villaver and Batanes MENRO Francis Domingofor field and dive assistance. We also thank D. and M. Littler for providing Och<strong>to</strong>des samples.We greatly appreciate the assistance of Caroline Vlaeminck and Sofie D‘hondt on PCR andsequencing work.
140 CHAPTER 5
Morphometric characterization of the Portieria-complex in the Philippines 1415.6 ReferencesAbraham, E.R., 2001. The fractal branching of an arborescent sponge. Mar. Biol. 138, 503-510.Alados, C.L., Escos, J., Emlen, J.M., Freeman, D.C., 1999. Characterization of branch complexity byfractal analyses. Int. J. Plant Sci. 160, S147-S155.Altamirano-Cerecedo, M.C., Riosmena-Rodríguez, R., 2007. Vegetative and reproductive variability ofDictyota crenulata (Phaeophyta: Dictyotales) along the Central and Southwestern Gulf ofCalifornia, México. Pac. Sci. 61, 575-586.Corbit, J.D., Garbary, D.J., 1995. Fractal dimension as a quantitative measure of complexity in plantdevelopment. P. Roy. B-Biol Sci. 262, 1-6.Guindon, S., Dufayard, J.F., Hordijk, W., Lefort, V. & Gascuel, O. 2009. Phyml: Fast and accuratephylogeny reconstruction by maximum likelihood. Infect. Genet. Evol., 9, 384-385.Goutzanis, L., Papadogeorgakis, N., Pavlopoulos, P.M., Katti, K., Petsinis, V., Plochoras, I.,Pantelidaki, C., Kavantzas, N., Patsouris, E., Alexandridis, C., 2008. Nuclear fractaldimension as a prognostic fac<strong>to</strong>r in oral squamous cell carcinoma. Oral Oncol. 44, 345-353.Guiry, M.D., Guiry, G.M., 2011. AlgaeBase. World-wide electronic publication, National University ofIreland, Galway. http://www.algaebase.org; searched on 19 June 2011.Hall, T.A., 1999. BioEdit: a user-friendly biological sequence alignment edi<strong>to</strong>r and analysis programfor Windows 95/98/NT. Nucl. Acids. Symp. Ser 41, 95-98.Hubbard, C.B., Garbary, D.J., 2002. Morphological Variation of Codium fragile (Chlorophyta) inEastern Canada. Bot. Mar. 45, 476-485.Huelsen<strong>be</strong>ck, J.P., Ronquist, F., 2001. MRBAYES: Bayesian inference of phylogenetic trees.Bioinformatics 17, 754-755.Kaandorp, J.A., Kübler, J.E., 2001. The algorithmic <strong>be</strong>auty of seaweeds, sponges, and corals. SpringerVerlag.Karperien, A., 1999-2007. FracLac for ImageJ, version 2.5.http://rsb.info.nih.gov/ij/plugins/fraclac/FLHelp/Introduction.htm.Karperien, A., Jelinek, H.F., Bossomaier, T., 2005. Fractal analysis quantitates overt and subtle effectsof naloxone and lipopolysaccharide on cultured rat microglia. Complex Int. MonashUniversity Faculty of Information of Technology, p. msid12.Ka<strong>to</strong>h, K., Misawa, K., Kuma, K.-i., Miyata, T., 2002. MAFFT: a novel method for rapid multiplesequence alignment based on fast Fourier transform. Nucl. Acids Res. 30, 3059-3066.Knowl<strong>to</strong>n, N., 1993. Sibling species in the sea. Annu. Rev. Ecol. Syst. 24, 189-216.Kraan, S., Rueness, J., Guiry, M., 2001. Are North Atlantic Alaria esculenta and A. grandifolia(Alariaceae, Phaeophyceae) conspecific? Eur. J. Phycol. 36, 35 - 42.Kubler, J.E., Dudgeon, S.R., 1996. Temperature dependent change in the complexity of form ofChondrus crispus fronds. J. Exp. Mar. Biol. Ecol. 207, 15-24.Leliaert, F., Millar, A.J.K., Vlaeminck, C., Coppejans, E., 2007. Systematics of the green macroalgalgenus Chamaedoris Montagne (Siphonocladales), with an emended description of the genusStruvea Sonder. Phycologia 46.Mandelbrot, B.B., 1975. Les objets fractals: forme, hasard et dimension, Flammarion, Paris.Martin-Garin, B., Lathuiliere, B., Verrecchia, E.P., Geister, J., 2007. Use of fractal dimensions <strong>to</strong>quantify coral shape. Coral Reefs 26, 541-550.Montañes, M.A., Sanson, M., Reyes, J., 2006. Vegetative and reproductive phenology of Zonaria<strong>to</strong>urnefortii (Dictyotales, Phaeophyceae) in sublit<strong>to</strong>ral populations off the Canary Islands. Bot.Mar. 49, 406-416.Rambaut, A., Drummond, A.J., 2007, Tracer v1.4.Rasband, W.S., 1997-2009. ImageJ, US National Institutes of Health, Bethesda, Maryland, USA.http://rsb.info.nih.gov/ij 20.Sáez, A.G., Pro<strong>be</strong>rt, I., Geisen, M., Quinn, P., Young, J.R., Medlin, L.K., 2003. Pseudo-crypticspeciation in coccolithophores. Proc. Natl. Acad. Sci. U. S. A. 100, 7163.
142 CHAPTER 5Sherwood, A.R., Sheath, R.G., 1999. Biogeography and systematics of Hildenbrandia (Rhodophyta,Hildenbrandiales) in North America: inferences from morphometrics and rbcL and 18SrRNA gene sequence analyses. Eur. J. Phycol. 34, 523-532.Sherwood, A.R., Sheath, R.G., 2000. Biogeography and systematics of Hildenbrandia (Rhodophyta,Hildenbrandiales) in Europe: inferences from morphometrics and rbcL and 18S rRNA genesequence analyses. Eur. J. Phycol. 35, 143-152.Sherwood, A.R., Sheath, R.G., 2003. Systematics of the Hildenbrandiales (Rhodophyta): Genesequence and morphometric analyses of global collections. J. Phycol. 39, 409-422.StatSoft, I., 2010, Electronic Statistics Textbook. Tulsa, OK: StatSoft.Tabachnick, B.G., Fidell, L.S., 2006. Using Multivariate Statistics (5th Edition). Allyn & Bacon, Inc. ,Needham Heights, MA, USATronholm, A., Sansón, M., Afonso-Carrillo, J., Verbruggen, H., De Clerck, O., 2010. Nichepartitioning and the coexistence of two cryptic Dictyota (Dictyotales, Phaeophyceae) speciesfrom the Canary Islands. J. Phycol. 46, 1075-1087.Verbruggen, H., De Clerck, O., Cocquyt, E., Kooistra, W., Coppejans, E., 2005a. Morphometrictaxonomy of siphonous green algae: A methodological study within the genus Halimeda(Bryopsidales). J. Phycol. 41, 126-139.Verbruggen, H., De Clerck, O., Kooistra, W., Coppejans, E., 2005b. Molecular and morphometricdata pinpoint species boundaries in Halimeda section Rhipsalis (Bryopsidales, Chlorophyta).J. Phycol. 41, 606-621.Wiseman, D.R., 1975. On the status of the red algal family, the Rhizophyllidaceae (Gigartinales).Taxon 24, 489-490.Yano, T., Kamiya, M., Arai, S., Kawai, H., 2004. Morphological homoplasy in Japanese Plocamiumspecies (Plocamiales, Rhodophyta) inferred from the Rubisco spacer sequence andintracellular acidity. Phycologia 43, 383-393.Yano, T., Kamiya, M., Murakami, A., Sasaki, H., Kawai, H., 2006. Biochemical phenotypescorresponding <strong>to</strong> molecular phylogeny of the red algae Plocamium (Plocamiales,Rhodophyta): implifications of incongruence with the conventional taxonomy. J. Phycol.42,155-169.
6 VARIABILITY OF NON-POLAR SECONDARYMETABOLITES IN THE RED ALGA PORTIERIA 1AbstractAbout 80 secondary metabolites have <strong>be</strong>en characterized from the marine red macroalgaPortieria hornemannii. Most of these compounds are halogenated monoterpenes, thesignatures of which differ <strong>be</strong>tween samples from different geographical origins. Possiblesources of variation have rarely <strong>be</strong>en investigated. Using non-polar extraction andmetabolite fingerprinting of P. hornemannii sampled from two distinct regions in thePhilippines (Batanes and Visayas), this study aims <strong>to</strong> determine if variation is due <strong>to</strong> thedifferent life-his<strong>to</strong>ry stages, presence of cryptic species, and/or spatiotemporal fac<strong>to</strong>rs. A<strong>to</strong>tal of 302 compounds were detected. In the Batanes region, DNA sequence data point<strong>to</strong>wards the presence of 5 cryptic species. PCA analyses demonstrate secondary metabolitevariation <strong>be</strong>tween as well as within these cryptic species. Intraspecific variation was evenmore pronounced in the Visayas dataset which included samples from 6 sites, <strong>be</strong>longing <strong>to</strong>3 cryptic species. Neither species groupings nor spatial or temporal based patterns wereobserved in the PCA analysis. However, intraspecific variation in secondary metabolites wasdetected <strong>be</strong>tween life-his<strong>to</strong>ry stages. Male game<strong>to</strong>phytes are strongly discriminated from thetwo other stages, and female game<strong>to</strong>phyte and tetrasporophyte samples are partiallydiscriminated. Female game<strong>to</strong>phyte extracts (202) are chemically richer compared <strong>to</strong> that ofthe male (102) and tetrasporophyte (106). These results suggest that life-his<strong>to</strong>ry drivenvariations and possibly other microscale fac<strong>to</strong>rs may significantly influence variation withinPortieria species.Keywords: Portieria, secondary metabolite, variation, cryptic species, life-his<strong>to</strong>ry stages1 Unpublished manuscript: Payo D.A., Colo J, Calumpong H. & De Clerck O. Variability of non-polar secondarymetabolites in the red alga Portieria.143
144 CHAPTER 66.1 IntroductionNatural products, and in particular secondary metabolites, have <strong>be</strong>en thefocus of study in many marine macroalgae. Seaweeds interact with theirenvironment utilizing a rich variety of secondary metabolites (Williams et al., 1989;Hay and Fenical, 1996; Wise, 2003; Bhat et al., 2005). These chemical compoundshave no explicit role in the internal metabolism of the organisms (Williams et al.,1989; Bourgaud et al., 2001; Gribble, 2003) but serve as defense mechanismsagainst grazers, competi<strong>to</strong>rs, fouling organisms and pathogens (Dworjanyn et al.,1999; Gunatilaka et al., 1999; Kladi et al., 2004). The compounds are localized inspecialized cells, have relatively low molecular weights (
Variability of non-polar secondary metabolites 145availability. They found that variation in och<strong>to</strong>dene concentrations P. hornemanniicannot <strong>be</strong> attributed <strong>to</strong> nitrogen and phosphorus availability but suggested thatinstead light may <strong>be</strong> an important fac<strong>to</strong>r. Matlock et al. (1999) demonstrated strongsite-<strong>to</strong>-site differences, variation within populations, and limited evidence fortemporal variation in apakaoch<strong>to</strong>dene levels. Some authors have emphasized thenecessity <strong>to</strong> genotype the organisms in order <strong>to</strong> <strong>be</strong>tter understand the mechanismsthat regulate the production of specific natural products (Bourgaud et al., 2001;Miller et al., 2001; Pietra, 2002; McGovern and Hell<strong>be</strong>rg, 2003). However, within P.hornemannii, intraspecific genetic variation in relation <strong>to</strong> secondary metabolites hasnot <strong>be</strong>en studied.Recently, we found convincing evidence for a large num<strong>be</strong>r of crypticspecies within Portieria, with at least 21 species occurring in the Philippines (Chapter3). This study aims <strong>to</strong> understand how non-polar secondary metabolites of Portieriaplants vary <strong>be</strong>tween cryptic species and among life stage within species. Weemployed metabolite fingerprinting and multivariate analysis of metabolitesdetected among samples collected in the Philippines. Because of the large num<strong>be</strong>rof detected compounds in the samples, the unavailability of commercial standardsof the exotic compounds found in Portieria and the scarcity of compoundidentification resources such as mass spectral databases dedicated <strong>to</strong> marinesecondary metabolites, metabolite fingerprinting was the most feasible analyticalmethod <strong>to</strong> achieve the objective. In contrast <strong>to</strong> target analysis, metabolite profilingand metabolomics, metabolite fingerprinting does not separate individualmetabolites, but instead compares spectra of whole extracts using multivariatestatistics (Fiehn and Kind, 2006). Metabolite fingerprinting is particularly useful forrapid classification of samples (Fiehn, 2002). Our specific aims were <strong>to</strong> evaluate inPortieria spp.: 1) if there is variation of non-polar secondary metabolites <strong>be</strong>tween thegame<strong>to</strong>phyte and tetrasporophyte life-his<strong>to</strong>ry stages 2) if metabolite variation is due<strong>to</strong> the presence of phylogenetically distinct cryptic species, and 3) if patterns ofvariation are observed on a geographical and temporal level.
146 CHAPTER 66.2 Materials and methods6.2.1 Collection and S<strong>to</strong>rageField samplings were performed at different periods in several sites in thePhilippines (Fig. 6.1. a-c). Plants were collected by snorkeling and SCUBA divingdepths ranging from 1-20 meters. For secondary metabolite characterization of thedifferent life-his<strong>to</strong>ry stages of Portieria, the plants used were collected randomly inBantayan near Dumaguete (Fig. 6.1. c) in Decem<strong>be</strong>r 29, 2009. To allow bothchemical characterization and life-his<strong>to</strong>ry stage verification under the microscope,plants were blotted dry and s<strong>to</strong>red in silica after collection.Plants for secondary metabolites analysis <strong>be</strong>tween species were collected at4 sites in Batanes (Basco, White Beach, Coral, and in Chavayan) (Fig. 6.1. a-b) inApril 23-26, 2009. Plants were preserved in 95% ethanol in the field and placed at -23 °C afterwards. Sampling for seasonal and spatial comparison of secondarymetabolites were conducted in 6 sites in the Central Visayas (Dapdap, Siquijor,Siquijor; Pagubagubaan, San Juan, Siquijor; Sawang, San Juan Siquijor; Bantayan,Dumaguete, Negros Oriental; Sia<strong>to</strong>n, Negros Oriental; Liloan, Santander, Cebu(Fig. 6.1. a and Fig. 6.1. c) from 2007 <strong>to</strong> 2009. For the first 4 sites, plants werecollected on a monthly basis when present and when abundant enough <strong>to</strong> afford agood amount for extraction. For sites close <strong>to</strong> the Silliman Marine Labora<strong>to</strong>ry,plants were immediately packed and s<strong>to</strong>red at -23 °C upon arrival. When immediatefreezing was not possible, plants were preserved in 95% ethanol in the field andplaced at -23 °C afterwards until extraction. Frozen plants were rinsed in freshwateror in ethanol and blotted dry.As Portieria can often not <strong>be</strong> distinguished morphologically (Chapter 5),species identification was based on DNA sequence data (see <strong>be</strong>low). For DNAcharacterization, thallus clippings were collected from specimens and s<strong>to</strong>red in silicawhile in the field.
Variability of non-polar secondary metabolites 147Fig. 6.1. Map of sampling sites. (a) Map of the Philippines indicating location of Batanes and Visayas. (b) Samplingsites in Batan and Sabtang Islands in Batanes. (c) Sampling sites in Siquijor, Negros, and Cebu Islands in theVisayas.6.2.2 ExtractionLife-his<strong>to</strong>ry stages comparison. Portieria has a tri-phasic isomorphic life his<strong>to</strong>rywhich includes free-living haploid male and female game<strong>to</strong>phytes, a diploidcarposporophyte attached <strong>to</strong> the thallus and dependent <strong>to</strong> the female game<strong>to</strong>phyte,and a free-living diploid tetrasporophyte. Silica-dried specimens were examinedunder the microscope and segregated in<strong>to</strong> different life-his<strong>to</strong>ry stages (malegame<strong>to</strong>phytes, female game<strong>to</strong>phytes, and tetrasporophytes). Biological replicates
148 CHAPTER 6each about 1 gram dry weight were prepared for every life-his<strong>to</strong>ry stage. Tissueswere ground using mortar and pestle, dissolved in 6 mL dichloromethane (DCM)containing 50 µg. mL -1 naphthalene, and vortexed for a few seconds. The DCMextracts were allowed <strong>to</strong> stand at room temperature for 24 hours in screw-captu<strong>be</strong>s. The extracts were decanted and transferred <strong>to</strong> air tight screw-cap tu<strong>be</strong>s ands<strong>to</strong>red at -23 °C. The tissues were re-dissolved in DCM for another 24 hours. Firstand second extracts of a sample were pooled <strong>to</strong>gether and filtered using WhatmanGF/C. The combined extracts were loaded in<strong>to</strong> pre-conditioned SPE tu<strong>be</strong>scontaining 10 g of silica (Silicycle SiliaFlash® G60, 60-200μm, 60Å). Non-polarcompounds were eluted using 12 mL hexane. The eluate was blown down <strong>to</strong> 0.5mL <strong>to</strong> concentrate the sample. Three 100 µL replicates were taken from this s<strong>to</strong>ckand used as technical replicates in the GC-MS analysis.Species Comparison. The samples were extracted individually. Tissue wasground using a mortar and pestle and extracted twice in 6 mL DCM overnight.Extracts were pooled, loaded in 2 g silica and eluted using 6 mL of hexane. Eluatesof 8 samples <strong>be</strong>longing <strong>to</strong> the same species, approximately weighing 10-26 g, werepooled and evaporated down <strong>to</strong> 100 µL. To assess consistency in the GC-MSanalyses, 3 technical replicates were prepared for each sample. Solvents forextraction and chroma<strong>to</strong>graphy were HPLC grade (DCM – Mallinckrodt 4879, bp40 °C, density 1.3266 g cm-3 at 20 °C or HiperSolv Chromanorm; n- Hexane -Mallinckrodt 5167, bp 69 °C or Hipersolv Chromanorm. Naphthalene Fisher N134,bp 218 °C) and β-myrcene (Sigma M0382, 90% purity, bp 167 °C) were used asinternal and external standards, respectively.Seasonal and Spatial Comparison. For seasonal analysis, plant material wasground using mortar and pestle. Twenty grams of ground material was extracted in20 mL dichloromethane for 24 hrs at room temperature. The material was extracteda second time in 20 mL dichloromethane and the extracts were pooled. To measurethe amount of green oil that is generated, one of the two pooled extracts isevaporated <strong>to</strong> dryness using nitrogen until thick green oil is visible. The oil isweighed and redissolved in 20 mL dichloromethane. The other extract isevaporated down <strong>to</strong> 20 mL. Both extracts were loaded in SPE columns containing10 g of silica (Silicycle SiliaFlash® G60, 60-200μm, 60Å). Non-polar compoundswere eluted from the column with 20 mL hexane and again blown down <strong>to</strong> 100 µL<strong>to</strong> concentrate the sample. A separate aliquot of ground plant tissue was used <strong>to</strong>determine dry mass.
Variability of non-polar secondary metabolites 1496.2.3 Phylogenetic AnalysisAssignment of the sampled specimens <strong>to</strong> cryptic species was based onphylogenetic analysis of the mi<strong>to</strong>chondrial cox2-3 spacer region. The phylogenyincludes specimens collected from 5 sites (Basco, Chanaryan, Coral, Mahatao,Chavayan) in Batanes and 6 sites (Dapdap, Siquijor; Sawang, San Juan, Siquijor;Pagubagubaan, San Juan, Siquijor; Malo, Sia<strong>to</strong>n; Bantayan, Dumaguete; Liloan,Santander) in the Visayas, Philippines. Species delineation follows the rationaloutlined in Chapter 3. DNA extraction, PCR amplification, sequencing andsequence alignment were performed as descri<strong>be</strong>d in Chapter 3.The alignment of152 Portieria sequences was 345 bp long. Bayesian inference (BI) of phylogeny wasperformed using MrBayes v3.1.2 (Huelsen<strong>be</strong>ck and Ronquist, 2001) under a GTR+ I + Γ model as determined by jModelTest (Posada, 2008). BI analyses consistedof two parallel runs of three incrementally heated chains and one cold chain each,and 3 million generations with sampling every 1000 generations. A burnin value of750 was determined using TRACER V1.4 (Rambaut and Drummond, 2007).6.2.4 Metabolite analysis, data processing and multivariate analysisGC-MS Analysis. GC-MS analyses of the non-polar eluates were performedusing Agilent 6890 gas chroma<strong>to</strong>graph and Agilent 6973 mass selective detec<strong>to</strong>r.Sample injection volume was 1 μL. Split injection with a split ratio of 20:1 was used.The carrier gas was helium with a <strong>to</strong>tal flow rate of 72.7 mL min -1 and 26.20 psicolumn head pressure. Compounds were separated using a 30m x 0.25mm HP-5MS non-polar capillary column (Hewlett-Packard, 5% phenyl methyl siloxane, 0.25μm thickness) for a run time of 67 min. under the following oven temperatureprogram: 50 °C initial held for 2 min, then increased at a rate of 5⁰ C min -1 <strong>to</strong> 300⁰ C, held for 15 min. The spectrometers were run in electron-impact mode withionization energy of 70 eV and an ion source temperature ranging from 230-250 °C.The scan range was set <strong>to</strong> detect masses from 50-500 amu.GC-MS Data Processing. The software AMDIS (http://www.amdis.net)(Meyer, 2010) was used for peak identification and deconvolution of thechroma<strong>to</strong>gram. This method calculates and retrieves pure (background-free) massspectra from raw GC-MS data files based from the parameters indicated by theuser. The following parameters were used for all of the analyses: medium shaperequirement, medium sensitivity, and medium resolution. The ELU files generatedfrom AMDIS were submitted for analysis using Spectconnect(http://spectconnect.mit.edu/) (Styczynski et al., 2007) <strong>to</strong> generate matrices of
150 CHAPTER 6component peaks (relative abundance, retention time, integrated signal and basepeak.Compound identification. In the absence of pure standards of compoundspreviously isolated from Portieria (except for β-myrcene), we used Kovats indices,freely available mass spectral databases <strong>to</strong> determine identity of component peaks,and literature. We computed the Kovats or retention index of each peak using theretention times of alkane standards from C8-C20 and the Retention IndexCalcula<strong>to</strong>r (Lucero et al., 2009). The retention index is derived from theinterpolation (usually logarithmic), relating the adjusted retention volume (time) ofthe sample component <strong>to</strong> the adjusted retention volumes (times) of two standardseluted <strong>be</strong>fore and after the peak of a sample component (IUPAC definition). Thecalculated KI was au<strong>to</strong>matically compared <strong>to</strong> the KI‘s of compounds s<strong>to</strong>red in thebuilt-in library of the calcula<strong>to</strong>r.Mass spectra of component peaks were compared <strong>to</strong> compounds retrievedfrom MassBank (http://www.massbank.jp/index.html?lang=en), Pherobase(http://www.pherobase.com/), and the limited version of the NIST library in theMS Search Program and AMDIS. Mass spectra of components were inspected forsimilarity with those of the characteristic mass signals of components published inAndrianasolo et al., 2006, Egorin et al., 1997, and Barahona and Rorrer, 2003.Data standardization, metabolite fingerprinting and multivariate analyses. Relativeabundance matrices generated from the Spectconnect analyses were used forstatistical analyses. A matrix contains relative abundance values of all detectedcomponents across all samples included in the analysis. The data were standardizedby obtaining a ratio <strong>be</strong>tween the relative abundance of a component per replicate(or sample) and the <strong>to</strong>tal of all components per replicate (or sample). The ratiosobtained among the technical replicates were subsequently averaged. Principalcomponent analysis was performed using Statistica 7.0 (StatSoft Inc., Tulsa, OK,USA) on each dataset <strong>to</strong> detect any pattern or groupings based from the variableswhich are the component compounds.
Variability of non-polar secondary metabolites 1516.3 Results6.3.1 Delimitation of speciesPhylogenetic analyses of 152 cox2-3 sequences revealed 12 clades of closelyrelated sequences, preceded by long well supported branches. Seven lineagesinclude specimens from Batanes and 5 clades are restricted <strong>to</strong> the Visayas (Fig. 6.2.). These clades will further <strong>be</strong> regarded as species (see Chapter 3 for details onspecies delimitation).6.3.2 Identification of compounds in non-polar extractsOwing <strong>to</strong> the unavailability of standard compounds and public reposi<strong>to</strong>riesof mass spectral data specific <strong>to</strong> marine metabolites, the identity of the compoundswas investigated only by comparing the mass spectra and the Kovats retentionindices <strong>to</strong> those deposited in publicly available databases (MassBase, Pherobase,Lucero Library and the free limited NIST database in the MS Search Program andAMDIS). Identifications were based on a minimum of 80% similarity of massfragments. Using the Retention Index Calcula<strong>to</strong>r (Lucero et al., 2009), plantvolatiles with the nearest Kovats Index (KI) <strong>to</strong> that of the compounds in thesamples were retrieved. The Kovats index used in the RI Calcula<strong>to</strong>r is based on aDB5 column similar <strong>to</strong> HP-5MS used in this study. The Lucero KI basedidentification was verified with the mass spectra and KIs listed in Pherobase.Comparison with mass spectra of compounds found in Portieria in the literature(Egorin et al., 1997; Barahona and Rorrer, 2003; Andrianasolo et al., 2006) did notreveal any positive identification. Examination of mass fragments did not show anysimilarity of components with that of halomon‘s mass spectral fragments asreported by Egorin et al. (1997).
152 CHAPTER 6Fig. 6.2. Phylogenetic tree reconstructed using Bayesian inference based on the cox2-3 gene of Portieria specimenscollected from Batanes (B) and Visayas (V) Islands in the Philippines. Branch support (posterior probabilities) ≥0.5 are indicated at the branches. The eleven clades represent cryptic species. Species B34 and B38 were notincluded in the chemical analysis.
Variability of non-polar secondary metabolites 1536.3.3 Metabolite FingerprintingVariation <strong>be</strong>tween life stagesPlants used for this study <strong>be</strong>longed <strong>to</strong> a single species V1B (Fig. 6.2. ) andwere collected on the same day from a single site in Bantayan, Dumaguete. A <strong>to</strong>talof 202 non-polar compounds were detected from a 67 min GC-MS running time ofgame<strong>to</strong>phytes and tetrasporophyte samples (Fig. S6.2). Using an external standardand the databases, we confirm the presence of β-myrcene in the samples. Thismonoterpene occurs first at 6.1863 min (Fig. 6.3. a.). The last peak appeared at38.661 min. Only 11% (22) of the compounds were identified using NIST andMassBase. Based on the NIST and MassBase identifications, 5 compounds weremonoterpenes. Examination of the patterns of parent ions showed 10 halogenatedcompounds containing 1 Cl, 1 Br or 1Cl and 1 Br. Two hundred compounds hadKovats Index ranging from 993-1969. Some peaks with succeeding retention timesshared the same KI but had a different mass spectra composition. NIST andMassBase did not share the same identification of peaks except for β-myrcene.KI for the last two peaks were not computed since it occurred later than the lastalkane standard (C20 at 31.226 min) that was used for KI calculation. We alsoexplored the potential of the Lucero library and Pherobase <strong>to</strong> identify compoundsthat Portieria might have in common with land plants.The Lucero library in the RI Calcula<strong>to</strong>r retrieved the nearest KIs of plantvolatiles. Some of these identifications were verified at Pherobase, but mass spectracomposition of the unidentified peaks was not similar <strong>to</strong> the spectra of thecompound name retrieved from the database. Furthermore, we also tried <strong>to</strong> retrievecompounds with a certain KI and examined the corresponding spectra. β-myrcenehas a KI of 993.543 in this study. Pherobase listed 991 and 994 as KIs forβ-myrcene in a DB5 column. Nine compounds listed in the database have a KI of993.
154 CHAPTER 6Fig. 6.3. Portion of GC-MS <strong>to</strong>tal ion chroma<strong>to</strong>grams of non-polar extracts of Portieria samples (a) malegame<strong>to</strong>phyte from Bantayan (Dumaguete), V1 (b) White Beach, Batanes, B21 (c) Liloan, V32. β-myrcene, aprecursor of many halogenated monoterpenes, was detected only in the Bantayan specimens. Naphthalene is usedas an internal standard.The Lucero library lists KI 993 for β-myrcene. With the large num<strong>be</strong>r ofmetabolites retrieved, this method of verification proved cum<strong>be</strong>rsome especiallysince Pherobase currently does not allow au<strong>to</strong>mated mass spectral and kovat indicescomparison. Of the 202 compounds detected, 155 compounds were present in thefemale samples, 102 in male plants and 106 in tetrasporophytes (Fig. 6.4a). Therewere 55 compounds that were shared by all life stages. Sixty-three compounds werefound exclusively in female game<strong>to</strong>phyte extracts, 15 in male game<strong>to</strong>phyte extracts,and 18 in tetrasporophyte extracts. There were 14 compounds common <strong>to</strong> maleand tetrasporophyte extracts. The male and female game<strong>to</strong>phyte shared 18compounds while female and tetrasporophyte shared 19 compounds. A precursorcompound of the monoterpenes, myrcene, was detected in all of the life stages butnot in all replicates.We applied a principal component analysis (PCA) on the standardizedrelative abundances <strong>to</strong> determine if metabolites differ among life stages (Fig. 6.5a).
Variability of non-polar secondary metabolites 155The matrix contained 202 compounds (active variables) and 10 samples (activecases: six female game<strong>to</strong>phytes, 2 male game<strong>to</strong>phytes, and 2 tetrasporophytes). Fig.6.5a shows the projection of the cases on the fac<strong>to</strong>r plane. Fac<strong>to</strong>r 1 and fac<strong>to</strong>r 2accounts for 20.42% and 14.37% of the variation, respectively. Fac<strong>to</strong>r 1 clearlydiscriminates the male game<strong>to</strong>phyte samples. The game<strong>to</strong>phyte and tetrasporophytesamples are partially separated. Fac<strong>to</strong>r 2 does not discriminate <strong>be</strong>tween life stagesbut points <strong>to</strong>wards additional variation within life stages.Fig. 6.4. Frequency distribution indicating num<strong>be</strong>r of shared and unique non-polar secondary metabolites.within life-his<strong>to</strong>ry stages of Bantayan specimens (b) species V32 of the Visayas specimens.(a)Variation <strong>be</strong>tween cryptic speciesA <strong>to</strong>tal of 67 compounds were detected from 9 samples (3 technicalreplicates) in a 67 minute GC-MS running time (Table S6.3).These samples <strong>be</strong>longed <strong>to</strong> 5 species, as determined by DNA sequenceanalysis. A sample consists of pooled extract of 8 individuals <strong>be</strong>longing <strong>to</strong> onespecies as verified by DNA analysis. β-myrcene was not detected in the samples(Fig. 6.3. b). The first compound appeared later at 8.112 min, and the last peakappeared at 50.7731 min. The three databases used (NIST, MassBase, Lucerolibrary) did not give identical identifications of compounds. NIST identified 4compounds appearing at different times as 3-Hexanone, 2, 2-dimethyl. Comparisonof mass spectra with MassBase resulted in the retrieval of straight and branchedalkanes and alkenes. Compounds with retention times from 8.1122 <strong>to</strong> 30.6929 minhad retention indices from 1065 <strong>to</strong> 1965. No KIs were computed for the rest of thecompounds. Comparison of computed retention indices with those in Lucerolibrary, component compounds from this batch of samples contained
156 CHAPTER 6monoterpenes, sesquiterpenes, esters, fatty acids and alcohols. NIST, MassBase andthe Lucero databases did not share the same identification of compounds. Visualexamination of parent ions showed only 2 compounds <strong>to</strong> <strong>be</strong> halogenatedcontaining either 1 Cl or 1 Br.The num<strong>be</strong>r of compounds detected varied <strong>be</strong>tween the 5 species (Table6.1) and among biological replicates. Species B35 had the highest num<strong>be</strong>r ofcompounds, 60 out of the <strong>to</strong>tal 67 detected. Species 21 had the least num<strong>be</strong>r ofcompounds (49). Species B33 had 51 compounds detected in its samples. SpeciesB8 and B5 both had 57 compounds detected. There were 21 compounds that weredetected in all of the 9 samples while 33 compounds were present in all 5 species.Unique compounds were only found in species B33 (peak at 43.7727min and basepeak 85mz) and B8 (peak at 44.3901min and base peak 85mz) (Table 6.1).To detect distinct groupings, we conducted a principal component analysisusing the standardized relative abundances of the 9 samples using the 67compounds as variables (Fig. 6.5b). The first principal axis accounted for 27.4% ofthe variance while the second 16.0%. Plotted scores from PCA did not showdistinct interspecific clusters. The largest variation was displayed by specimens<strong>be</strong>longing <strong>to</strong> species 5.
Variability of non-polar secondary metabolites 157Fig. 6.5. Principal component analysis of GC-MS standardized relative abundance datasets which includes thecompounds detected in a 67-minute run of Portieria extracts. (a) Male game<strong>to</strong>phyte (M1-2) samples are clearlydiscriminated occurring at the positive end of the plane while female game<strong>to</strong>phyte (F2-7) and tetrasporophytesamples (T1-2) are only partially discriminated by Fac<strong>to</strong>r 1. (b) Batanes dataset includes 5 cryptic species. Theclustering of B35 replicates and the scattered pattern of B5 suggest variation in component compounds exists<strong>be</strong>tween species but at the same time suggested that variation within species can occur.
158 CHAPTER 6Table 6.1. Frequency of compounds that are unique <strong>to</strong> or common <strong>to</strong> several species of Portieria found in Batanes.Values in parenthesis indicate <strong>to</strong>tal num<strong>be</strong>r of compounds found in a species, while 1 indicates presence and 0absence of a compound.B21(49)B33(51)B35(60)B8(57)B5(57)Frequency(67)0 0 0 1 0 10 0 1 1 0 30 0 1 1 1 30 1 0 0 0 10 1 0 1 0 20 1 1 1 0 10 1 1 1 1 71 0 1 0 1 31 0 1 1 0 21 0 1 1 1 41 1 0 0 1 21 1 0 1 1 11 1 1 0 1 41 1 1 1 1 33Spatial and Temporal VariationSix sites in the Visayas were sampled from 2007 <strong>to</strong> 2009: Sawang,Pagubagubaan, Dapdap, Sia<strong>to</strong>n, Liloan and Bantayan (Dumaguete). The two lattersites were sampled only once and twice, respectively. The objective was <strong>to</strong>determine if seasonality or geography explained the variation in secondarymetabolites. Our DNA analyses showed that the Portieria specimens from thesesites <strong>be</strong>long <strong>to</strong> 4 cryptic species (V1A, V1B, V26, and V32) (Fig. 6.2. ). Samplesfrom Sawang, Pagubagubaan, and Liloan can <strong>be</strong> classified as one species (V32).Dapdap and Dumaguete specimens <strong>be</strong>long <strong>to</strong> species V1A and V1B, respectively.Two species (V1A & V26) were found in Sia<strong>to</strong>n, but for this experiment, it was notpossible <strong>to</strong> distinguish the samples in<strong>to</strong> species. Our geographical and seasonalanalyses on the datasets <strong>to</strong>ok the DNA results in consideration. Spectconnectanalysis included GC-MS profile of 44 Portieria extracts from 6 sites. A <strong>to</strong>tal of 33compounds were detected from these samples (Table 6.2). β-myrcene was also notdetected (Fig. 6.3. c). The first peak appeared later at 8.1118 min while the last peakappeared at 47.6237 min. As in previous datasets, the three databases (NIST,MassBase, Lucero library) used did not result in identical identifications of
Variability of non-polar secondary metabolites 159compounds. Comparison of mass spectra with MassBase resulted in the retrieval ofstraight and branched alkanes and alkenes. Eleven compounds with retention times8.1118 <strong>to</strong> 30.4069 min had Kovats indices from 1065 <strong>to</strong> 1950. The rest of thecompounds had longer retention times than the last alkane (icosane, C20) in thestandard at 31.4226 min. Hence no KIs were computed. The comparison ofcomputed retention indices with those in Lucero library retrieved compoundswhich are monoterpenes, sesquiterpenes, esters and fatty acids. NIST libraryidentified 2 compounds appearing at different times as 3-hexanone, 2, 2-dimethyland one as disilane. Visual examination of parent ions showed no hints ofhalogenated compounds. To detect distinct groupings, we conducted principalcomponents analysis using the standardized relative abundance file fromSpectconnect of all the 44 samples using the 33 compounds as variables (Fig. 6.6a).
160 CHAPTER 6Table 6.2. Compound peaks detected from GC-MS analysis of samples used for evaluation of temporal and spatialpatterns of non-polar metabolites of 3 cryptic species of P. hornemannii found in the Visayas. Identifications basedon comparison of either Kovats Indices (KI) of compounds retrieved from the Retention Index Calcula<strong>to</strong>r (Luceroet al. 2009) or mass spectral comparison of compounds retrieved from NIST or MassBase. Asterisk (*) indicatescompounds with parent ions showing halogenated mass spectral patterns.KI based IDMass spectra based ID# Sample Base Peak RT KI Nearest KI Lucero et al. 2008 Massbase1 3A 57 8.1118 1065 1062 y-terpinene undecane2 15A 57 14.556 1285 1286 borneol acetate 1-nonene3 9A 57 14.556 1285 1286 borneol acetate pentacosane4 29A 57 20.3128 1500 1499 a-muurolene tricosane5 15B 71 20.5458 1510 1509 β-bisabolene 3-ethylpentane6 15A 57 25.186 1705 1686 8-cedren-13-ol -7 34A 57 25.4206 1716 1735 oplopanone -8 15B 71 26.6674 1772 1761 <strong>be</strong>nzyl-<strong>be</strong>nzoate 2-methylbutane9 15A 57 27.8534 1827 1827 isopropyl tetradecanoate10 44BB 71 30.0015 1930 1927 methyl hexadecanoate docosane11 8B 57 30.4069 1950 1927 methyl hexadecanoate12 15B 71 31.6111 - - - -13 15A 57 31.8326 - - - -14 15B 57 31.8342 - - - 1,4-dimethylhexane15 44BA 71 34.1535 - - - docosane16 15B 71 34.2967 - - - 3-ethylpentane17 15A 57 34.76 - - - 1-octene18 15A 71 35.4496 - - - 2-methylbutane19 15B 57 35.5757 - - - -20 15B 57 35.5757 - - - 2,2-dimethylbutane21 44BA 71 37.9407 - - - docosane22 15B 410 38.2743 - - - -23 15A 71 39.3484 - - - 3-ethylhexane24 15A 71 40.0877 - - - 2,2-dimethylbutane25 15A 71 40.0981 - - - <strong>be</strong>ta-Aminopropionitrile26 15B 71 42.5358 - - - 2-methylbutane27 15B 57 43.9626 - - - 4-methyloctane28 44C 71 44.6454 - - - -29 15A 57 45.2255 - - - 2,2-dimethylbutane
Variability of non-polar secondary metabolites 161Table 6.2. Continued.30 15A 71 47.3529 - - - -31 15B 57 47.3534 - - - -32 15B 57 47.3581 - - - 2,4-dimethylpentane33 15A 71 47.6237 - - - 2,4-dimethylhexaneThe first and second principal component accounted for 17.87% and 17.78% of thevariance, respectively. No clear groupings could <strong>be</strong> deduced based on species,sampling period, or sampling site. Most of the samples clumped except for 2Bantayan and 1 Sia<strong>to</strong>n samples which were clearly separated from the rest. A PCAexcluding the 3 samples slightly spread the rest of the samples but likewise did notshow any recognizable clusters (a). This time, the first and second principalcomponent accounted for 19.15% and 13.98% of the variance, respectively. Theanalysis showed that same species samples occur widespread on the axes and didnot show any pattern based on site or period of collection. A separate PCA analysiswas conducted on samples <strong>be</strong>longing <strong>to</strong> the same species, i.e. species V32 fromSawang, Pagubagubaan, and Liloan (Fig. 6.6b). The first and second principalcomponents accounted 21.36% and 14.96% of the variance, respectively. Noclusters based on site or period of collection were detected from this analysis.
162 CHAPTER 6Fig. 6.6. Principal component analysis of GC-MS standardized relative abundance datasets for detecting possiblespatial and temporal patterns in (a) the Visayas species (b) the Visayas samples <strong>be</strong>longing <strong>to</strong> species V32. Lettersindicate sampling site (DAP: Dapdap; PAG: Pagubagubaan; SAW: Sawang; SIA: Sia<strong>to</strong>n) and num<strong>be</strong>rs indicatemonth and year of sampling.
Variability of non-polar secondary metabolites 1636.4 DiscussionDistribution of secondary metabolites in marine macroalgae exhibitmacroscale and microscale patterns (Pelletreau and Targett 2008). Macroscalepatterns include global patterns within or across algal taxa, patterns within a specifichabitat, and patterns correlated with biotic and abiotic fac<strong>to</strong>rs. Microscale patternsare related <strong>to</strong> molecular and biochemical processes within an algal thallus, thespatial distribution of compounds within an algal thallus and temporal responses(short- and long-term responses). In Portieria macro- or microscale patterns ofsecondary metabolite variation has not <strong>be</strong>en fully explored. Three decades ofstudies have <strong>be</strong>en dedicated <strong>to</strong> the isolation of new compounds. Only two studieshave attempted <strong>to</strong> understand variation of these compounds, mainly focusing ontarget monoterpenes (och<strong>to</strong>dene; Apakaoch<strong>to</strong>dene A and B) (Puglisi and Paul,1997; Matlock et al., 1999). The present study aimed <strong>to</strong> understand the variation ona macroscale level. It is now clear that P. hornemannii is not a single species butharbors genetically distinct entities that can <strong>be</strong> classified as cryptic species.While most studies focusing on marine secondary metabolites attempt <strong>to</strong>address variation of a single compound, this study has focused on the non-polarsecondary metabolites of Portieria as a whole. However, a possible drawback related<strong>to</strong> the preceding method is the fact that the compounds are not mutuallyindependent but their relative presences are linked by biological pathways. Forexample, the presence of myrcene, which is the likely precursor of manymonoterpenes (Wise et al., 2002), influences the presence or absence of otherhalogenated monoterpene components. Hence <strong>to</strong> understand general or specificmetabolite patterns might also require knowledge of the presence and absence ofprogeni<strong>to</strong>r component compounds. For the purposes of this study, the use of entirespectra using metabolite fingerprinting has proven <strong>to</strong> <strong>be</strong> a pragmatic method forgaining a broader view of secondary metabolite patterns in this alga.Reports on intraspecific variation of secondary metabolites in macroalgaehave <strong>be</strong>en based on variations within individuals, <strong>be</strong>tween individuals of apopulation and among geographically isolated populations (Thorn<strong>be</strong>r et al., 2006;Verges et al., 2008). Our results suggest substantial intraspecific variation among thelife-his<strong>to</strong>ry stages of Portieria. Male game<strong>to</strong>phytes form a clearly distinct group,while a partial discrimination was detected <strong>be</strong>tween female game<strong>to</strong>phytes andtetrasporophytes. Furthermore, our results show that female game<strong>to</strong>phytes arechemically richer in terms of the num<strong>be</strong>r of secondary metabolites. It is possiblethat such higher num<strong>be</strong>r of metabolites is due <strong>to</strong> the combined deterrent effects of
164 CHAPTER 6such compounds on grazers as part of the maternal protection it provides <strong>to</strong> thecarposporophyte. Many of the compounds detected appear <strong>to</strong> occur exclusively <strong>to</strong> acertain life-his<strong>to</strong>ry stage while a relatively small group of compounds is sharedamong life-his<strong>to</strong>ry stages. Evidence of secondary metabolite variation within lifehis<strong>to</strong>rystages has also <strong>be</strong>en observed in another red alga (Asparagopsis armata) andmore recently in a brown alga (Dictyota menstrualis) (Verges et al., 2008; Cavalcanti etal., 2010). Similar <strong>to</strong> our study, male game<strong>to</strong>phytes of A. armata were found <strong>to</strong> havelower concentration of the secondary metabolite (bromoform) compared <strong>to</strong> thefemale game<strong>to</strong>phyte. It has also <strong>be</strong>en observed that the carposporophyte phase A.armata was the least consumed life-his<strong>to</strong>ry phase by the seahare, Aplysia parvula(Verges et al., 2008). Likewise, in the brown alga Dictyota menstrualis, femalegame<strong>to</strong>phytes were found <strong>to</strong> produce more diterpenes compared of the otherstages.Comparative analyses of the 5 cryptic species from Batanes (B5, B21, B33,B35, and B8) showed variation <strong>be</strong>tween, as well as within species. Intraspecificvariation is even more pronounced in the Visayas dataset. Neither species specificnor spatio-temporal patterns were evident. In addition, a separate PCA includingonly specimens of species V32 (Fig. 6.4b) did not elucidate patterns based oncollection site or period. The results suggest that life-his<strong>to</strong>ry caused variationscombined with microscale fac<strong>to</strong>rs have a large influence on the variation withinPortieria species. Pelletreau and Targett (2008) pointed out that the existence ofinducible and activated defenses complicates the search for universal patterns ofsecondary metabolites and continues <strong>to</strong> highlight the importance of localizedphenomena.Finally, there was difficulty in achieving unequivocal identification ofcompounds in this study unveiling the need for mass spectral and KI databasesdedicated solely <strong>to</strong> marine secondary metabolites. Such reposi<strong>to</strong>ries will assist in theidentification of previously reported compounds for investigations mainly focusedon rapid detection and understanding of chemical patterns in marine organisms. Indoing so, future studies will not just <strong>be</strong> focused in isolating and naming novelcompounds as had <strong>be</strong>en the trend in Portieria but will also seek <strong>to</strong> answer questionsthat are of biological or ecological in nature. Furthermore, the presence of crypticspecies in P. hornemannii highlights the need <strong>to</strong> genotype organisms. In this way, thecorrect species that produced a chemical of interest can <strong>be</strong> tracked down insucceeding studies.
Variability of non-polar secondary metabolites 1656.5 AcknowledgementsThe authors are grateful <strong>to</strong> Abner Bucol, Zacharias Generoso and Jacinta Lucañas ofIEMS- Silliman University for field assistance, Batanes MENRO Francis Domingo for fieldand dive assistance, Renaat Dasseville for the valuable technical assistance on GC-MS,Frederik Lynen and his lab for the helpful suggestions and access <strong>to</strong> GC-MS and HPLCmachines during the explora<strong>to</strong>ry period of the chemical analysis. Funding for this researchwas provided by the Flemish Interuniversity Council (VLIR) as part of the PhD Grant <strong>to</strong>D.A. Payo.
166 CHAPTER 6
Variability of non-polar secondary metabolites 1676.6 ReferencesAndrianasolo, E.H., France, D., Cornell-Kennon, S., Gerwick, W.H., 2006. DNA methyl transferaseinhibiting halogenated monoterpenes from the Madagascar red marine alga Portieriahornemannii. J. Nat. Prod. 69, 576-579.Barahona, L.F., Rorrer, G.L., 2003. Isolation of halogenated monoterpenes from bioreac<strong>to</strong>r-culturedmicroplantlets of the macrophytic red algae Och<strong>to</strong>des secundiramea and Portieria hornemannii. J.Nat. Prod. 66, 743.Bhadury, P., Wright, P.C., 2004. Exploitation of marine algae: biogenic compounds for potentialantifouling applications. Planta 219, 561-578.Bhat, S.V., Nagasampagi, B.A., Sivakumar, M., 2005. Chemistry of natural products. Narosa PubHouse.Blunt, J.W., Copp, B.R., Hu, W.P., Munro, M.H.G., Northcote, P.T., Prinsep, M.R., 2007. Marinenatural products. Nat. Prod. Rep. 24, 31-86.Bourgaud, F., Gravot, A., Milesi, S., Gontier, E., 2001. Production of plant secondary metabolites: ahis<strong>to</strong>rical perspective. Plant Sci. 161, 839-851.Burreson, B.J., Woolard, F.X., Moore, R.E., 1975a. Chondrocole A and B, two halogenateddimethylhexahydro<strong>be</strong>nzofurans from the red alga (mertens) schmitz. Tetrahedron Lett. 16,2155-2158.Burreson, B.J., Woolard, F.X., Moore, R.E., 1975b. Evidence for the biogenesis of halogenatedmyrcenes from the red alga Chondrococcus hornemanni. Chem. Lett. 4, 1111-1114.Cavalcanti, D.N., de Oliveira, M.A.R., De-Paula, J.C., Barbosa, L.S., Fogel, T., Pin<strong>to</strong>, M.A., de PalmerPaixão, I.C.N., Teixeira, V.L., 2010. Variability of a diterpene with potential anti-HIVactivity isolated from the Brazilian brown alga Dictyota menstrualis. J. Appl. Phycol., 1-4.Coll, J.C., Wright, A.D., 1987. Tropical marine algae. 1. New halogenated monoterpenes fromChondrococcus hornemannii (Rhodophyta, Gigartinales, Rhizophyllidaceae). Aust. J. Chem. 40,1893-1900.Coll, J.C., Wright, A.D., 1989. Tropical marine algae. 6. New monoterpenes from several collectionsof Chondrococcus hornemannii (Rhodophyta, Gigartinales, Rhizophyllidaceae). Aust. J. Chem. 42,1983-1993.De Clerck, O., Gavio, B., Fredericq, S., Cocquyt, E., Coppejans, E., 2005. Systematic reassessment ofthe red algal genus Phyllymenia (Halymeniaceae, Rhodophyta). Eur. J. Phycol. 40, 169-178.Dworjanyn, S.A., De Nys, R., Stein<strong>be</strong>rg, P.D., 1999. Localisation and surface quantification ofsecondary metabolites in the red alga Delisea pulchra. Mar. Biol. 133, 727-736.Egorin, M.J., Rosen, D.M., Benjamin, S.E., Callery, P.S., Sentz, D.L., Eiseman, J.L., 1997. In vitrometabolism by mouse and human liver preparations of halomon, an antitumor halogenatedmonoterpene. Cancer Chemother. Pharmacol. 41, 9-14.Fenical, W., 1975. Halogenation in the Rhodophyta: a review. J. Phycol 11, 245-259.Fiehn, O., 2002. Metabolomics - the link <strong>be</strong>tween genotypes and phenotypes. Plant Mol. Biol. 48, 155-171.Fiehn, O., Kind, T., 2006. Metabolite profiling in blood plasma. In: Weckwerth, W. (Ed.), Methods inMolecular Biology, Metabolomics: Methods and Pro<strong>to</strong>cols. Humana Press, To<strong>to</strong>wa, NJ, pp.3-17.Fuller, R.W., Cardellina, J.H., Jurek, J., Scheuer, P.J., Alvaradolindner, B., McGuire, M., Gray, G.N.,Steiner, J.R., Clardy, J., Menez, E., Shoemaker, R.H., Newman, D.J., Snader, K.M., Boyd,M.R., 1994. Isolation and structure activity features of halomon-related antitumormonoterpenes from the red alga Portieria hornemannii. J. Med. Chem. 37, 4407-4411.Fuller, R.W., Cardellina, J.H., Ka<strong>to</strong>, Y., Brinen, L.S., Clardy, J., Snader, K.M., Boyd, M.R., 1992. Apentahalogenated monoterpene from the red alga Portieria hornemannii produces a novelco<strong>to</strong><strong>to</strong>xicity profile against a diverse panel of human tumor cell lines. J. Med. Chem. 35,3007-3011.
168 CHAPTER 6Gribble, G.W., 2003. The diversity of naturally produced organohalogens. Chemosphere 52, 289-297.Guindon, S., Dufayard, J.F., Hordijk, W., Lefort, V., Gascuel, O., 2009. PhyML: fast and accuratephylogeny reconstruction by maximum likelihood. Infect Genet Evol 9, 384-385.Gunatilaka, A.A.L., Paul, V.J., Park, P.U., Puglisi, M.P., Gitler, A.D., Eggles<strong>to</strong>n, D.S., Haltiwanger,R.C., Kings<strong>to</strong>n, D.G.I., 1999. Apakaoch<strong>to</strong>denes A and B: two tetrahalogenatedmonoterpenes from the red marine alga Portieria hornemannii. J. Nat. Prod 62, 1376-1378.Hall, T.A., 1999. BioEdit: a user-friendly biological sequence alignment edi<strong>to</strong>r and analysis programfor Windows 95/98/NT. Nucl. Acids. Symp. Ser 41, 95-98.Hay, M.E., Fenical, W., 1996. Chemical ecology and marine biodiversity: insights and products fromthe sea. Oceanography 9.Higa, T., 1985. 2-(1-chloro-2-hydroxyethyl)-4, 4-dimethylcyclohexa-2, 5-dienone: a precursor of 4, 5-dimethyl<strong>be</strong>nzo [b] furan from the red alga Desmia hornemanni. Tetrahedron Lett. 26, 2335-2336.Huelsen<strong>be</strong>ck, J.P., Ronquist, F., 2001. MRBAYES: Bayesian inference of phylogenetic trees.Bioinformatics 17, 754-755.Ichikawa, N., Naya, Y., Enomo<strong>to</strong>, S., 1974. New halogenated monoterpenes from Desmia(Chondrococcus) hornemanni. Chem. Lett. 3, 1333-1336.Ichikawa, N., Naya, Y., Enomo<strong>to</strong>, S., 1975. Halogenated monoterpene derivatives from Desmia(Chondrococcus) japonicus. Proceedings of the Japan Academy 51, 562-565.Kamenarska, Z., Ivanova, A., Stancheva, R., S<strong>to</strong>yneva, M., Stefanov, K., Dimitrova-Konaklieva, S.,Popov, S., 2006. Volatile compounds from some Black Sea red algae and theirchemotaxonomic application. Bot. Mar. 49, 47-56.Ka<strong>to</strong>h, K., Misawa, K., Kuma, K.-i., Miyata, T., 2002. MAFFT: a novel method for rapid multiplesequence alignment based on fast Fourier transform. Nucl. Acids Res. 30, 3059-3066.Kladi, M., Vagias, C., Roussis, V., 2004. Volatile halogenated metabolites from marine red algae.Phy<strong>to</strong>chem. Rev. 3, 337-366.Kuniyoshi, M., Oshiro, N., Miono, T., Higa, T., 2003. Halogenated monoterpenes having acyclohexadienone from the red alga Portieria hornemanni. J. Chin. Chem. Soc. 50, 167-170.Lucero, M., Estell, R., Tellez, M., Frederickson, E., 2009. A retention index calcula<strong>to</strong>r simplifiesidentification of plant volatile organic compounds. Phy<strong>to</strong>chem. Anal. 20, 378.Matlock, D.B., Ginsburg, D.W., Paul, V.J., 1999. Spatial variability in secondary metabolite productionby the tropical red alga Portieria hornemannii. Hydrobiologia 399, 267-273.McGovern, T.M., Hell<strong>be</strong>rg, M.E., 2003. Cryptic species, cryptic endosymbionts, and geographicalvariation in chemical defences in the bryozoan Bugula neritina. Mol. Ecol. 12, 1207-1215.Meyer, M.R., 2010. Au<strong>to</strong>mated mass spectral deconvolution and identification system for GC-MSscreening for drugs, poisons, and metabolites in urine. Clin. Chem. 56, 1-10.Miller, K., Alvarez, B., Battershill, C., Northcote, P., Parthasarathy, H., 2001. Genetic, morphological,and chemical divergence in the sponge genus Latrunculia (Porifera: Demospongiae) fromNew Zealand. Mar. Biol. 139, 235-250.Pelletreau, K.N., Targett, N.M., 2008. New perspectives for addressing patterns of secondarymetabolites in marine macroalgae. Algal Chemical Ecology, 121-146.Pietra, F., 2002. Biodiversity and Natural Product Diversity. Pergamon, Tren<strong>to</strong>.Posada, D. 2008. jModelTest: Phylogenetic Model Averaging. Mol. Biol. Evol. 25:1253-1256.Puglisi, M.P., Paul, V.J., 1997. Intraspecific variation in the red alga Portieria hornemannii: monoterpeneconcentrations are not influenced by nitrogen or phosphorus enrichment. Mar. Biol. 128,161-170.Rambaut, A., Drummond, A.J., 2007. Tracer v1.4.Available free from http://<strong>be</strong>ast.bio.ed.ac.uk/Tracer.Smit, A.J., 2004. Medicinal and pharmaceutical uses of seaweed natural products: a review. J. Appl.Phycol. 16, 245-262.Styczynski, M.P., Moxley, J.F., Tong, L.V., Walther, J.L., Jensen, K.L., Stephanopoulos, G.N., 2007.Systematic identification of conserved metabolites in GC/MS data for metabolomics andbiomarker discovery. Anal. Chem. 79, 966-973.
Variability of non-polar secondary metabolites 169Thorn<strong>be</strong>r, C., Stachowicz, J.J., Gaines, S., 2006. Tissue type matters: selective herbivory on differentlife his<strong>to</strong>ry stages of an isomorphic alga. Ecology 87, 2255-2263.Verges, A., Paul, N.A., Stein<strong>be</strong>rg, P.D., 2008. Sex and life-his<strong>to</strong>ry stage alter herbivore responses <strong>to</strong> achemically defended red alga. Ecology 89, 1334-1343.Williams, D.H., S<strong>to</strong>ne, M.J., Hauck, P.R., Rahman, S.K., 1989. Why are secondary metabolites (naturalproducts) biosynthesized? J. Nat. Prod. 52, 1189-1208.Wise, M.L., 2003. Monoterpene biosynthesis in marine algae. Phycologia 42, 370-377.Wise, M.L., Rorrer, G.L., Polzin, J.J., Croteau, R., 2002. Biosynthesis of marine natural products:isolation and characterization of a myrcene synthase from cultured tissues of the marine redalga Och<strong>to</strong>des secundiramea. Arch. Biochem. Biophys. 400, 125-132.Woolard, F.X., Moore, R.E., Mahendran, M., Sivapalan, A., 1976. (-)-3-Bromomethyl-3-chloro-7-methyl-1, 6-octadiene from Sri Lankan Chondrococcus hornemanni. Phy<strong>to</strong>chemistry 15, 1069-1070.Wright, A.D., Konig, G.M., Sticher, O., De Nys, R., 1991a. Five new monoterpenes from the marinered alga Portieria hornemannii. Tetrahedron 47, 5717-5724.Wright, A.D., König, G.M., Sticher Rocky, O., 1991b. Five new monoterpenes from the marine redalga Portieria hornemannii. Tetrahedron 47, 5717-5724.Zuccarello, G.C., Burger, G., West, J.A., King, R.J., 1999. A mi<strong>to</strong>chondrial marker for red algalintraspecific relationships. Mol. Ecol. 8, 1443-1447.
6.7 Supplementary tablesTable S6.1. List of compounds isolated from Portieria (syn. Desmia and Chondrococcus) hornemannii, based on previousstudies.Reference Cpd # Name mol.formula(Ichikawa etal., 1974)Description1 myrcene C10H16 acyclic halogenatedmonoterpeneSpecimensourceAmami Is., Japan2 7-chloro-myrcene C10H15Cl " "3 7-bromo-myrcene C10H15Br " "4 (Z)-10-bromo-myrcene C10H15Br " "5 (E)-10-bromo-myrcene C10H15Br " "6 (Z)--10-bromo-7-chloromyrcene7 (E)-10-bromo-7-chloromyrcene8 3-chloro-7, (Z)-10-dibromomyrcene9 (Z)-10-chloro-3,7-dibromomyrceneC10H14BrCl " "C10H14BrCl " "C10H13Br2Cl " "C10H13Br2Cl " "10 3-bromo-7-chloro-myrcene C10H14BrCl " "11 7-bromo-10-chloro-myrcene C10H14BrCl " "12 - C10H15Br cyclic halogenatedmonoterpene"(Burreson etal., 1975a)(Burreson etal., 1975b)1 chondrocole A C10H14BrClO " Hawaii2 chondrocole B C10H14BrClO " Hawaii3 - C10H15Cl3Br2 acyclic halogenatedmonoterpeneBlack Point,Oahu, Hawaii4 - C10H16Cl3Br " "5 - C10H15Cl2Br " "6 - C10H16Cl2Br2 " HalonaBlowhole Is,Oahu, Hawaii10 - C10H16Cl2Br2 acyclic halogenatedmonoterpene"11 6-bromo-2-chloromyrcene C10H15ClBr " Black Point,Oahu, Hawaii12 chondrocole c C10H14Br2O cyclic halogenatedmonoterpene"13 - C10H15Cl3Br2 acyclic halogenatedmonoterpeneHawaii14 Z-3-bromomethylene-7-methyl-1,6-octadieneC10H16ClBr2 " HalonaBlowhole Is,Oahu, Hawaii170
Variability of non-polar secondary metabolites in the red alga Portieria 171Table S6.1. Continued15 - C10H14Br2Cl2 cyclic halogenatedmonoterpene"(Ichikawa etal., 1975)1 myrcene C10H16 acyclic halogenatedmonoterpene2 7-chloro-myrcene C10H15Cl " "Kada Coast,Wakayama Pref.,Japan3 7-bromo-myrcene C10H15Br " "4 3,7-dichloro-myrcene C10H14Cl2 " "(Woolard etal., 1976)(Higa, 1985)5 (Z)-10-bromo-3-methoxy-αmyrceneC11H17OBr " "6 (E)-10-bromo-3-methoxy-αmyrceneC11H17OBr " "7 3-bromo-7-chloro-myrcene C10H14BrCl " "8 (Z)-10-bromo-1-methoxymyrcene9 (E)-10-bromo-1-methoxymyrcene(-)-3-bromomethyl-3-chloro-7-methyl-1, 6-octadiene2-(1-chloro-2-hydroxyethyl)-4, 4-dimethylcyclohexa-2, 5-dienone: a precursor of 4, 5-dimethyl<strong>be</strong>nzo [b] furanC11H17OBr " "C11H17OBr " "C10H16BrCl " Trincomalee(Foul Point) SriLanka- - -(Coll andWright,1987)1 (2Z, 6E)- 1, 8- dichloro-3-chloromethyl-7-methylocta-2,6-dieneC10H15Cl3acyclic halogenatedmonoterpeneRib Reef, GreatBarrier Reef,Australia(Coll andWright,1989)(Wright etal., 1991a)2 (E)-1,2-dibromo-3-chloromethylene-7-methyloct-6-ene3 (Z)-1-chloro-3-chloromethyl-7-methylocta-2,6-diene4 (Z)-1,6-dichloro-3-chloromethyl-7-methylocta-2,7-diene5 (2R*, 3(8) E, 4S*, 6R*)-6-bromo-2-chloro-1,4-oxido-3,(8)-och<strong>to</strong>dene6 (2S*, 3(8) E, 4S*, 6R*)-6-bromo-2-chloro-1,4-oxido-3,(8)-och<strong>to</strong>dene(Z)-3-bromo-8-chloro-6-chloromethyl-2-methylocta-1,6-diene (9,6-hydroxymethyl-2-methylocta-2,8-dien-6-ol1 (2Z)-6-bromo-3-chloromethyl-1, 7-dichloro-7-methylocta-2-eneC10H15Br2Cl " "C10H16Cl2 " "C10H15Cl3 " "C10H14BrClOepimeric bicyclicmonoterpeneC10H14BrClO " "- - -C10H16Cl3Bracyclic halogenatedmonoterpene"Nelly Bay,Magnetic Island,Queensland,Australia
172 CHAPTER 6Table S6.1. Continued2 (2Z, 6E)-3-chloromethyl-1-chloroocta-2,6-dien-8-al3 3-methoxymethyl-6-methoxyl-7-methylocta-1,7(10)-dien-3-ol4 (2Z,6S)-3-chloromethyl-1-methylocta-2,7(10)-dien-6-ol5 (2Z,6S)-3-chloromethyl-6-methylocta-2,7(10)-dien-1-olC10H14 OCl2 " "C12H22 O3 " "C11H19 O2Cl " "C11H19 O2Cl " "(Fuller et al.,1992)(Fuller et al.,1994)1 halomon/ 6(R)-bromo-3(S)-(bromomethyl)-7-methyl-2,3,7-trichloro-1-octeneC10H15Br2Cl3acyclic halogenatedmonoterpene2 - C10H13Cl cyclic halogenatedmonoterpene2 isohalomon C10H15Br2Cl3 acyclic halogenatedmonoterpene; isomericwith halomon3 - C10H14BrCl3 acyclic halogenatedmonoterpeneChanaryan,Batan Is.,Batanes,PhilippinesBanilad, Bacong,Negros Oriental,PhilippinesChanaryan,Batan Is.,Batanes,Philippines"4 - C10H14Br2Cl2 " "5 - C10H14Br3Cl cyclic halogenatedmonoterpene"6 - C10H14BrCl3 " "7 - C10H13Cl3 " "8 - C10H15BrCl2 acyclic halogenatedmonoterpene"9 - C10H16Br2Cl2 " "10 - C10H16BrCl " HalonaBlowhole Is,Oahu, Hawaii11 - C10H15BrCl " "(Gunatilakaet al., 1999)12 - C10H14BrCl cyclic halogenatedmonoterpene1 apakaoch<strong>to</strong>dene A/ 6(S*)-bromo-1,4(S*),8(R*)-trichloro-2(Z)-och<strong>to</strong>deneC10H14Cl3Brcyclic halogenatedmonoterpene"Apaka PointBeach, Guam2 apakaoch<strong>to</strong>dene B / 6(S)-bromo-1,4(S), 8(R*)-trichloro-2(E)-och<strong>to</strong>deneC10H14Cl3Brcyclic halogenatedmonoterpeneGun Beach;Double Reef;Pago Bay; Guam(Barahonaand Rorrer,2003)1 myrcene/ 7-methyl-3-methylene-1,6-octadiene2 10E-bromomyrcene/ E-3-bromomethylene-7-methyl-1,6-octadieneC10 H16Oacyclic non-halogenatedmonoterpeneC10H15Br " "microplantletculture, DoubleReef NW Guam
Variability of non-polar secondary metabolites in the red alga Portieria 173Table S6.1. Continued3 10Z-bromomyrcene/ Z-3-bromomethylene-7-methyl-1,6-octadieneC10H15Br " "4 10E-bromo-3-chloro-αmyrcene/C10H14BrCl " "E-3-bromomethylene-6-chloro-1,7-octadiene5 - C10H14Br2 " "6 apakaoch<strong>to</strong>dene B/ 6(S)-bromo-1,4(S), 8(R*)-trichloro-2(E)-och<strong>to</strong>deneC10H14BrCl3cyclic halogenatedmonoterpene"7 - C10 H16O non-halogenatedmonoterpene"8 bromomyrcene isomer C10H15Br halogenated monoterpene "9 7-chloromyrcene / 2-chloro-3-methylene-7-methyl-1,6-octadieneC10H15Cl " "10 C10H14Cl " "11 chloromyrcene derivative C10H16Cl " "12 bromomyrcene isomer C10H15Br " "13 chloromyrcene derivative C10H14Cl " "14 - C10H18Cl2 " "15 - C15H18 O4 sesquiterpene "(Kuniyoshiet al., 2003)5 1,2-dibromooch<strong>to</strong>da-3(8),5-dien-4-oneC22H12Br2Ocyclic halogenatedmonoterpeneCape Zampa,Okinawa, Japan6 1-bromo-2-chlorooch<strong>to</strong>da-3(8),5-dien-4-one7 1,2-dichlorooch<strong>to</strong>da-3(8),5-dien-4-one8 (1Z)-1-bromooch<strong>to</strong>da-1,3(8),5-trien-4-one9 (1Z)-1-chlorooch<strong>to</strong>da-1,3(8),5-trien-4-oneC10H12BrClO " "C10H12Cl2O " Gushichan coast,Okinawa, JapanC10H11BrO " Cape Zampa,Okinawa, JapanC10H11ClO " "Andrianasolo et al. 20061 halomon/ 6(R)-bromo-3(S)-(bromomethyl)-7-methyl-2,3,7-trichloro-1-octeneC10H15Br2Cl3acyclic halogenatedmonoterpene2 - C10H13ClBr " "3 - C10H14Cl2Br " "4 C10H15Br2Cl3 " "Tolagniaro, FortDauphin,Madagascar
174 CHAPTER 6Table S6.2. Compound peaks detected from GC-MS analysis of samples used for characterization of the lifehis<strong>to</strong>ry stages of P. hornemannii. Identifications based on comparison of either Kovats Indices (KI) of compoundsretrieved from the Retention Index Calcula<strong>to</strong>r (Lucero et al. 2009) or mass spectral comparison of compoundsretrieved from NIST or MassBase. Asterisk (*) indicates compounds with parent ions showing halogenated massspectral patterns.# Sample BasePeakRT(min)KI KI based ID Mass spectra based IDNearestKI1 F6_2 93 6.1863 994 993/994 β-myrcene/ 6-methyl-5-hepten-2-olLucero et al. 2009 NIST MassBaseb-myrcene2 T1_1 104 6.5874 1008 1007 α-phellandrene - -3 T1_2 104 6.5909 1008 1007 α-phellandrene - -4 M1_1 91 6.7685 1016 1017 α-terpinene Benzene,tert-butyl-5 F3_3 79 6.9501 1023 1024 r-cymene - -6 M1_2 79 6.9532 1023 1024 r-cymene - -b-myrcene4-methylace<strong>to</strong>phenone7 M1_3 91 7.017 1026 1025 p-cymene carbonic acid 1-phenylpropan-2-one8 M2_2 91 7.021 1026 1025 p-cymene - pro<strong>to</strong>pine9 F3_2 91 7.0387 1027 1025 p-cymene - N-Methyl-Npropagyl<strong>be</strong>nzylamine10 T2_1 57 8.0381 1063 1062 y-terpinene - -11 M2_2 132 8.8894 1089 1089 p-mentha-- -2,4(8)diene12 T2_1 117 9.5127 1110 1099 linalool - -13 F4_3 117 9.8874 1124 1123 chrysanthenone - -14 M1_3 117 9.9855 1128 1127 α-campholenal - -15 M2_2 91 10.2042 1136 1127 α-campholenal - -16 F2_2 91 10.2132 1136 1127 α-campholenal - Dimethirimol17 T2_1 119 10.4565 1145 1145 camphor - Benzimidazole18 M1_1 68 10.8826 1160 1158 isobomeol - -19 F7_3 68 10.8845 1160 1158 isobomeol - -20 T2_1 68 10.8866 1160 1158 isobomeol - -21 F3_3 68 10.8873 1160 1158 isobomeol - -22 F4_1 117 11.3242 1174 1171 ethyl-<strong>be</strong>nzoate - -23 F4_1 50 11.5177 1180 1180 m-cymen-8-ol - -24 T2_2 127 11.5317 1180 1180 m-cymen-8-ol - -
Variability of non-polar secondary metabolites in the red alga Portieria 175Table S6.2. Continued.25 T2_3 134 11.7619 1188 1187 p-cymen-8-ol - -26 M2_2 105 12.0654 1197 1196 methylchavicol - 3-cyanopyridine27 F3_2 57 12.1827 1200 1203.748 n-decanal 3-Hexanone -28 F7_3 113 12.3674 1207 1207 ver<strong>be</strong>none - -29 M1_2 113 12.3831 1208 1207 ver<strong>be</strong>none - -30 T1_3 91 12.3874 1208 1207 ver<strong>be</strong>none - -31 M2_2 93 12.6294 1217 1217 trans-carveol - -32 M1_2 69 12.7588 1222 1219 trans-carveol - -33 M1_1 55 12.8397 1225 1229 nerol - -34 F7_3 67 13.1203 1236 1236 thymol methyl ether - -35 M1_1 79 13.1266 1236 1236 thymol methyl ether - -36 F5_2 93 13.127 1236 1236 thymol methyl ether - Beta-pinene; y-eudesmol37 M2_2 93 13.32 1243 1243 carvone - -38 T1_1 93 13.327 1243 1243 carvone 2-chloropropionyl chloride-39 T2_1 93 13.3305 1243 1243 carvone - -40 F6_2 69 13.6916 1256 1256 geraniol - -*(Br)41 M1_1 91 13.6953 1256 1256 geraniol -42 F2_1 69 13.6967 1256 1256 geraniol -43 F5_1 69 13.6975 1256 1256 geraniol - -44 M2_1 91 13.9837 1266 1263 (E)-2-decenal - N-Methyl-Npropagyl<strong>be</strong>nzylamine45 F7_3 119 14.131 1271 1271 geranial - -46 F2_3 119 14.1354 1271 1271 geranial - -47 F3_2 69 14.4252 1281 1282 a-terpinen-7-al - -48 M2_3 69 14.4368 1281 1282 a-terpinen-7-al - -49 F5_1 91 14.6745 1289 1289 p-cymen-7-ol - -50 T2_1 91 14.68 1289 1289 p-cymen-7-ol - -51 F6_3 149 14.9157 1297 1297 perilla alcohol - Benzoylcholine52 *(Cl)F6_3 131 15.0641 1302 1302 trans-ascaridole - 2-chloro-1-phenyl-2-butene
176 CHAPTER 6Table S6.2. Continued53 F6_1 166 15.3344 1313 1313 2E,4E-decadienal - 2-chloro-1-phenyl-2-butene54 F6_3 81 15.5368 1320 1313 2E,4E-decadienal - -55 M2_2 81 15.5381 1321 1313 2E,4E-decadienal - -56 T1_2 81 15.5481 1321 1313 2E,4E-decadienal - -57 M2_2 67 15.6269 1324 1313 2E,4E-decadienal - 1-Adamantanamine58 M1_2 67 15.6354 1324 1313 2E,4E-decadienal - -59 F3_1 57 15.7447 1329 1339 d-elemene - -60 F2_1 57 15.7649 1329 1339 d-elemene - -61 M2_2 91 15.8827 1334 1339 d-elemene - -62 M1_2 91 15.8885 1334 1339 d-elemene - -63 M2_2 139 16.5157 1357 1357 eugenol - -64 F6_1 115 16.5278 1358 1357 eugenol - -65 M2_3 166 16.5392 1358 1357 eugenol - -66 M2_2 91 17.02 1375 1373 a-ylangene - -67 M2_3 91 17.0254 1376 1373 a-ylangene - -68 M1_2 91 17.0311 1376 1373 a-ylangene - -69 T2_1 127 17.403 1389 1389 isolongifolene - Imidazole-4-acetate70 T2_1 57 17.7476 1400 1399 1,7-di-epi-a-cedrene - -71 M2_2 79 17.7625 1401 1402 methyleugenol - -72 M2_3 127 17.7782 1402 1402 methyleugenol - -73 T2_2 67 18.1041 1415 1415 cis-a-<strong>be</strong>rgarnotene - -74 T1_3 79 18.18 1418 1419 β-caryophyllene - -75 F6_1 79 18.1866 1419 1419 β-caryophyllene - -76 T1_1 79 18.1928 1419 1419 β-caryophyllene Pyridine -77 F5_1 79 18.1934 1419 1419 β-caryophyllene - camphene78 M1_2 79 18.1939 1419 1419 β-caryophyllene - -79 F7_2 212 18.3193 1424 1420 β-caroyophyllene - -*(Br)80 F6_2 210 18.4564 1429 1420 β-caroyophyllene - -81 M2_3 131 18.4673 1430 1420 β-caroyophyllene - -82 M1_1 67 18.5462 1433 1435 trans-a-<strong>be</strong>rgamotene - -83 M1_2 67 18.5503 1433 1435 trans-a-<strong>be</strong>rgamotene - -84 F2_2 133 18.6084 1435 1435 trans-a-<strong>be</strong>rgamotene - -
Variability of non-polar secondary metabolites in the red alga Portieria 177Table S6.2. Continued85 T2_2 69 18.6925 1439 1438 trans-a-<strong>be</strong>rgamotene - -86 F3_3 69 18.6982 1439 1440 a-guaiene - -87 M2_3 69 18.7018 1439 1440 a-guaiene - -88 M1_1 91 18.7475 1441 1440 a-guaiene - -89 F4_2 69 18.8243 1444 1440 a-guaiene - -90 F7_2 69 18.8273 1444 1440 a-guaiene - -91 T1_3 69 18.8306 1444 1440 a-guaiene - -92 F2_2 210 19.1226 1456 1455 a-humulene - -93 F3_3 133 19.3339 1464 1464 a-acoradiene -94 T2_2 105 19.4843 1469 1469 drima-7,9(11)-diene - -95 T2_1 105 19.4852 1469 1469 drima-7,9(11)-diene - -96 F7_2 131 19.4915 1470 1469 drima-7,9(11)-diene - -97 F5_1 91 19.6255 1475 1474 b-cadinene - -98 F6_3 91 19.7468 1479 1479 y-curcurnene -99 F2_1 91 19.7581 1480 1480 germacrene D - -100 F4_1 153 20.0567 1491 1491 cis-β-guaiene - -101 F4_1 153 20.0567 1491 1491 cis-β-guaiene - -102 F3_2 71 20.2111 1496 1495 a-zingi<strong>be</strong>rene -103 F7_2 135 20.3621 1502 1499 a-muurolene - -104 F5_1 91 20.3727 1503 1506 d-selinene - -105 T2_1 91 20.3766 1503 1506 d-selinene - -106 F2_2 91 20.3829 1503 1506 d-selinene -- -107 F6_1 205 20.6221 1513 1513 g-cadinene - -108 F4_3 205 20.6237 1513 1513 g-cadinene - -109 F7_2 205 20.6252 1513 1513 g-cadinene - 5-bromo-4-methoxyoct-1-ene110 T2_1 205 20.6278 1513 1513 g-cadinene p--Benzoquinone111 F3_2 133 20.6781 1516 1514 sesquicineole - -112 F3_3 133 20.6803 1516 1514 sesquicineole - -113 F6_3 133 20.685 1516 1514 sesquicineole - -114 F5_1 69 20.8293 1522 1523 d-cadinene - --115 F5_1 69 20.9154 1526 1525 eugenyl acetate - -116 F6_3 69 20.9158 1526 1525 eugenyl acetate - -117 F7_2 121 20.9204 1526 1525 eugenyl acetate - -
178 CHAPTER 6Table S6.2. Continued118 T1_3 69 20.9227 1526 1525 eugenyl acetate - -119 F7_2 167 21.1103 1534 1533 cadina-1,4-diene1 - -120 T2_2 91 21.1498 1536 1538 a-cadinene - -121 F6_1 167 21.43 1547 1548 elemol - -122 F7_2 167 21.4346 1547 1548 elemol - -123 T1_3 69 21.467 1549 1549 elemol - --124 F3_2 69 21.4709 1549 1549 elemol - -125 F7_2 91 21.598 1554 1552 elemicin - -126 F6_2 91 21.6852 1557 1557 germacrene B - -127 F5_1 91 21.6859 1558 1557 germacrene B - -128 F6_3 91 21.6869 1558 1557 germacrene B - -129 M1_1 91 21.6895 1558 1557 germacrene B - -130 F6_3 67 21.7268 1559 1557 germacrene B - -131 F7_2 133 21.8253 1563 1564 β-calacorene - L-Asparagine132 T1_1 91 21.8405 1564 1564 β-calacorene - -133 F7_2 167 22.0012 1570 1574 prenopsan-8-ol - -134 T1_3 213 22.018 1571 1574 prenopsan-8-ol - -135 F6_3 132 22.0226 1571 1574 prenopsan-8-ol - -136 F6_3 153 22.0226 1571 1574 prenopsan-8-ol - -137 M1_1 91 22.3956 1586 1585 gleenol - -138 F2_2 133 22.5362 1591 1590 viridflorol - -139 F6_3 71 22.7179 1598 1590 viridflorol - -140 F3_2 71 22.7193 1598 1590 viridflorol - -141 F2_3 135 22.722 1598 1590 viridflorol - -142 F3_3 57 22.7547 1600 1607 b-oplopenone - -143 F3_2 57 22.7603 1600 1607 b-oplopenone - -144 F3_3 57 22.761 1600 1607 b-oplopenone - -145 F6_3 67 22.8782 1605 1607 b-oplopenone - -146 T2_2 68 23.0541 1613 1612 tetradecanal - -147 F4_3 148 23.2435 1622 1623 silphiperfol-6-en-5- - -one148 F3_1 135 23.2485 1622 1623 silphiperfol-6-en-5- - -one149 F5_3 91 23.52 1634 1633 y-eudesmol - -150 F4_3 91 23.5226 1634 1633 y-eudesmol - -151 F7_2 68 23.5261 1634 1633 y-eudesmol - -152 F7_2 68 23.5261 1634 1633 y-eudesmol - --
Variability of non-polar secondary metabolites in the red alga Portieria 179Table S6.2. Continued153 T2_2 68 23.5278 1634 1633 y-eudesmol - -154 F6_1 167 23.5309 1634 1633 y-eudesmol -155 F6_2 67 23.7239 1643 1642 cu<strong>be</strong>nol - allyl cy-anide156 T1_3 91 23.8325 1647 1646 a-muurolol - -157 F7_2 132 23.8759 1649 1646 a-muurolol - -158 F7_2 132 23.9988 1654 1653 a-cadinol - -159 F6_2 149 24.3377 1669 1668 bulnesol - -160 F7_2 149 24.3428 1669 1668 bulnesol - -161 F6_3 167 24.6091 1680 1682 a-bisabolol - -162 F6_1 57 24.6252 1681 1682 a-bisabolol - -163 F7_2 69 24.8113 1689 1686 8-cedren-13-ol - -164 F7_2 69 24.8207 1689 1686 8-cedren-13-ol - -165 F2_3 67 24.9282 1693 1686 8-cedren-13-ol - -166 F6_1 57 25.0854 1700 1686 8-cedren-13-ol - Heptadecane167 F7_2 91 25.3006 1710 1686 8-cedren-13-ol - -168 F3_2 71 25.3224 1711 1735 oplopanone - -169 F3_3 68 25.4814 1718 1735 oplopanone - -170 F6_3 67 25.7278 1730 1735 oplopanone - -171 F7_2 103 25.7292 1730 1735 oplopanone - -172 F2_1 67 25.7318 1730 1735 oplopanone - -173 F2_3 133 25.8305 1735 1735 oplopanone - -174 F3_1 117 25.8366 1735 1735 oplopanone - -175 F7_2 167 26.3223 1757 1761 <strong>be</strong>nzyl-<strong>be</strong>nzoate - -176 T2_1 167 26.5838 1769 1761 <strong>be</strong>nzyl-<strong>be</strong>nzoate - 6--Methylmercap<strong>to</strong>purine177 F6_2 117 26.7333 1775 1789 8-a-ace<strong>to</strong>xyelemol - -178 T2_2 103 26.8111 1779 1789 8-a-ace<strong>to</strong>xyelemol - -179 F3_1 67 26.8577 1781 1789 8-a-ace<strong>to</strong>xyelemol - -180 F6_1 67 26.8599 1781 1789 8-a-ace<strong>to</strong>xyelemol - -181 F3_2 67 26.8671 1781 1789 8-a-ace<strong>to</strong>xyelemol - -182 T2_1 67 26.8697 1781 1789 8-a-ace<strong>to</strong>xyelemol - -183 F6_1 103 26.8838 1782 1789 8-a-ace<strong>to</strong>xyelemol - -*(Cl2)184 F3_1 103 26.8852 1782 1789 8-a-ace<strong>to</strong>xyelemol - -185*(Br)F6_1 67 27.4286 1806 1798 nootka<strong>to</strong>ne - -
180 CHAPTER 6Table S6.2 Continued186 F7_2 67 27.4342 1806 1798 nootka<strong>to</strong>ne - -*(Br)187 F2_1 67 27.4383 1807 1798 nootka<strong>to</strong>ne - -188 F6_3 103 27.4961 1810 1798 nootka<strong>to</strong>ne - -189 F6_1 67 27.5012 1810 1798 nootka<strong>to</strong>ne - -190 F6_2 67 27.5676 1813 1827 isopropyl- -tetradecanoate191 F6_2 69 28.0351 1836 1827 isopropyl- -tetradecanoate192 F3_2 69 28.0387 1836 1827 isopropyl- -tetradecanoate193 F6_1 91 28.3153 1849 1867 flourensiadiol - -194 F3_2 149 28.735 1869 1867 flourensiadiol - -195 F6_2 69 29.2918 1895 1878 hexadecanol - -*(ClBr)196 F5_3 67 29.4766 1903 1927 methyl- -hexadecanoate197 T2_1 67 29.4889 1904 1927 methyl- -hexadecanoate198 F7_2 91 30.7705 1968 1999 eicosane - -199 T2_2 91 30.7753 1969 1999 eicosane - -200 F3_2 91 30.7855 1969 1999 eicosane - -201 T2_2 64 31.6475 - - - - -202 T2_2 129 38.661 - - - - -
Variability of non-polar secondary metabolites in the red alga Portieria 181Table S6.3. Compound peaks detected from GC-MS analysis of samples for evaluation of non-polar secondarymetabolite patterns of 5 cryptic species of P. hornemannii found in Batanes, Philippines. Identifications based oncomparison of either Kovats Indices (KI) of compounds retrieved from the Retention Index Calcula<strong>to</strong>r (Lucero etal. 2009) or mass spectral comparison of compounds retrieved from NIST or MassBase. Asterisk (*) indicatescompounds with parent ions showing halogenated mass spectral patterns.#SampleBasePeakRT(min)KIKI based IDMass spectra based IDNearestKI Lucero et al. 2009 NIST Massbase1 B4B 57 8.1122 1065 1062 y-terpinene - -2 B4C 69 8.7386 1085 1085 artemisia-alcohol - -3 B4C 57 9.1807 1098 1097 linalool - -4 B4B 71 9.1841 1098 1097 linalool - -5 B6C 57 9.4047 1106 1099 linalool 3-2-methylbutanehexanone,-2,2-dimethyl6 B4C 69 11.2515 1172 1171 ethyl-<strong>be</strong>nzoate - -7- B3A 69 11.2560 1172 1171 ethyl-<strong>be</strong>nzoate - -*(Cl)8 B4A 57 14.3547 1279 1277 trans-carvoneoxide- 2,2-dimethylbutane9 B4B 57 14.3593 1279 1277 trans-carvoneoxide- 3-ethylhexane10 B3B 57 14.5560 1285 1286 borneol-acetate -11 B3A 69 15.2678 1310 1306 undecanal - trans-4-octene12 B3A 57 15.6497 1325 1314 2E,4E-decadienal -13 B6B 57 15.6518 1325 1314 2E,4E-decadienal -14 B4A 71 16.5884 1360 1357 eugenol - 2-methylpentane15 B6C 57 17.8154 1403 1403 italicene - 2,2-dimethylbutane16 B3A 57 17.8289 1404 1403 italicene -17 B10 71 20.306 1500 1499 a-muurolene - Pentacosane18 B3A 57 20.4025 1504 1506 d-selinene - tripropylamine19 B4A 191 20.715 1517 1514 sesquicineole -20 B6C 57 21.0008 1529 1532 cadina-1,4-diene -21- B3B 57 21.0024 1529 1532 cadina-1,4-diene - 1-octene*(Br)22 B4A 69 21.5566 1552 1552 elemicin -23 B4A 57 25.1819 1704 1686 8-cedren-13-ol -24 B4B 71 25.4142 1715 1735 oplopanone - Hexacosane25 B4B 69 26.0498 1745 1747 6S-7R-bisabolone - 10-methyl-1-dodecanol
182 CHAPTER 6Table S6.3. Continued.26 B4A 57 27.4031 1805 1798 nootka<strong>to</strong>ne - 4-methyl-1-pentene27 B3B 57 27.9515 1832 1827 isopropyltetradecanoate- 2,4-dimethylpentane28 B3B 71 29.9932 1930 1927 methylhexadecanoate- docosane29 B6B 57 30.4182 1951 1927 methylhexadecanoate- -30 B10 69 30.5987 1960 1927 methylhexadecanoate- -31 B4C 73 30.6949 1965 1999 eicosane - -32 B6B 71 32.0267 - - 3-2,2-dimethylbutanehexanone,-2,2-dimethyl33 B3B 71 32.0458 - - - 2,2-dimethylbutane34 B6B 69 34.1452 - - - docosane35 B3B 69 34.7128 - - - -36 B4C 69 34.7233 - - - -37 B6C 71 35.0713 - - - -38 B3C 71 36.7162 - - - 3-ethylpentane39 B9B 395 38.2697 - - - -40 B6C 71 38.8875 - - - 3-ethylhexane41 B6B 71 39.0147 - - - -42 B4C 57 39.4792 - - - 3-ethylhexane43 B6B 57 39.4822 - - - 3,3-dimethyl-1-butene44 B4C 71 39.6266 - - - 3-ethylpentane45 B3C 71 39.7884 - - - -46 B6B 57 40.4997 - - 3-hexanone,-2,2-dimethyl2-methylbutane47 B6C 57 40.7684 - - - 3-ethylpentane48 B3C 71 40.7722 - - - -49 B4C 57 43.09 - - - 3-ethylpentane50 B6B 57 43.0982 - - - 2,2,4,6,6-pentamethylheptane51 B6C 85 43.2865 - - - 2-methylnonane52 B6B 71 43.3628 - - - 3-ethylpentane53 B3C 71 43.3691 - - - -
Variability of non-polar secondary metabolites in the red alga Portieria 183Table S6.3. Continued.54 B3B 85 43.7727 - - - 3,3-dimethyl-1-butene55 B4B 85 44.3901 - - - amitrole56 B6B 71 44.3953 - - - 3-aminopropiononitrile57 B4A 71 46.2638 - - - -58 B3C 71 46.8143 - - - 2,3-dimethylbutane59 B6B 71 46.822 - - 3--hexanone,-2,2-dimethyl60 B6C 71 47.3544 - - - -61 B4A 71 47.7467 - - - 3-ethylypentane62 B3A 57 47.7529 - - - 3,3-dimethyl-1-butene63 B4A 71 48.0072 - - - -64 B6B 71 48.0159 - - - -65 B6C 71 48.0169 - - - -66 B4A 71 48.0321 - - - -67 B4B 71 50.7731 - - - -
184
7 SEASONAL DYNAMICS OF PORTIERIAPOPULATIONS IN THE PHILIPPINES 1AbstractThe seasonal dynamics of the red alga, Portieria, were studied by looking at three parameters:density, percent cover and biomass in four sites located at Negros and Siquijor Islands,Philippines from Jan 2007 <strong>to</strong> Mar 2009. Sites are affected by strong waves during thesouthwest (June-Sept) and northeast (Nov-Feb) monsoon periods. Significant fluctuationsin all three parameters were detected mainly in two sites affected either by the NE and SWmonsoon waves. Results and field observations suggest that Portieria has a site-specificseasonality that is influenced by strong wave actions brought by the monsoonal winds.Portieria in Sia<strong>to</strong>n, Negros, a site exposed <strong>to</strong> the SW monsoon waves, <strong>be</strong>gins its growthclosely <strong>be</strong>fore or during the SW monsoon season and disappears at the end of the NEmonsoon. In Dapdap, Siquijor, a site exposed only <strong>to</strong> the NE monsoon waves, plants <strong>be</strong>gingrowing just <strong>be</strong>fore or during the NE monsoon, and decline <strong>to</strong>wards the SW monsoon.Sawang and Pagubagubaan in Siquijor are two sites exposed <strong>to</strong> waves of the NE and SEmonsoon. Here, no significant fluctuations of the measured parameters were detectedindicating a lack of marked seasonality. However, field observations of the presence ofyoung and senescent individuals suggest two growth cycles in Sawang: one that appearsduring the SW monsoon and a new batch appearing during the NE monsoon. A generationof plants in Sia<strong>to</strong>n and Dapdap is estimated <strong>to</strong> grow and live for a maximum of 9-10months while those in Sawang and Pagubagubaan live for about 5 months.Keywords: Portieria; seasonal dynamics; monsoon; Philippines1 Unpublished manuscript: Payo D.A., A. Bucol, Leliaert F., H.P. Calumpong, and O. De Clerck. Seasonaldynamics of Portieria populations in the Philippines.185
186 CHAPTER 77.1 IntroductionPortieria hornemannii is a common red alga in the Philippines (Silva et al.,1987; Meñez et al., 1996). The species grows in the infralit<strong>to</strong>ral fringe where it canobtain considerable biomass and further extents in lower abundance down <strong>to</strong> 20meters. The species has drawn the attention of many phycologists by the discoveryof secondary metabolites particularly halogenated monoterpenes with anti-tumorproperties (Fuller et al., 1992; Fuller et al., 1994). However, the lack of a constantsupply from natural populations hampered further drug development procedures.Recent studies applying molecular identification techniques (Chapter 3) revealedthat P. hornemannii is in fact a complex of several cryptic species and that this crypticdiversity may at least partly contribute <strong>to</strong> the variation in the signature of secondarymetabolites observed in different samples (Payo et al., in preparation or Chapter 6).We observed an unexpected diversity of Portieria in the Philippines, including atleast 21 species. These species exhibit a well structured and fine-scale geographicalpattern with most species occurring in only one or few islands. Populations foundin the different islands of Central and Eastern Visayas are generally composed of asingle (or sometimes two) species only.Given the local structure of the diversity of Portieria-complex, it is ofinterest <strong>to</strong> investigate how this diversity is maintained and which fac<strong>to</strong>rs contribute<strong>to</strong>wards continuous isolation of neighbouring populations. Amongst other fac<strong>to</strong>rs,differences in phenology among different cryptic species may reinforce isolation.Little is known however about changes in biomass, growth and reproduction inPortieria. Meñez et al. (1996) provided the first knowledge on the ecology of Portieriapopulations in the Philippines based on a one-time assessment of field biomass insome sites, and growth rates measured in situ. Macroalgal community studiesprovide some indication of seasonality and occurrence of Portieria but its temporalabundance has never <strong>be</strong>en specifically followed. Along the southern coast ofYemen, Ormond and Banaimoon (1994) reported its presence in January, February,August, Septem<strong>be</strong>r, and Oc<strong>to</strong><strong>be</strong>r from January 1988 <strong>to</strong> February 1990. In OrchardIsland, Taiwan, thalli were observed in April, August and Septem<strong>be</strong>r 2001;February, May, Oc<strong>to</strong><strong>be</strong>r 2002; July and Septem<strong>be</strong>r 2003; January 2004, i.e. 75% ofthe <strong>to</strong>tal survey visits from 2001 <strong>to</strong> 2004 (Su et al., 2009). Chung et al. (2007)reported only two occurrences of Portieria (July and Oc<strong>to</strong><strong>be</strong>r 2001) in a study fromApril 2001 <strong>to</strong> Septem<strong>be</strong>r 2003 in Dulang Bay, Southern Taiwan. These studiessuggest that the seasonality of Portieria varies on a large spatial scale. Up <strong>to</strong> whichextent the phenology of various cryptic species differs at a local scale remains
Seasonal dynamics of Portieria populations in the Philippines 187unknown at present. There<strong>to</strong> we studied the population dynamics of three crypticspecies at four sites located in Negros and Siquijor islands in the Philippines.7.2 Materials and methods7.2.1 Study sitesFour sites located in Negros and Siquijor islands in the Philippines weresampled: Malo, Sia<strong>to</strong>n, Negros Oriental (N 9.046722, E 122.9922); Dapdap,Siquijor, Siquijor (N 9.224033, E 123.5163); Sawang, San Juan, Siquijor (N9.196861, E 123.4473) and Pagubagubaan, San Juan, Siquijor (N 9.191875123.4476) (Fig. 7.1a and b).Fig. 7.1a-b. Maps showing the location of the four survey sites (Sia<strong>to</strong>n, Dapdap, Pagubagubaan and Sawang) ofPortieria, the species found and the location of the PAGASA Station (Dumaguete) where rainfall data was obtained.The site in Sia<strong>to</strong>n is a rocky intertidal zone noticeably covered by severalspecies of Sargassum. Portieria hornemannii occur in the shallows, often attached <strong>to</strong>dead corals. This site is affected by strong waves brought by the SW monsoon(June-Septem<strong>be</strong>r). In Dapdap, the plants were observed growing on dead coralmounds as well as on rocks making up the structure of an unused pier. This site isexposed <strong>to</strong> the waves brought by the NE monsoon (Novem<strong>be</strong>r-February). Sawangand Pagubagubaan are offshore reefs, separated by deeper water for a distance of
188 CHAPTER 7500 m, from which many species of algae abound. These two sites are both affectedby the NE and SW monsoons. Plants often are loosely attached <strong>to</strong> coral rubbles orepiphytic <strong>to</strong> other seaweeds. P. hornemannii were all found in the shallow water in allthe four sites, reaching <strong>to</strong> a maximum depth of two meters.Our molecular work (utilizing nuclear, mi<strong>to</strong>chondrial and plastid genes)which will <strong>be</strong> treated in detail separately, suggests that there are four cryptic species(indicated as V1A, V1C, V26 and V32) found in these sites. These four entities arereflected as clade V1A, V1C, V26 and V32 on a mi<strong>to</strong>chondrial cox2-3 spacerderived phylogeny of Portieria hornemannii specimens from the Philippines (Chapter3). Two coexisting Portieria cryptic species occur in Malo, Sia<strong>to</strong>n (V1A and V26). InDapdap, two species <strong>be</strong>longing <strong>to</strong> clade V1A and V1C are found. Sawang andPagubagubaan, which are closely adjacent sites, have also one species <strong>be</strong>longing <strong>to</strong>clade V32.7.2.2 Sampling.Sampling was conducted on a monthly basis (weather permitting) for 3consecutive years: January 2007 <strong>to</strong> January 2009, in Sia<strong>to</strong>n, Negros Oriental;February 2007 <strong>to</strong> March 2009 in Dapdap, Siquijor; March 2007 <strong>to</strong> February 2009 inSawang, San Juan, Siquijor and from February 2008 <strong>to</strong> February 2009 inPagubagubaan, San Juan, Siquijor. Abundance was measured using the quadratmethod. The quadrat used measures 0.25 m² subdivided in<strong>to</strong> twenty-five .01 m²subquadrats. Ten quadrats were randomly thrown on the algal <strong>be</strong>ds and the num<strong>be</strong>rof Portieria individuals within the quadrat was counted. Percentage cover estimateswere taken by counting the num<strong>be</strong>r of quadrat squares covered by the plants. Forthe purpose of this study, an individual refers <strong>to</strong> a distinct clump or tuft, physicallyseparated from conspecifics. For biomass assessment, Portieria within the quadratswere collected, and subsequently oven dried at 60°C until dry weights wereconstant. Biomass is expressed in dry weight. All data were converted andexpressed on a per m 2 basis. Average thallus height was measured and cys<strong>to</strong>carpicplants were recorded. On the spot water parameters measured was surface watertemperature using a standard labora<strong>to</strong>ry thermometer and salinity using an YSImodel 30 conductivity instrument. Daily rainfall data from January 2007 <strong>to</strong> March2009 was measured and obtained from Dumaguete station of the PhilippineAtmospheric Geophysical and Atmospherical Services Administration (PAGASA)in Dumaguete City, Philippines. With the proximity of the station <strong>to</strong> the sites (Fig.7.1), it is assumed that the observed precipitation pattern is representative for thestudy area.
Seasonal dynamics of Portieria populations in the Philippines 1897.2.3 Statistical analysesTo determine significant differences in monthly quadrat data, weperformed nonparametric Kruskal-Wallis ANOVA using Statistica 7.0 (StatSoftInc., Tulsa, OK, USA). A post hoc test was applied <strong>to</strong> determine the months whichcaused the significant difference. Data on plant height successfully normalizedusing log 10 (x+1) were analyzed using ANOVA. Unequal N HSD (HonestSignificant Difference) was used as a post hoc test. Average abundance, percentcover and biomass were compared <strong>be</strong>tween sites. Product-moment correlationswere used <strong>to</strong> detect possible relationships <strong>be</strong>tween biological (num<strong>be</strong>r ofindividuals per m 2 , percent cover and biomass) and environmental (surfacetemperature, salinity, rainfall) variables.7.3 Results7.3.1 Biophysical parametersThe Philippines is mainly affected by the NE monsoon around Novem<strong>be</strong>r<strong>to</strong> February and by SW monsoon from June <strong>to</strong> Septem<strong>be</strong>r, which brings increasedprecipitation as well as rough seas. Depending on the location, a coast canexperience strong waves brought about by winds of the NE (in the Philippinesreferred <strong>to</strong> as Amihan) or SW monsoon (Habagat).During the survey period, mean seawater surface temperature in the foursites ranged from 27.0-32.9 °C (Fig. 7.2.a-d). Temperature fluctuated within thisrange with lower mean temperatures (27.0-28.8 °C) generally observed in the colderNE monsoon months (around Novem<strong>be</strong>r <strong>to</strong> February). Dapdap in 2007 was anexception with the minimum temperature recorded during the SW monsoonmonths of August (28.7 °C) and Septem<strong>be</strong>r (28.8 °C).Maximum temperatures (31.0- 32.9 °C) were not consistently observedduring the same month among the four sites but were generally observed aroundthe SW monsoon months (June <strong>to</strong> Septem<strong>be</strong>r). Dapdap in 2007 presented anexception with the highest temperature observed in Oc<strong>to</strong><strong>be</strong>r and Novem<strong>be</strong>r (32.0°C).Salinity in the four sites ranged from 28.7 <strong>to</strong> 35.0 ppt (Fig. 7.2a-d).Minimum salinity (28.4-31.5 ppt) was generally observed during the NE monsoonmonths while maximum salinity (35 ppt) was observed in the hot interim period ofApril and May, SW monsoon months, until the <strong>be</strong>ginning of the NE monsoon in
190 CHAPTER 7Novem<strong>be</strong>r. In Dapdap, lower salinity levels (28.4-31.5 ppt) were also observed inAugust 2007 (31.1 ppt).Fig. 7.2. Temporal variation in environmental parameters. Temperature and salinity measurements during thesurveys in (a) Sia<strong>to</strong>n (b) Dapdap (c) Sawang (d) Pagubagubaan.
Seasonal dynamics of Portieria populations in the Philippines 191Mean monthly rainfall ranged from 7.94 <strong>to</strong> 348.34 mm within the studyperiod (Fig. 7.3). In 2007 and 2008, maximum mean rainfall was experienced at theonset of the monsoon seasons in June (252.12 mm and 224.54 mm, respectively)and Novem<strong>be</strong>r (276.10 mm and 211.58 mm, respectively). Minimum mean rainfallin 2007 was experienced in the hot months of March (7.94 mm) and April (19.98mm). Minimum rainfall in 2008 was experienced in July (29.09 mm). Tropicals<strong>to</strong>rms and typhoons (particularly Ambo and Frank) contributed <strong>to</strong> high rainfall inApril and June in the area.Fig. 7.3. Mean monthly rainfall (± SE) measured at the PAGASA station closest <strong>to</strong> the sampling sites. NE and SWmonsoon months are indicated by light and dark gray bars, respectively.7.3.2 Density, cover and biomassPortieria exhibits seasonal patterns but the period of high abundance (Fig.7.4a-d) and biomass (Fig. 7.5a-d) differs <strong>be</strong>tween sites.In Sia<strong>to</strong>n (Fig. 7.1), the general pattern suggests a growth of youngindividuals during the southwest monsoon <strong>be</strong>tween June <strong>to</strong> July, peaking inOc<strong>to</strong><strong>be</strong>r, and declining <strong>be</strong>tween March <strong>to</strong> June.
192 CHAPTER 7Fig. 7.4. Temporal variation in monthly mean abundance (individuals.m -2 ) (± SE) and percent cover (± SE) from2007-2009 in 4 surveyed sites (a) Sia<strong>to</strong>n (b) Dapdap (c) Sawang (d) Pagubagubaan. The symbol * indicates absenceof sampling data due <strong>to</strong> site inaccessibility during extreme wave actions and bad weather. Pagubagubaan has only<strong>be</strong>en surveyed for 1 year as this site was a later discovery.
Seasonal dynamics of Portieria populations in the Philippines 193Fig. 7.5. Temporal variation in monthly mean biomass (± SE) of Portieria from 2007-2009 in 4 surveyed sites (a)Sia<strong>to</strong>n (b) Dapdap (c) Sawang (d) Pagubagubaan. The symbol * indicates absence of sampling data due <strong>to</strong> siteinaccessibility during extreme wave actions and bad weather. Pagubagubaan has only <strong>be</strong>en surveyed for 1 yearas this site was a later discovery.
194 CHAPTER 7This was evident by its absence from March <strong>to</strong> June 2007 and its significantincrease (p=0.0321) of the num<strong>be</strong>r of individuals (16.40 ± 0.51 indiv.m-²), percentcover (10.80 ± 0.30%), and biomass (2.96 ± 0.12 g m-²) in Oc<strong>to</strong><strong>be</strong>r 2007. Thenoticeable presence of these plants remains until February <strong>to</strong> March, which is theend of the northeast monsoon. The abundance and biomass fluctuates within theperiod, which could <strong>be</strong> due <strong>to</strong> continuous settling of recruits, successful growth anddeath of plants. The population declines almost entirely around March or April,coinciding with the proliferative growth of several Sargassum species reaching theshallow surface waters. Portieria specimens observed around this time, exhibit anorangy color and rub<strong>be</strong>ry texture as opposed <strong>to</strong> the red and softer texture ofyounger plants in Oc<strong>to</strong><strong>be</strong>r. Its observable disappearance occurs <strong>be</strong>fore the SWmonsoon months commencing around June. No statistically significant differencesin these parameters were detected <strong>be</strong>tween 2008 and 2007. However, there was acertain disparity in the patterns observed <strong>be</strong>tween the period March <strong>to</strong> June 2007and for the same period in 2008. Plants were absent in this period in 2007 while anincrease of individuals per m² (0.80 ± 0.53 – 8.40 ± 0.63 indiv.m-²) and percentcover (0.80 ± 0.53 – 6.40 ± 0.45%) occurred in the same period in 2008. Portieriawas also observed in April 2008, but no quadrat survey was conducted in thisperiod. In April, some of the rocks were already devoid of Sargassum. This earlydecline and disappearance of Sargassum <strong>be</strong>ds were aggravated by the s<strong>to</strong>rms andtyphoons that occurred <strong>be</strong>fore the surveys in April <strong>to</strong> June 2008. The disappearanceof Sargassum <strong>be</strong>ds paved the way for growth of young Portieria germinates, whichwere observed in June. Biomass remained consistently low until Septem<strong>be</strong>r 2008.Quadrat measurements were not possible from July <strong>to</strong> Septem<strong>be</strong>r 2007 due <strong>to</strong> thestrong waves of the SW monsoon. But in Oc<strong>to</strong><strong>be</strong>r of both years, a sudden increaseof abundance was observed. No significant difference in dry weight, individuals perm², and percent cover were observed for this month in both years.In Dapdap, plants were observed throughout the year. Portieria in this areais most abundant during the wavy northeast monsoon months (Decem<strong>be</strong>r-February). Towards the southwest monsoon season (June-August), the coast is calmand the plants <strong>be</strong>come less abundant. Increase in abundance resumes aroundSeptem<strong>be</strong>r until its peak around February. The highest abundance (20.80 ± 5.16indiv.m - ² and 15.20 ± 6.61 indiv.m - ², respectively) and percent cover (11.60 ±2.63% and 8.80 ± 3.41%, respectively) were recorded in February 2007 and 2008.The num<strong>be</strong>r of individuals per m 2 and percent cover in February 2007 weresignificantly higher than in the months of August (p=0.034568 and p=0.012713,respectively), Septem<strong>be</strong>r (p=0.002883 and p=0.012713, respectively) and Oc<strong>to</strong><strong>be</strong>r
Seasonal dynamics of Portieria populations in the Philippines 195(p=0.00288) of 2007 when nearly no plants were observed. No significantdifference in percent cover was observed <strong>be</strong>tween February and Oc<strong>to</strong><strong>be</strong>r 2007.Peaks in plant biomass were recorded in February 2007 at 5.21g ± 0.78 g.m -2 and atlower values in January (0.95 ± 0.30 g.m -2 ) and February 2008 (0.93 ± 0.37 g.m -2 ).Biomass in February 2007 was significantly higher (p=0.018312-0.000286) than inJuly <strong>to</strong> Decem<strong>be</strong>r 2007 (0-0.95 ± 0.30 g.m -2 ). The lowest recorded biomass was0.07 ± 0.06 g.m -2 in Novem<strong>be</strong>r 2007 and 0.20 ± 0.09 g.m -2 in August 2008. Apossible massive spore release occurs somewhere in Decem<strong>be</strong>r and January,explaining the sudden increase in the num<strong>be</strong>r of individuals and percent cover thatpeaks in February. This is supported by a conspicuous growth of young plantsobserved in the field in Decem<strong>be</strong>r 2007. However, as early as Septem<strong>be</strong>r 2007, afew young individuals that fell outside of the quadrats were already observed. ByApril 2007 and May 2008, the plants appeared old and <strong>be</strong>came yellowish brown incolor. Percent cover and individual count (1.20 ± 0.61% and 1.60 ± 1.22 indiv.m -² ,respectively) were at its minimum in July 2007 and 2008. No significant differencesin num<strong>be</strong>r of individuals, percent cover and biomass could <strong>be</strong> detected among themonths in 2008. However, a similar pattern in 2007 was observed.In Sawang, Portieria is present all throughout the year. No significantdifferences in abundance, percent cover and biomass were detected from March2007 <strong>to</strong> February 2009. The maximum num<strong>be</strong>r of individuals per m 2 was recordedduring the NE monsoon, in Decem<strong>be</strong>r 2007 (11.20 ± 4.65 indiv.m -² ) and in theinterim month of Oc<strong>to</strong><strong>be</strong>r 2008 (13.20 ± 3.21 indiv.m -² ). The percent cover wasalso at maximum at these months (9.20 ± 3.82% and 13.20 ± 3.21%, respectively).However, biomass was highest in April 2007 (2.98 ± 1.31 g.m -2 ) and July 2008 (7.40± 3.68 g.m -2 ). Minimum abundance (0.40-0.80 indiv.m - ²), percent cover (0.40-0.80%), and biomass (0.01-0.50 g.m -2 ) were recorded during the southwestmonsoon (August and Septem<strong>be</strong>r 2007, and in August 2008). There were nosignificant variations detected in abundance, percent cover and biomass throughtime but field observations suggest two growth cycles. An early growth occurssomewhere at the end of the SW monsoon or in Oc<strong>to</strong><strong>be</strong>r and peaks in NEmonsoon months of Novem<strong>be</strong>r <strong>to</strong> Decem<strong>be</strong>r and <strong>be</strong>gins <strong>to</strong> decline in January. Asecond growth is initiated in the interim period of April and May, which peaksduring the SW monsoon months of June and July, and finally declines in August.In Pagubagubaan, Portieria is also observed year-round. No significantdifferences were detected in the num<strong>be</strong>r of individuals per m 2 throughout thesurvey period but a peak in biomass occurred in the latter period of the NEmonsoon and a decrease in the SW monsoon. Biomass significantly increased (p=
196 CHAPTER 70.037391-0.00079) in February 2009 (30.23 ± 6.14 g.m -2 ) compared <strong>to</strong> the lowbiomasses in June (2.47g ± 1.08), July (3.62 ± 1.50 g.m -2 ), August (2.42 ± 1.55 g.m -2) and Septem<strong>be</strong>r 2008 (0.29 ± 0.08 g.m -2 ). A significant decrease in biomass wasalso detected from 40.10 ± 1.96 g.m -2 in March <strong>to</strong> 32.05 ± 1.8 g.m -2 in Septem<strong>be</strong>r2008. Percent cover was significantly higher (p=0.0318) in February 2009 (14.00 ±4.27%) than in Septem<strong>be</strong>r 2008 (8.00 ± 3.27%). The trend in Pagubagubaansuggests growth of new seedlings around the interim period of Oc<strong>to</strong><strong>be</strong>r and the<strong>be</strong>ginning of the NW monsoon period in Novem<strong>be</strong>r.Pagubagubaan had a significantly higher (p=0.000) abundance, percentcover and biomass compared <strong>to</strong> the other sites. No significant differences weredetected <strong>be</strong>tween the sites, Sia<strong>to</strong>n, Dapdap and Sawang in terms of abundance,percent cover, and biomass. Despite removal of possible outliers, there was low <strong>to</strong>non-significant correlation observed <strong>be</strong>tween the biological and environmentalparameters measured.7.3.3 Thallus heightThallus height (Fig. 7.6a-d) in the 4 sites also suggested a seasonalitypattern. Portieria plants in Sia<strong>to</strong>n were tallest (42.53 ± 0.84 mm) in Oc<strong>to</strong><strong>be</strong>r 2007and shortest (29.00 ± 2.40 mm) in February 2007. A significant decrease (p =0.000214) in the average height of plants was detected <strong>be</strong>tween January (41.20 ±0.85 mm) and February 2007. By Oc<strong>to</strong><strong>be</strong>r 2007, the new generation of plants wasalready at maximum height and was significantly higher (p = 0.000070) than the las<strong>to</strong>nes observed in February 2007. These observations also suggest early growtharound the SW monsoon months and its peak around the interim period ofOc<strong>to</strong><strong>be</strong>r. As the NW monsoon season ends, the tall branches probably defragmentleaving shorter branches attached <strong>to</strong> the holdfast. However, in 2008 no significantdifferences in height were detected in the first few months. But plants fromFebruary <strong>to</strong> May 2008 (36.00 ±0.75 mm– 42.30 ± 3.90 mm) were significantly taller(p = 0.031877-0.000156) than those found in Septem<strong>be</strong>r 2008 (22.00 ± 0.37 mm).
Seasonal dynamics of Portieria populations in the Philippines 197Fig. 7.6. Monthly mean thallus height (± SE) of Portieria from 2007-2009 in 4 surveyed sites (a) Sia<strong>to</strong>n (b) Dapdap(c) Sawang (d) Pagubagubaan.In Dapdap, the maximum average height (59.80 ± 2.34 mm) and theminimum height (30.40 ± 3.78 mm) were recorded in May 2007 and Decem<strong>be</strong>r2007, respectively. Plants grew significantly (p=0.022755-0.000244) from February(49.00 ±5.63 mm) <strong>to</strong> May 2007. But <strong>be</strong>tween April (57.5 ± 4.78 mm) and July 2007
198 CHAPTER 7(31.22 ± 2.43 mm), a significant decrease (p=0.024311) in plant height wasobserved until August when no plants were observed anymore. Young plantsobserved in Decem<strong>be</strong>r 2007 (30.40 ± 3.78 mm) were significantly smaller <strong>to</strong> plantsfound in April (p=0.008903) and May 2007 (p=0.000069). No significant heightdifferences have <strong>be</strong>en detected among plants in 2008 until March 2009. However,the maximum average height (47.50 ± 4.47 mm) and the minimum average height(30.64 ± 1.33 mm) were observed in February and August 2008, respectively.The maximum average height of plants in Sawang were recorded inOc<strong>to</strong><strong>be</strong>r 2007 (43.80 mm ± 2.31), March 2008 (47.40 ± 2.69 mm), and January2009 (47.30 ± 2.53 mm). The minimum average height was observed in April 2007(29.60 ±2.27 mm) and Septem<strong>be</strong>r 2008 (33.00 ± 1.18 mm). Significant differencesin plant height were not detected in 2007. However, plants significantly decreased(p=0.032366-0.004203) in height <strong>be</strong>ginning February (45.40 ± 2.66 mm) untilNovem<strong>be</strong>r 2008 (33.10 ± 1.20 mm). While a significant increase (p=0.004517) inheight occurred <strong>be</strong>tween Novem<strong>be</strong>r 2008 and January 2009 (47.30 ± 2.53 mm).Fig. 7.7. Percentage of cys<strong>to</strong>carpic plants in Sia<strong>to</strong>n (n=10-23) and Dapdap (n=5-51) from 2007 <strong>to</strong> 2009.This signifies that the batch of plants that grew around April whichmatured during the SW monsoon season were relatively shorter than those thatgrew around Oc<strong>to</strong><strong>be</strong>r and which matured during the NE monsoon. InPagubagubaan, a similar pattern was observed. The plants in February 2008 (52.40± 2.79 mm) were significantly taller (p=0.025571-0.000234) than the plants in May
Seasonal dynamics of Portieria populations in the Philippines 199(37.80 ± 3.31 mm), June (35.47 ± 2.02 mm), July (35.47 ± 2.02 mm), Oc<strong>to</strong><strong>be</strong>r(43.30 ± 3.96 mm) and Novem<strong>be</strong>r 2008 (32.00 ± 0.63 mm).7.3.4 Reproductive thalliOn months when plants were present in Sia<strong>to</strong>n, 10-50% (n=10-23) ofthose randomly examined was cys<strong>to</strong>carpic (Fig. 7.7). The highest num<strong>be</strong>r ofcys<strong>to</strong>carpic plants was observed in the months of January (47.8%) and Oc<strong>to</strong><strong>be</strong>r(33.3 %) in 2007 and in January (40%), February (40%), and Oc<strong>to</strong><strong>be</strong>r (50%) in2008. However, for the months June, July and Septem<strong>be</strong>r 2008, none werecys<strong>to</strong>carpic for every 10 plants examined. Cys<strong>to</strong>carpic plants in Dapdap weregenerally found throughout the year (Fig. 7.6). It composed 10-60 percent of the<strong>to</strong>tal num<strong>be</strong>r of plants (n=5-51) randomly examined for the presence of cys<strong>to</strong>carps.There was no significant difference in the num<strong>be</strong>r of cys<strong>to</strong>carpic plants found eachmonth. No cys<strong>to</strong>carpic plants were observed during the surveys in Sawang andPagubagubaan. In these localities, only sterile and tetrasporic plants were observedin some of the samples that were verified under the microscope.7.4 DiscussionThere are several indications suggesting that Portieria favors growth inperiods of strong wave actions. In Sia<strong>to</strong>n, when the coast is exposed <strong>to</strong> wavesduring the SW monsoon, Portieria starts <strong>to</strong> grow <strong>be</strong>tween June <strong>to</strong> July when largeSargassum species have defragmented. Young bright-red plants are very conspicuousin Oc<strong>to</strong><strong>be</strong>r and remain present until March when they disappear. Thisdisappearance occurs simultaneously with the increase in thallus height and densityof several Sargassum species. In contrast <strong>to</strong> Sia<strong>to</strong>n, the Dapdap site is exposed <strong>to</strong>strong waves during the NE monsoon. Here, majority of the new generation ofplants <strong>be</strong>gin growing around Oc<strong>to</strong><strong>be</strong>r, peaks in the NE monsoon season months ofJanuary and February, and declines <strong>be</strong>ginning March, and remains until the end ofthe SW monsoon. From these observations, it is estimated that a generation ofplants in Sia<strong>to</strong>n and Dapdap live for a maximum of 9-10 months. Sawang andPagubagubaan are two sites exposed <strong>to</strong> the waves of the NE and SE monsoon.Two growth cycles were observed in Sawang both during the NE and SEmonsoons. It is estimated that a generation of plants in Sawang (and probably,Pagubagubaan) last for about 5 months. This shorter life span may have <strong>to</strong> do withthe lack of sexual reproduction based on the fact that no cys<strong>to</strong>carpic plants wereobserved in the entire study period.
200 CHAPTER 7Portieria’s seasonal patterns can <strong>be</strong> altered especially by strong disturbancescaused by s<strong>to</strong>rms and typhoons. It appears that Portieria will take any opportunity <strong>to</strong>grow when surfaces <strong>be</strong>come free from the taller seaweeds. In 2008, a tropical s<strong>to</strong>rm(Ambo/Neoguri; April 13-15 2008) and later, a typhoon (Frank/Fengshen; June18-23, 2008) passed the region clearing up the dense Sargassum <strong>be</strong>ds earlier than theperiod of defragmentation. This allowed appearance of Portieria in Sia<strong>to</strong>n as early asMay in 2008. In contrast, Portieria remained absent for 4 months (March-June) inthe previous year when no strong typhoon had occurred.We suspect that the increased wave motion during the monsoon seasonsprovides opportunities for Portieria populations in two ways: habitat availability andthe increased availability of resources for its physiological needs. Waves facilitatethe defragmentation of dense canopies of seaweeds, like Sargassum, allowing forsmaller species such as Portieria <strong>to</strong> grow and have sufficient light for pho<strong>to</strong>synthesis.Several studies have acknowledged the role of water motion in increasing theavailability of carbon dioxide and nutrients, in increasing the rate of pho<strong>to</strong>synthesisthrough the removal of pho<strong>to</strong>synthetic inhibi<strong>to</strong>rs like OH- ions from the surfacesof the thallus, and in increased light availability (Lüning et al., 1990; Gonen et al.,1995; Hurd, 2000; Ryder et al., 2004; Barr et al., 2008). Increased water motionreduces the diffusion boundary layer (layer of water that builds up next <strong>to</strong> theorganism) surrounding a macroalga through which nutrients and carbon dioxidemust pass <strong>to</strong> reach the plant from the water column (Koehl, 1984; Lüning et al.,1990). Furthermore, increased water motion causes substantial effect on boththallus growth rate and spore development by increased availability of carbondioxide as has <strong>be</strong>en shown for Gracilaria parvispora (Ryder et al., 2004). Ryder et al.(2004) also suggested that increased water motion increases survival of newlygerminated spores through increased availability of the nutrients.Several phenological studies of macroalgae in monsoon affected areas haveattributed seasonal growth patterns <strong>to</strong> fluctuation in irradiance, nutrients, seawatertemperature, salinity and precipitation (Kong and Ang, 2004; Mayakun and Prathep,2005; Chung et al., 2007). Our current observations suggest that wave actionsduring monsoon seasons may have an important role on the seasonal growth ofsome algae. Future seasonality studies should include quantification of bot<strong>to</strong>m flowpatterns and turbulence using clod cards (Ryder et al., 2004) or dynamometers(Palumbi, 1984). Furthermore, future culture attempts of Portieria (for example forpharmaceutical purposes) whether in aquaria or in the field should considersufficient water motion.
Seasonal dynamics of Portieria populations in the Philippines 2017.5 AcknowledgementsWe are grateful <strong>to</strong> Jacinta Lucañas and several fishers from Siquijor for field assistance and<strong>to</strong> the Philippine Atmospheric Geophysical and Atmospherical Services Administration(PAGASA) in Dumaguete City, Philippines for the rainfall data. This research is funded bythe Flemish Interuniversity Council (VLIR) as part of the PhD grant <strong>to</strong> D.A. Payo.
202 CHAPTER 7
Seasonal dynamics of Portieria populations in the Philippines 2037.6 ReferencesBarr, N.G., Kloeppel, A., Rees, T.A.V., Scherer, C., Taylor, R.B., Wenzel, A., 2008. Wave surgeincreases rates of growth and nutrient uptake in the green seaweed Ulva pertusa maintainedat low bulk flow velocities. Aquatic Biology 3, 179-186.Chung, I.C., Hwang, R.L., Lin, S.H., Wu, T.M., Wu, J.Y., Su, S.W., Chen, C.S., Lee, T.M., 2007.Nutrients, temperature, and salinity as primary fac<strong>to</strong>rs influencing the temporal dynamics ofmacroalgal abundance and assemblage structure on a reef of Du-Lang Bay in Taitung insoutheastern Taiwan. Botanical Studies 48, 419-433.Fuller, R.W., Cardellina, J.H., Jurek, J., Scheuer, P.J., Alvaradolindner, B., McGuire, M., Gray, G.N.,Steiner, J.R., Clardy, J., Menez, E., Shoemaker, R.H., Newman, D.J., Snader, K.M., Boyd,M.R., 1994. Isolation and structure-activity features of halomon-related antitumormonoterpenes from the red alga Portieria hornemannii. J. Med. Chem. 37, 4407-4411.Fuller, R.W., Cardellina, J.H., Ka<strong>to</strong>, Y., Brinen, L.S., Clardy, J., Snader, K.M., Boyd, M.R., 1992. Apentahalogenated monoterpene from the red alga Portieria hornemannii produces a novelcy<strong>to</strong><strong>to</strong>xicity profile against a diverse panel of human tumor-cell lines. J. Med. Chem. 35,3007-3011.Gonen, Y., Kimmel, E., Friedlander, M., 1995. Diffusion boundary layer transport in Gracilaria conferta(Rhodophyta). J. Phycol. 31, 768-773.Hurd, C.L., 2000. Water motion, marine macroalgal physiology, and production. J. Phycol. 36, 453-472.Koehl, M.A.R., 1984. How do <strong>be</strong>nthic organisms withstand moving water? Integr. Comp. Biol. 24, 57.Kong, C.S.L., Ang, P.O., 2004. Seasonal occurrence and reproduction of Hypnea charoides(Rhodophyta) in Tung Ping Chau, NT, Hong Kong SAR, China. Hydrobiologia 512, 63-78.Lüning, K., Yarish, C., Kirkman, H., 1990. Seaweeds: their environment, biogeography, andecophysiology. John Wiley & Sons, Inc., New York, p. 527.Mayakun, J., Prathep, A., 2005. Seasonal variations in diversity and abundance of macroalgae at SamuiIsland, Surat Thani Province, Thailand. Songklanakarin J. Sci. Technol. 27, 653-663.Meñez, E.G., Calumpong, H.P., Newman, D.J., West, J.A., 1996. An account of the red alga Portieriahornemannii (Gigartinales, Rhodophyllidaceae) from the Philippines. Nova Hedwigia 112, 161-170.Ormond, R.F.G., Banaimoon, S.A., 1994. Ecology of intertidal macroalgal assemblages on theHadramout Coast of Southern Yemen, an area of seasonal upwelling. Marine Ecology-ProgressSeries 105, 105-120.Palumbi, S.R., 1984. Measuring intertidal wave forces. J. Exp. Mar. Biol. Ecol. 81, 171-179.Ryder, E., Nelson, S.G., McKeon, C., Glenn, E.P., Fitzsimmons, K., Napolean, S., 2004. Effect ofwater motion on the cultivation of the economic seaweed Gracilaria parvispora (Rhodophyta)on Molokai, Hawaii. Aquaculture 238, 207-219.Silva, P.C., Meñez, E.G., Moe, R.L., 1987. Catalog of the Benthic Marine Algae of the Philippines.Smithsonian Institution Press, Washing<strong>to</strong>n, D.C.Su, S.W., Chung, I.C., Lee, T.M., 2009. Temporal dynamics of rocky-shore macroalgal assemblagestructures in relation <strong>to</strong> coastal construction threats in Orchard Island (Taiwan): Impacts ofturbidity and nutrients on the blooms of Galaxaura oblongata and a red alga-sponge symbioseCera<strong>to</strong>dictyon/Haliclona. Kurushio Science 3, 63-80.
204
8 GENERAL DISCUSSION8.1 Seaweed species diversity: the red alga Portieria as a case study8.1.1 Importance of correctly delimiting speciesAccurate delineation of species is crucial. Being widely accepted as afundamental unit of biological diversity, delineation of species may haveimplications in ecological and biodiversity studies, conservation efforts andplanning, development of evolutionary and biogeographic theories (Bickford et al.,2007; Trontelj and Fišer, 2009; Yang and Rannala, 2010). Incorrect speciesdelimitation may have an important impact on the size of species ranges, formalthreat classifications, and the decision over critical areas of biodiversity (Agapow etal., 2004). From an economic and social point of view, correct assessment ofbiodiversity is important for allocation of conservation funds and resources andconservation schemes (Agapow et al., 2004). Apart from biodiversity studies, fieldssuch as pharmacognosy and natural product studies may <strong>be</strong>nefit from correctspecies delineation (Pietra, 2002). In chapters 3 and 4, we demonstrated largecryptic diversity in Portieria hornemannii in the Indo-Pacific and in the Philippines inparticular. As a consequence of the lack of a priori knowledge on this, chemicalstudies conducted on Portieria hornemannii as early as 1974 may actually <strong>be</strong> referring<strong>to</strong> different entities or species.8.1.2 Species concepts and species delimitationDespite the general consensus that species are fundamental units ofbiological organization, there is long-standing disagreement among biologists abouthow <strong>to</strong> divide biodiversity in<strong>to</strong> species (Claridge et al., 1997; Agapow et al., 2004;Richards, 2010). Over twenty different species concepts have <strong>be</strong>en proposed,according <strong>to</strong> criteria ranging from morphological or molecular similarity <strong>to</strong> sexualcompatibility (Hey, 2006). Three species concepts have <strong>be</strong>en generally applied inalgal studies, including the morphological, biological and phylogenetic speciesconcept. The morphological species concept uses discontinuities in the pattern ofmorphological variation as a criterion for distinguishing species. However, thecriterion of morphological similarity is problematic in many algal groups that aremorphologically depauperate or exhibit phenotypic plasticity. Despite these known205
206 CHAPTER 8drawbacks, the morphological species concept is still widely applied in algalsystematics. The biological species concept defines a species as mem<strong>be</strong>rs ofpopulations that actually or potentially interbreed in nature. The application of thebiological species concept has <strong>be</strong>en applied in several algal groups, including redalgae, green algae and dia<strong>to</strong>ms (Hörnig and Schnetter, 1988; Zuccarello and West,2003; Casteleyn et al., 2008). However, the investigation of sexual compatibility hasoften <strong>be</strong>en hampered due <strong>to</strong> difficulties in initiating sexual reproduction in cultureconditions, or <strong>be</strong>cause several algae are only known <strong>to</strong> reproduce asexually(reviewed in John and Maggs 1997). The phylogenetic species concept definesspecies as the smallest diagnosable monophyletic group, and has gained popularityover the years (discussed <strong>be</strong>low). An important problem arising from these speciesconcepts was that different criteria were often in conflict, resulting in ambiguouslydefined species.More recently, important conceptual progress has <strong>be</strong>en made in thinkingabout species by recognizing that the competing species concepts have anunderlying commonality <strong>to</strong> them. In this unifying species concept (termed GeneralLineage Concept) a species is regarded as a group of individuals that is structured asa metapopulation, which evolves separately from other metapopulations (deQueiroz, 2007). As has <strong>be</strong>en argued by de Queiroz (2005, 2007), ―alternative speciesconcepts agree in treating existence as a separately evolving metapopulation lineageas the primary defining property of the species category, but they disagree inadopting different properties acquired by lineages during the course of divergence(e.g., reproductive isolation, morphological diagnosability and monophyly) assecondary defining properties (secondary species criteria).‖ In other words, underthis unified species concept, the ―old species concepts‖ (more appropriately calledspecies properties), are viewed as different lines of evidence (operational criteria)relevant <strong>to</strong> assessing species boundaries.8.1.3 DNA-based species delimitationMorphological stasis, morphological simplicity and plasticity as exhibited inmarine macroalga can make species determination challenging, thus making DNAbasedapproaches more valuable in species detection. DNA-based taxonomy has<strong>be</strong>en shown <strong>to</strong> provide a convenient and reliable <strong>to</strong>ol for species delimitation inseveral organismal groups, including algae (Wiens, 2007; Wiens et al., 2008). Thewidespread accumulation of genetic data at the interface <strong>be</strong>tween populations andspecies has led <strong>to</strong> the development of several methods for sequence-based species
General discussion 207delimitation, enabling formal analyses of species boundaries (Temple<strong>to</strong>n, 2001; Sitesand Marshall, 2003).Several methods for detecting species limits from DNA sequence data arebased on diagnostic character variation, and aggregate a priori populations that lackdiscrete differences in<strong>to</strong> a single species, which are distinguished from other speciesby unique nucleotide differences (Cracraft, 1983; Davis and Nixon, 1992; Wiensand Penkrot, 2002). These methods are problematic for many algal groups <strong>be</strong>causea priori information on populations (e.g., morphological or geographical data) isoften lacking (Leliaert et al., 2009).Recently, a num<strong>be</strong>r of methods have <strong>be</strong>en developed that incorporatecoalescent models within a phylogenetic framework (Pons et al., 2006; Knowles andCarstens, 2007; O'Meara, 2010; Yang and Rannala, 2010). These methods can <strong>be</strong>broadly separated in<strong>to</strong> two groups: single and multilocus methods. Single-locusmethods aim <strong>to</strong> infer species boundaries from sequence data by analyzing thedynamics of lineage branching in a gene tree, trying <strong>to</strong> determine the point oftransition from species-level (speciation/extinction) <strong>to</strong> population-level (coalescent)evolutionary processes (Pons et al., 2006; Fontane<strong>to</strong> et al., 2007). An importantassumption made in these single-locus methods is that gene trees are fully sortedwithin species. This assumption may <strong>be</strong> violated through several processes,including incomplete lineage sorting and hybridization. Multilocus methods forspecies delimitation have <strong>be</strong>en developed that combine species phylogenies andgene genealogies via ancestral coalescent processes (Knowles and Carstens, 2007;Carstens and Dewey, 2010; Yang and Rannala, 2010). These multilocus methods arebased on a population genetics perspective that includes prior information aboutpopulation size and divergence times, two important parameters for makinginferences about population his<strong>to</strong>ry (Rannala and Yang, 2003). Some authors haveemphasized the importance of using multilocus over single locus in resolvingrelationships among closely related species (Dettman et al., 2003; Chase et al., 2005;Des<strong>to</strong>m<strong>be</strong> et al., 2010). This approach allows the detection of consistent groupingsamong the several loci used and the examination of possible occurrence ofhybridization and incomplete lineage sorting (Des<strong>to</strong>m<strong>be</strong> et al., 2010). Furthermore,it is also argued that a gene tree does not necessarily reflect the same <strong>to</strong>pology as aspecies tree (Sites and Marshall, 2004; Galtier and Daubin, 2008; Degnan andRosen<strong>be</strong>rg, 2009; Meng and Kubatko, 2009; O'Meara, 2010; Yu et al., 2011). Thus,a tree derived from a single gene may not necessarily recover the true speciesgroupings.
208 CHAPTER 8Sequenced-based species delimitation is particularly valuable in organismsin which morphological discrimination is difficult or impossible, such as in manyalgal groups (Saunders, 2005; Verbruggen et al., 2005; Harvey and Goff, 2006;Verbruggen et al., 2007). Although, multilocus approaches have <strong>be</strong>en used inseveral red algal studies (Maggs et al., 2007), our study on Portieria (Chapters 3 and4) is the first <strong>to</strong> employ multilocus coalescence based approaches for speciesdelimitation in algae. Our main results are discussed <strong>be</strong>low.8.1.4 Cryptic diversityThe presence of a large num<strong>be</strong>r of cryptic species (i.e. morphologicallyindistinguishable species), especially in the marine environment is continuously<strong>be</strong>ing revealed by DNA based studies. Cryptic species are predicted <strong>to</strong> <strong>be</strong> morecommon among marine taxa <strong>be</strong>cause these organisms rely heavily on non-visualand chemical mating signals. It is also possible that these organisms areexperiencing selection on <strong>be</strong>havioral or physiological characters promotingmorphological stasis (Knowl<strong>to</strong>n, 1993; Knowl<strong>to</strong>n, 2000).Most studies on marine cryptic species are from temperate regions, and itcan <strong>be</strong> expected that an enormous cryptic diversity is yet <strong>to</strong> <strong>be</strong> discovered amongtropical species (Bickford et al., 2007). Cryptic and pseudo-cryptic species, i.e.species that can <strong>be</strong> distinguished once the diagnosable character has <strong>be</strong>en found(Knowl<strong>to</strong>n, 1993; Bickford et al., 2007), have <strong>be</strong>en documented in several algalgroups, including the red macroalgae in Polysiphonia (McIvor et al., 2001), Bostrychia(Zuccarello and West, 2003), Plocamium (Saunders and Lehmkuhl, 2005),Asparagopsis (Andreakis et al., 2007), Mas<strong>to</strong>carpus (Lindstrom, 2008) and the Dilsea-Neodilsea complex (Saunders, 2008), the brown macroalga in Dictyota (Tronholm etal., 2010b), and the green algal Boodlea complex (Leliaert et al., 2009). Most of thesestudies dealt with taxa or specimens from temperate regions. Thus, our recentinvestigations on the cryptic diversity of the red alga Portieria hornemannii in thePhilippines and the Indo-Pacific (Chapters 3 and 4) are important contributions <strong>to</strong>a depauperate list of tropical macroalgal cryptic diversity studies.8.1.5 Unveiling cryptic diversity in Portieria hornemanniiThe red macroalga Portieria hornemannii has <strong>be</strong>en reported from the entireIndo-Pacific. Its supposedly wide distribution included the coasts of East Africagoing eastward <strong>to</strong> the Pacific Islands, and from Japan down <strong>to</strong> Australia and NewZealand (Guiry and Guiry, 2011). Because of the lack of diagnostic morphological
General discussion 209and ana<strong>to</strong>mical structures and a seemingly continuum of forms, some authors haverecognized a single species, Portieria hornemannii, including P. harveyi, P. japonica, P.spinulosa and P. tripinnata as synonyms (Wiseman, 1973; Millar and Van Reine, 2005).Chapters 3 and 4 demonstrate that the recognition of a single species or theseparation in<strong>to</strong> the traditional species is both untenable. Instead we show multiplecryptic species within Portieria. Chapter 5 has demonstrated that some of theselineages may qualify as pseudocryptic species based on morphometric techniques.While no quantitative structural and ana<strong>to</strong>mical comparisons have <strong>be</strong>enmade among different Portieria samples in Chapter 2, the detailed microscopicexamination of the different samples from the Indo-Pacific revealed the absence ofconspicuous characters useful for species discrimination. Furthermore, ana<strong>to</strong>micalcharacteristics appeared very similar among specimens such that the continuum offorms observed among Portieria specimens warranted a more detailed examinationfor detectable morphometric boundaries. Chapter 5 has demonstrated the utility ofconventional measurements and fractal parameters in unveiling subtlemorphological differences <strong>be</strong>tween the different Portieria species. Thesemorphometric procedures revealed not only the presence of pseudo-cryptic speciesin the Portieria complex but more significantly, the occurrence of morphologicaldifferentiation along with lineage diversification. These subtle variations, however,have <strong>be</strong>en detected <strong>be</strong>tween distantly related Portieria species under study. It might<strong>be</strong> worthwhile <strong>to</strong> investigate the scale and tempo at which morphologicaldifferences are manifested and established using closely related or recently divergedlineages. Although fine-scale conventional measurements and fractal parametersproved useful in showing morphological differences among lineages, thesecharacters may not prove very useful as practical hints that can guide fast speciesdiscrimination, for example, in the field.In chapters 3 and 4, a combination of DNA-based species delineationapproaches were employed <strong>to</strong> capture species groupings among Portieria samplesfrom the Philippines and the rest of the Indo-Pacific. One of the approaches,patterned after the phylogenetic species recognition approach by (Dettman et al.,2003), was <strong>to</strong> examine gene trees derived from 3 loci (cox2-3 spacer, EF2, and rbcLspacer) for congruence (Chapter 3, Fig. 3). Any incongruence among the gene treescan <strong>be</strong> used as clues for potential hybrids and/or the presence of incompletelineage sorting (ILS). Several monophyletic groups were concordantly supported bythe three loci, except for some differences within the V1 clade. Single- andmultilocus coalescent-based approaches identified additional species within cladeV1, indicating that the criteria of reciprocal monophyly and/or genealogical
210 CHAPTER 8concordance of independent loci (e.g., Dettman et al. 2003) are <strong>to</strong>o conservative <strong>to</strong>identify recently diverged species. Further testing using special models andalgorithmic approaches might <strong>be</strong> worthwhile <strong>to</strong> detect hybridization and ILS inPortieria (Maddison and Knowles, 2006; Mossel and Roch, 2008; Joly et al., 2009;Kubatko, 2009; Meng and Kubatko, 2009). Although, Portieria can <strong>be</strong> difficult <strong>to</strong>culture, breeding studies especially on the recently diverged V1 species can also <strong>be</strong>explored.The single-locus general mixed Yule-coalescent (GMYC) model analysisaims <strong>to</strong> recognize species boundaries from DNA sequences by identifying the shiftin the rate of lineage branching which corresponds <strong>to</strong> the transition from coalescent<strong>to</strong> speciation branching patterns on a phylogenetic tree (Pons et al., 2006; Leliaert etal., 2009; Monaghan et al., 2009). This model also determines the point of highestlikelihood of the transition (Pons et al., 2006; Monaghan et al., 2009). Speciesdelimitation using this method revealed approximately 21 Portieria species from thePhilippines and 49 species from the entire Indo-Pacific. This model appears <strong>to</strong>provide a very good approximation of Portieria species diversity as corroborated bythe strong support for speciation events on tree branches obtained from themultilocus Bayesian species delimitation analysis. The GMYC model is an approachthat is appropriate for rapid and large-scale detection of species (Pons et al., 2006),and can <strong>be</strong> useful for rapid approximation of (cryptic) diversity a certain taxon in aspecific area or large geographical region. Species delimitation using the GMYCmethod has <strong>be</strong>en utilized in green algae (Boodlea complex) (Leliaert et al., 2009) andbrown algae (Dictyota) (Tronholm et al., 2010a, submitted manuscript). The methodis first used on red algae in this thesis. Unlike the two previous studies, whichutilized nuclear or plastid genes, we used the mi<strong>to</strong>chondrial cox2-3 spacer for theGMYC species delimitation. The use of a mi<strong>to</strong>chondrial cox2-3 spacer is anappropriate choice for this method <strong>be</strong>cause it provides a high level of sequencevariation and exhibits fast coalescence, which makes lineage divergence amongcryptic species detectable (Gabrielsen et al., 2002; Provan et al., 2004). Moreover,we showed high congruence with other gene trees (plastid and nuclear). Otherstudies on red algae have also demonstrated the congruence of the cox2-3 derivedgene tree with other gene trees such as in Spyridia (Zuccarello et al., 2002), Bostrychia(Zuccarello and West, 2002, 2003) and in Gracilaria (Des<strong>to</strong>m<strong>be</strong> et al., 2010). Theproponents of the GMYC method require tests of congruence with additionalgenetic loci (Monaghan et al., 2009).We reinforced our single-locus GMYC analysis with multilocus Bayesian speciesdelimitation. Result for the Bayesian species delimitation was in accord with that of
General discussion 211the single-locus GMYC. The strength of the former method is the employment of amultilocus, multi-species coalescent framework while addressing gene treeuncertainties such as introgression and incomplete lineage sorting (ILS), which ariseoften in more recently diverged lineages (Leaché and Fujita, 2010). It takes in<strong>to</strong>account branch lengths on gene trees <strong>to</strong> distinguish <strong>be</strong>tween ancestral lineagesorting and hybridization that form potential species (Yang and Rannala, 2010). Itsolves these issues by integrating gene tree uncertainties in a Bayesian frameworkand incorporating a model of ILS via the coalescent process model (Yang andRannala, 2010). Apart from incorporating two important population geneticsparameters, i.e., population size and divergence times), this method requires a guidespecies tree which specifies relationships among species in the analysis. The speciestree was generated using *BEAST which estimates directly from the sequence dataand incorporates the uncertainty associated with gene trees, nucleotide substitutionmodel parameters and the coalescent process (Heled and Drummond, 2008; Leachéand Fujita, 2010). Our Philippine dataset in Chapter 3 displayed partialincongruence in the three loci specifically among the recently diverged V1 species.However, these groups are completely resolved as separate species in this method.8.2 Diversity and evolution of marine Indo-Pacific species8.2.1 Macroalgal diversity in the PhilippinesIt is estimated that there are about 6500 <strong>to</strong> 7000 species of macroalgae(Lüning et al., 1990; Silva, 1992). While several studies of marine shallow waterorganisms have shown that the central Indo-West Pacific region known as theCoral Triangle is a center of biodiversity, this is not always the case for macroalgaldiversity. Biodiversity studies based on macroalgal distribution datasets show thatthe most diverse seaweed floras occur in subtropical areas such as SouthernAustralia, Japan, Mediterranean Sea and Western Europe while species poor areasare in the polar oceans, West Africa and southeast Pacific (Silva, 1992; Bol<strong>to</strong>n,1994; Phillips, 2001; Kerswell, 2006; Hoeksema, 2007). These findings have <strong>be</strong>encorroborated by the recent report from the Census of Marine Life that someseaweeds peak in diversity and biomass in higher latitudes (Ausu<strong>be</strong>l et al., 2010).While the Coral Triangle does not pass as the center of macroalgal biodiversity, itsspecies richness is still recognized (Silva, 1992; Bol<strong>to</strong>n, 1994; Kerswell, 2006). Thereare about 900 species reported for the Philippines alone (Bol<strong>to</strong>n, 1994). Silva (1992)acknowledged that the Malay Peninsula extending <strong>to</strong> the Philippines is poorlyknown phycologically and that diversity is probably much higher. Diversity
212 CHAPTER 8estimates have <strong>be</strong>en mainly based on checklists of species occurrences identifiedmorphologically (Liao and Sot<strong>to</strong>, 1980; Cordero, 1981; Silva et al., 1987; Trono,1997; Kraft et al., 1999; Ti<strong>to</strong> et al., 2007). Only a few studies have investigatedspecies diversity within a genus, for example Caulerpa (Meñez and Calumpong,1982; de Senerpont Domis et al., 2003). Apart from these studies, there are nostudies addressing possible cryptic species diversity within the Philippines. Thus, itcan <strong>be</strong> expected that seaweed diversity is way far underestimated. Our report on theenormous cryptic diversity found in Portieria from the Philippines is very significantas it highlights the potential diversity that remains unexplored in other seaweedsand other marine organisms. This high diversity of Portieria in the Philippines ascompared <strong>to</strong> other Indo-Pacific sites may partially <strong>be</strong> attributed <strong>to</strong> sampling bias.However, such pattern observed in the Philippines is consistent with observationsmade in other seaweeds such as Caulerpa (Prud'Homme Van Reine et al., 1996) andother marine organisms, for example marine shore fishes (Carpenter and Springer,2005), cowries (Cypraeidae) (Paulay and Meyer, 2006) and other mollusks(Hoeksema, 2007). On the other hand, it cannot <strong>be</strong> ignored that if more sites arevisited, a potential for a higher diversity than currently reported can <strong>be</strong> present innon-Philippine sites. Most of these countries (Australia, Indonesia, Kenya, Taiwan,Tanzania, and Oman) revealed one species per collection site (see Table S4.1).Although, the scale of endemism and sympatric diversity remains <strong>to</strong> <strong>be</strong> determinedwith more specimens from closely-distanced sites comparable <strong>to</strong> the Batanes sites(Philippines). The same can <strong>be</strong> said <strong>to</strong> confirm the higher Portieria diversity in thePhilippines.8.2.2 Speciation within the PhilippinesContrary <strong>to</strong> the previous claims of several authors regarding speciationpatterns in the Indo-west Pacific (Santini and Winterbot<strong>to</strong>m, 2002), the pattern ofdiversity exhibited by Portieria in the Philippines and within the Indo-Pacific doesnot support a single predominant mechanism of speciation. The diversity in Portieria(and probably among similar marine organisms) is a product of both speciationwithin the Philippines and accumulation of species from peripheral areas. Thepresence of several species of Portieria within the Philippines reinforces the claimthat seaweeds are overall poor dispersers (Kinlan and Gaines, 2003; Shanks et al.,2003). The young sister lineages (V1A-E, Chapter 4 and 5) <strong>be</strong>st demonstrates theoccurrence of speciation in the Philippines. Further clues of speciation in thePhilippines can <strong>be</strong> inferred from a clade showing closer relationship of Philippinelineages with species from the opposite sides of the Indo-Pacific (Maldives and
General discussion 213Hawaii). Although, Portieria can <strong>be</strong> expected <strong>to</strong> <strong>be</strong> a poor disperser as demonstratedby studies involving other seaweeds (Kinlan and Gaines, 2003; Shanks et al., 2003),it is possible that over long time scales a population expands and contracts leavingremnants from the periphery <strong>to</strong> speciate (Briggs, 1999, 2000). Despite its poordispersal capability, Portieria propagules can survive very well the moment itmanages <strong>to</strong> enter a vec<strong>to</strong>r for dispersal (such as the current). Paulay and Meyer(2002) argued that endemism through founder speciation is most likely <strong>to</strong> occuramong organisms that rarely enter the transport medium but survive well in it.Furthermore, the sea-level fluctuations during the Pleis<strong>to</strong>cene caused themaking and breaking of land barriers which may have repeatedly separatedpopulations, creating a setting for allopatric speciation (Briggs, 1999). Tec<strong>to</strong>nicevents in the Oligo-Miocene epoch caused significant geological changes thatcreated discontinuous land connections and geographical complexity. Thisprompted opportunities for speciation (McManus, 1985; Williams and Duda Jr,2008). One of the most important tec<strong>to</strong>nic events in the IWP during the Oligo–Miocene was the collision of the Australia and New Guinea plate with the southeastextremity of the Eurasian plate and the Philippines-Halmahera-New Guinea arcsystem approximately 25 Ma (Hall, 1998). This was followed soon afterwards by acollision <strong>be</strong>tween the On<strong>to</strong>ng Java plateau and the Melanesian arc. These twoevents caused significant geological changes in the central IWP that created adiscontinuous land connection via the island arcs of Halmahera and the Philippinesin<strong>to</strong> Sulawesi, and also changed ocean currents (Hall, 1998). A broad zone ofshallow water occurred <strong>be</strong>tween Australia and Sulawesi, probably with numerousislands (Hall, 1998). Long, discontinuous island arcs also linked Asia and Melanesia(Hall, 1998). These tec<strong>to</strong>nic events decreased the isolation of the central IWP frommore peripheral regions and increased both the amount of shallow-water area andthe length of coastline. (Wilson and Rosen, 1998) argue that the geographicalcomplexity of the region provided opportunities for the isolation and origination ofnew species. An increase in reef-building corals in the central IWP contributed <strong>to</strong>the radiation of reef-associated organisms such as mollusks and fish (Alfaro et al.,2007; Williams and Duda Jr, 2008).A possible reinforcing fac<strong>to</strong>r of speciation especially those of recentlineages (V1A-E) are the site-specific seasonal patterns of Portieria which coincidewith monsoonal patterns affecting the areas (Chapter 7). In Chapter 7, it isdemonstrated that Portieria proliferates during the period of strong wave actionswhich varies depending on the monsoonal wind affecting a site. Variation in periodof proliferation suggests asynchrony in spawning period among the different
214 CHAPTER 8populations. This limits gene flow even in closely-distanced sites. Spawningasynchrony presents an opportunity for diversification in marine species (Palumbi,1994) and this phenomenon has <strong>be</strong>en observed in many sibling/cryptic species(Knowl<strong>to</strong>n, 1993; Palumbi, 1994).Although speciation may <strong>be</strong> occurring within the IMA or more precisely, inthe Philippines, high diversity in Portieria may <strong>be</strong> due in part from the accumulationof species in this region. Species aggregation may have resulted from complextec<strong>to</strong>nic reorganizations during the Cenozoic particulary in the last 45, 25 and 5 Mainvolving the SE Asian region (Hall, 2002).8.2.3 Natural product variability in macroalgaeReports on marine natural products indicate a wide range of secondarymetabolites from marine macroalgae. These compounds vary from halogenatedindoles, terpenes, ace<strong>to</strong>genins, and phenols <strong>to</strong> halogenated hydrocarbons producedon a large scale (Hay and Fenical, 1996; Moore, 1999; Blunt et al., 2004; Butler andCarter-Franklin, 2004; Cardozo et al., 2007). They are known <strong>to</strong> vary in theirbioactivity properties (e.g. antiviral, antibacterial, and cy<strong>to</strong><strong>to</strong>xic properties) and canhave various biomedical and pharmacological uses (Smit, 2004). On an ecologicalperspective, it has <strong>be</strong>en demonstrated that these compounds are used as chemicalcues and can have indirect effects on <strong>be</strong>havior of organisms (Hay, 2009). Thus, theycan strongly influence population and community organization, affect resourceallocation, influence competition and mediate species distributions, and select fortraits leading <strong>to</strong> potential diversification of species (Pelletreau and Targett, 2008;Hay, 2009). Despite of its importance, there is an unbalanced research effort<strong>be</strong>tween prospecting for potentially useful compounds and understanding themechanisms <strong>be</strong>hind the production and diversity of these compounds in seaweeds.In the case of Portieria, research has focused on the isolation of halogenatedcompounds from 1974 onwards (Table 1, Chapter 6). Until now, only two studieshave employed a biological perspective designed <strong>to</strong> understand the production ofthese compounds (Puglisi and Paul, 1997; Matlock et al., 1999). The case of Portieriahas demonstrated that a lack of biological knowledge can prevent the tapping ofpotentially useful compounds (such as halomon). Scientists working on thedevelopment of halomon in<strong>to</strong> anti-cancer drug were <strong>be</strong>set with the unstable supplyof halomon-containing Portieria extracts from natural samples (Fuller et al., 1992;Fuller et al., 1994). Our data has shown that Portieria includes numerous cryptic orpseudo-cryptic species (Chapters 3 and 4) and that intraspecific variability ofsecondary metabolites is also present among the different life stages (Chapter 6).
General discussion 215The absence of such biological information has prevented drug and biomedicalscientists from undertaking research decisions that would have allowed further drugdevelopment of halomon. Although it is known that secondary metabolites arederived from a combination of phylogenetic and ecological fac<strong>to</strong>rs (Pelletreau andTargett, 2008), the relationship <strong>be</strong>tween cryptic species and secondary metabolitepatterns in marine macroalgae has rarely <strong>be</strong>en investigated. In contrast, studies onchemical diversity in other marine organisms, for example, among bryozoans,marine actinomycetes and cyanobacteria, are <strong>be</strong>ing conducted in tandem withphylogenetic diversity investigations (McGovern and Hell<strong>be</strong>rg, 2003; Jensen et al.,2005; Jensen et al., 2007). These studies showed a degree of species specificity onthe production of secondary metabolites. On the other hand, a few studiesconcerned with the distribution of secondary metabolites demonstrated withinthallus variation, for example, in Dictyota (Cronin and Hay, 1996; Dworjanyn et al.,1999), Delisea (Dworjanyn et al., 1999), and Caulerpa (Meyer and Paul, 1992). Theresult on the chemical variation among life-his<strong>to</strong>ry stages in Portieria is corroboratedby studies conducted in Asparagopsis (Verges et al., 2008) and Dictyota (Cavalcanti etal., 2010). However, some of these investigations were conducted in context withthe palatability of these different stages among grazers. The relationship <strong>be</strong>tweengrazing pressure and secondary metabolite variation in Portieria remains <strong>to</strong> <strong>be</strong>pursued.8.3 Future prospectsPortieria is one of the severely understudied taxa among marine macroalgae.This thesis has greatly improved our understanding of diversity, distributions,evolution, ecology and chemical composition of Portieria; however, many questionsremain. With the knowledge of the enormous cryptic and pseudocryptic diversity inPortieria, additional data probably will <strong>be</strong> needed <strong>to</strong> understand the link <strong>be</strong>tweenthese different lineages and the production of metabolites. Chapter 6 has onlyexamined secondary metabolite variation <strong>be</strong>tween Batanes lineages. Therefore, theextent of this variation can <strong>be</strong> determined through closely and distantly-relatedlineages. GC-MS spectra from different lineages can <strong>be</strong> used <strong>to</strong> assesschemosystematic potentials of some compounds. Chapter 6 (Table 1) shows thatsome compounds can <strong>be</strong> exclusive <strong>to</strong> a species. Furthermore, this study hasprovided strong indications that specific compounds can potentially <strong>be</strong> exclusive <strong>to</strong>certain life stages and/or Portieria species. These new insights may guide futurebioprospecting efforts.
216 CHAPTER 8The determination of the influence of grazers on the secondary metaboliteproduction has not <strong>be</strong>en successfully carried out during the course of this study.Early attempts <strong>to</strong> grow field-collected Portieria in aquaria were <strong>be</strong>set by death due <strong>to</strong>high temperature in the aquaria environment. Results on the seasonality chapter(Chapter 7) suggest the need of such plants for strong wave actions. Thus, anyfuture attempt <strong>to</strong> grow these plants in the aquaria will have <strong>to</strong> consider options <strong>to</strong>mimic this environmental requirement. Another obstacle for this experiment wasthe continuous larval development of the seahare Aplysia on the thallus of the alga.While adults and eggs were easy <strong>to</strong> remove from the thallus, this microscopic stageof the natural Portieria herbivore was difficult <strong>to</strong> get rid. Future grazing studies willneed <strong>to</strong> find ways <strong>to</strong> disinfect the plants from Aplysia larvae or <strong>to</strong> assess the utilityof the UV light for such purpose.The seasonality pattern observed in Portieria has not <strong>be</strong>en reported in anyother seaweed taxa or in other marine organisms. Ecological studies on otherorganisms can also <strong>be</strong> conducted in this light <strong>to</strong> confirm the extent of the influenceof monsoons on <strong>be</strong>nthic organisms. Our seasonality study on Portieria suggests theimportance of water motion or wave action on monsoon seasons on the seasonalgrowth of some algae. Bot<strong>to</strong>m flow patterns and turbulence can <strong>be</strong> quantified usingclod cards (Ryder et al., 2004) or dynamometers (Palumbi, 1984) during the periodof seasonality study.Future efforts can also <strong>be</strong> directed <strong>to</strong> determining the presence ofassociated micro<strong>be</strong>s influencing variation of the production of metabolites. It isobvious that Portieria produces metabolites as shown by the intraspecies variationamong life-his<strong>to</strong>ry stages. However, the lack of geographical or temporal patternmay not only <strong>be</strong> influenced by life-his<strong>to</strong>ry stage variation but also by differentassociated micro<strong>be</strong>s that produce their own compounds. Bacteria associated withsponges have <strong>be</strong>en found responsible in the production of compounds (Moore,2006; Thomas et al., 2010). Geographic variation among secondary metabolites can<strong>be</strong> due <strong>to</strong> difference in associated bacteria.In the Philippines, genetic connectivity of coral reefs has <strong>be</strong>en used <strong>to</strong>justify the establishment of marine protected areas that are of close proximity(Palumbi, 2001, 2003). The design of marine reserves requires understanding oflarval transport in and out of reserves (Palumbi, 2003). While Portieria generallyappears <strong>to</strong> <strong>be</strong> lowly dispersed, lineage V32 in the Visayas has <strong>be</strong>en successfullydistributed in several islands. Local current patterns as well the extent of thedistribution of lineage V32 may <strong>be</strong> used <strong>to</strong> understand local dispersal patterns andconnectivity in the Visayas. Portieria has no current economic value which makes it
General discussion 217an uncultivated species. Therefore, its distribution may not <strong>be</strong> significantlyinfluenced by humans as in other cultivated species. This makes it an ideal speciesfor population genetic connectivity studies.8.4 Taxonomic implicationsOur analyses have shown considerable conflict <strong>be</strong>tween morphological andDNA-based species definitions, resulting in incongruence <strong>be</strong>tween DNA-basedspecies diversity and traditional taxonomy. About 12 Portieria species have <strong>be</strong>endescri<strong>be</strong>d based on morphological criteria (Wiseman, 1973), of which about sevenare currently recognized (Guiry and Guiry 2011, Silva et al. 1987). Our studiesunveil a much higher diversity of at least 51 species in the Indo-Pacific. Theseresults have an immediate impact on the common habit of taxonomists <strong>to</strong> descri<strong>be</strong>newly discovered species formally using a system that builds on the practicesinitiated more than 250 years ago by Linnaeus. The introduction of DNA <strong>to</strong>identify and genotype species, made phycologists realise from an early stageonwards that there is no one-<strong>to</strong>-one relationship <strong>be</strong>tween morphology and speciesdiversity as reflected in the genotype. Nearly every group of algae that wasscrutinized revealed non-neglectable levels of cryptic diversity. As long the slope ofthe morphology/genotypic diversity slope was not <strong>to</strong>o steep, however, taxonomistsfelt comfortable describing the odd (pseudo-)cryptic species. Our data, however,demonstrate that a single algal morphospecies may contain as many as 51phylogenetic species, and there is no reason <strong>to</strong> <strong>be</strong>lieve that increased taxonsampling will not turn out another 50 or even more species. From the perspectiveof a practical taxonomist this makes one feel really uncomfortable, <strong>be</strong>cause at thevery heart of descriptive taxonomy lies utilitarian perspective. The extreme levels ofcryptic diversity as observed in Portieria are clearly at odds with this utilitarianperspective, for one is never going <strong>to</strong> recognize or identify the individual species.We could give them num<strong>be</strong>rs or letters, similar <strong>to</strong> strains of Symbiodynium living aszooxanthellia in coral polyps (Coffroth and San<strong>to</strong>s, 2005) or species of the greenalgal Boodlea-complex (Leliaert et al., 2009), respectively.A major source of uncertainty, however, is formed by linking the literaturenames <strong>to</strong> the extant diversity. Following the Linnean classification system, theidentity of the type specimen will determine which names should <strong>be</strong> applied <strong>to</strong>which clades. If the morphology or geographic origin of the type specimens isinconclusive, one could potentially attempt <strong>to</strong> sequence type specimens, but itshould <strong>be</strong> realized that is a costly and time-consuming exercise. Furthermore, thedegree <strong>to</strong> which cryptic diversity is unveiled in this study makes it a daunting task.
218 CHAPTER 8Therefore, it might <strong>be</strong> necessary <strong>to</strong> discontinue the use of these names if it is notabsolute if a specimen is genetically identical <strong>to</strong> the type material. In addition, thediversity revealed in our study is much higher than the num<strong>be</strong>r of currentlydescri<strong>be</strong>d Portieria species, which imply that a large part of the diversity would have<strong>to</strong> <strong>be</strong> formally descri<strong>be</strong>d according <strong>to</strong> the rules of botanical nomenclature (ICBN2011).Formal taxonomic nomenclature (traditional taxonomy) is important indeveloping awareness of visually (or may involve other senses) perceptibledifferences <strong>be</strong>tween distantly related species. For a practical example, it is necessary<strong>to</strong> know the basic morphological characters of Portieria <strong>to</strong> <strong>be</strong> able <strong>to</strong> distinguish it inthe field against a similarly branching alga like Plocamium (Family Plocamiaceae).Earlier descriptions on Portieria have proved sufficient in distinguishing this plantagainst similarly looking non-sibling species. Since Portieria has limitedmorphological divergence and distinguishing characters that can <strong>be</strong> easily definedby human eye, it might no longer <strong>be</strong> necessary <strong>to</strong> descri<strong>be</strong> each species in thetraditional manner. The emergence of 51 Portieria sibling species needs <strong>to</strong> <strong>be</strong>handled with pragmatism. Whether all these new species have <strong>to</strong> <strong>be</strong> descri<strong>be</strong>d in thetraditional manner, the answer should <strong>be</strong> in consideration of the costs and <strong>be</strong>nefitsof describing each species. Describing new species in the traditional mannerrequires searching and describing the gap in the morphological continuum whichmight <strong>be</strong> difficult or not at all present in many Portieria species. It has <strong>be</strong>enestimated that an average taxonomist descri<strong>be</strong>s an average 24.8 new species in anentire career and about US$48, 500 per species (Mora et al., 2011). These estimatesmight not completely apply <strong>to</strong> Portieria but the cost and the time devoted will mostlikely outweigh the <strong>be</strong>nefits, if there are any. In a period of rapid biodiversitydecline, priorities may have <strong>to</strong> <strong>be</strong> given <strong>to</strong> cost efficient procedures.In cases where research objectives require that sibling species <strong>be</strong>distinguished, such as in pharmacognosy, then these entities can <strong>be</strong> efficientlyidentified with molecular characters. These 51 sibling species can <strong>be</strong> assigned withpermanent codes that correspond <strong>to</strong> their DNA characters which can serve asstandards for future references. The use of morphometric techniques in Portieriamanaged <strong>to</strong> ―decrypt‖ some of its mem<strong>be</strong>r species. The parameters useddemonstrated the distinctive morphology of some lineages, most particularly V32.These morphometric dimensions may <strong>be</strong> fed in<strong>to</strong> artificial neural network systemsthat can au<strong>to</strong>mate recognition and classification of plants (Pandolfi 2006).Although, the method appears useful, DNA analysis is a more efficient speciesidentification or classification <strong>to</strong>ol compared <strong>to</strong> the entire process of image and
General discussion 219statiscal analyses. DNA presents a stable and accurate information on the identityof a species while morphometric values can present a high degree of variance whichcan <strong>be</strong> due <strong>to</strong> for example, measurement lapses. Plants afflicted with diseases mayalso exhibit a different form than usual. The essence of morphometric applicationon Portieria in this study was its utility in demonstrating the occurrence ofmorphological divergence along with genetic differentiation.8.5 Significance of the study in the Philippine settingThe need <strong>to</strong> study the genetic biodiversity of the Philippine flora and faunais slowly <strong>be</strong>ing recognized with the recent efforts by Filipino geneticists and theDepartment of Science and Technology <strong>to</strong> establish the University of thePhilippines- Philippine Genome Center. This study therefore serves as a timelycontribution <strong>to</strong> the knowledge of the scale of macroalgal diversity that needs <strong>to</strong> <strong>be</strong>expected, studied, and allocated with research funds.8.6 ConclusionsThe genus Portieria shares a similar basic structure with other mem<strong>be</strong>rs ofthe Rhizophyllidaceae such as a pseudoparechyma<strong>to</strong>us thallus with inner cellsdifferentiated in<strong>to</strong> cellular medulla and peripheral cells in<strong>to</strong> a cortical layer, thinrhizoidal filaments, large gland cells, and most likely, the absence of secondary pitconnections. Non-procarpic reproduction and the presence of nemathecia in alllife-his<strong>to</strong>ry stages are also consistent with the rest of the mem<strong>be</strong>rs of theRhizophyllidaceae. Molecular sequence analysis confirms close phylogeneticrelationships among genera of the Rhizophyllidaceae. Contarinia is resolved as asister taxon of a clade uniting Nesophila, Och<strong>to</strong>des and Portieria.The genus Portieria has at least 21 species in the Philippines based oncoalescent based single locus (General Mixed Yule Coalescent Model) andmultilocus (Bayesian species delimitation) species delimitation approaches. Thesegene sequence analyses demonstrate that previous morphology-based speciescircumscriptions underestimate Portieria diversity in the respective region. Thecongruence observed <strong>be</strong>tween the single-locus and multilocus species delimitationanalyses is an important finding as it supports the utility of single but fast coalescingloci for species delimitation. The diversity pattern of Portieria in the Philippinesdemonstrates that species level diversity may <strong>be</strong> structured at a much smaller scale(
220 CHAPTER 8Although several tropical groups exhibit highly congruent patterns ofbiodiversity, with a prominent hotspot in the Indo-Malayan Archipelago (IMA),there may <strong>be</strong> no single explanation for this pattern. Given the age and complexgeological his<strong>to</strong>ry, along with the vast biological diversity of (IMA), it is likely thatmultiple processes have probably <strong>be</strong>en at work over long temporal scales (Bar<strong>be</strong>r,2009, Halas & Winterbot<strong>to</strong>m, 2009). Our phylogenetic analysis of Portieria in theIndo-Pacific reflect the long and complex evolutionary his<strong>to</strong>ry of this seaweed andsuggests that the observed biogeographical patterns are a combination of long-termpersistence of ancient lineages within confined geographical regions, including theIMA, along with more recent speciation events, possibly related <strong>to</strong> the climaticchanges in the Pleis<strong>to</strong>cene. The IMA biodiversity hotspot has provided a focus fornumerous evolutionary and ecological studies, which have in their turn supportedstrategies for conservation efforts (Carpenter et al., 2008). Our study adds <strong>to</strong> thegrowing body of evidence that the present-day species richness within the IMAhotspot results from long and intricate evolutionary trajec<strong>to</strong>ries. For manyorganismal groups, the IMA likely serves as both a species pump and a ―museum‖of biodiversity, harboring ancient lineages that were formed prior <strong>to</strong> the geologicalformation of the coral triangle. Ecological and conservation related research alsodepends on a clear understanding of species boundaries, which is often problematicdue <strong>to</strong> the prevalence of cryptic species in marine environments (Bickford et al.,2007). This study shows clearly that misconceptions about species boundaries mayimpact on our understanding of distributions and diversification of tropicalseaweeds.Diversification in some Portieria species did coincide with subtlemorphological differentiations which are detectable through morphometric analyses(fractal, non-conventional, and conventional variables). At least some species cantherefore <strong>be</strong> classified as pseudocryptic.Portieria species in the Philippines are a rich source of secondarymetabolites. This diversity in secondary metabolites amounts <strong>to</strong> at least 302 variouscompounds. The majority of which are exotic, remain undescri<strong>be</strong>d and thereforeare not available in natural product databases. Intraspecific variation in secondarymetabolites occurs <strong>be</strong>tween life-his<strong>to</strong>ry stages. Female game<strong>to</strong>phytes (202compounds) are chemically richer compared <strong>to</strong> that of the males (102) andtetrasporophytes (106). Variation in secondary metabolites also occurs <strong>be</strong>tween aswell as within these species. These results suggest that life-his<strong>to</strong>ry driven variationsand possibly other microscale fac<strong>to</strong>rs may have an important influence on thevariation within Portieria species.
General discussion 221Portieria species in the Philippines have a site-specific seasonality that isinfluenced by strong wave actions influenced by monsoonal winds. The increasedwave motion during the monsoon seasons provides opportunities for Portieriapopulations in two ways: habitat availability and the increased availability ofresources for its physiological needs.
222 CHAPTER 8
General discussion 2238.7 ReferencesAgapow, P.M., Bininda-Emonds, O.R.P., Crandall, K.A., Gittleman, J.L., Mace, G.M., Marshall, J.C.,Purvis, A., 2004. The impact of species concept on biodiversity studies. Q. Rev. Biol., 161-179.Alfaro, M.E., Santini, F., Brock, C.D., Schwenk, K., 2007. Do reefs drive diversification in marineteleosts? Evidence from the pufferfish and their allies (Order Tetraodontiformes). Evolution61, 2104-2126.Andreakis, N., Procaccini, G., Maggs, C., Kooistra, W.H.C.F., 2007. Phylogeography of the invasiveseaweed Asparagopsis (Bonnemaisoniales, Rhodophyta) reveals cryptic diversity. Mol. Ecol.16, 2285-2299.Ausu<strong>be</strong>l, J.H., Crist, D.T., Waggoner, P.E. (Eds.), 2010. First census of marine life 2010: Highlights ofa decade of discovery. Census of Marine Life, Washing<strong>to</strong>n D.C.Bar<strong>be</strong>r, P.H., 2009. The challenge of understanding the Coral Triangle biodiversity hotspot. Journal ofBiogeography 36, 1845-1846.Bickford, D., Lohman, D.J., Sodhi, N.S., Ng, P.K.L., Meier, R., Winker, K., Ingram, K.K., Das, I.,2007. Cryptic species as a window on diversity and conservation. Trends Ecol. Evol. 22, 148-155.Blunt, J.W., Copp, B.R., Munro, M.H.G., Northcote, P.T., Prinsep, M.R., 2004. Marine naturalproducts. Nat. Prod. Rep. 21, 1-49.Bol<strong>to</strong>n, J.J., 1994. Global seaweed diversity: patterns and anomalies. Bot. Mar. 37, 241-246.Briggs, J.C., 1999. Modes of speciation: marine Indo-West Pacific. Bull. Mar. Sci. 65, 645-656.Briggs, J.C., 2000. Centrifugal speciation and centres of origin. J. Biogeogr. 27, 1183-1188.Butler, A., Carter-Franklin, J.N., 2004. The role of vanadium bromoperoxidase in the biosynthesis ofhalogenated marine natural products. Nat. Prod. Rep. 21, 180-188.Cardozo, K.H.M., Guaratini, T., Barros, M.P., Falcão, V.R., Tonon, A.P., Lopes, N.P., Campos, S.,Torres, M.A., Souza, A.O., Colepicolo, P., 2007. Metabolites from algae with economicalimpact. Comp. Biochem. Phys C: 146, 60-78.Carpenter, K.E., Springer, V.G., 2005. The center of the center of marine shore fish biodiversity: thePhilippine Islands. Environ. Biol. Fishes 72, 467-480.Carpenter, K.E., Abrar, M., Aeby, G., Aronson, R.B., Banks, S., Bruckner, A., Chiriboga, A., Cortes,J., Del<strong>be</strong>ek, J.C., DeVantier, L., Edgar, G.J., Edwards, A.J., Fenner, D., Guzman, H.M.,Hoeksema, B.W., Hodgson, G., Johan, O., Licuanan, W.Y., Livings<strong>to</strong>ne, S.R., Lovell, E.R.,Moore, J.A., Obura, D.O., Ochavillo, D., Polidoro, B.A., Precht, W.F., Quibilan, M.C.,Rebo<strong>to</strong>n, C., Richards, Z.T., Rogers, A.D., Sanciangco, J., Sheppard, A., Sheppard, C.,Smith, J., Stuart, S., Turak, E., Veron, J.E.N., Wallace, C., Weil, E., Wood, E., 2008. Onethirdof reef-building corals face elevated extinction risk from climate change and localimpacts. Science 321, 560-563.Carstens, B.C., Dewey, T.A., 2010. Species delimitation using a combined coalescent and informationtheoreticapproach: an example from North American Myotis bats. Syst. Biol. 59, 400.Casteleyn, G., Chepurnov, V.A., Leliaert, F., Mann, D.G., Bates, S.S., Lundholm, N., Rhodes, L.,Sab<strong>be</strong>, K., Vyverman, W., 2008. Pseudo-nitzschia pungens (Bacillariophyceae): a cosmopolitandia<strong>to</strong>m species? Harmful Algae 7, 241-257.Cavalcanti, D.N., de Oliveira, M.A.R., De-Paula, J.C., Barbosa, L.S., Fogel, T., Pin<strong>to</strong>, M.A., de PalmerPaixão, I.C.N., Teixeira, V.L., 2010. Variability of a diterpene with potential anti-HIVactivity isolated from the Brazilian brown alga Dictyota menstrualis. J. Appl. Phycol., 1-4.Chase, M.W., Salamin, N., Wilkinson, M., Dunwell, J.M., Kesanakurthi, R.P., Haidar, N., Savolainen,V., 2005. Land plants and DNA barcodes: short-term and long-term goals. Philos. T. Roy.Soc. B: 360, 1889.Claridge, M.A., Dawah, H.A., Wilson, M.R., 1997, Species: the units of diversity. Chapman and Hall,London.
224 CHAPTER 8Cordero, P.A., 1981. Studies on Philippine marine red algae. National Museum of the Philippines,Manila.Coffroth, M.A., San<strong>to</strong>s, S.R., 2005. Genetic diversity of symbiotic dinoflagellates in the genusSymbiodinium. Protist 156, 19-34.Cracraft, J., 1983. Species concepts and speciation analysis. Curr Ornithol 1, 159-187.Cronin, G., Hay, M.E., 1996. Within plant variation in seaweed palatability and chemical defenses:Optimal defense theory versus the growth differentiation balance hypothesis. Oecologia 105,361-368.Davis, J.I., Nixon, K.C., 1992. Populations, genetic variation, and the delimitation of phylogeneticspecies. Syst. Biol. 41, 421.de Queiroz, K., 2005. Different species problems and their resolution. Bioessays 27, 1263-1269.de Queiroz, K., 2007. Species concepts and species delimitation. Syst. Biol. 56, 879.de Senerpont Domis, L.N., Fama, P., Bartlett, A.J., Prud'homme van reine, W.F., Espinosa, C.A.,Trono, G.C., 2003. Defining taxon boundaries in mem<strong>be</strong>rs of the morphologically andgenetically plastic genus Caulerpa (Caulerpales, Chlorophyta). J. Phycol. 39, 1019-1037.Degnan, J.H., Rosen<strong>be</strong>rg, N.A., 2009. Gene tree discordance, phylogenetic inference and themultispecies coalescent. Trends Ecol. Evol. 24, 332-340.Des<strong>to</strong>m<strong>be</strong>, C., Valero, M., Guillemin, M.L., 2010. Delineation of two sibling red algal species,Gracilaria gracilis and Gracilaria dura (Gracilariales, Rhodophyta), using multiple DNAmarkers: resurrection of the species G. dura previously descri<strong>be</strong>d in the Northern Atlantic200 years ago. J. Phycol. 46, 720-727.Dettman, J.R., Jacobson, D.J., Taylor, J.W., 2003. A multilocus genealogical approach <strong>to</strong> phylogeneticspecies recognition in the model eukaryote Neurospora. Evolution 57, 2703-2720.Dworjanyn, S.A., De Nys, R., Stein<strong>be</strong>rg, P.D., 1999. Localisation and surface quantification ofsecondary metabolites in the red alga Delisea pulchra. Mar. Biol. 133, 727-736.Fontane<strong>to</strong>, D., Herniou, E.A., Boschetti, C., Caprioli, M., Melone, G., Ricci, C., Barraclough, T.G.,2007. Independently evolving species in asexual bdelloid rotifers. PLoS Biol. 5, 914-921.Fuller, R.W., Cardellina, J.H., Jurek, J., Scheuer, P.J., Alvaradolindner, B., McGuire, M., Gray, G.N.,Steiner, J.R., Clardy, J., Menez, E., Shoemaker, R.H., Newman, D.J., Snader, K.M., Boyd,M.R., 1994. Isolation and structure activity features of halomon-related antitumormonoterpenes from the red alga Portieria hornemannii J. Med. Chem. 37, 4407-4411.Fuller, R.W., Cardellina, J.H., Ka<strong>to</strong>, Y., Brinen, L.S., Clardy, J., Snader, K.M., Boyd, M.R., 1992. Apentahalogenated monoterpene from the red alga Portieria hornemannii produces a novelco<strong>to</strong><strong>to</strong>xicity profile against a diverse panel of human tumor cell lines J. Med. Chem. 35, 3007-3011.Gabrielsen, T.M., Brochmann, C., Rueness, J., 2002. The Baltic Sea as a model system for studyingpostglacial colonization and ecological differentiation, exemplified by the red algaCeramium tenuicorne. Mol. Ecol. 11, 2083-2095.Galtier, N., Daubin, V., 2008. Dealing with incongruence in phylogenomic analyses. Philos. T. Roy. Soc.B: 363, 4023-4029.Guiry, M.D., Guiry, G.M., 2011. AlgaeBase. World-wide electronic publication, National University ofIreland, Galway. http://www.algaebase.org; searched on 19 June 2011.Halas, D., Winterbot<strong>to</strong>m, R., 2009. A phylogenetic test of multiple proposals for the origins of theEast Indies coral reef biota. J. Biogr. 36, 1847-1860.Hall, R., 1998. The plate tec<strong>to</strong>nics of Cenozoic SE Asia and the distribution of land and sea. In: Hall,R., Holloway, J.D. (Eds.), Biogeography and geological evolution of SE Asia. BackhuysPublishers, Leiden, pp. 99-131.Hall, R., 2002. Cenozoic geological and plate tec<strong>to</strong>nic evolution of SE Asia and the SW Pacific:computer-based reconstructions, model and animations. J Asian Earth Sci 20, 353-431.Harvey, J.B.J., Goff, L.J., 2006. A reassessment of species boundaries in Cys<strong>to</strong>seira and Halidrys(Phaeophyceae, Fucales) along the North American west coast. J. Phycol. 42, 707-720.
General discussion 225Hay, M.E., 2009. Marine chemical ecology: Chemical signals and cues structure marine populations,communities, and ecosystems. Ann. Rev. Mar. Sci. 1, 193-212.Hay, M.E., Fenical, W., 1996. Chemical ecology and marine biodiversity: insights and products fromthe sea. Oceanography 9.Heled, J., Drummond, A., 2008. Bayesian inference of population size his<strong>to</strong>ry from multiple loci.BMC Evol. Biol. 8, 289.Hey, J., 2006. On the failure of modern species concepts. Trends Ecol. Evol. 21, 447-450.Hoeksema, B., 2007. Delineation of the Indo-Malayan centre of maximum marine biodiversity: thecoral triangle. In: Renema, W. (Ed.), Biogeography, Time and Place: Distributions, Barriersand Islands: Topics in Geobiology. Springer, Dordrecht, pp. 117-178.Hörnig, I., Schnetter, R., 1988. Notes on Dictyota dicho<strong>to</strong>ma, D. menstrualis, D. indica and D. pulchella spec.nova (Phaeophyta). Phy<strong>to</strong>n (Austria) 28, 277-291.Jensen, P.R., Mincer, T.J., Williams, P.G., Fenical, W., 2005. Marine actinomycete diversity and naturalproduct discovery. An<strong>to</strong>nie Van Leeuwenhoek 87, 43-48.Jensen, P.R., Williams, P.G., Oh, D.C., Zeigler, L., Fenical, W., 2007. Species-specific secondarymetabolite production in marine actinomycetes of the genus Salinispora. Appl. Environ.Microbiol. 73, 1146.John, D.M., Maggs, C.A., 1997. Species problems in eukaryotic algae: a modern perspective. In:Claridge, M.F., Dawah, H.A., Wilson, M.R. (Eds.), Systematics Association Special Volume,pp. 83-107.Joly, S., McLenachan, P.A., Lockhart, P.J., 2009. A statistical approach for distinguishing hybridizationand incomplete lineage sorting. Am. Nat. 174, E54-70.Kerswell, A.P., 2006. Global biodiversity patterns of <strong>be</strong>nthic marine algae. Ecology 87, 2479-2488.Kinlan, B.P., Gaines, S.D., 2003. Propagule dispersal in marine and terrestrial environments: acommunity perspective. Ecology 84, 2007-2020.Knowles, L.L., Carstens, B.C., 2007. Delimiting species without monophyletic gene trees. Syst. Biol. 56,887.Knowl<strong>to</strong>n, N., 1993. Sibling species in the sea. Annu. Rev. Ecol. Syst. 24, 189-216.Knowl<strong>to</strong>n, N., 2000. Molecular genetic analyses of species boundaries in the sea. Hydrobiologia 420, 73-90.Kraft, G.T., Liao, L.M., Millar, A.J.K., Coppejans, E.G.G., Hommersand, M.H., Freshwater, D.W.,1999. Marine <strong>be</strong>nthic red algae (Rhodophyta) from Bulusan, Sorsogon Province, SouthernLuzon (Philippines). Philippine Scientist (Philippines).Kubatko, L.S., 2009. Identifying hybridization events in the presence of coalescence via modelselection. Syst. Biol. 58, 478-488.Leaché, A.D., Fujita, M.K., 2010. Bayesian species delimitation in West African forest geckos(Hemidactylus fasciatus). P. Roy. Soc. B: Bio. 277, 3071.Leliaert, F., Verbruggen, H., Wysor, B., De Clerck, O., 2009. DNA taxonomy in morphologicallyplastic taxa: Algorithmic species delimitation in the Boodlea complex (Chlorophyta:Cladophorales). Mol. Phylogen. Evol. 53, 122-133.Liao, L., Sot<strong>to</strong>, F.B., 1980. A preliminary list of marine algae of Mactan Island and the neighboringislands (Cebu, Philippines). The Philipp. Sci 17, 94-100.Lindstrom, S.C., 2008. Cryptic diversity and phylogenetic relationship and phylogenetic relationshipswithin the Mas<strong>to</strong>carpus papillatus species complex (Rhodophyta, Phyllophoraceae) J. Phycol.44, 1300-1308.Lüning, K., Yarish, C., Kirkman, H., 1990. Seaweeds: their environment, biogeography, andecophysiology. Wiley-Interscience.Maddison, W.P., Knowles, L.L., 2006. Inferring phylogeny despite incomplete lineage sorting. Syst.Biol. 55, 21.Maggs, C.A., Verbruggen, H., De Clerck, O. (Eds.), 2007. 6 Molecular systematics of red algae:building future structures on firm foundations. In Unravelling the Algae: the Past, Present,
226 CHAPTER 8and Future of Algal Systematics (Brodie J. and Lewis J. edi<strong>to</strong>rs), 103-121, CRC Press, BocaRa<strong>to</strong>n, USA.Matlock, D.B., Ginsburg, D.W., Paul, V.J., 1999. Spatial variability in secondary metabolite productionby the tropical red alga Portieria hornemannii. Hydrobiologia 399, 267-273.McGovern, T.M., Hell<strong>be</strong>rg, M.E., 2003. Cryptic species, cryptic endosymbionts, and geographicalvariation in chemical defences in the bryozoan Bugula neritina. Mol. Ecol. 12, 1207-1215.McIvor, L., Maggs, C.A., Provan, J., Stanhope, M.J., 2001. rbcL sequences reveal multiple crypticintroductions of the Japanese red alga Polysiphonia harveyi. Mol. Ecol. 10, 911-919.McManus, J.W., 1985, Marine speciation, tec<strong>to</strong>nics and sea-level changes in Southeast Asia. pp. 133–138.Meñez, E.G., Calumpong, H.P., 1982. The genus Caulerpa from Central Visayas, Philippines. Smithson.Contrib. Mar. Sci.Meng, C., Kubatko, L.S., 2009. Detecting hybrid speciation in the presence of incomplete lineagesorting using gene tree incongruence: A model. Theor. Popul. Biol. 75, 35-45.Meyer, K.D., Paul, V.J., 1992. Intraplant variation in secondary metabolite concentration in 3 speciesof Caulerpa (Chlorophyta, Caulerpales) and its effects on herbivorous fishes. Mar. Ecol.-Prog.Ser. 82, 249-257.Millar, A.J.K., Van Reine, W.F.P., 2005. Marine <strong>be</strong>nthic macroalgae collected by Vieillard from NewCaledonia and descri<strong>be</strong>d as new species by Kutzing. Phycologia 44, 536-549.Monaghan, M.T., Wild, R., Elliot, M., Fujisawa, T., Balke, M., Inward, D.J.G., Lees, D.C.,Ranaivosolo, R., Eggle<strong>to</strong>n, P., Barraclough, T.G., Vogler, A.P., 2009. Accelerated speciesinven<strong>to</strong>ry on Madagascar using coalescent-based models of species delineation. Syst Biol 58,298-311.Moore, B.S., 1999. Biosynthesis of marine natural products: microorganisms and macroalgae. Nat.Prod. Rep. 16, 653-674.Moore, B.S., 2006. Biosynthesis of marine natural products: macroorganisms (Part B). Nat. Prod. Rep.23, 615-629.Mora, C., Tittensor, D.P., Adl, S., Simpson, A.G.B., Worm, B., 2011. How many species are there onEarth and in the ocean? PLoS Biol. 9, e1001127.Mossel, E., Roch, S., 2008. Incomplete lineage sorting: consistent phylogeny estimation from multipleloci. IEEE IEEE/ACM Trans. Comput. Biol. Bioinf., 166-171.O'Meara, B.C., 2010. New heuristic methods for joint species delimitation and species tree inference.Syst. Biol. 59, 59.Palumbi, S.R., 1984. Measuring intertidal wave forces. J. Exp. Mar. Biol. Ecol. 81, 171-179.Palumbi, S.R., 1994. Genetic-divergence, reproductive isolation and marine speciation Annu. Rev. Ecol.Syst. 25, 547-572.Palumbi, S.R., 2001. The ecology of marine protected areas. Marine community ecology 9, 509-530.Palumbi, S.R., 2003. Population genetics, demographic connectivity, and the design of marinereserves. Ecol. Appl. 13, 146-158.Pandolfi, C., Mugnai, S., Azzarello, E., Masi, E., Mancuso, S., 2006. Fractal geometry and neuralnetworks for the identification and characterization of ornamental plants. In: Teixiera daSilva, J. (Ed.), Floriculture, ornamental and plant biotechnology: advances and <strong>to</strong>picalissues. Global Science Books, Kyo<strong>to</strong>, pp. 213–225.Paulay, G., Meyer, C., 2002. Diversification in the tropical Pacific: comparisons <strong>be</strong>tween marine andterrestrial systems and the importance of founder speciation. Integr. Comp. Biol. 42, 922.Paulay, G., Meyer, C., 2006. Dispersal and divergence across the greatest ocean region: Do larvaematter? Integr. Comp. Biol. 46, 269-281.Pelletreau, K.N., Targett, N.M., 2008. New perspectives for addressing patterns of secondarymetabolites in marine macroalgae. Algal Chemical Ecology, 121-146.Phillips, J.A., 2001. Marine macroalgal biodiversity hotspots: why is there high species richness andendemism in southern Australian marine <strong>be</strong>nthic flora? Biodivers. Conserv. 10, 1555-1577.Pietra, F., 2002. Biodiversity and natural product diversity. Pergamon, Tren<strong>to</strong>.
General discussion 227Pons, J., Barraclough, T.G., Gomez-Zurita, J., Cardoso, A., Duran, D.P., Hazell, S., Kamoun, S.,Sumlin, W.D., Vogler, A.P., 2006. Sequence-based species delimitation for the DNAtaxonomy of undescri<strong>be</strong>d insects. Syst. Biol. 55, 595-609.Provan, J., Murphy, S., Maggs, C.A., 2004. Universal plastid primers for Chlorophyta and Rhodophyta.Eur. J. Phycol. 39, 43-50.Prud'Homme Van Reine, W.F., Verheij, E., Coppejans, E., 1996. Species and ecads of Caulerpa(Ulvophyceae, Chlorophyta) in Malesia (South-East Asia): taxonomy, biogeography andbiodiversity. Aquat. Ecol. 30, 83-98.Puglisi, M.P., Paul, V.J., 1997. Intraspecific variation in the red alga Portieria hornemannii: Monoterpeneconcentrations are not influenced by nitrogen or phosphorus enrichment. Mar. Biol. 128,161-170.Rannala, B., Yang, Z.H., 2003. Bayes estimation of species divergence times and ancestral populationsizes using DNA sequences from multiple loci. Genetics 164, 1645-1656.Richards, R.A., 2010. The species problem: a philosophical analysis. Cambridge University Press, NewYork.Ryder, E., Nelson, S.G., McKeon, C., Glenn, E.P., Fitzsimmons, K., Napolean, S., 2004. Effect ofwater motion on the cultivation of the economic seaweed Gracilaria parvispora (Rhodophyta)on Molokai, Hawaii. Aquaculture 238, 207-219.Santini, F., Winterbot<strong>to</strong>m, R., 2002. His<strong>to</strong>rical biogeography of Indo-western Pacific coral reef biota:is the Indonesian region a centre of origin? J. Biogeogr. 29, 189-205.Saunders, G.W., 2005. Applying DNA barcoding <strong>to</strong> red macroalgae: a preliminary appraisal holdspromise for future applications. Philos. T. Roy. Soc. B. 360, 1879-1888.Saunders, G.W., 2008. A DNA barcode examination of the red algal family Dumontiaceae inCanadian waters reveals substantial cryptic species diversity. 1. The foliose Dilsea-Neodilseacomplex and Weeksia. Botany 86, 773-789.Saunders, G.W., Lehmkuhl, K.V., 2005. Molecular divergence and morphological diversity amongfour cryptic species of Plocamium (Plocamiales, Florideophyceae) in northern Europe. Eur. J.Phycol. 40, 293-312.Shanks, A.L., Grantham, B.A., Carr, M.H., 2003. Propagule dispersal distance and the size and spacingof marine reserves. Ecol. Appl. 13, 159-169.Silva, P.C., 1992. Geographic patterns of diversity in <strong>be</strong>nthic marine algae. Pac. Sci. 46, 429-437.Silva, P.C., Meñez, E.G., Moe, R.L., 1987. Catalog of the <strong>be</strong>nthic marine algae of the Philippines.Smithsonian Institution Press, Washing<strong>to</strong>n, D.C.Sites, J.W., Marshall, J.C., 2003. Delimiting species: a Renaissance issue in systematic biology. TrendsEcol. Evol. 18, 462-470.Sites, J.W., Marshall, J.C., 2004. Operational criteria for delimiting species. Annu Rev Ecol Evol Syst 35,199-227.Smit, A.J., 2004. Medicinal and pharmaceutical uses of seaweed natural products: a review. J. Appl.Phycol. 16, 245-262.Temple<strong>to</strong>n, A.R., 2001. Using phylogeographic analyses of gene trees <strong>to</strong> test species status andprocesses. Mol. Ecol. 10, 779-791.Thomas, T.R.A., Kavlekar, D.P., LokaBharathi, P.A., 2010. Marine drugs from sponge-micro<strong>be</strong>association—a review. Mar. Drugs 8, 1417-1468.Ti<strong>to</strong>, O., Sescon, C., Adalla, C., Asdani, J., Basilio, E.M., Climaco, A., Dagalea, A., Luna, M., Uddin,Y., Vega, R.A., 2007. An annotated checklist of macro<strong>be</strong>nthic algae of the western coast ofZamboanga City (Mindanao, Philippines). Science Diliman 12.Tronholm, A., Leliaert, F., Sansón, M., Afonso-Carrillo, J., Ty<strong>be</strong>rghein, L., Verbruggen, H., De Clerck,O., 2010a. Biogeographical asymmetry as a result of thermal <strong>to</strong>lerance and long-distancedispersal in two allegedly widespread tropical brown algae. J. Biogeogr.Tronholm, A., Sansón, M., Afonso-Carrillo, J., Verbruggen, H., De Clerck, O., 2010b. Nichepartitioning and the coexistence of two cryptic Dictyota (Dictyotales, Phaeophyceae) speciesfrom the Canary Islands. J. Phycol. 46, 1075-1087.
228 CHAPTER 8Trono, G.C., 1997. Field guide and atlas of the seaweed resources of the Philippines. Bookmark. Inc.,Makati.Trontelj, P., Fišer, C., 2009. Cryptic species diversity should not <strong>be</strong> trivialised. Syst. Biodivers. 7, 1-3.Verbruggen, H., De Clerck, O., Kooistra, W., Coppejans, E., 2005. Molecular and morphometric datapinpoint species boundaries in Halimeda section Rhipsalis (Bryopsidales, Chlorophyta). J.Phycol. 41, 606-621.Verbruggen, H., Leliaert, F., Maggs, C.A., Shimada, S., Schils, T., Provan, J., Booth, D., Murphy, S.,De Clerck, O., Littler, D.S., Littler, M.M., Coppejans, E., 2007. Species boundaries andphylogenetic relationships within the green algal genus Codium (Bryopsidales) based onplastid DNA sequences. Mol. Phylogen. Evol. 44, 240-254.Verges, A., Paul, N.A., Stein<strong>be</strong>rg, P.D., 2008. Sex and life-his<strong>to</strong>ry stage alter herbivore responses <strong>to</strong> achemically defended red alga. Ecology 89, 1334-1343.Wiens, J.J., 2007. Species delimitation: new approaches for discovering diversity. Syst. Biol. 56, 875.Wiens, J.J., Kuczynski, C.A., Smith, S.A., Mulcahy, D.G., Sites, J.W., Townsend, T.M., Reeder, T.W.,2008. Branch lengths, support, and congruence: testing the phylogenomic approach with 20nuclear loci in snakes. Syst. Biol. 57, 420.Wiens, J.J., Penkrot, T.A., 2002. Delimiting species using DNA and morphological variation anddiscordant species limits in spiny lizards (Sceloporus). Syst. Biol. 51, 69.Williams, S.T., Duda Jr, T.F., 2008. Did tec<strong>to</strong>nic activity stimulate Oligo-Miocene speciation in theIndo-West Pacific? Evolution 62, 1618-1634.Wilson, M.E.J., Rosen, B.R., 1998. Implications of paucity of corals in the Paleogene of SE Asia: platetec<strong>to</strong>nics or centre of origin. Biogeography and geological evolution of SE Asia, 165-195.Wiseman, D.R., 1973, Morphological and taxonomic studies of the red algal genera Och<strong>to</strong>des andChondrococcus. Department of Botany. Duke University, p. 234.Yang, Z., Rannala, B., 2010. Bayesian species delimitation using multilocus sequence data. Proceedings ofthe National Academy of Sciences 107, 9264.Yu, Y., Than, C., Degnan, J.H., Nakhleh, L., 2011. Coalescent his<strong>to</strong>ries on phylogenetic networks anddetection of hybridization despite incomplete lineage sorting. Syst. Biol. 60, 138.Zuccarello, G.C., Sandercock, B., West, J.A., 2002. Diversity within red algal species: variation inworld-wide samples of Spyridia filamen<strong>to</strong>sa (Ceramiaceae) and Murrayella periclados(Rhodomelaceae) using DNA markers and breeding studies. Eur. J. Phycol. 37, 403-417.Zuccarello, G.C., West, J.A., 2002. Phylogeography of the Bostrychia calliptera-B. pinnata complex(Rhodomelaceae, Rhodophyta) and divergence rates based on nuclear, mi<strong>to</strong>chondrial andplastid DNA markers. Phycologia 41, 49-60.Zuccarello, G.C., West, J.A., 2003. Multiple cryptic species: molecular diversity and reproductiveisolation in the Bostrychia radicans/ B. moritziana complex (Rhodomelaceae, Rhodophyta) withfocus on North American isolates. J. Phycol. 40, 226-226.
SUMMARYMarine macroalgae are a prolific source of pharmacologically importantsecondary metabolites. However, many species used in pharmacognosy and inbiomedical experiments are severely understudied biologically. Portieria, an Indo-Pacific red seaweed, is one of those understudied species found <strong>to</strong> harbor anabundance of halogenated monoterpenes. Halomon, a halogenated monoterpenewith anti-tumor properties has <strong>be</strong>en isolated in a Portieria population in Batanes,Philippines. Unfortunately, the absence of sufficient biological knowledge aboutPortieria has placed halomon in a drug development bottleneck. The motivations forthis thesis are <strong>to</strong> test the hypotheses that the variation in halomon content amongPortieria populations could <strong>be</strong> due <strong>to</strong> cryptic diversity, seasonality or geographicalvariation on the secondary metabolite production. Given these three conditions:differential production of pharmacologically important monoterpenes, lack ofbiological knowledge on Portieria, and the possibility of the presence of crypticspecies, this thesis specifically aimed <strong>to</strong> examine cryptic diversity in Portieria;determine how this genetic diversity is expressed on the phenotypic level(morphology and chemistry) and in doing so determine the role of cryptic diversity,life-his<strong>to</strong>ry stages, seasonality and geographical location on the differentialproduction of secondary metabolites. To achieve these goals, we conducted thefollowing investigations and report the results on six research chapters:In Chapter 2, an in-depth treatment is presented on the vegetative andreproductive development of the algae, which includes a study on the on<strong>to</strong>geny ofmale, female and tetrasporangial nemathecia. Post fertilization events andcarposporophyte development is descri<strong>be</strong>d in detail for the first time. Phylogeneticanalysis using chloroplast encoded rbcL and nuclear encoded ribosomal LSU genesequences, including mem<strong>be</strong>rs of Rhizophyllidaceae and their close relatives suggesta monophyletic family.In Chapter 3, a description of the pattern of the unprecedented crypticspecies diversity in the P. hornemannii complex in the Philippines is provided. Crypticspecies are delineated using the General Mixed-Yule Coalescent Model Approachand Bayesian species delimitation. Based on these approaches, we revealed thepresence of at least 21 Portieria species in the Philippines.In Chapter 4, we examined species diversity, distributions andphylogenetic relationships within the red alga Portieria <strong>to</strong> determine how his<strong>to</strong>ricalprocesses have contributed <strong>to</strong> present-day biodiversity patterns across the marine229
230 SUMMARYtropical Indo-Pacific. DNA-based species delimitation analysis revealed rampantcryptic diversity. Forty-nine Portieria species were delineated, which were allrestricted <strong>to</strong> a single Ocean basin. Within the Philippines, several species displayfine scale archipelagic and intra-archipelagic endemism, suggesting low dispersalcapacity. The highest diversity was recovered in the Indo-Malay Archipelago (IMA),with declining species num<strong>be</strong>rs moving away, both longitudinally and latitudinally,from the centre. A species phylogeny suggests a long term persistence of ancientlineages within confined regions of the Indo-Pacific, including the IMA. Theseresults indicate that the long and complex geological his<strong>to</strong>ry of the IMA played animportant role in shaping the diversity of Portieria in the IMA. The taxonomicrichness in the IMA may have resulted from a combination of species accumulationvia island integration through tec<strong>to</strong>nic movement, in combination withdiversification at small spatial scales within the IMA as a result of increasedgeographical complexity of the region during the Oligo-Miocene and Pleis<strong>to</strong>ceneperiods of glacially lowered sea level. This study thus supports both the centre oforigin and centre of accumulation hypothesis, and highlights that there may <strong>be</strong> no<strong>to</strong>ne unifying model <strong>to</strong> explain the biological diversity within the IMA.In Chapter 5, we applied different morphometric techniques, includingdiscriminant function analyses of fractal parameters, and non-conventional andconventional measurements of branch apices, <strong>to</strong> detect patterns of morphologicaldifferentiation <strong>be</strong>tween Portieria species. Results show that conventionalmeasurements outperform those of fractal and non-conventional variables in thediscrimination of lineages. A combination of such characters resulted in the <strong>be</strong>stdiscrimina<strong>to</strong>ry power. Fractal analyses resulted in low <strong>to</strong> moderate classificationsuccess (21-71%) of branch apices. Classification success was higher forconventional measurements (70-100%). When combined, fractal variables andconventional measurements resulted in high <strong>to</strong> very high classification success (83-100%). These results indicate that although it may not <strong>be</strong> possible <strong>to</strong> assign eachindividual specimen <strong>to</strong> the correct lineage, the different lineages are, at least <strong>to</strong>some degree, morphologically differentiated.In Chapter 6, using non-polar extraction and metabolite fingerprinting ofP. hornemannii sampled from two distinct regions in the Philippines (Batanes andVisayas), we determined if variation in secondary metabolites is due <strong>to</strong> the differentlife-his<strong>to</strong>ry stages, presence of cryptic species, and/or spatiotemporal fac<strong>to</strong>rs. A<strong>to</strong>tal of 302 compounds were detected. PCA analyses show intraspecific variation insecondary metabolites <strong>be</strong>tween life-his<strong>to</strong>ry stages. Male game<strong>to</strong>phytes are stronglydiscriminated from the two other stages, and female game<strong>to</strong>phyte and
SUMMARY 231tetrasporophyte samples are partially discriminated. Female game<strong>to</strong>phyte extracts(202) are chemically richer compared <strong>to</strong> that of the male (102) and tetrasporophyte(106). In the Batanes region, DNA sequence data point <strong>to</strong>wards the presence of 5cryptic species. Variation in secondary metabolites was shown <strong>be</strong>tween as well aswithin these species. Intraspecific variation was even more pronounced in theVisayas dataset which included samples from 6 sites, <strong>be</strong>longing <strong>to</strong> 3 cryptic species.Neither species groupings nor spatial or temporal based patterns were observed inthe PCA analysis. These results suggest that life-his<strong>to</strong>ry driven variations andpossibly other microscale fac<strong>to</strong>rs may have more influence on the variation withinPortieria species.In Chapter 7 we studied the seasonal dynamics of Portieria by looking atthree parameters: density, percent cover and biomass in four sites located at Negrosand Siquijor Islands, Philippines from Jan 2007 <strong>to</strong> Mar 2009. Sites are affected bystrong waves during the southwest (June-Sept) and northeast (Nov -Feb) monsoonperiods. Significant fluctuations in all three parameters were detected mainly in twosites affected either by the NE and SW monsoon waves. Results and fieldobservations suggest that Portieria has a site-specific seasonality that is influenced bystrong wave actions brought by the monsoonal winds. Portieria in Sia<strong>to</strong>n, Negros, asite exposed <strong>to</strong> the SW monsoon waves, <strong>be</strong>gins its growth closely <strong>be</strong>fore or duringthe SW monsoon season and disappears at the end of the NE monsoon. InDapdap, Siquijor, a site exposed only <strong>to</strong> the NE monsoon waves, plants <strong>be</strong>gingrowing just <strong>be</strong>fore or during the NE monsoon, and decline <strong>to</strong>wards the SWmonsoon. Sawang and Pagubagubaan in Siquijor are two sites exposed <strong>to</strong> waves ofthe NE and SE monsoon. Here, no significant fluctuations of the measuredparameters were detected indicating a lack of marked seasonality. However, fieldobservations of the presence of young and senescent individuals suggest twogrowth cycles in Sawang: one that appears during the SW monsoon and a newbatch appearing during the NE monsoon. A generation of plants in Sia<strong>to</strong>n andDapdap is estimated <strong>to</strong> grow and live for a maximum of 9-10 months while thosein Sawang and Pagubagubaan live for about 5 months.
232
SAMENVATTINGMariene macroalgen vormen een rijke bron van secundaire metabolietendie potentieel <strong>be</strong>langrijk zijn voor pharmacologisch onderzoek. Toch is de biologievan heel wat pharmacologisch potentieel interessante zeewiersoorten slecht gekend.Eén van deze algen is Portieria, een algemeen tropisch roodwiergenus uit deIndische en Stille Oceaan dat een diversiteit aan gehalogeneerde monoterpenen(halogenated monoterpenes) <strong>be</strong>vat. Halomon, een gehalogeneerd monoterpeen metanti-tumoreigenschappen werd geïsoleerd uit een Portieria populatie van Batanes(Filippijnen). Een gebrek aan gedetailleerde kennis van de biologie van Portieria<strong>be</strong>moeilijkte echter sterk het onderzoek naar halomon-gebaseerde geneesmiddelen.Een van de doelstellingen van dit proefschrift was om na te gaan of variatie inhalomon en andere secundaire metabolieten mogelijk gekoppeld is aan cryptischediversiteit, seizoenaliteit of geografische verspreiding van Portieria. De specifiekedoelstellingen van dit proefschrift waren: 1) soortsdiversiteit en evolutionairepatronen onderzoeken aan de hand van genetische variatie (DNAsequentiegegevens), 2) nagaan hoe deze genetische diversiteit zich fenotypischvertaald (morfologisch en chemisch), en 3) de invloed <strong>be</strong>palen van cryptischediversiteit, levenscyclus, seizoenaliteit en geografische verspreiding op dedifferentiële productie van secundaire metabolieten. De resultaten wordenuiteengezet in 6 hoofdstukken.Hoofdstuk 2 omvat een studie van de vegetatieve en reproductievekenmerken van Portieria. Hierin worden de ontwikkeling van mannelijke,vrouwelijke en tetrasporangiale voortplantingsstructuren <strong>be</strong>schreven. Postfertilizatieontwikkelingsstadia en carposporofyt-ontwikkeling worden voor heteerst in detail <strong>be</strong>schreven. Een fylogenetische analyse op basis van het chloroplastgeëncodeerderbcL gen en het nucleair ribosomaal LSU gen <strong>to</strong>nen aan dat defamilie Rhizophyllidaceae, waar<strong>to</strong>e Portieria <strong>be</strong>hoort, monofyletisch is.In Hoofdstuk 3 wordt de soortsdiversiteit binnen Portieria <strong>be</strong>studeerd aande hand van DNA sequenties. Een vijftal soorten werden traditioneel <strong>be</strong>schrevenaan de hand van morfologische kenmerken, maar veelal wordt één enkele,morfologisch varia<strong>be</strong>le en wijdverspreide soort erkend (P. hornemannii). Tweetechnieken werden <strong>to</strong>egepast om soorten af te bakenen op basis van DNAsequenties:een ―General Mixed-Yule Coalescent Model‖ techniek en multi-locusBayesiaanse methode. Deze analyses <strong>to</strong>nen aan dat de Filippijnen ten minste 21233
234 SAMENVATTINGPortieria soorten her<strong>be</strong>rgt. Deze soorten blijken morfologisch moeilijk teonderscheiden en kunnen <strong>be</strong>schouwd worden als cryptische of pseudocryptischesoorten.In hoofdstuk 4 wordt de geografische schaal uitgebreid <strong>to</strong>t het volledigeverspreidingsgebied van Portieria: de Indische en Stille Oceaan. Soortsdiversiteit,geografische distributie en fylogenetische verwantschappen werden onderzocht metals doel een <strong>be</strong>ter inzicht te verwerven in de his<strong>to</strong>rische processen die geleid heb<strong>be</strong>n<strong>to</strong>t de huidige diversiteitspatronen. DNA sequentie-analyse resulteerde in deafbakening van niet minder dan 49 Portieria soorten, met een <strong>be</strong>perkte geografischeverspreiding. Binnen de Filippijnen ver<strong>to</strong>nen enkele soorten fijnschaligedistributiepatronen wat wijst op een lage dispersiecapaciteit. Deze <strong>be</strong>perktedispersie vertaalt zich ook in de fylogenetische resultaten waar oude evolutielijnen<strong>be</strong>perkte geografische verspreidingen ver<strong>to</strong>nen. De hoge waargenomen diversiteitin de Indo-Maleisische Archipel (IMA) is mogelijk een gevolg van een accumulatievan soorten door een complexe geologische geschiedenis van de IMA in het Oligo-Mioceen en meer recente speciatie binnen de regio tijdens het klima<strong>to</strong>logischdynamische Pleis<strong>to</strong>ceen.In hoofdstuk 5 worden patronen van morfologische differentiatieonderzocht aan de hand van verschillende morfomotrische technieken, waaronderdiscriminant functie analyse van fractaalparameters en metingen van vegetatievemorfologische kenmerken. Deze analyses <strong>to</strong>nen aan dat ondanks de schijnbaarmorfologische homogeniteit binnen het genus, er wel degelijk morfologischedifferentiatie is opgetreden tussen de respectievelijke Portieria-soorten. Toch blijkendeze morfologische kenmerken slechts <strong>be</strong>perkt bruikbaar om soorten correct teidentificeren. Het opstellen van diagnoses voor alle soorten integraal gebaseerd opmorfologische kenmerken lijkt dan ook bijzonder weinig haalbaar.In hoofdstuk 6 wordt gebruik gemaakt van non-polaire extracten enmetabolische fingerprinting om na te gaan of variatie in secundaire metabolietenmogelijk gekoppeld is aan verschillende levenscyclus-stadia, cryptische diversiteiten/of spatio-temporele fac<strong>to</strong>ren. In <strong>to</strong>taal werden 302 metabolieten gedetecteerd.PCA analysen <strong>to</strong>nen aan dat de variatie in secundaire metabolieten voor eengrotendeels gekoppeld is aan verschillende levensstadia. Zo <strong>be</strong>vatten vrouwelijkegame<strong>to</strong>fyten aanzienlijk meer metabolieten dan mannelijke game<strong>to</strong>fyten oftetrasporofyten. Variatie gekoppeld aan cryptische diversiteit, geografischedistributie of seizoenaliteit was minder eenduidig.Hoofdstuk 7 onderzoekt seizoenale patronen van Portieria in de Filippijnen.Densiteit en biomassa werden opgevolgd in vier locaties van Negros en Siquijor
SAMENVATTING 235tussen 2007 en 2009. Resultaten <strong>to</strong>nen aan dat de seizoenale patronen sterklocatiespecifiek zijn en dat groeicycli sterk afhankelijk zijn van brandingsterktetijdens de Zuid-West (juni-septem<strong>be</strong>r) en Noord-Oost moesson periodes.
236 SAMENVATTING
CURRICULUM VITAEDioli Ann Payo finished her bachelor‘s degree in Biology at the Universityof the Philippines in the Visayas Tacloban College in 1999. Her first job was as aresearch assistant for Project Seahorse in Bohol, Philippines. The thirst foradventure and research was fed with night dives, studying the movement ofseahorses and living with a fishing community in a small island in Cataban, Bohol.Studying seahorse biology came with exposure <strong>to</strong> fishers‘ exclusive knowledge andat the same time <strong>to</strong> the perils of destructive fishing. Soon after, she received anopportunity <strong>to</strong> study for a master‘s degree in Ecological Marine Management at theVrije Universiteit Brussel (VUB), Belgium, which she completed in 2004 withdistinction. She worked on the molecular systematics of the brown macroalgaDictyota from the Philippines under Dr. O. De Clerck. This thesis had <strong>be</strong>en grantedthe VLIZ Best Thesis prize in 2005. In 2004, she returned <strong>to</strong> the Philippines. Thereshe worked as a team leader of the MPA research and moni<strong>to</strong>ring team of theCoastal Conservation and Education Foundation (CCEF) in Cebu, Philippines. Herresearch at CCEF exposed her even more <strong>to</strong> the <strong>be</strong>auty of coral reef diversity andmarine protected areas in the Central Visayas. In 2006, she received a grant fromthe Flemish Interuniversity Council (VLIR) for a PhD project on the marinemacroalga Portieria at <strong>Ghent</strong> University with Prof. O. De Clerck. This thesis is theculmination of this research endeavor which lasted for 5 years.237