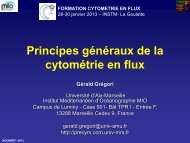
AAC17 9/24/04 03:47 PM Page 1010 <strong>Phytoplankton</strong> <strong>Cell</strong> <strong>Counting</strong> <strong>by</strong> <strong>Flow</strong> <strong>Cytometry</strong>Green fluorescence10 410 310 210 1aRed fluorescence10 410 310 210 1b10 0 10 0 10 1 10 2 10 3 10 4Side scatter10 0 10 0 10 1 10 2 10 3 10 4Green fluorescenceGreen fluorescence10 410 310 210 1cRed fluorescence10 410 310 210 1d10 0 10 0 10 1 10 2 10 3 10 4Side scatter10 0 10 0 10 1 10 2 10 3 10 4Green fluorescenceGreen fluorescence10 410 310 210 1eGreen fluorescence10 410 310 210 1f10 0 10 0 10 1 10 2 10 3 10 410 0 10 0 10 1 10 2 10 3 10 4Side scatterSide scatterFIGURE 17.2. Analysis of heterotrophic eukaryotes, bacteria, and viruses in algal cultures after staining with SYBR-I (green fluorescence).(See Table 17.1 for culture origin.) (a,b) Bacterial contaminants of Ostreococcus tauri (Prasinophyceae). Three populationsof bacteria are visible. (c,d) Bacterial contaminants of Pelagomonas calceolata (Pelagophyceae). (e) Picophagus flagellatus, a heterotrophicChrysophyceae, in co-culture with bacteria. (f ) Detection of viruses in a Micromonas pusilla (Butcher) Manton et Parke (Prasinophyceae)culture. (Fluorescent 0.95-mm microspheres were added in the samples.)recently, FCM has been successfully used for the analysisof viruses in solution, using the nucleic acid–specificdye SYBR-I (Marie et al. 1999).The preparation of the samples for the analysis ofviruses is similar to that of heterotrophs, although acertain number of precautions must be taken. No significantdifference has been found for virus enumerationperformed on samples fixed with formaldehyde,glutaraldehyde, or a mixture of both aldehydes. Forvirus samples that are freshly fixed (i.e., have not beenfrozen), or for recalcitrant material, it is necessary toheat the samples for 10 minutes at 80°C in the presenceof a detergent such as Triton X-100 (0.1% final concentration).Because a large fraction of virus particlescan pass through 0.2 mm pore-size filters, 0.2-me-size filteredseawater cannot be used to dilute the samples.The best solution to minimize the background noise isto dilute samples in Tris-EDTA buffer (Tris 10 mM,EDTA 1 mM). Different buffers have been tested, butTris-based buffers give the best results, probablybecause Tris has free amines that interact with aldehydes.Distilled water must be used as sheath fluid.Samples are then stained with SYBR-I at a dilution of1/20,000 of the commercial solution.Typical settings on a FACSort flow cytometer are asfollows: FSC = E03, SSC = 600, FL1 = 600, FL2 = 650,
AAC17 9/24/04 03:47 PM Page 11<strong>Phytoplankton</strong> <strong>Cell</strong> <strong>Counting</strong> <strong>by</strong> <strong>Flow</strong> <strong>Cytometry</strong> 11and FL3 = 650. Discriminator is set on the green fluorescence(FL1) with a threshold value of about 100.Analysis must be performed with a suspension of about2 ¥ 10 5 to 2 ¥ 10 6 viruses/mL (final concentration). Toavoid generating large files, samples can be run for 1 or2 minutes at a rate ranging from 10 to 30 mL·min -1 .Natural viroplankton displays a wide range of sizes,and these particles are often difficult to separate frombackground noise. However, viruses that contaminatecultures are usually simple to analyze (see Fig. 17.2f).Viruses are too small to be discriminated only <strong>by</strong> theirSSC or FSC properties. Detection must, therefore, beperformed using the green SYBR-I fluorescence (seeFig. 17.2f). Because FCM was not designed for theanalysis of such small particles, care must be taken toobtain reliable data. If samples are too diluted, there isa loss in the emission signal of the nucleic acid–dyecomplex. If they are not diluted enough, coincidenceoccurs or the population of viruses is overlapped <strong>by</strong>background noise. For viruses, coincidence seems tooccur at more than 600 events per second on a FACSort,that is, at a lower rate than for beads, bacteria, or smallalgae.3.5. <strong>Counting</strong> Dead vs. Live <strong>Cell</strong>sIt is sometimes necessary to evaluate the percentage ofliving and/or dead cells in a sample. Propidium iodide(PI) or SYTOX Green can penetrate into cells that havelost membrane integrity so that dead cells exhibit fluorescence.However, PI cannot be used with phytoplanktonbecause its red fluorescence interferes withthat of chlorophyll; SYTOX induces green fluorescence,which is more suitable (Veldhuis et al. 2001).Conversely, fluorescent dyes from the SYTO family(Molecular Probes), such as SYTO-9, or calcein-AMcan penetrate into intact cells and induce live cells tofluoresce green (Brussaard et al. 2001).4.0. Molecular Probes<strong>Phytoplankton</strong> can be discriminated from other particles<strong>by</strong> FCM based on their natural scattering and fluorescenceproperties. However, these natural propertiesare not sufficient to separate lower level taxa (e.g.,genera, species). Antibodies labeled with fluorescentmarkers have been used in this context (Peperzak et al.2000), but their use remains limited because of the lackof specificity for polyclonal antibodies and the cost fordeveloping monoclonal antibodies. Nucleic acid probestargeting ribosomal RNA (Amann et al. 1995) offer amuch more flexible solution. Probes can be easilydesigned to target any phylogenetic level from the divisionto the species, and various probes are available forphytoplankton.The probes used are generally oligonucleotides(15 to 30 bases). Different probe-labeling techniquesare available. Probes may be directly labeled with afluorochrome (Simon et al. 1995), or labeling maybe indirect (Not et al. 2002). For indirect labeling,hybridization of the probes and labeling with the fluorochromeare realized in two steps, as in the tyramidesignal amplification of fluorescent in situ hybridization(TSA-FISH) technique. Indirect labeling increases theintensity of fluorescence and thus raises the limit ofdetection and the signal/noise ratio (Not et al. 2002),which is critical for small cells. Recently, TSA-FISH hasbeen successfully adapted for the identification and enumerationof phytoplankton cells <strong>by</strong> FCM (Biegala et al.2003).The most common fluorochrome used is fluoresceinisothiocyanate (FITC) (excitation = 488 nm; emission =525 nm), but other fluorochromes that have higher fluorescenceyield, such as CY3 (excitation = 550 nm; emission= 570 nm) or CY5 (excitation = 650 nm; emission= 670 nm), are also suitable, provided that the flowcytometer can be set to the corresponding excitationand emission wavelengths. For phytoplankton, thecombined use of FCM and molecular probes may beuseful to assess culture identity or when cultures are notpure and it is difficult to distinguish the taxon of interestfrom the contaminants.4.1. Probe Design and LabelingA database of the oligonucleotide probes for cyanobacteriaand protists is available at www.sb-roscoff.fr/Phyto/Databases/RNA_probes_introduction.php.Although probes have been designed against some ofthe major algal groups such as the Chlorophyta, Prymnesiophyceae(Simon et al. 1995, 2000), or some keygenera such as Phaeocystis (Lange et al. 1996), considerablework remains to be done to cover all existingtaxa. Probes can be designed from ribosomal DNAdatabases using a public domain software such as ARB(www.arb-home.de). Advice for the design of new taxaspecificprobes is available in Amann et al. (1995).Probes may be purchased directly labeled, but cost may