Phytoplankton Cell Counting by Flow Cytometry - incommet
Phytoplankton Cell Counting by Flow Cytometry - incommet
Phytoplankton Cell Counting by Flow Cytometry - incommet

Create successful ePaper yourself
Turn your PDF publications into a flip-book with our unique Google optimized e-Paper software.
AAC17 9/24/04 03:47 PM Page 3<strong>Phytoplankton</strong> <strong>Cell</strong> <strong>Counting</strong> <strong>by</strong> <strong>Flow</strong> <strong>Cytometry</strong> 3be applied equally well to field samples and to freshwaterorganisms. In the latter case, only obvious modifications,such as replacing seawater wherever mentioned<strong>by</strong> freshwater, are required (Lebaron et al. 2001,Crosbie et al. 2003).2.0. Principles of <strong>Flow</strong> <strong>Cytometry</strong>2.1. General PrinciplesFCM measures cells in liquid suspension. <strong>Cell</strong>s arealigned hydrodynamically <strong>by</strong> an entrainment fluid(sheath fluid) into a very narrow stream, 10 to 20 mmwide, onto which one or several powerful light sources(arc mercury lamp or laser) are focused. Each time aparticle passes through the beam, it scatters light;angular intensity depends on the refractive index,size, and shape of the particle. Moreover, if the particlecontains a fluorescent compound whose absorptionspectrum corresponds to the excitation source (e.g.,blue light for chlorophyll), it emits fluorescence at ahigher wavelength (e.g., red light for chlorophyll).These light pulses are detected <strong>by</strong> photodiodes or moreoften <strong>by</strong> photomultipliers and then are converted todigital signals that are processed <strong>by</strong> a computer. Measurementrates vary between 10 and 10,000 events persecond. On the more sophisticated instruments, it isthen possible to physically sort cells of interest based onany combination of the measured parameters (seeChapter 7).2.2. Fluidics<strong>Flow</strong> cytometers are equipped with a tank supplying thesheath liquid (buffer, distilled water, seawater) thatcarries the cells through the instrument; a second tankcollects the waste fluid. <strong>Cell</strong> suspensions are injected orpushed through a capillary into a sheath fluid stream.Under laminar flow conditions, the sheath liquid alignsthe cells into a narrow centered stream. The illuminationof cells can be performed in the air, just outside anozzle through which the sheath fluid exits, or in aquartz cuvette through which the sheath fluid flows.The latter solution increases the detection sensitivity,which is required for picophytoplankton. The flow ratemust be adjusted depending on the cells of interest tokeep laminar flow conditions and to control the numberof events to be analyzed per unit time.2.3. OpticsWhen a particle passes through the excitation beam,light can be reflected or refracted. In most flow cytometers,the light scatter detectors are located at 180°(forward scatter or FSC) and at 90° (side scatter or SSC)with respect to the light source. Both parameters arerelated to cell size, but the side scatter is more influenced<strong>by</strong> the cell surface and internal cellular structure(Morel 1991, Green et al. 2003).Many fluorescent molecules can bind to a widerange of cytochemical compounds such as proteins,lipids, or nucleic acids. Each fluorescent dye ischaracterized <strong>by</strong> its excitation and emission spectra.<strong>Flow</strong> cytometers are usually equipped with a laser emittingat a single wavelength (488 nm). Therefore, onlyfluorescent molecules excited at that particular wavelengthcan be used. If multiple excitation wavelengthsare available, then the choice of the fluorochromes ismuch wider.The flow cytometer is equipped with highly sensitivephotomultiplier tubes that are able to measure andamplify the brief pulse of light emitted <strong>by</strong> the cells.When a cell intersects the excitation beam, the emittedlight is collected <strong>by</strong> a lens and passes through a seriesof filters that remove the excitation light, allowing onlythe emission light to be detected. With several photomultipliers,multiple wavelength emission ranges can becollected (e.g., orange and red fluorescence for algalcells).2.4. Electronic and Software ProcessingTo be usable, analog data from the photomultipliersmust be converted to digital form, that is, to a numberon a scale ranging, for example, from 1 to 256 (2 8 ) correspondingto 8-bit conversion. To avoid saturation ofthe conversion circuitry, only events of interest must beconverted. Therefore, the operator needs to select oneor several signals (called discriminators or triggers) andmust set thresholds for each discriminator. Whenthe value of one of the discriminator signals is largerthan the corresponding threshold, all signals from thetriggering particle are converted. Choosing adequatediscriminators and thresholds is critical to correctlyrecord the cells of interest, especially when workingwith very small cells or particles. As an example, torecord chlorophyll fluorescing microalgae, it is bestto choose red fluorescence as the discriminator andto select a threshold that is high enough so optical and
AAC17 9/24/04 03:47 PM Page 5<strong>Phytoplankton</strong> <strong>Cell</strong> <strong>Counting</strong> <strong>by</strong> <strong>Flow</strong> <strong>Cytometry</strong> 5simultaneously within the same cell (e.g., DNA andproteins). The sorting capacity of these high-endinstruments reaches up to 20,000 cells per second.These include the FACS Vantage from Becton Dickinson,the EPICS Altra from Beckman Coulter, and theMoFlo from DakoCytomation. Because of their cost,the need for a dedicated room, and the complexity oftheir operation (usually requiring a special technician),they are much less widely used. Moreover, their sensitivityis, paradoxically, often lower than that of thesmaller benchtop analyzers, because they use a jet-inairnozzle design.2.5.3. Custom InstrumentsSome researchers have devised their own instruments,for example, based on a microscope (Olson et al. 1983)or modified existing flow cytometers to improvesensitivity (Dusenberry and Frankel 1994) or measurementsize range (Cavender-Bares et al. 1998). Morerecently, flow cytometers have been specificallydesigned for in situ applications such as the continuousmonitoring of phytoplankton in marine waters. Theseinclude the CytoBuoy (www.cytobuoy.com) (Dubelaarand Gerritzen 2000) and the <strong>Flow</strong>Cytobot (Olson et al.2003).2.5.4. Choice of Instrument for Algal CulturesAll commercial instruments are suitable to analyze algalcultures. For picoplanktonic organisms or forvirus detection, the use of a very sensitive flow cytometer,such as a benchtop FACS (Becton Dickinson), iscritical.3.0. <strong>Counting</strong> <strong>Phytoplankton</strong> <strong>by</strong><strong>Flow</strong> <strong>Cytometry</strong> Using NaturalOptical Properties<strong>Phytoplankton</strong> possess fluorescing photosynthetic pigments(see Chapter 20) that can be used to discriminatecells from heterotrophic organisms and nonliving particles.The most common fluorescing pigments arechlorophyll, phycoerythrin, and phycocyanin. Thelatter two are phycobiliproteins that are typical ofcyanobacteria, cryptophytes, and rhodophytes. Bothchlorophyll and phycoerythrin are well excited with thecommon 488-nm excitation line and fluoresce at 690 nm(red) and 570 nm (orange), respectively. In contrast,phycocyanin is excited at 620nm and emits at 640 nm.Therefore, it can be detected only with a red-emittinglaser. <strong>Counting</strong> phytoplankton does not require anypretreatment of the samples, but if samples cannotbe counted immediately, they must be preserved <strong>by</strong>aldehydes (formaldehyde or glutaraldehyde) andstored deep frozen, either in a -80°C freezer or in liquidnitrogen.3.1. Measurement of <strong>Cell</strong> Concentration<strong>Phytoplankton</strong> abundance is best obtained using freshunfixed samples; fixation will always result insome degree of cell disruption and cell loss (Vaulotet al. 1989). Samples can be kept, however, at 4°C inthe dark for up to 12 hours with only minimalchange in abundance or optical parameters ( Jacquet etal. 1998).3.1.1. Materials1. <strong>Phytoplankton</strong> cultures2. 0.95-mm fluorescent microspheres diluted at10 5·mL-1 in distilled water (e.g., Polysciences)3. 0.2-mm filtered seawater4. Micropipettes and tips for 10 to 1000 mL5. Chronometer6. <strong>Flow</strong> cytometer equipped with a 488-nm argonlaser (e.g., benchtop FACS)3.1.2. Culture DilutionIf two (or more) cells pass simultaneously through theexcitation beam, or if two cells are too close to eachother, and the second cell arrives while the instrumentis busy recording the first cell, then the two cells arerecorded as a single event (see Chapter 7). Thisphenomenon is called coincidence, and it results in anunderestimate of the cell concentration. Coincidencethreshold is best determined empirically. For example,it is possible to analyze a range of cell concentrations ata given sample flow rate. The coincidence thresholdcorresponds to the maximum cell concentration beyondwhich the number of recorded cells is not linearlyrelated to the sample concentration (Gasol and DelGiorgio 2000). As an example, for instruments of thebenchtop FACS family, coincidence for picoplanktoncells begins at more than 800 cells per second. Toprevent coincidence, it is necessary either to reduce theflow rate (e.g., from high to medium on a FACS) or todilute cultures before analysis.
AAC17 9/24/04 03:47 PM Page 66 <strong>Phytoplankton</strong> <strong>Cell</strong> <strong>Counting</strong> <strong>by</strong> <strong>Flow</strong> <strong>Cytometry</strong>3.1.3. Instrument Settings<strong>Phytoplankton</strong> acclimates to changes of photon-fluxdensities <strong>by</strong> changing pigment content, leading to adecrease in chlorophyll fluorescence per cell as lightincreases (Sosik et al. 1989). Fluorescence range for agiven strain is very wide for Prochlorococcus (up to fiftyfold)and less pronounced for eukaryotes (fivefold totenfold only). The intensity of the other cellular parameterssuch as scatter can also vary with light conditionsand available nutrients. For example, as nutrientsbecome limiting, scatter typically decreases in intensity.Thus, the voltage of the photomultipliers must beadjusted accordingly, depending on the size and fluorescenceof the organisms of interest.Typical settings for picoplankton and nanoplanktoncultures on a benchtop FACS flow cytometer are asfollows: forward scatter (FSC) = E00, side scatter (SSC)= 400, green fluorescence (FL1) = 650, orange fluorescence(FL2) = 650, and red fluorescence (FL3) = 550.All parameters are set on logarithmic amplification andthe trigger is set on the red fluorescence.3.1.4. Sample AnalysisWe describe here a general procedure that can be usedeither for fresh or preserved samples.1. Turn on both the instrument and the computer.2. Prepare the sheath fluid. Because cell scatter(especially FSC) is dependent on the nature of thesheath fluid (Cucci and Sieracki 2001), it isnecessary to match the sheath and sample fluids.For example, for marine samples, 0.0.2-mm poresizefiltered seawater can be used as sheath fluid. Inthis case, it is best to remove any inline sheathfilter, which becomes easily contaminated andquickly tends to release particles.3. If samples were fixed and frozen (see Section3.2.3), then thaw them at room temperature or at37°C.4. Transfer about 1 mL (minimum of 250 mL) of theculture into a flow cytometer tube.5. Add 10 mL of the microsphere solutioncontaining about 10 5·beads mL -1 as an internalreference.6. Select (low, medium, or high) and calibrate theflow rate (see Section 3.1.5).7. Set the discriminator on the red (chlorophyll)fluorescence with a threshold of 50.8. Insert the sample tube in the instrument sampleholder, and after about 15 seconds (to allow theflow rate to stabilize), start data acquisition. Typicalanalysis of a culture lasts 2 to 3 minutes with adelivery rate of 50 to 100 mL·min -1 .9. Record the duration of analysis, which is necessaryto estimate the cell concentration (see Section3.1.6.).3.1.5. <strong>Flow</strong>-Rate CalibrationOn most commercial flow cytometers, it is not possibleto deliver a specific sample volume or to precisely setthe sample flow rate. Therefore, the sample flow ratemust be determined <strong>by</strong> the operator for accurate cellconcentrations.Often, a solution of fluorescent microspheres with aknown concentration (determined <strong>by</strong> epifluorescencemicroscopy) is used for the measurement of the flowrate. Because the electrostatic charges of the beads makethem stick onto the plastic tubes (particularly in seawater),this modifies their initial concentration, and we donot recommend this method (still, we always add fluorescentbeads to our samples to check flow stability andto normalize cell scatter and fluorescence; see Section3.1.6). We use instead the procedure described belowthat works on flow cytometers from the benchtop FACSfamily that can be adapted to most instruments. Thiscalibration should be repeated several times a day.1. Select the same sample flow rate used for analysis.2. Fill a tube with the same liquid as samples(e.g., seawater for marine phytoplankton).3. Measure the volume of the sample (or weighprecisely the tube containing the sample).4. Remove the outer sleeve of the injection system.The sheath fluid will drop down the sample needle.5. Wait until a droplet has fallen, and then before thenext one forms, place the sample tube and closethe sample arm in the running position.6. Simultaneously start the chronometer.7. Run the sample for at least 10 minutes.8. Remove the sample tube and simultaneously stopthe chronometer.9. Measure (or weigh) the remaining volume.The rate (R), expressed in microliters per minute, isgiven <strong>by</strong> the following formula:R = ( Vi-Vf) T,(1)where V i = initial volume (mL), V f = final volume(mL), and T = the time (minutes). The use of a scaleleads to better precision for the determination of theflow rate:R = ( W -W ) ( T*d),(2)if1
AAC17 9/24/04 03:47 PM Page 7<strong>Phytoplankton</strong> <strong>Cell</strong> <strong>Counting</strong> <strong>by</strong> <strong>Flow</strong> <strong>Cytometry</strong> 72where W i = initial weight (mg), W f = final weight (mg),T = time (minutes), and d = density of the liquid usedfor calibration (distilled water = 1.00, seawater = 1.03).3.1.6. Data Analysis<strong>Phytoplankton</strong> cells cover a wide range of size and fluorescenceproperties (see Fig. 17.1). Therefore, data arealways collected using logarithmic amplifications andrecorded as list-mode files, which allows detailed offlineanalysis. In practice, 20,000 to 100,000 events are collectedfor microalgae and up to 150,000 for bacteria orviruses. List-mode files are then analyzed using eitherthe instrument software or publicly available programs.The different populations are discriminated using acombination of parameters: scatters (FSC and SSC) andfluorescences (usually red and orange). Figure 17.1illustrates data obtained for a mixture of 10 phytoplanktonspecies (8 eukaryotes and 2 prokaryotes)(Table 17.1) ranging in size from 0.6 to 60 mm and howthe different cultures can be discriminated <strong>by</strong> usingcombination of parameters. For example, cyanobacteria(Synechococcus) and Cryptophyceae (Rhodomonas) can bediscriminated from other eukaryotic algae (red algaeexcluded) based on their high orange/red fluorescenceratio linked to the presence of phycoerythrin (see Fig.17.1d).Absolute cell concentration for each population iscomputed as follows:Cpop = T* Npop R*( Vtotal Vsample),(3)where C pop = concentration of population (cells·mL -1 ),N pop = number of cells acquired, T = acquisition time(minutes), R = sample flow rate (mL·min -1 ) as determinedfor the sample series (see Section 3.1.5), V total =volume of sample plus additions (fixatives, beads, etc.)(mL), and V sample = volume of sample (mL).To compare different samples, cell parameters arenormalized to parameters obtained for 0.95 mm of fluorescentmicrospheres added as internal reference. Themean value of each parameter (for the different populations)is divided <strong>by</strong> the mean value of the parameterfor the beads:Xrel = Xpop Xbeads,where X pop is the average value of a cell parameter(scatter or fluorescence) for a given population, andX beads is the same parameter for the reference beads.Both X pop and X beads must be expressed as linear values(not channels) after conversion from the logarithmicrecording scale.3.2. <strong>Cell</strong> Fixation and PreservationIf samples cannot be analyzed immediately, they mustbe fixed and then frozen in liquid nitrogen and storedat -80°C or in liquid nitrogen until analysis. Physicaltreatments such as centrifugation and classic or tangentialfiltration must be avoided because they induce vari-(4)TABLE 17.1 Cultures referred to in this chapter. The RCC column correspondsthe reference number of the culture in the Roscoff Culture Collection(http://www.sb-roscoff.fr/Phyto/collect.html).RCC Class Taxon Size (mm)1 Chlorophyceae Chlamydomonas sp. 76 Chlorophyceae Dunaliella tertiolecta Butcher 822 Chrysophyceae Picophagus flagellatus Guillou et Chrétiennot-Dinet 229 Cyanophyceae Synechococcus sp. 180 Bacillariophyceae Navicula transitans Cleve 989 Dinophyceae Gymnodinium sanguineum Hirasaka 60100 Pelagophyceae Pelagomonas calceolata Andersen et Saunders 3116 Prasinophyceae Ostreococcus tauri Courties et Chrétiennot-Dinet 0.8238 Bolidophyceae Bolidomonas mediterranea Guilou et Chrétiennot-Dinet 1.5286 Pelagophyceae Ankylochrysis lutea Billard 6350 Cryptophyceae Rhodomonas baltica Karsten 10407 Cyanophyceae Prochlorococcus sp. 0.6
AAC17 9/24/04 03:47 PM Page 88 <strong>Phytoplankton</strong> <strong>Cell</strong> <strong>Counting</strong> <strong>by</strong> <strong>Flow</strong> <strong>Cytometry</strong>able losses. Because phytoplanktonic cells are discriminatedon the basis of scatter and pigment fluorescence,the fixation procedure must preserve these properties.Classic methods such as formalin (a generic term thatdescribes a solution of 37% formaldehyde gas dissolvedin water usually containing 10 to 15% methanol) orLugol’s iodine fixation are generally inadequatebecause they modify cell shape or drastically affectfluorescence. Alcohol fixation will extract lipophilicpigments and lead to a loss of autofluorescence.Formaldehyde fixation (1% final concentration) isthe best method, because in our experience, itminimizes cell loss. Moreover, solutions of formaldehydeare buffered and do not strongly modify thepH level of seawater samples. Formaldehyde is obtained<strong>by</strong> heating paraformaldehyde powder (that has nofixation properties) in distilled water or phosphatebufferedsaline (PBS). Fixation with formaldehyde canbe supplemented with glutaraldehyde 0.05% (finalconcentrations), particularly when cell cycle analysis isperformed.However, formaldehyde solutions are neither easy toprepare nor stable over time. Therefore, for inexperiencedoperators, or when there is any doubt on thequality of the formaldehyde to be used (e.g., during animportant cruise), we recommend replacing formaldehydewith a commercial solution of glutaraldehyde at0.1% (final concentration). This will lead to slightlyhigher cell loss but is clearly preferable to fixation withbad formaldehyde, which leads to a lot of backgroundnoise (cell debris, small particles), making flow cytometricanalysis impossible.3.2.1. Materials1. Paraformaldehyde powder (Sigma P-6148)2. Glutaraldehyde 25% aqueous solution(Sigma G-6257)3. Sodium hydroxide in pellets4. Cryovials (e.g., Nunc)5. Pipettes and tips6. 0.2-mm pore-size syringe filters7. Paper filter3.2.2. Preparation of 10% Formaldehyde1. Note: If not confident with this procedure, useonly glutaraldehyde.2. Under a fume hood, add 10 g ofparaformaldehyde powder to 70 mL of boilingdistilled water.3. Mix vigorously for at least 2 hours under thefume hood.4. Add progressively small amounts of sodiumhydroxide (0.1 M).5. Agitate until the solution becomes clear.6. Add 10 mL of 10% PBS.7. Adjust the pH to 7.5.8. Bring final volume up to 100 mL with distilledwater.9. Filter through paper filter.10. Filter again through 0.2-mm pore-size syringefilters.11. Aliquot to 15-mL tubes and store at -20°C.12. Use unfrozen aliquoted formaldehyde solutionsfor not more than 1 week.3.2.3. Fixation Procedure1. Add 1% of formaldehyde or 0.1% ofglutaraldehyde or a mixture of both (1% and0.05%, respectively) to the sample.2. Mix <strong>by</strong> vortexing rapidly.3. Incubate for at least 15 minutes at roomtemperature.4. If samples cannot be analyzed immediately, thenthey must be quickly frozen using liquid nitrogen.They can then be stored at -20°C for a shortperiod (several days) but must be kept at m80°C orin liquid nitrogen for long-term storage, becausestorage at -20°C beyond 1 week will result in rapidsample degradation.3.3. Fluorescent DyesFluorescent dyes that recognize specific moleculeswithin cells extend considerably the application ofFCM. Among these dyes, the most useful are probablynucleic acid stains. They are extremely diverse and canbe used to detect contaminating bacteria or viruses(Marie et al. 1997) and to measure cell viability(Brussaard et al. 2001, Veldhuis et al. 2001) or cellcycle progression (Vaulot et al. 1986). A wide range ofnucleic acid–specific dyes synthesized and manufactured<strong>by</strong> Molecular Probes (www.probes.com), such asYOYO-1, PicoGreen, or SYBR Green-I (Li et al. 1995,Marie et al. 1997), are now available and replace theUV-excited dyes, DAPI or Hoechst 33342, initially usedfor this purpose (Monger and Landry 1993, Button andRobertson 2001). Other markers that could be used buthave received limited application for phytoplanktoninclude protein stains such as SYPRO (Zubkov et al.1999) or cellular activity stains such as FDA (Brookeset al. 2000).
AAC17 9/24/04 03:47 PM Page 9<strong>Phytoplankton</strong> <strong>Cell</strong> <strong>Counting</strong> <strong>by</strong> <strong>Flow</strong> <strong>Cytometry</strong> 93.3.1. Analysis of Heterotrophic Eukaryotes andBacterial ContaminantsThe analysis of heterotrophic cells requires a fixationstep <strong>by</strong> aldehydes, as mentioned earlier, and the use ofnucleic acid–specific stains. The affinity of the cyaninedyes (TOTO-1, YOYO-1) and their monomeric equivalents(TO-PRO-1, YO-PRO-1) decreases significantlywith ionic strength, which makes them inappropriatefor direct analysis of seawater samples (Marie et al.1996). Other dyes such as SYBR Green-I (SYBR-I),SYBR Green-II, and SYTOX Green are less dependenton the composition of the medium and can be used forthe enumeration of marine bacteria. Because SYBR-Ihas a very high fluorescence yield, we recommend thisdye to enumerate bacteria in marine samples, althoughSYTO-9 may provide better results for freshwatersamples (Marie et al. 1997, Lebaron et al. 1998).3.3.2. Materials1. 0.2-mm pore-size filtration units for plastic syringes2. 0.95 mm fluorescent microspheres (see Section3.1.1)3. DNA-specific stains such as SYBR Green-I (allstock solutions except SYBR-I must be prefilteredonto 0.2 mm or less to avoid contamination)4. <strong>Flow</strong> cytometer equipped with a 488-nm argonlaser5. Glutaraldehyde 25% aqueous solution and/orformaldehyde 10% (see Section 3.2)3.3.3. Sample Preparation1. If samples are live, add either 1% formaldehyde or0.1% glutaraldehyde (final concentrations) and wait20 minutes to allow a good fixation.2. If samples have been preserved and frozen, thawthem at 37°C.3. Dilute the sample in 0.2-mm pore-size filteredseawater if necessary (see Section 3.1.2).4. Add the SYBR-I at a final dilution of 1 :10,000 ofthe commercial solution.5. Incubate for 15 minutes at room temperature andin the dark.6. Add 10 mL of a suspension of 0.95 mm fluorescentmicrospheres at a concentration of 10 5 beads·mL -1in 1 mL of sample.3.3.4. Data Acquisition1. Turn the flow cytometer and computer on.2. Prepare the sheath fluid (distilled water can beused as sheath fluid, but for natural seawatersamples, 0.2-mm pore-size filtered seawater ispreferred).3. Calibrate the flow rate (see Section 3.1.5).4. Set the discriminator to green (SYBR-I)fluorescence with a threshold of 150.5. Set logarithmic amplification for all parameters.6. Typical settings on our FACSort flow cytometerare as follows: FSC = E01, SSC = 450, FL1 = 550,FL2 = 650, and FL3 = 650.7. Run the sample. The flow rate and the cellconcentration must be adjusted to avoidcoincidence. Typically, we analyze samples for 1 to2 minutes at a delivery rate of 25 to 50 mL·min -1and the number of events is kept below 1,000 persecond <strong>by</strong> sample dilution, so the total number ofrecorded events is about 100,000.3.3.5. Data AnalysisThe distribution of bacteria in cultures of Ostreococcustauri Courties et Chrétiennot-Dinet (Fig. 17.2a,b) andPelagomonas calceolata Andersen et Saunders (Fig.17.2c,d) are illustrated, as well as the detection of theheterotrophic eukaryote Picophagus flagellatus Guillou etChrétiennot-Dinet (Fig. 17.2e). In natural seawatersamples and cultures, the use of SYBR-I allows the discriminationof two or three different bacteria clusters(Fig. 17.2a) that correspond to different taxonomicgroups (Zubkov et al. 2001).Some samples contain a lot of small particles anddebris, which increase the level of background noise.This can induce coincidence or lead to the generationof large list-mode files. In such cases, the discriminatorthreshold must be increased to reduce the number ofevents seen <strong>by</strong> the flow instrument, or a “bitmap”window (nonrectangular region) can be defined thatincludes the population of bacteria so only the events inthis area are recorded.3.4. Analysis of Viral InfectionBecause viruses can induce rapid decay of algal cultures,it is sometimes necessary to analyze cultures to evaluatethe level of infection (see Chapter 22). The study ofviroplankton initially required techniques like transmissionelectron microscopy (TEM), which are time consumingand allow the analysis of only a limited numberof samples. During the 1990s, the use of nucleicacid–specific dyes detected <strong>by</strong> epifluorescencemicroscopy (EFM) improved our knowledge of viruses(Hennes and Suttle 1995) (see Chapter 22). More
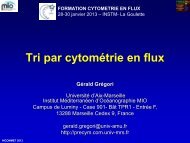
AAC17 9/24/04 03:47 PM Page 1010 <strong>Phytoplankton</strong> <strong>Cell</strong> <strong>Counting</strong> <strong>by</strong> <strong>Flow</strong> <strong>Cytometry</strong>Green fluorescence10 410 310 210 1aRed fluorescence10 410 310 210 1b10 0 10 0 10 1 10 2 10 3 10 4Side scatter10 0 10 0 10 1 10 2 10 3 10 4Green fluorescenceGreen fluorescence10 410 310 210 1cRed fluorescence10 410 310 210 1d10 0 10 0 10 1 10 2 10 3 10 4Side scatter10 0 10 0 10 1 10 2 10 3 10 4Green fluorescenceGreen fluorescence10 410 310 210 1eGreen fluorescence10 410 310 210 1f10 0 10 0 10 1 10 2 10 3 10 410 0 10 0 10 1 10 2 10 3 10 4Side scatterSide scatterFIGURE 17.2. Analysis of heterotrophic eukaryotes, bacteria, and viruses in algal cultures after staining with SYBR-I (green fluorescence).(See Table 17.1 for culture origin.) (a,b) Bacterial contaminants of Ostreococcus tauri (Prasinophyceae). Three populationsof bacteria are visible. (c,d) Bacterial contaminants of Pelagomonas calceolata (Pelagophyceae). (e) Picophagus flagellatus, a heterotrophicChrysophyceae, in co-culture with bacteria. (f ) Detection of viruses in a Micromonas pusilla (Butcher) Manton et Parke (Prasinophyceae)culture. (Fluorescent 0.95-mm microspheres were added in the samples.)recently, FCM has been successfully used for the analysisof viruses in solution, using the nucleic acid–specificdye SYBR-I (Marie et al. 1999).The preparation of the samples for the analysis ofviruses is similar to that of heterotrophs, although acertain number of precautions must be taken. No significantdifference has been found for virus enumerationperformed on samples fixed with formaldehyde,glutaraldehyde, or a mixture of both aldehydes. Forvirus samples that are freshly fixed (i.e., have not beenfrozen), or for recalcitrant material, it is necessary toheat the samples for 10 minutes at 80°C in the presenceof a detergent such as Triton X-100 (0.1% final concentration).Because a large fraction of virus particlescan pass through 0.2 mm pore-size filters, 0.2-me-size filteredseawater cannot be used to dilute the samples.The best solution to minimize the background noise isto dilute samples in Tris-EDTA buffer (Tris 10 mM,EDTA 1 mM). Different buffers have been tested, butTris-based buffers give the best results, probablybecause Tris has free amines that interact with aldehydes.Distilled water must be used as sheath fluid.Samples are then stained with SYBR-I at a dilution of1/20,000 of the commercial solution.Typical settings on a FACSort flow cytometer are asfollows: FSC = E03, SSC = 600, FL1 = 600, FL2 = 650,
AAC17 9/24/04 03:47 PM Page 11<strong>Phytoplankton</strong> <strong>Cell</strong> <strong>Counting</strong> <strong>by</strong> <strong>Flow</strong> <strong>Cytometry</strong> 11and FL3 = 650. Discriminator is set on the green fluorescence(FL1) with a threshold value of about 100.Analysis must be performed with a suspension of about2 ¥ 10 5 to 2 ¥ 10 6 viruses/mL (final concentration). Toavoid generating large files, samples can be run for 1 or2 minutes at a rate ranging from 10 to 30 mL·min -1 .Natural viroplankton displays a wide range of sizes,and these particles are often difficult to separate frombackground noise. However, viruses that contaminatecultures are usually simple to analyze (see Fig. 17.2f).Viruses are too small to be discriminated only <strong>by</strong> theirSSC or FSC properties. Detection must, therefore, beperformed using the green SYBR-I fluorescence (seeFig. 17.2f). Because FCM was not designed for theanalysis of such small particles, care must be taken toobtain reliable data. If samples are too diluted, there isa loss in the emission signal of the nucleic acid–dyecomplex. If they are not diluted enough, coincidenceoccurs or the population of viruses is overlapped <strong>by</strong>background noise. For viruses, coincidence seems tooccur at more than 600 events per second on a FACSort,that is, at a lower rate than for beads, bacteria, or smallalgae.3.5. <strong>Counting</strong> Dead vs. Live <strong>Cell</strong>sIt is sometimes necessary to evaluate the percentage ofliving and/or dead cells in a sample. Propidium iodide(PI) or SYTOX Green can penetrate into cells that havelost membrane integrity so that dead cells exhibit fluorescence.However, PI cannot be used with phytoplanktonbecause its red fluorescence interferes withthat of chlorophyll; SYTOX induces green fluorescence,which is more suitable (Veldhuis et al. 2001).Conversely, fluorescent dyes from the SYTO family(Molecular Probes), such as SYTO-9, or calcein-AMcan penetrate into intact cells and induce live cells tofluoresce green (Brussaard et al. 2001).4.0. Molecular Probes<strong>Phytoplankton</strong> can be discriminated from other particles<strong>by</strong> FCM based on their natural scattering and fluorescenceproperties. However, these natural propertiesare not sufficient to separate lower level taxa (e.g.,genera, species). Antibodies labeled with fluorescentmarkers have been used in this context (Peperzak et al.2000), but their use remains limited because of the lackof specificity for polyclonal antibodies and the cost fordeveloping monoclonal antibodies. Nucleic acid probestargeting ribosomal RNA (Amann et al. 1995) offer amuch more flexible solution. Probes can be easilydesigned to target any phylogenetic level from the divisionto the species, and various probes are available forphytoplankton.The probes used are generally oligonucleotides(15 to 30 bases). Different probe-labeling techniquesare available. Probes may be directly labeled with afluorochrome (Simon et al. 1995), or labeling maybe indirect (Not et al. 2002). For indirect labeling,hybridization of the probes and labeling with the fluorochromeare realized in two steps, as in the tyramidesignal amplification of fluorescent in situ hybridization(TSA-FISH) technique. Indirect labeling increases theintensity of fluorescence and thus raises the limit ofdetection and the signal/noise ratio (Not et al. 2002),which is critical for small cells. Recently, TSA-FISH hasbeen successfully adapted for the identification and enumerationof phytoplankton cells <strong>by</strong> FCM (Biegala et al.2003).The most common fluorochrome used is fluoresceinisothiocyanate (FITC) (excitation = 488 nm; emission =525 nm), but other fluorochromes that have higher fluorescenceyield, such as CY3 (excitation = 550 nm; emission= 570 nm) or CY5 (excitation = 650 nm; emission= 670 nm), are also suitable, provided that the flowcytometer can be set to the corresponding excitationand emission wavelengths. For phytoplankton, thecombined use of FCM and molecular probes may beuseful to assess culture identity or when cultures are notpure and it is difficult to distinguish the taxon of interestfrom the contaminants.4.1. Probe Design and LabelingA database of the oligonucleotide probes for cyanobacteriaand protists is available at www.sb-roscoff.fr/Phyto/Databases/RNA_probes_introduction.php.Although probes have been designed against some ofthe major algal groups such as the Chlorophyta, Prymnesiophyceae(Simon et al. 1995, 2000), or some keygenera such as Phaeocystis (Lange et al. 1996), considerablework remains to be done to cover all existingtaxa. Probes can be designed from ribosomal DNAdatabases using a public domain software such as ARB(www.arb-home.de). Advice for the design of new taxaspecificprobes is available in Amann et al. (1995).Probes may be purchased directly labeled, but cost may
AAC17 9/24/04 03:47 PM Page 1212 <strong>Phytoplankton</strong> <strong>Cell</strong> <strong>Counting</strong> <strong>by</strong> <strong>Flow</strong> <strong>Cytometry</strong>be reduced <strong>by</strong> custom labeling of oligonucleotideprobes with fluorochromes such as FITC or CY3(Amann et al. 1995).4.2. <strong>Cell</strong> LabelingThe cell labeling protocol was designed for the identificationof cells but was not optimized for cell counting.4.2.1. Materials1. Hybridization oven set at 46°C2. Microcentrifuge3. Fixatives: formaldehyde (stock at 10%) (see Section3.2.2) and ethanol4. Hybridization buffer: 0.9 M NaCl, 20 mM TrisHCl (pH 7.8), 0.01 sodium dodecyl sulfate (SDS),0% to 50% formamide. For every 1% increase inthe concentration of formamide, the meltingtemperature (T m ) of the hybrid is reduced <strong>by</strong>0.7°C. The percentage of formamide must beadapted for each probe to ensure a specific labeling(Amann et al. 1995).5. Wash buffer: 0.028 to 0.9 mM NaCl, 5 mM EDTA,0.01% SDS, 20 mM Tris-HCl, pH 7.5. Theconcentration of NaCl must be adapted for eachprobe so the stringency of the washing buffer isequivalent to the stringency of the hybridizationbuffer.6. Resuspension buffer: PBS4.2.2. Procedure1. <strong>Cell</strong> fixation and permeabilization: Samples (5 mLof cell suspension at 10 5 cells/mL) should be fixedwith formaldehyde (1% final concentration;glutaraldehyde should not be used because itprevents probe binding) and stored at 4°C for 1hour. <strong>Cell</strong>s are then pelleted (3 minutes, 4000 ¥ g)and resuspended in a cold (-80°C) mixture (70 :30,v/v) of ethanol and PBS (500 mL).2. Hybridization: <strong>Cell</strong>s are then pelleted again in anEppendorf type of tube and resuspended in 20 to100 mL of hybridization buffer. A 20-mL aliquot ofthe cell suspension is then incubated at 46°C for 3hours with the oligonucleotide probe (2.5 ng·mL -1 ).An aliquot without probe incubated in the samecondition can serve as a negative control forautofluorescence. Hybridization is stopped <strong>by</strong> theaddition of 1 mL of cold PBS at a pH of 9.0.Samples are then stored at 4°C until analysis withFCM.4.3. Analysis of Hybridized <strong>Cell</strong>s with<strong>Flow</strong> <strong>Cytometry</strong>First calibrate the sample flow rate (see Section 3.1.5).Set the discriminator to green fluorescence (if the fluorochromeused is FITC). Set all parameters on logarithmicamplification (Fig. 17.3). Events are recorded inlist mode. The flow rate and the cell concentration mustbe adjusted to avoid coincidence. Typically, we analyzesamples for 1 to 2 minutes at a delivery rate of 25 to50 mL·min -1 and the number of events is kept at lessthan 1,000 per second (<strong>by</strong> diluting samples that are tooconcentrated).4.4. Limits and TroubleshootingThe protocol used for whole-cell hybridization involvesseveral centrifugation steps that generally lead to theFIGURE 17.3. <strong>Flow</strong> cytometric analysis of fluorescencesignals for whole-cell hybridization of exponentially growingAnkylochrysis lutea (van der Veer) Billard in Honda and Inouye(Pelagophyceae) and Chlamydomonas sp. (Chlorophyceae) withfluorescein isothiocyanate (FITC)–monolabeled probes. Bothspecies are nanoplanktonic (diameter 7 to 10 mm). For eachspecies, the distribution of green fluorescence intensity per cellis plotted on a three-decade log scale. The intensity of green fluorescenceper cell was measured for cells incubated withoutprobe (green autofluorescence, no probe) and in the presenceof a general eukaryotic probe (Euk1209), a Pelagophyceae-specificprobe (Pela 01), and a Chlorophyta-specific probe (Chlo 02).(Modified from Simon et al. 2000.)
AAC17 9/24/04 03:47 PM Page 13<strong>Phytoplankton</strong> <strong>Cell</strong> <strong>Counting</strong> <strong>by</strong> <strong>Flow</strong> <strong>Cytometry</strong> 13formation of cell clumps and/or to cell losses due to theadhesion of the cells to the surfaces of the tubes. Suchlosses can be reduced <strong>by</strong> treating the tubes with surfactants,<strong>by</strong> adding surfactants to the cells, and <strong>by</strong> sonication(Biegala et al. 2003).The protocol based on monolabeled probes is quiteshort and simple. It is best suited, however, for largemicroplankton and nanophytoplankton cells. Forsmaller cells (picoplankton), the intensity of fluorescenceconferred <strong>by</strong> the probes is, in general, notsufficient to distinguish target from nontarget cells,especially if cultures are not in exponential growthphase. In this case, enzymatic amplification (TSA) maybe needed because it increases 20 to 40 times the fluorescenceintensity of target cells (Schönhuber et al.1997, Biegala et al. 2003).5.0. ConclusionFCM is now a well-established technique to analyzephytoplankton both in the field and in culture. Therehas been very little change in instrument design,although novel flow cytometers such as the FACSAria(released in late 2002) that combine small footprint,high sensitivity, and very fast sorting could prove idealfor both culture (in particular for the isolation of novelstrains) and field work. Most progress has come fromthe development of novel fluorochromes such as SYBRGreen that allow routine and enumeration analysis ofbacteria and viruses. The application of molecularprobes that permit accurate cell identification will probablydevelop considerably soon as the number of availablealgal sequences, a prerequisite for probe design,increases.6.0. AcknowledgmentsWe thank Isabelle Biegala for giving access to herwork before publication and Florence Le Gall forassistance with cultures. This work has been partiallyfunded <strong>by</strong> the following programs: PICODIV (EuropeanUnion EVK2-1999-00119), PICOMANCHE(Région Bretagne), Souchothèque de Bretagne (PlanEtat-Région), Centre de Ressources Biologiques(Ministère de la Recherche), and BIOSOPE (CNRS).7.0. ReferencesAmann, R. I., Ludwig, W., and Schleifer, K.-H. 1995. Phylogeneticidentification and in situ detection of individualmicrobial cells without cultivation. Microbiol. Rev.59:143–69.Biegala, I., Not, F., Vaulot, D., and Simon, N. 2003. Quantitativeassessment of picoeucaryotes in the natural environmentusing taxon specific oligonucleotide probes inassociation with TSA-FISH (tyramide signal amplification—fluorescentin situ hybridization) and flow cytometry.Appl. Environ. Microbiol. 69:5519–29.Brookes, J. D., Geary, S. M., Ganf, G. G., and Burch, M. D.2000. Use of FDA and flow cytometry to assess metabolicactivity as an indicator of nutrient status in phytoplankton.Mar. Freshw. Res. 51:817–23.Brussaard, C. P. D., Marie, D., Thyrhaug, R., and Bratbak, G.2001. <strong>Flow</strong> cytometric analysis of phytoplankton viabilityfollowing viral infection. Aquat. Microb. Ecol. 26:157–66.Button, D. K., and Robertson, B. R. 2001. Determination ofDNA content of aquatic bacteria <strong>by</strong> flow cytometry. Appl.Environ. Microbiol. 67:1636–45.Cavender-Bares, K. K., Frankel, S. L., and Chisholm, S. W.1998. A dual sheath flow cytometer for shipboard analysesof phytoplankton communities from the oligotrophicoceans. Limnol. Oceanogr. 43:1383–8.Collier, J. L. 2000. <strong>Flow</strong> cytometry and the single cell in phycology.J. Phycol. 36:628–44.Crosbie, N. D., Teubner, K., and Weisse, T. 2003. <strong>Flow</strong>cytometricmapping provides novel insights into the seasonaland vertical distributions of freshwater autotrophicpicoplankton. Aquat. Microb. Ecol. 33:53–66.Cucci, T. L., and Sieracki, M. E. 2001. Effects of mismatchedrefractive indices in aquatic flow cytometry. <strong>Cytometry</strong>44:173–8.Dubelaar, G. B., Groenewegen, A. C., Stokdijk, W., van denEngh, G. J., and Visser, J. W. 1989. Optical planktonanalyser: a flow cytometer for plankton analysis, II: specifications.<strong>Cytometry</strong> 10:529–39.Dubelaar, G. B. J., and Gerritzen, P. L. 2000. CytoBuoy: astep forward towards using flow cytometry in operaionaloceanography. Sci. Mar. 64:255–65.Dusenberry, J. A., and Frankel, S. L. 1994. Increasing thesensitivity of a FACScan flow cytometer to study oceanicpicoplankton. Limnol. Oceanogr. 39:206–9.Gasol, J. M., and Del Giorgio, P. A. 2000. Using flow cytometryfor counting natural planktonic bacteria and understandingthe structure of planktonic bacterial communities.Sci. Mar. 64:197–224.Green, R. E., Sosik, H. M., Olson, R. J., and DuRand, M. D.2003. <strong>Flow</strong> cytometric determination of size and complex
AAC17 9/24/04 03:47 PM Page 1414 <strong>Phytoplankton</strong> <strong>Cell</strong> <strong>Counting</strong> <strong>by</strong> <strong>Flow</strong> <strong>Cytometry</strong>refractive index for marine particles: comparison with independentand bulk estimates. Appl. Opt. 42:526–41.Hennes, K. P., and Suttle, C. A. 1995. Direct counts of virusesin natural waters and laboratory cultures <strong>by</strong> epifluorescencemicroscopy. Limnol. Oceanogr. 40:1050–5.Jacquet, S., Lennon, J. F., and Vaulot, D. 1998. Application ofa compact automatic sea water sampler to high frequencypicoplankton studies. Aquat. Microb. Ecol. 14:309–14.Lange, M., Guillou, L., Vaulot, D., Simon, N., Amann, R. I.,Ludwig, W., and Medlin, L. K. 1996. Identification of theclass Prymnesiophyceae and the genus Phaeocystis with ribosomalRNA-targeted nucleic acid probes detected <strong>by</strong> flowcytometry. J. Phycol. 32:858–68.Lebaron, P., Parthuisot, N., and Catala, P. 1998. Comparisonof blue nucleic acid dyes for flow cytometric enumerationof bacteria in aquatic systems. Appl. Environ. Microbiol.64:1725–30.Lebaron, P., Servais, P., Agogue, H., Courties, C., and Joux,F. 2001. Does the high nucleic acid content of individualbacterial cells allow us to discriminate between active cellsand inactive cells in aquatic systems? Appl. Environ. Microbiol.67:1775–82.Li, W. K. W., Jellett, J. F., and Dickie, P. M. 1995. The DNAdistributions in planktonic bacteria stained with TOTO orTO-PRO. Limnol. Oceanogr. 40:1485–95.Malara, G., and Sciandra, A. 1991. A multiparameter phytoplanktonculture system driven <strong>by</strong> microcomputer. J. Appl.Phycol. 3:235–41.Marie, D., Vaulot, D., and Partensky, F. 1996. Application ofthe novel nucleic acid dyes YOYO-1, YO-PRO-1, andPicoGreen for flow cytometric analysis of marine prokaryotes.Appl. Environ. Microbiol. 62:1649–55.Marie, D., Partensky, F., Jacquet, S., and Vaulot, D. 1997.Enumeration and cell cycle analysis of natural populationsof marine picoplankton <strong>by</strong> flow cytometry using the nucleicacid stain SYBR Green I. Appl. Environ. Microbiol.63:186–93.Marie, D., Brussaard, C. P. D., Thyrhaug, R., Bratbak, G., andVaulot, D. 1999. Enumeration of marine viruses in cultureand natural samples <strong>by</strong> flow cytometry. Appl. Environ.Microbiol. 65:45–52.Monger, B. C., and Landry, M. R. 1993. <strong>Flow</strong> cytometricanalysis of marine bacteria with Hoechst 33342. Appl.Environ. Microbiol. 59:905–11.Morel, A. 1991. Optics of marine particles and marine optics.In: Demers, S., ed. Particle Analysis in Oceanography.Springer-Verlag, New York, New York, 142–88.Not, F., Simon, N., Biegala, I. C., and Vaulot, D. 2002.Application of fluorescent in situ hybridization coupledwith tyramide signal amplification (FISH-TSA) to assesseukaryotic picoplankton composition. Aquat. Microb. Ecol.28:157–66.Olson, R. J., Frankel, S. L., Chisholm, S. W., and Shapiro, H.M. 1983. An inexpensive flow cytometer for the analysis offluorescence signals in phytoplankton: chlorophyll andDNA distributions. J. Exp. Mar. Biol. Ecol. 68:129–44.Olson, R. J., Vaulot, D., and Chisholm, S. W. 1985. Marinephytoplankton distributions measured using shipboard flowcytometry. Deep-Sea Res. A 32:1273–80.Olson, R. J., Shalapyonok, A., and Sosik, H. M. 2003. Anautomated submersible flow cytometer for analyzing picoandnanophytoplankton: <strong>Flow</strong>Cytobot. Deep-Sea Res. I50:301–15.Partensky, F., Hess, W. R., and Vaulot, D. 1999. Prochlorococcus,a marine photosynthetic prokaryote of global significance.Microb. Mol. Biol. Rev. 63:106–27.Peperzak, L., Vrieling, E. G., Sandee, B., and Rutten, T. 2000.Immuno flow cytometry in marine phytoplankton research.Sci. Mar. 64:165–81.Schönhuber, W., Fuchs, B., Juretschko, S., and Amann, R.1997. Improved sensitivity of whole-cell hybridization<strong>by</strong> the combination of horseradish peroxidase-labeledoligonucleotides and tyramide signal amplification. Appl.Environ. Microbiol. 63:3268–73.Sciandra, A., Lazzara, L., Claustre, H., and Babin, M. 2000.Responses of growth rate, pigment composition and opticalproperties of Cryptomonas sp to light and nitrogen stresses.Mar. Ecol. Prog. Ser. 201:107–20.Sheldon, R., and Parsons, T. 1967. A continuous size spectrumfor particulate matter in the sea. J. Fish. Res. Bd.Canada 24:909–15.Sheldon, R. 1978. Electronic counting. In: Sournia, A., ed.<strong>Phytoplankton</strong> Manual. UNESCO, Paris, France, 202–14.Simon, N., Lebot, N., Marie, D., Partensky, F., and Vaulot, D.1995. Fluorescent in situ hybridization with rRNA-targetedoligonucleotide probes to identify small phytoplankton <strong>by</strong>flow cytometry. Appl. Environ. Microbiol. 61:2506–13.Simon, N., Campbell, L., Ornolfsdottir, E., Groben, R.,Guillou, L., Lange, M., and Medlin, L. K. 2000. Oligonucleotideprobes for the identification of three algal groups<strong>by</strong> dot blot and fluorescent whole-cell hybridization. J. Euk.Microbiol. 47:76–84.Sosik, H. M., Olson, R. J., and Chisholm, S. W. 1989. Chlorophyllfluorescence from single cells: interpretation of flowcytometric signals. Limnol. Oceanogr. 34:1749–61.Trask, B. J., van den Engh, G. J., and Elgerhuizen, J. H. B.W. 1982. Analysis of phytoplankton <strong>by</strong> flow cytometry.<strong>Cytometry</strong> 2:258–64.Vaulot, D., Olson, R. J., and Chisholm, S. W. 1986. Light anddark control of the cell cycle in two phytoplankton species.Exp. <strong>Cell</strong>. Res. 167:38–52.Vaulot, D., Courties, C., and Partensky, F. 1989. A simplemethod to preserve oceanic phytoplankton for flow cytometricanalyses. <strong>Cytometry</strong> 10:629–35.
AAC17 9/24/04 03:47 PM Page 15<strong>Phytoplankton</strong> <strong>Cell</strong> <strong>Counting</strong> <strong>by</strong> <strong>Flow</strong> <strong>Cytometry</strong> 15Veldhuis, M. J. W., and Kraay, G. W. 2000. Application offlow cytometry in marine phytoplankton research: currentapplications and future perspectives. Sci. Mar. 64:121–34.Veldhuis, M. J. W., Kraay, G. W., and Timmermans, K. R.2001. <strong>Cell</strong> death in phytoplankton: correlation betweenchanges in membrane permeability, photosynthetic activity,pigmentation and growth. Eur. J. Phycol. 36:167–77.Yentsch, C. M., Horan, P. K., Muirhead, K., Dortch, Q.,Haugen, E. M., Legendre, L., Murphy, L. S., Phinney, D.,Pomponi, S. A., Spinrad, R. W., Wood, A. M., Yentsch, C.S., and Zahurenec, B. J. 1983. <strong>Flow</strong> cytometry and sorting:a powerful technique with potential applications in aquaticsciences. Limnol. Oceanogr. 28:1275–80.Zubkov, M. V., Fuchs, B. M., Eilers, H., Burkill, P. H., andAmann, R. 1999. Determination of total protein content ofbacterial cells <strong>by</strong> SYPRO staining and flow cytometry. Appl.Environ. Microbiol. 65:3251–7.Zubkov, M. V., Fuchs, B. M., Burkill, P. H., and Amann, R.2001. Comparison of cellular and biomass specific activitiesof dominant bacterioplankton groups in stratified waters ofthe Celtic Sea. Appl. Environ. Microbiol. 67:5210–8.
AAC17 9/24/04 03:47 PM Page 16
AUTHOR QUERY FORM (AAC17) 9/24/04 03:47 PM Page 1QUERY FORMDuring the preparation of your manuscript, the questions listed below have arisen. Please answer all the queries (marking anyother corrections on the proof enclosed) and return this form with your proofs.Query Query Replyno.1 AU: * symbol OK here?2 AU: * symbols OK here?AAC17