2012 Annual Report - Investor Relations - Sherwin-Williams
2012 Annual Report - Investor Relations - Sherwin-Williams
2012 Annual Report - Investor Relations - Sherwin-Williams

You also want an ePaper? Increase the reach of your titles
YUMPU automatically turns print PDFs into web optimized ePapers that Google loves.
<strong>2012</strong><strong>Annual</strong> <strong>Report</strong>
LETTER TO SHAREHOLDERSFrom left to right:Sean P. Hennessy,Senior Vice President – Financeand Chief Financial OfficerChristopher M. Connor,Chairman andChief Executive OfficerWe are pleased to report that <strong>2012</strong> was another record yearfor The <strong>Sherwin</strong>-<strong>Williams</strong> Company. It was a year of many milestones.John G. Morikis,President andChief Operating OfficerFor the second consecutive year, we reported record consolidated sales, which surpassed $9 billion for the firsttime in our 146-year history. Our strong revenue performance was matched with record results for net income,earnings per share and net operating cash. Total return to our shareholders in <strong>2012</strong> was nearly 75 percent, andour average annual total return over the past five years was 24 percent. The progress we made in <strong>2012</strong>, reflectedin these financial results, strongly affirms our long-term strategy of investing in new products, superior customerservice, and expanded distribution and capacity regardless of market conditions.■ 2We finished <strong>2012</strong> with consolidated sales of $9.53 billion,an increase of 8.8 percent over our previous all-timerevenue peak set in 2011. Income before taxes grew22.4 percent to $907.3 million, net income increased42.8 percent to $631.0 million, and diluted net incomeper common share increased 45.4 percent to $6.02 pershare from $4.14 per share last year.Our results for income before taxes, net income andearnings per share include a one-time payment of$80.0 million to the Company’s Employee StockOwnership Plan to resolve a complaint by the U.S.Department of Labor. The payment resulted in anafter-tax charge to earnings of $49.2 million, or $.47per diluted common share, in <strong>Sherwin</strong>-<strong>Williams</strong>’fourth quarter and year ended December 31, <strong>2012</strong>. Inaccordance with U.S. Generally Accepted AccountingPrinciples, the Company is required to recognize theresolution of this matter as a subsequent event in its<strong>2012</strong> fiscal year results because the event is relatedto conditions that existed at the balance sheet date ofDecember 31, <strong>2012</strong>.During the year, our Paint Stores Group eclipsed the3,500-store mark for the first time ever. We recruitedan unprecedented 1,087 college graduates into ourManagement Training Programs. Finally, in November,we announced a definitive agreement to acquireConsorcio Comex, S.A. de C.V., a leader in the paintand coatings market in Mexico. Once this transactionis completed, it will be the largest acquisition in ourCompany’s history.
These milestones, and many others we celebrated in<strong>2012</strong>, were the direct result of our decision to continue tomake prudent investments in our business even as marketconditions were collapsing back in 2008 and 2009. Since2009, we have opened more than 170 new company-operatedstores throughout the Americas, invested $373 million todevelop and commercialize new products, significantlyreduced the cost and increased the productivity of our globalmanufacturing and distribution operations, and recruitedmore than 2,800 future leaders into our ManagementTraining Programs. We believe the benefits of theseinvestments will be felt cumulatively over time, and theoutcomes we achieved this past year are repeatable.Consistent investment relies on strong, dependable cashgeneration. In <strong>2012</strong>, our net operating cash increased$152 million to $888 million, or approximately 9.3 percent ofnet sales. After adding back the cash settlement paid to theIRS in the first quarter of <strong>2012</strong>, cash from operations for theyear approached 10 percent of net sales, a long-term objectivefor the Company.Total return to our shareholders in <strong>2012</strong> wasnearly 75 percent, and our average annual totalreturn over the past five years was 24 percent.A portion of the increase in net operating cash camefrom our continued progress in working capital management.Our working capital ratio – accounts receivable plus inventoryminus accounts payable, divided by sales – declined to10.8 percent of sales at year-end, compared with 10.9 percentof sales at the end of 2011.During the year, we returned more than $718 million incash to shareholders through treasury stock purchases andquarterly dividends. The Company acquired 4.6 million sharesof its common stock on the open market at an average cost of$121.25 per share and a total investment of $558 million. Atyear-end, we had remaining authorization from our Board topurchase an additional 16.5 million shares. We also increasedour annual dividend by $.10 to $1.56 per share, extending ourstring of dividend increases to 34 consecutive years.In anticipation of closing the Comex acquisition in the firsthalf of 2013, we issued $1 billion of new debt in five- and30-year maturities in December at a blended average rateof 2.1 percent. As a result, we finished the year with a cashbalance of $863 million.Throughout the year, we saw steady improvement indemand for many of our products, particularly in NorthAmerica. Even as year-over-year sales comparisons grew moredifficult in the second half, our architectural paint volumesremained strong and we finished the year on a positive trajectory.PAINT STORES GROUPOur Paint Stores Group is the leading operator of specialty paintstores in North America, servicing the needs of architectural andindustrial painting contractors and do-it-yourself homeowners.Net sales for the Group finished the year at $5.41 billion, anincrease of 13.2 percent over 2011. Comparable-store sales –sales by stores open more than 12 months – increased12.5 percent during the year. The segment’s profit increased33.5 percent to $861.8 million. As a percentage of sales, PaintStores Group profit increased to a record 15.9 percent, up from13.5 percent in 2011.In <strong>2012</strong>, our Paint Stores Group added 70 net new stores,bringing our store count in the U.S., Canada and the Caribbeanto 3,520 locations, compared with 3,450 a year ago. Our planfor 2013 calls for net new store openings in the range of 70 to80 locations.Our commitment to store growth and quality staffing,combined with outstanding new products, marketing programsand sales initiatives over the past four years, has resulted insteady market share gains across most of our focus marketsegments. In <strong>2012</strong>, sales to all customer segments served by ourPaint Stores Group grew by more than 10 percent, led by thenew residential and residential repaint segments, which wereup double digits in both revenues and gallon volume.CONSUMER GROUPOur Consumer Group fulfills a dual mission for the Company:supplying branded and private-label products to retailersthroughout North America, and supporting our otherNorth America businesses with new product research anddevelopment, manufacturing, distribution and logistics. TheGroup manages a highly efficient supply chain consisting of34 manufacturing plants and seven distribution centers inthe U.S. and Canada and maintains one of the safest transportoperations in the world. In addition, the Consumer Groupleads our worldwide architectural coatings research anddevelopment effort.In <strong>2012</strong>, Consumer Group sales increased 3.7 percent to$1.32 billion as a result of acquisitions and selling priceincreases. Acquisitions increased net sales by 3.2 percent.Segment profit increased 24.6 percent to $216.4 million as priceincreases and better operating efficiencies more than offsethigher raw material costs. Segment profit margin expanded to16.4 percent of sales from 13.6 percent in 2011.■ 3
■ 4In June, our Consumer Group completed the acquisitionof Geocel Holdings Corporation, a leading producer ofinnovative sealants and adhesives for construction andrepair applications in commercial, residential, industrialand transport non-automotive markets. Founded in 1974,Geocel® branded products are distributed throughout theU.S. and United Kingdom. Geocel was the first U.S.-basedsealant manufacturer to receive ISO 9001 registration.GLOBAL FINISHES GROUPOur Global Finishes Group manufactures and sells industrialcoatings, automotive finishes, and protective and marinecoatings to a growing customer base in 120 countriesaround the world. We go to market through independentretailers, dedicated dealers, jobbers and distributors as wellas through our company-operated branches. Acquisitionshave played a particularly important role in this segment inrecent years, bringing new technology and needed capacityto key geographic regions.During the year, we returned more than$718 million in cash to shareholders throughtreasury stock purchases and quarterly dividends.Net sales for our Global Finishes Group increased4.4 percent to $1.96 billion. In local currencies, sales grew7.9 percent, driven by higher selling prices and volume anda 1.8 percent contribution from acquisitions. Segment profitfor the year increased 63 percent to $147.2 million, despitean $11.9 million negative impact from currency translationand acquisitions. As a percentage of net sales, the GlobalFinishes Group’s profit increased to 7.5 percent from4.8 percent in 2011.In December, we completed the acquisition of JiangsuPulanna Coating Co., Ltd., a leading manufacturer ofautomotive coatings for the Chinese aftermarket. Thisacquisition increases <strong>Sherwin</strong>-<strong>Williams</strong>’ presence inChina’s automotive sector, where passenger car sales havegrown strongly in recent years, increasing from 6.8 millionvehicles in 2008 to more than 16 million in <strong>2012</strong>. Auto salesin China are forecasted to continue rising at an annual rateof approximately 10 percent for the next decade.LATIN AMERICA COATINGS GROUPOur Latin America Coatings Group develops, manufactures,licenses and sells a variety of architectural paint andcoatings, and related products throughout Latin America.<strong>Sherwin</strong>-<strong>Williams</strong>® and other controlled brand products aredistributed through company-operated specialty paint stores andby a direct sales staff and outside sales representatives to retailers,dealers, licensees and other third-party distributors. In <strong>2012</strong>, weopened 11 net new company-operated stores in the region for atotal of 276 locations.In <strong>2012</strong>, unfavorable currency exchange rates in many LatinAmerica countries posed a significant challenge to revenue andprofit growth in our Latin America Coatings Group. Sales in U.S.dollars increased less than 1 percent to $836.1 million, whilesales in local currencies grew more than 10 percent. Profit forthe segment, stated in U.S. dollars, increased 7.6 percent to$81.2 million, as price increases and higher sales volumemore than offset the drag from higher raw material costsand unfavorable currency translation. Unfavorable currencytranslation reduced segment profit by $9.7 million in the year.As a percentage of net sales, segment profit was 9.7 percent forthe year compared with 9.1 percent in 2011.BOARD CHANGESAt our <strong>2012</strong> annual meeting of shareholders, Richard J. Kramerwas elected to our Board of Directors and appointed to theAudit Committee. Mr. Kramer is Chairman of the Board, ChiefExecutive Officer and President of The Goodyear Tire & RubberCompany. He has demonstrated strong leadership for 13 years atGoodyear, and his broad financial and international experiencewill serve the Board and our shareholders well. We look forwardto his contributions to <strong>Sherwin</strong>-<strong>Williams</strong> for many years.In 2013, A. Malachi Mixon III will reach mandatoryretirement age from our Board of Directors. Since 1993, Mr.Mixon has served our Company as a director and as a memberof the Audit Committee, the Compensation and ManagementDevelopment Committee, and the Nominating and CorporateGovernance Committee, including serving as Chair of theCompensation and Management Development Committee. Hisstrong leadership and sage advice have proven to be of great valueto the Company and its shareholders over the years. We offerMal our heartfelt thanks and best wishes for good health andhappiness in the years ahead.MANAGEMENT CHANGESIn August, David Sewell was appointed President of our ProductFinishes Division, which is part of our Global Finishes Group.David joined <strong>Sherwin</strong>-<strong>Williams</strong> in 2007 and has held a varietyof leadership positions, including Senior Vice President of ourAutomotive Finishes Division, responsible for our automotive,aerospace, OEM and distribution businesses, and Vice Presidentof Marketing for Automotive Finishes.
OUTLOOK FOR 2013We begin each year with some level of uncertainty, and 2013 is noexception. Despite the steadily improving health of many of our endmarkets and the positive trends we’ve seen in the cost of certaincommodities, we remain cautious. Market demand and volume recoveryhave been erratic across geographies and end markets, and that will likelycontinue. Unfavorable currency translation is also likely to remain aheadwind to sales and earnings throughout the year, particularly in someLatin America markets.The market for new construction in the U.S. provides the greatestsource of optimism. Housing starts increased approximately 27 percentin <strong>2012</strong>, but new home completions grew at less than half that rate,suggesting a pipeline of projects that will be painted in 2013. Residentialstarts in the coming year are forecasted to grow at a healthy high-teensrate, and non-residential starts, which increased about 4 percent in thefourth quarter of <strong>2012</strong>, should accelerate. As new construction picks up,repaint activity – the lion’s share of the market – should follow.Raw material costs, which have been an impediment to earningsgrowth over the past three years, remain biased toward inflation, but therate of inflation should be manageable. While we have seen some easingin TiO2 pricing over the back half of <strong>2012</strong>, propylene, a key raw materialfeedstock, has increased 30 percent from $.55 per pound early in thefourth quarter of <strong>2012</strong> to approximately $.72 per pound early in the firstquarter of 2013. This is likely to keep upward pressure on the price ofmonomers and latex in the first half of 2013.If the past five years have taught us anything, it is that we are not –and should not be – reliant on favorable market conditions to producebetter results. Our continued focus on better serving a diverse andincreasingly global professional customer base, expanding our distributiondomestically and abroad, developing new and innovative products,managing expenses and working capital, generating cash, and continuingto invest in our people will enable us to grow and prosper in the year aheadregardless of market conditions. We are equally confident that these samefactors will produce superior results and returns for our shareholders overthe long term.To the men and women of <strong>Sherwin</strong>-<strong>Williams</strong>, I offer my heartfeltthanks for all of your hard work, skills and commitment; I truly believethat having the best team in the business is integral to our success. Onbehalf of all <strong>Sherwin</strong>-<strong>Williams</strong> employees around the world, we offer ourthanks and appreciation to our customers, suppliers and shareholders fortheir continued trust and confidence.Milestones• Surpassed $9 billion inconsolidated sales for the firsttime in our 146-year history.• Recorded all-time highs in netincome ($631.0 million), dilutednet income per share ($6.02 pershare), and net operating cash($888 million).• Returned more than $718 millionin cash to shareholders throughtreasury stock purchases andquarterly dividends.• Achieved across-the-boardrecord financial results in thePaint Stores Group: net sales of$5.41 billion, operating profit of$861.8 million, and profit as apercentage of sales of15.9 percent.• Eclipsed the mark of 3,500<strong>Sherwin</strong>-<strong>Williams</strong> paint storesfor the first time ever.• Recruited an all-time high of1,087 college graduates into ourManagement Training Programs.Christopher M. ConnorChairman and Chief Executive Officer■ 5
<strong>Sherwin</strong>-<strong>Williams</strong><strong>2012</strong> AT A GLANCEPaint StoresGroup is composed ofthe exclusive outlets for<strong>Sherwin</strong>-<strong>Williams</strong>® brandedpaints, stains, supplies,equipment and floorcovering.56.7%of total salesConsumerGroup sells one of the industry’sstrongest portfolios of branded and privatelabel products through retailers acrossNorth America and in parts of Europe, andalso operates a highly effective globalsupply chain for paint, coatings andrelated products.13.9%of total salesPRODUCTS SOLD: Paints, stains, coatings, caulks,applicators, wallcoverings, floorcoverings, spray equipmentand related productsMARKETS SERVED: Do-it-yourselfers, professional paintingcontractors, home builders, property maintenance,healthcare, hospitality, architects, interior designers,industrial, marine, flooring and original equipmentmanufacturer (OEM) product finishersMAJOR BRANDS SOLD: <strong>Sherwin</strong>-<strong>Williams</strong>®, ProMar®,SuperPaint®, A-100®, Duron®, MAB®, PrepRite®, Duration®,Duration Home®, ProGreen®, Harmony®, ProClassic®,Woodscapes®, Deckscapes®, Cashmere®, HGTV® Homeby <strong>Sherwin</strong>-<strong>Williams</strong>, Emerald, Duracraft, Solo,ProIndustrial, ProPark®OUTLETS: 3,520 <strong>Sherwin</strong>-<strong>Williams</strong> stores in theUnited States, Canada, Aruba, Jamaica, Puerto Rico,St. Maarten, Trinidad and Tobago, and the Virgin IslandsPRODUCTS SOLD: Branded, private label and licensed brandpaints, stains, varnishes, industrial products, wood finishingproducts, wood preservatives, applicators, corrosion inhibitors,aerosols, caulks and adhesives, and related productsMARKETS SERVED: Do-it-yourselfers, professional paintingcontractors, industrial maintenance and flooring contractorsMAJOR BRANDS SOLD: Dutch Boy®, Krylon®, Minwax®,Thompson’s® WaterSeal®, Pratt & Lambert®, Martin Senour®,H&C®, White Lightning®, Dupli-Color®, Rubberset®, Purdy®,Bestt Liebco®, Accurate Dispersions, Uniflex®, VHT®, KoolSeal®, Snow Roof®, Altax, Tri-Flow®, Sprayon®, Ronseal,DuraSeal®OUTLETS: Leading mass merchandisers, home centers,independent paint dealers, hardware stores, craft stores, fine artstores, automotive retailers and industrial distributors in theUnited States, Canada, Mexico, Poland and United Kingdom■ 6
Global FinishesGroup manufactures andsells a wide range of OEM productfinishes, protective and marinecoatings, and automotive finishesto a growing customer base in120 countries.20.6%of total salesLatin AmericaCoatings Groupmanufactures and sells a widerange of architectural paints,industrial coatings and relatedproducts throughout Latin America.8.8%of total salesPRODUCTS SOLD: Asset protection products, wood finishes,applicators, aerosols, high performance interior and exteriorcoatings for the automotive, aviation, fleet and heavy truckmarkets, OEM product finishes and related productsMARKETS SERVED: Commercial construction, industrialmaintenance, automotive jobbers, wholesale distributors,collision repair facilities, dealerships, fleet owners andrefinishers, production shops, body builders, manufacturers,and job shopsMAJOR BRANDS SOLD: <strong>Sherwin</strong>-<strong>Williams</strong>®, Lazzuril®, Excelo®,Baco®, Planet Color®, AWX Performance Plus, Ultra, Ultra-Cure®, Martin Senour®, Kem Aqua®, Sher-Wood®, Powdura®,Polane®, Euronavy®, Inchem®, Sayerlack®, Becker Acroma®,Firetex®, Macropoxy®, Oece, Arti, Acrolon®, Sher-Nar®,PermaClad®, Heat-Flex®, Magnalux, ATX, Genesis®,Dimension®, Finish 1, Lanet, DFL, ConelyOUTLETS: 332 company-operated automotive, industrial andproduct finishes branches and other operations in the UnitedStates, Belarus, Belgium, Canada, Chile, China, Czech Republic,Denmark, Finland, France, Germany, India, Ireland, Italy,Lithuania, Malaysia, Mexico, Norway, Peru, Poland, Portugal,Romania, Russia, Singapore, Spain, Sweden, Thailand, Ukraine,United Kingdom and Vietnam.Distribution in 38 othercountries through wholly ownedsubsidiaries, joint ventures,distributors, export options, andlicensees of technology,trademarks andtrade namesPRODUCTS SOLD: Architectural paints, stains, coatings,varnishes, industrial maintenance products, wood finishingproducts, applicators, aerosols, OEM product finishes andrelated productsMARKETS SERVED: Professional painting contractors,independent paint dealers, industrial maintenance, OEMproduct finishers and do-it-yourselfersMAJOR BRANDS SOLD: <strong>Sherwin</strong>-<strong>Williams</strong>®, Marson,Metalatex®, Novacor, Loxon®, Colorgin, Andina,Napko, Martin Senour®, Sumare, Condor, Euronavy®,Krylon®, Kem Tone®, Minwax®, Pratt & Lambert®OUTLETS: 276 company-operated stores in Brazil, Chile,Colombia, Ecuador, Mexico and Uruguay. Distributionthrough dedicated dealers, home centers, distributors,hardware stores, and through licensees in Argentina,El Salvador, Peru and Venezuela■ 7
PAINT STORES GROUP<strong>Sherwin</strong>-<strong>Williams</strong> Paint Stores are the exclusive outlets for<strong>Sherwin</strong>-<strong>Williams</strong>® branded paints, stains, supplies, equipment andfloorcovering in the U.S., Canada and the Caribbean. In <strong>2012</strong>, thePaint Stores Group achieved record sales of $5.41 billion, generated$861.8 million in segment operating profit, and introduced a recordnumber of new products.<strong>Sherwin</strong>-<strong>Williams</strong> Paint Stores Group is theleading operator of specialty paint stores inNorth America, with 3,520 stores in the U.S.,Canada and the Caribbean at the end of <strong>2012</strong>. Over thepast year, we opened 70 net new stores, including our3,500 th store in Rancho Santa Margarita, California.Superior customer service and product knowledgeare hallmarks of <strong>Sherwin</strong>-<strong>Williams</strong> paint store staff.Our annual employee retention rate of more than90 percent helps to ensure a great customer experienceon every visit.Our stores serve architectural and industrialpainting contractors, residential and commercialbuilders and remodelers, property owners andmanagers, OEM product finishers, and do-it-yourselfhomeowners. In order to meet the disparate needs ofall these customers, we must consistently build anddemonstrate our product and application know-how,and continue to develop innovative new products.In <strong>2012</strong>, we introduced 28 new products – includingour best-in-class, Emerald Interior and ExteriorPaints. Emerald Interior Paintdelivers exceptional hide, durabilityand washability with a smooth,beautiful appearance. Emerald InteriorPaint is a GREENGUARD Indoor AirQuality Certified® product and is also aGREENGUARD Indoor Air Quality Certified for Childrenand Schools® product because of its low chemicalemissions during product use.* Emerald ExteriorPaint offers outstanding resistance to extreme weatherconditions. Due to its outstanding durability, EmeraldExterior Paint was recently used to refurbish the iconicHollywood Sign in time for its 90 th birthday in 2013.Superior customer service and productknowledge are hallmarks of the staff workingat our 3,520 company-operated stores in theU.S., Canada and the Caribbean. We opened70 net new stores in <strong>2012</strong>.In conjunction with the launch of EmeraldInterior and Exterior Paints, we introduced ColorCastEcoToner®, a new colorant system used to tint our<strong>Sherwin</strong>-<strong>Williams</strong> latex and water-based coatings. Thesecolorants do not add to the VOC content of any coatingand do not affect its thickness or consistency. They arecertified by GREENGUARD Environmental Institute forindoor air quality.In <strong>2012</strong>, we built upon last year’s successful launchof the HGTV® Home by <strong>Sherwin</strong>-<strong>Williams</strong> brand withthe addition of new exterior paints and wallpaper thatfeature colors and patterns coordinated with our HGTV®Home paint color collections.Other new products included: Duracraft® AcrylicLatex Exterior, Quick Dry Stain-Blocking Primer,ProMar® 200 Zero VOC Primer, ProMar® 400 Zero VOC■ 8* GREENGUARD Indoor Air Quality Certified® and GREENGUARDIndoor Air Quality Certified for Children and Schools® are registeredtrademarks of GREENGUARD Environmental Institute.
MilestonesJay Davisson, President of the Paint Stores Group, and WarrenRauterkus, Store Manager, cut the ribbon on <strong>Sherwin</strong>-<strong>Williams</strong>’3,500 th paint store, in Rancho Santa Margarita, California.Paint, Solo latex paint, Multi-Purpose Universal LatexPrimer, Pro Industrial Zero VOC Waterborne CatalyzedEpoxy, and ProPark® Traffic Marking Paint.The response to our recently introduced mobile andweb-based color planning tools has been extraordinary.Our award-winning ChipIt!, which allows users toturn any picture into a palette pulled from more than1,500 <strong>Sherwin</strong>-<strong>Williams</strong> paint colors, has generatedmore than 2 million visits. Our new Colorsnap Studiobuilds on the popular color matching capabilities of ouroriginal ColorSnap by adding color visualization tools. Itmakes difficult color decisions easier by enabling usersto load photos of their home’s interior andexterior and repaint them virtually usingcolor combinations of their choosing. Welaunched five new website experiences in<strong>2012</strong> to better serve homeowners, paintingcontractors, property management,builders, and architects and designers.• We opened 70 net new stores, includingour 3,500 th store in Rancho Santa Margarita,California, for a total Paint Stores Groupcount of 3,520 stores in the U.S., Canada andthe Caribbean.• Striving to meet the unique needs ofcustomers in all market segments, weintroduced a record 28 new products in <strong>2012</strong>.• Our new, best-in-class, Emerald Exterior Paintwas used to refurbish the iconic HollywoodSign in time for its 90 th birthday in 2013. Ourproduct was selected for its durability andresistance to blistering, peeling, chalking,fading, mold, mildew and dirt pick-up.■ 9
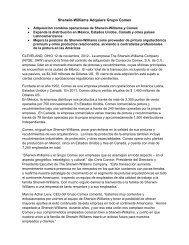
CONSUMER GROUPConsumer Group offers one of the industry’s strongest portfolios ofbranded and private-label products through retailers across North Americaand in parts of Europe. It also runs one of the industry’s most efficientand productive global supply chains. In <strong>2012</strong>, Consumer Group net salesincreased 3.7 percent to $1.32 billion, and segment profit grew 24.6 percentto $216.4 million.Our Consumer Group supplies well-known,nationally branded products, such as DutchBoy® and Pratt & Lambert® paints, Minwax®interior wood finishing products, Krylon® aerosolpaints, Thompson’s® WaterSeal® exterior waterproofingproducts, Purdy® paint brushes and rollers, and Dupli-Color® automotive specialty products. Our customersfor these products include most paint and automotiveretailers in the United States and Canada. We alsohave a presence in Europe, including wood finishingproducts under the Ronseal brand in the U.K. andIreland, and the Altax brand in Poland.During the past year, we strengthened several ofthese brands by introducing new products, applicationoptions and line extensions. Our goal is to provideDIY and professional customers a broad selection ofproducts that are easy to use, available in a wide varietyof colors, and made for a multitude of uses – bigger andbetter than what our competitors are able to do.Minwax® brand is already theleading brand of interior woodfinishing products in the U.S. In <strong>2012</strong>,we introduced Minwax® PolyShades®Aerosol, a convenient new way to applythe rich color and durable polyurethaneprotection of Minwax® PolyShades®. Wealso launched Krylon® Rust Protector, acomplete rust protection product line that dries fast toreduce the risk of damage to the finish from dust, leavesand debris, resulting in a smooth finish every time. OurDupli-Color® brand, the leading brand of automotiveaerosol paint products in the U.S., captured an evenlarger presence in the automotive retail channel withthe introduction of a new Dupli-Color® branded tireshine coating.Our goal is to provide DIY and professionalcustomers a broad selection of productsthat are easy to use, available in a widevariety of colors, and made for a multitudeof uses.In <strong>2012</strong>, we continued our successful VIP (VeryImportant Places) Partnership between Thompson’s®WaterSeal® and several state and national parks, whichuse our waterproofers and stains to protect woodsurfaces throughout their parks. And we leveraged thestrong equity in the Thompson’s® WaterSeal® brandwith a line extension into fabric protection. Our newThompson’s® WaterSeal® Fabric Seal prevents waterdamage, minimizes color fading, and repels spillsand stains on any outdoor fabric. It is ideal for use oncushions, pillows, umbrellas, canopies and more.■ 10Through the VIP Partnership between <strong>Sherwin</strong>-<strong>Williams</strong> and several state and nationalparks, Thompson’s® WaterSeal® products are being used to protect wood surfaces suchas the public viewing decks at Niagara Falls.
GLOBAL FINISHES GROUPThe Global Finishes Group manufactures and sells a wide range of OEMproduct finishes, protective and marine coatings, and automotive finishesto a growing customer base throughout the world.The reach of our Global Finishes Group is trulyworldwide, as we support large multinationalcompanies as well as small and medium-sizedenterprises around the world, while also providing all ofour customers with local service and technical support.With more than 30 major brands, we go to marketthrough 302 company-operated branches in25 countries as well as wholesale distributors andjobbers – selling in 120 countries in total. For the year,Global Finishes Group sales reached $1.96 billion, up4.4 percent from 2011, and segment profit increased by63 percent to $147.2 million.With more than 30 major brands, we go tomarket through 302 company-operatedbranches in 25 countries as well aswholesale distributors and jobbers –selling in 120 countries in total.Our waterborne and solvent-based liquid, powderand UV-curable coatings are uniquely positionedto serve the needs of the original equipmentmanufacturing (OEM) and productfinishing landscape. Many of the bestknownbrands in residential and officefurniture, cabinets, building products,agricultural and off-road equipment,and home and office electronics rely on<strong>Sherwin</strong>-<strong>Williams</strong> products to beautifyand protect their products and reinforce the quality oftheir brands. During <strong>2012</strong>, we earned approximately50 new specifications from heavy equipment OEMs,including some of the most prominent, global heavyequipment brands.Growing concerns about increasingly stringentenergy and environmental standards were significantproduct innovation drivers in <strong>2012</strong>. For example, wecontinued to expand our Sher-Wood® F3 line of highperformanceformaldehyde-free finishing products forwood, which provide the performance and appearanceof traditional wood finishing technologies without theair emissions of formaldehyde. Several F3 products areinternationally recognized GREENGUARD Indoor AirQuality Certified®, which will help our customers moreeasily meet LEED specifications.*We introduced several major new products to theglobal protective and marine coatings market during<strong>2012</strong>, including Magnalux® 404 FF, the industry’s firststyrene-free vinyl ester. It provides paint coatings withhigh chemical resistance, without the strong odor,flammability and high evaporation concerns associatedwith styrene. We also launched our Heat-Flex®Hi-Temp 1200, which protects against corrosion underinsulation (CUI), one of the costliest problems facingthe oil and gas industry today.Our automotive finishes business focuses oncollision repair, fleet owners and vehicle refinishers,auto and truck dealerships, production shops and autobody builders, and tier suppliers. We are one of the topautomotive refinish brands in North America – the■ 12* GREENGUARD Indoor Air Quality Certified® is a registeredtrademark of GREENGUARD Environmental Institute.
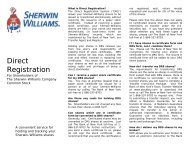
market leader in the production shop segment– and the leading supplier of coatings to theLatin America automotive refinish market. Newproducts in <strong>2012</strong> included upgrades in our AWXPerformance Plus waterborne technology;the ATX 3.5 VOC solvent-borne system forvehicle undercoats, basecoats and clears; the“adaptive” Clearcoat Technology platform toensure consistent auto finishing under a widevariety of conditions; and a wider range ofGenesis® Direct coatings for direct-to-metalapplications. In December, we completed theacquisition of Jiangsu Pulanna Coating Co.,Ltd., headquartered in Changzou, China, whichhas elevated our market share in automotivefinishes to a top three position in China.FIRETEX® fire protection coatings protectThe Shard at London Bridge, one of the mostimpressive and tallest buildings in theEuropean Union.Milestones• We earned 50 new specifications from heavy equipment OEMs,adding to our ever-expanding list of specification approvals.• Our high-quality FIRETEX® intumescent fire protection coatingswere used on 7,500 tonnes of steel for The Shard at LondonBridge, the tallest building in the European Union. Other signatureprotective and marine projects for the Global Finishes Groupincluded the Refineria de Cartagena, the largest capital expansionof an oil refinery in South America; and the massive Earthoid watertank in Germantown, Maryland, which is visible from outer space.• We acquired Jiangsu Pulanna Coating Co., Ltd., headquarteredin Changzou, China, which has elevated our market share inautomotive finishes to a top three position in China.■ 13
LATIN AMERICA COATINGS GROUPOur Latin America Coatings Group reaches approximately 425 millionpotential customers through our own stores, dedicated dealers, homecenters, distributors, hardware stores and other retailers. In <strong>2012</strong>, theGroup recorded sales of $836.1 million and segment profit of $81.2 million,increases of 0.9 percent and 7.6 percent, respectively, over 2011.Milestones• We continued to increase our branded retail presencein the region, which now consists of 276 companyoperatedpaint stores, including our first two storesin Colombia, and 371 dedicated dealers.• New product innovation remained a growth driver,including region-wide introduction of a premiuminterior and exterior architectural coatings line that isbased on a proprietary polymer.• We improved market share and profitability despitesignificant global and regional economic pressures.■ 14
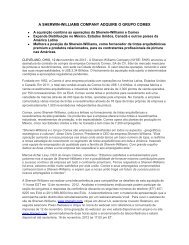
The <strong>Sherwin</strong>-<strong>Williams</strong>® brand is well-knownand highly regarded in many Latin Americacountries. It anchors a broad portfolio ofbranded products in architectural paints, industrialcoatings and related products. In <strong>2012</strong>, we opened11 new company-operated stores, including our first twostores in Colombia, one of the region’s largest paint andcoatings markets. The stores are located in the capitalcity of Bogotá and in the Atlantic port city of Cartagena,which is base for a large petrochemical industry. Weservice both architectural and protective and marinecustomers out of these locations.We currently have 276 company-operated stores inBrazil, Chile, Colombia, Ecuador, Mexico and Uruguay.We also operate 12 manufacturing sites across theregion and have subsidiaries in seven countries andlicensees of our brands operating in eight countries. Inaddition to our company-operated stores, we continuedto expand our dedicated dealer program, adding 13 newIn <strong>2012</strong>, we opened 11 new companyoperatedstores for a total of 276 of ourstores. We also continued to expand ourdedicated dealer program, which nowconsists of 371 locations in the region.locations in Argentina and 14 in Mexico for a total of371 in the region. Dedicated dealers are independentbusinesses that stock predominantly branded productssupplied by our Latin America Coatings Group.Market leadership, strong brands and innovativecoatings technology are tenets of our growth strategythroughout Latin America. We are the marketleader in many product categories and geographies:architectural paint and wood care in Ecuador;protective and marine coatings in Brazil and Chile;and aerosol paint in Argentina, Brazil and Chile. Wewill enhance our position in thesemarkets by continuing to expand ourdistribution and by developing newproducts and technologies. Our newproduct development effort is supportedby the transfer of relevant technologyfrom <strong>Sherwin</strong>-<strong>Williams</strong> research anddevelopment sites outside the regionas well as local technology research and productdevelopment.Product innovation during the year includedthe region-wide introduction of a competitivelypriced, premium product line of interior and exteriorarchitectural coatings. These coatings featureproprietary polymer beads that cure tighter and closertogether than traditional materials, which results insuperior washability for the flat interior paint, andenhanced stain and water resistance for the exteriorpaint. We also opened a <strong>Sherwin</strong>-<strong>Williams</strong> ColorStudio in Mexico City to enable us to better service andcollaborate with our top accounts in the new residentialand residential repaint markets.We have continued to enhance the profile of<strong>Sherwin</strong>-<strong>Williams</strong> in the region. During <strong>2012</strong>, our paint,waterproofing solutions and color system were featuredin the first local production of “Extreme Makeover:Home Edition Latin America.” A total of 10 episodeswere shot on location in Argentina, Chile and Mexico,and they have aired, and will continue to air, in primetime on the local Turner Network Television affiliatesacross the region. In addition, we were honored to berecognized by Forbes Magazine in Brazil on their Top100 list of “The World’s Most Innovative Companies”in <strong>2012</strong>.<strong>Sherwin</strong>-<strong>Williams</strong>® Metalatex® coatings were used on thebeautiful and historic Teatro Amazonas in Manaus, a cityin the heart of Brazil’s Amazon region.■ 15
SHAREHOLDER RETURNSFIVE-YEAR RETURNThe graph at right compares thecumulative five-year total shareholderreturn on <strong>Sherwin</strong>-<strong>Williams</strong> commonstock with the cumulative five-year totalreturn of the companies listed on theStandard & Poor’s 500 Stock Index anda peer group of companies selected on aline-of-business basis. The cumulativefive-year total return assumes $100was invested on December 31, 2007in <strong>Sherwin</strong>-<strong>Williams</strong> common stock,the S&P 500 and the peer group. Thecumulative five-year total return,including reinvestment of dividends,represents the cumulative valuethrough December 31, <strong>2012</strong>.COMPARISON OF CUMULATIVE FIVE-YEAR TOTAL RETURN$300$250$200$150$100$502007 2008 2009 2010 2011 <strong>2012</strong><strong>Sherwin</strong>-<strong>Williams</strong> Co.S&P 500 IndexPeer GroupPeer group of companies comprised of the following: Akzo Nobel N.V., BASF Corporation, H.B. Fuller Company,Genuine Parts Company, The Home Depot, Inc., Lowe’s Companies, Inc., Masco Corporation, Newell RubbermaidInc., PPG Industries, Inc., RPM International Inc., Stanley Black & Decker Inc., USG Corporation andThe Valspar Corporation.RETURNING CASH TOSHAREHOLDERSWe have consistently returned aportion of our cash generated fromoperations to shareholders throughcash dividends and share repurchases.In <strong>2012</strong>, the Company paid a cashdividend of $1.56 per share, markingthe 34 th consecutive year we increasedour dividend. Share repurchases arealso an efficient way of returning cashto shareholders in that it returnssellers’ investment at market value andmaximizes the value of the remainingshares outstanding. In <strong>2012</strong>, wepurchased 4.6 million shares on theopen market. Over the past 10 years,we have reduced our average dilutedcommon shares outstanding by43.7 million shares.STOCK REPURCHASE (millions of shares)15.0012.009.006.003.000.002003 2004 2005 2006 2007 2008 2009 2010 2011 <strong>2012</strong>147.0 144.7 141.1 137.3 130.9 118.2 114.5 108.8 105.7 103.3Average Common Shares Outstanding: (fully diluted, in millions)DIVIDENDS PER SHARE$1.601.200.800.40■ 160.0079 80 81 82 83 84 85 86 87 88 89 90 91 92 93 94 95 96 97 98 99 00 01 02 03 04 05 06 07 08 09 10 11 12
FINANCIAL PERFORMANCEFINANCIAL TABLE OF CONTENTSFinancial Summary .....................................................................................................................................................................18Management’s Discussion and Analysis of Financial Condition and Results of Operations .........................19<strong>Report</strong>s of Management and the Independent Registered Public Accounting Firm .................................... 40Consolidated Financial Statements and Notes ..............................................................................................................44Cautionary Statement Regarding Forward-Looking Information .......................................................................... 77Shareholder Information .........................................................................................................................................................78Corporate Officers and Operating Management ..........................................................................................................80■ 17
FINANCIAL SUMMARY(millions of dollars except as noted and per share data)<strong>2012</strong> 2011 2010 2009 2008OperationsNet sales ................................................................................................. $ 9,534 $ 8,766 $ 7,776 $ 7,094 $ 7,980Cost of goods sold ............................................................................... 5,328 5,021 4,295 3,831 4,481Selling, general and administrative expenses ............................ 3,260 2,961 2,728 2,535 2,644Impairments and dissolution .......................................................... 4 5 4 36 55Interest expense .................................................................................. 43 42 71 40 66Income before income taxes ........................................................... 907 742 678 623 714Net income ............................................................................................ 631 442 462 436 477Financial PositionAccounts receivable - net ................................................................. $ 1,033 $ 990 $ 917 $ 696 $ 770Inventories ............................................................................................ 920 927 918 738 864Working capital - net ......................................................................... 1,273 99 150 376 (28)Property, plant and equipment - net ............................................ 966 957 952 819 860Total assets ........................................................................................... 6,235 5,229 5,169 4,324 4,416Long-term debt ................................................................................... 1,632 639 648 783 304Total debt .............................................................................................. 1,705 993 1,045 818 834Shareholders’ equity .......................................................................... 1,792 1,517 1,609 1,491 1,606Per Common Share InformationAverage shares outstanding (thousands) ................................... 101,715 103,471 107,022 113,514 116,835Book value ............................................................................................. $ 17.35 $ 14.61 $ 15.04 $ 13.62 $ 13.72Net income - diluted (1) ................................................................... 6.02 4.14 4.21 3.78 4.00Net income - basic (1) ....................................................................... 6.15 4.22 4.28 3.80 4.04Cash dividends .................................................................................... 1.56 1.46 1.44 1.42 1.40Financial RatiosReturn on sales .................................................................................... 6.6% 5.0% 5.9% 6.1% 6.0%Asset turnover ...................................................................................... 1.5× 1.7× 1.5× 1.6× 1.8×Return on assets .................................................................................. 10.1% 8.4% 8.9% 10.1% 10.8%Return on equity (2) ......................................................................... 41.6% 27.5% 31.0% 27.1% 26.7%Dividend payout ratio (3) ................................................................ 37.7% 34.7% 38.1% 35.5% 29.8%Total debt to capitalization .............................................................. 48.8% 39.6% 39.4% 35.4% 34.2%Current ratio ........................................................................................ 1.7 1.0 1.1 1.3 1.0Interest coverage (4) ......................................................................... 22.2× 18.4× 10.6× 16.6× 11.9×Net working capital to sales ............................................................ 13.3% 1.1% 1.9% 5.3% (0.3)%Effective income tax rate (5) .......................................................... 30.4% 40.4% 31.8% 30.0% 33.3%GeneralCapital expenditures ......................................................................... $ 157 $ 154 $ 125 $ 91 $ 117Total technical expenditures (6) ................................................... 140 130 103 102 106Advertising expenditures ................................................................. 247 227 218 218 234Repairs and maintenance ................................................................ 83 78 76 69 76Depreciation ......................................................................................... 152 151 140 145 143Amortization of intangible assets .................................................. 27 30 35 26 22Shareholders of record (total count) ............................................ 7,954 8,360 8,706 9,151 9,469Number of employees (total count) ............................................. 34,154 32,988 32,228 29,220 30,677Sales per employee (thousands of dollars) ................................ $ 279 $ 266 $ 241 $ 243 $ 260Sales per dollar of assets .................................................................. 1.53 1.68 1.50 1.64 1.81(1) All earnings per share amounts are presented using the two-class method. See Note 15.(2) Based on net income and shareholders’ equity at beginning of year.(3) Based on cash dividends per common share and prior year’s diluted net income per common share.(4) Ratio of income before income taxes and interest expense to interest expense.(5) Based on income before income taxes.(6) See Note 1, page 51 of this report, for a description of technical expenditures.■ 18
MANAGEMENT’S DISCUSSION AND ANALYSIS OFFINANCIAL CONDITION AND RESULTS OF OPERATIONSSUMMARYThe <strong>Sherwin</strong>-<strong>Williams</strong> Company, founded in 1866, andits consolidated wholly owned subsidiaries (collectively, the“Company”) are engaged in the development, manufacture,distribution and sale of paint, coatings and related productsto professional, industrial, commercial and retail customersprimarily in North and South America with additional operationsin the Caribbean region, Europe and Asia. The Company isstructured into four reportable segments – Paint Stores Group,Consumer Group, Global Finishes Group and Latin AmericaCoatings Group (collectively, the “<strong>Report</strong>able Segments”) – andan Administrative Segment in the same way it is internallyorganized for assessing performance and making decisionsregarding allocation of resources. See pages 8 through 15 of thisreport and Note 18, on pages 74 through 76 of this report,for more information concerning the <strong>Report</strong>able Segments.The Company’s financial condition and liquidity remainedstrong in <strong>2012</strong> and net operating cash improved primarily dueto improving domestic architectural paint demand. Net workingcapital improved $1.17 billion at December 31, <strong>2012</strong> comparedto 2011 due primarily to a significant increase in cash and cashequivalents and a decrease in current liabilities. On December 4,<strong>2012</strong>, the Company issued $700.0 million of 1.35% Senior Notesdue 2017, and $300.0 million of 4.00% Senior Notes due 2042,which was the primary reason for the large increase in cashand cash equivalents. The Company has been able to arrangesufficient short-term borrowing capacity at reasonable rates andthe Company has sufficient total available borrowing capacity tofund its current operating needs. Net operating cash increased$152.1 million to $887.9 million in <strong>2012</strong>, which included a firstquarter payment of $59.1 million relating to a settlement reachedin the fourth quarter of 2011 with the Internal Revenue Service(the “IRS Settlement”), from $735.8 million in 2011, whichincluded a fourth quarter IRS Settlement payment of $60.0million. Strong net operating cash provided the funds necessaryto invest in new stores, manufacturing and distribution facilities,acquire businesses, pay down debt, maintain financial stabilityand return cash to shareholders through dividends and treasurystock purchases.Results of operations for the Company were strong andimproved in many areas in <strong>2012</strong>, primarily due to an improvingdomestic architectural paint market. Consolidated net salesincreased 8.8 percent in <strong>2012</strong> to $9.53 billion from $8.77 billionin 2011 due primarily to higher paint sales volume in the PaintStores Group and selling price increases. Acquisitions increasedconsolidated net sales 0.9 percent in <strong>2012</strong>. Gross profit as a percentof consolidated net sales increased to 44.1 percent in <strong>2012</strong>from 42.7 percent in 2011 due primarily to increased paint salesvolume and selling price increases partially offset by increases inraw material costs. Selling, general and administrative expenses(SG&A) increased $298.8 million in <strong>2012</strong> compared to 2011 dueprimarily to new stores, increased service expenses to supporthigher sales levels and maintain customer service, a settlementwith the United States Department of Labor (the “DOLSettlement”) and acquisitions partially offset by foreign currencytranslation rate fluctuations. See “<strong>2012</strong> Subsequent Event - DOLSettlement” on page 33 and Note 9 on page 67. SG&Aincreased as a percent of consolidated net sales to 34.2 percentin <strong>2012</strong> as compared to 33.8 percent in 2011 due primarily to theDOL Settlement partially offset by higher sales levels and goodcost control in all <strong>Report</strong>able Segments. Trademark impairmentcharges of $4.1 million occurred in <strong>2012</strong> due to planned conversionof various acquired brands. Impairments of trademarkswere $5.5 million in 2011. Interest expense increased $0.3million in <strong>2012</strong>. The effective income tax rate was 30.4 percentfor <strong>2012</strong> and 40.4 percent for 2011, which included $75.0 millionrelated to the IRS Settlement. Excluding the impact of the IRSSettlement would result in an effective income tax rate for 2011of 30.3 percent. Diluted net income per common share increased45.4 percent to $6.02 per share for <strong>2012</strong>, which included chargesrelating to the DOL Settlement ($.47 per share), from $4.14per share a year ago, which included charges relating to the IRSSettlement ($.70 per share).CRITICAL ACCOUNTING POLICIES AND ESTIMATESThe preparation and fair presentation of the consolidatedfinancial statements, accompanying notes and related financialinformation included in this report are the responsibility of management.The consolidated financial statements, accompanyingnotes and related financial information included in this reporthave been prepared in accordance with U.S. generally acceptedaccounting principles. The consolidated financial statementscontain certain amounts that were based upon management’sbest estimates, judgments and assumptions. Managementutilized certain outside economic sources of information whendeveloping the bases for their estimates and assumptions.Management used assumptions based on historical results,considering the current economic trends, and other assumptionsto form the basis for determining appropriate carrying valuesof assets and liabilities that were not readily available fromother sources. Actual results could differ from those estimates.Also, materially different amounts may result under materiallydifferent conditions, materially different economic trends orfrom using materially different assumptions. However, managementbelieves that any materially different amounts resultingfrom materially different conditions or material changes in factsor circumstances are unlikely to significantly impact the currentvaluation of assets and liabilities that were not readily availablefrom other sources.■ 19
MANAGEMENT’S DISCUSSION AND ANALYSIS OFFINANCIAL CONDITION AND RESULTS OF OPERATIONSAll of the significant accounting policies that were followedin the preparation of the consolidated financial statements aredisclosed in Note 1, on pages 48 through 51 of this report.The following procedures and assumptions utilized by managementdirectly impacted many of the reported amounts in theconsolidated financial statements.Non-Traded InvestmentsThe Company has invested in the U. S. affordable housingand historic renovation real estate markets. These investmentshave been identified as variable interest entities. However, theCompany is not the primary beneficiary and did not consolidatethe operations of the investments. The carrying amounts ofthese non-traded investments, which approximate market value,were determined based on cost less related income tax creditsdetermined by the effective yield method. The Company’s risk ofloss from these non-traded investments is limited to the amountof its contributed capital. The Company has no ongoing capitalcommitments, loan requirements or guarantees with the generalpartners that would require any future cash contributions otherthan the contractually committed capital contributions that aredisclosed in the contractual obligations table on page 29 ofthis report. See Note 1, on page 48 of this report, for moreinformation on non-traded investments.Accounts ReceivableAccounts receivable were recorded at the time of credit salesnet of provisions for sales returns and allowances. All provisionsfor allowances for doubtful collection of accounts are includedin Selling, general and administrative expenses and were basedon management’s best judgment and assessment, including ananalysis of historical bad debts, a review of the aging of Accountsreceivable and a review of the current creditworthiness ofcustomers. Management recorded allowances for such accountswhich were believed to be uncollectible, including amounts forthe resolution of potential credit and other collection issues suchas disputed invoices, customer satisfaction claims and pricingdiscrepancies. However, depending on how such potential issuesare resolved, or if the financial condition of any of the Company’scustomers were to deteriorate and their ability to make requiredpayments became impaired, increases in these allowances maybe required. At December 31, <strong>2012</strong>, no individual customerconstituted more than 5 percent of Accounts receivable.InventoriesInventories were stated at the lower of cost or market withcost determined principally on the last-in, first-out (LIFO)method based on inventory quantities and costs determined duringthe fourth quarter. Inventory quantities were adjusted duringthe fourth quarter as a result of annual physical inventory countstaken at all locations. If inventories accounted for on the LIFOmethod are reduced on a year-over-year basis, liquidation ofcertain quantities carried at costs prevailing in prior years occurs.Management recorded the best estimate of net realizable valuefor obsolete and discontinued inventories based on historicalexperience and current trends through reductions to inventorycost by recording a provision included in Cost of goods sold.Where management estimated that the reasonable market valuewas below cost or determined that future demand was lowerthan current inventory levels, based on historical experience,current and projected market demand, current and projectedvolume trends and other relevant current and projected factorsassociated with the current economic conditions, a reductionin inventory cost to estimated net realizable value was made.See Note 3, on page 52 of this report, for more informationregarding the impact of the LIFO inventory valuation.Purchase Accounting, Goodwill and Intangible AssetsIn accordance with the Business Combinations Topic of theASC, the Company used the purchase method of accountingto allocate costs of acquired businesses to the assets acquiredand liabilities assumed based on their estimated fair values atthe dates of acquisition. The excess costs of acquired businessesover the fair values of the assets acquired and liabilitiesassumed were recognized as Goodwill. The valuations of theacquired assets and liabilities will impact the determinationof future operating results. In addition to using managementestimates and negotiated amounts, the Company used a varietyof information sources to determine the estimated fair values ofacquired assets and liabilities including: third-party appraisalsfor the estimated value and lives of identifiable intangible assetsand property, plant and equipment; third-party actuaries forthe estimated obligations of defined benefit pension plans andsimilar benefit obligations; and legal counsel or other experts toassess the obligations associated with legal, environmental andother contingent liabilities. The business and technical judgmentof management was used in determining which intangibleassets have indefinite lives and in determining the useful lives offinite-lived intangible assets in accordance with the Goodwill andOther Intangibles Topic of the ASC.As required by the Goodwill and Other Intangibles Topic ofthe ASC, management performs impairment tests of goodwilland indefinite-lived intangible assets on an annual basis, aswell as whenever an event occurs or circumstances change thatindicate impairment has more likely than not occurred. Theoptional qualitative assessment, which allows companies to skipthe annual two-step quantitative test if it is not more likely thannot that impairment has occurred, is performed when deemedappropriate.■ 20
MANAGEMENT’S DISCUSSION AND ANALYSIS OFFINANCIAL CONDITION AND RESULTS OF OPERATIONSIn accordance with the Goodwill and Other IntangiblesTopic of the ASC, management tests goodwill for impairment atthe reporting unit level. A reporting unit is an operating segmentper the Segment <strong>Report</strong>ing Topic of the ASC or one level belowthe operating segment (component level) as determined by theavailability of discrete financial information that is regularlyreviewed by operating segment management or an aggregateof component levels of an operating segment having similareconomic characteristics. At the time of goodwill impairmenttesting (if performing a quantitative assessment), managementdetermines fair value through the use of a discounted cash flowvaluation model incorporating discount rates commensuratewith the risks involved for each reporting unit. If the calculatedfair value is less than the current carrying value, impairment ofthe reporting unit may exist. The use of a discounted cash flowvaluation model to determine estimated fair value is commonpractice in impairment testing. The key assumptions used in thediscounted cash flow valuation model for impairment testinginclude discount rates, growth rates, cash flow projectionsand terminal value rates. Discount rates are set by using theWeighted Average Cost of Capital (“WACC”) methodology.The WACC methodology considers market and industry dataas well as Company-specific risk factors for each reporting unitin determining the appropriate discount rates to be used. Thediscount rate utilized for each reporting unit is indicative of thereturn an investor would expect to receive for investing in sucha business. Operational management, considering industryand Company-specific historical and projected data, developsgrowth rates, sales projections and cash flow projections for eachreporting unit. Terminal value rate determination follows commonmethodology of capturing the present value of perpetualcash flow estimates beyond the last projected period assuminga constant WACC and low long-term growth rates. As anindicator that each reporting unit has been valued appropriatelythrough the use of the discounted cash flow valuation model, theaggregate of all reporting units fair value is reconciled to the totalmarket capitalization of the Company.The Company performed the optional qualitative assessmentfor its <strong>2012</strong> goodwill impairment test for each of itsreporting units. The 2011 goodwill impairment test, in whichthe fair values of each of the reporting units exceeded theirrespective carrying values by more than ten percent, served asthe starting point. Management identified future projected netincome, return on average net assets employed and discountrate as the most relevant drivers affecting the fair value calculations.A budget-to-actual analysis was performed in which eachreporting unit’s key metrics were compared against budgetedamounts in order to assess the validity of future projectednet income used in the 2011 analysis. Management evaluatedwhether there were any capital investment or working capitaldeviations from budget that would significantly affect returnon average net assets employed. Management considered howthe discount rates used in the fair value calculation would havechanged since the 2011 goodwill impairment test, and performeda sensitivity analysis noting that it would require a discount ratesignificantly higher than what would be expected in order for anyreporting unit to have a fair value not more than 10% in excess ofits carrying value. Management also analyzed macroeconomicconditions, industry and market considerations, cost factors,overall financial performance of the Company, entity-specificevents and reporting unit-specific events. Based on the resultsof the qualitative assessment, management determined that itwas not more likely than not that any of the reporting units wereimpaired and did not need to perform a quantitative test for anyof the reporting units.In accordance with the Goodwill and Other IntangiblesTopic of the ASC, management tests indefinite-lived intangibleassets for impairment at the asset level, as determined byappropriate asset valuations at acquisition. Management utilizesthe royalty savings method and valuation model to determinethe estimated fair value for each indefinite-lived intangibleasset or trademark. In this method, management estimates theroyalty savings arising from the ownership of the intangible asset.The key assumptions used in estimating the royalty savings forimpairment testing include discount rates, royalty rates, growthrates, sales projections and terminal value rates. Discount ratesused are similar to the rates developed by the WACC methodologyconsidering any differences in Company-specific risk factorsbetween reporting units and trademarks. Royalty rates areestablished by management and valuation experts and periodicallysubstantiated by valuation experts. Operational management,considering industry and Company-specific historical andprojected data, develops growth rates and sales projections foreach significant trademark. Terminal value rate determinationfollows common methodology of capturing the present valueof perpetual sales estimates beyond the last projected periodassuming a constant WACC and low long-term growth rates. Theroyalty savings valuation methodology and calculations used in<strong>2012</strong> impairment testing are consistent with prior years.The discounted cash flow and royalty savings valuation methodologiesrequire management to make certain assumptionsbased upon information available at the time the valuations areperformed. Actual results could differ from these assumptions.Management believes the assumptions used are reflective ofwhat a market participant would have used in calculating fairvalue considering the current economic conditions. See Notes 2and 4, on pages 51 through 53 of this report, for a discussionof businesses acquired, the estimated fair values of goodwilland identifiable intangible assets recorded at acquisition dateand reductions in carrying value of goodwill and indefinite-lived■ 21
MANAGEMENT’S DISCUSSION AND ANALYSIS OFFINANCIAL CONDITION AND RESULTS OF OPERATIONSintangible assets recorded as a result of impairment tests inaccordance with the Goodwill and Other Intangibles Topicof the ASC.Property, Plant and Equipment and Impairment ofLong-Lived AssetsProperty, plant and equipment was stated on the basis of costand depreciated principally on a straight-line basis using industrystandards and historical experience to estimate useful lives. Inaccordance with the Property, Plant and Equipment Topic of theASC, if events or changes in circumstances indicated that thecarrying value of long-lived assets may not be recoverable or theuseful life had changed, impairment tests were performed or theuseful life was adjusted. Undiscounted future cash flows wereused to calculate the recoverable value of long-lived assets todetermine if such assets were impaired. Where impairment wasidentified, management determined fair values for assets usinga discounted cash flow valuation model, incorporating discountrates commensurate with the risks involved for each group ofassets. Growth models were developed using both industry andcompany historical results and forecasts. If the usefulness of anasset was determined to be impaired, management estimateda new useful life based on the period of time for projected usesof the asset. Such models and changes in useful life requiredmanagement to make certain assumptions based upon informationavailable at the time the valuation or determination wasperformed. Actual results could differ from these assumptions.Management believes the assumptions used are reflective ofwhat a market participant would have used in calculating fairvalue or useful life considering the current economic conditions.All tested long-lived assets or groups of long-lived assets hadundiscounted cash flows that were substantially in excess of theircarrying value, except as noted in Note 4. See Notes 4 and 5, onpages 52 through 56 of this report, for a discussion of thereductions in carrying value or useful life of long-lived assetsin accordance with the Property, Plant and Equipment Topicof the ASC.Exit or Disposal ActivitiesManagement is continually re-evaluating the Company’soperating facilities against its long-term strategic goals.Liabilities associated with exit or disposal activities are recognizedas incurred in accordance with the Exit or Disposal CostObligations Topic of the ASC and property, plant and equipmentis tested for impairment in accordance with the Property, Plantand Equipment Topic of the ASC. Provisions for qualified exitcosts are made at the time a facility is no longer operational, includeamounts estimated by management and primarily includepost-closure rent expenses or costs to terminate the contractbefore the end of its term and costs of employee terminations.Adjustments may be made to liabilities accrued for qualified exitcosts if information becomes available upon which more accurateamounts can be reasonably estimated. If impairment of property,plant and equipment exists, the carrying value is reduced to fairvalue estimated by management. Additional impairment may berecorded for subsequent revisions in estimated fair value. SeeNote 5, on pages 54 through 56 of this report, for informationconcerning impairment of property, plant and equipmentand accrued qualified exit costs.Other LiabilitiesThe Company is self-insured for certain liabilities, primarilyworker’s compensation claims, employee medical benefits,and automobile, property, general and product liability claims.Estimated amounts were accrued for certain worker’s compensation,employee medical and disability benefits, automobile andproperty claims filed but unsettled and estimated claims incurredbut not reported based upon management’s estimated aggregateliability for claims incurred using historical experience, actuarialassumptions followed in the insurance industry and actuariallydevelopedmodels for estimating certain liabilities. Certainestimated general and product liability claims filed but unsettledwere accrued based on management’s best estimate of ultimatesettlement or actuarial calculations of potential liability usingindustry experience and actuarial assumptions developed forsimilar types of claims.Defined Benefit Pension and Other PostretirementBenefit PlansTo determine the Company’s ultimate obligation under itsdefined benefit pension plans and postretirement benefit plansother than pensions, management must estimate the future costof benefits and attribute that cost to the time period during whicheach covered employee works. To determine the obligations ofsuch benefit plans, management uses actuaries to calculate suchamounts using key assumptions such as discount rates, inflation,long-term investment returns, mortality, employee turnover,rate of compensation increases and medical and prescriptiondrug costs. Management reviews all of these assumptions onan ongoing basis to ensure that the most current informationavailable is being considered. An increase or decrease in theassumptions or economic events outside management’s controlcould have a direct impact on the Company’s results of operationsor financial condition.In accordance with the Retirement Benefits Topic of theASC, the Company recognizes each plan’s funded status as anasset for overfunded plans and as a liability for unfunded orunderfunded plans. Actuarial gains and losses and prior servicecosts are recognized and recorded in Cumulative other comprehensiveloss, a component of Shareholders’ equity. The amounts■ 22
MANAGEMENT’S DISCUSSION AND ANALYSIS OFFINANCIAL CONDITION AND RESULTS OF OPERATIONSrecorded in Cumulative other comprehensive loss will continueto be modified as actuarial assumptions and service costs change,and all such amounts will be amortized to expense over a periodof years through the net pension and net periodic benefit costs.Effective July 1, 2009, the domestic salaried defined benefitpension plan was revised. Prior to July 1, 2009, the contributionwas based on six percent of compensation for certain coveredemployees. Under the revised plan, such participants arecredited with certain contribution credits that range from twopercent to seven percent of compensation based on an age andservice formula.A reduction in the over-funded status of the Company’sdefined benefit pension plans at December 31, 2008, due to thedecrease in market value of equity securities held by the plans,increased the future amortization of actuarial losses recognizedin Cumulative comprehensive loss. This amortization increasednet pension costs in 2010, 2011, and <strong>2012</strong>. An increase in marketvalue of equity securities held by the plans during 2010 and2011 will decrease the future amortization of actuarial lossesrecognized in Cumulative comprehensive loss, but not enough tooffset the full extent of losses experienced in 2008. The excessin market value of equity securities held by the plans versus theexpected returns in <strong>2012</strong> will decrease the future amortizationof actuarial losses. The amortization of actuarial losses onplan assets, partially offset by a decrease in discount rates onprojected benefit obligations, will decrease net pension costs in2013. See Note 6, on pages 56 through 62 of this report, forinformation concerning the Company’s defined benefit pensionplans and postretirement benefit plans other than pensions.DebtThe fair values of the Company’s publicly traded long-termdebt were based on quoted market prices. The fair values of theCompany’s non-traded long-term debt were estimated usingdiscounted cash flow analyses, based on the Company’s currentincremental borrowing rates for similar types of borrowingarrangements. See Note 1, on page 48 of this report, for thecarrying amounts and fair values of the Company’s long-termdebt, and Note 7, on pages 62 and 63 of this report, for adescription of the Company’s long-term debt arrangements.Environmental MattersThe Company is involved with environmental investigationand remediation activities at some of its currently and formerlyowned sites and at a number of third-party sites. The Companyaccrues for environmental-related activities for which commitmentsor clean-up plans have been developed and for which costscan be reasonably estimated based on industry standards andprofessional judgment. All accrued amounts were recorded on anundiscounted basis. Environmental-related expenses includeddirect costs of investigation and remediation and indirect costssuch as compensation and benefits for employees directlyinvolved in the investigation and remediation activities and feespaid to outside engineering, actuarial, consulting and law firms.Due to uncertainties surrounding environmental investigationsand remediation activities, the Company’s ultimate liabilitymay result in costs that are significantly higher than currentlyaccrued. See pages 27 through 29 and Note 8, on pages 63and 64 of this report, for information concerning the accrualfor extended environmental-related activities and a discussionconcerning unaccrued future loss contingencies.Litigation and Other Contingent LiabilitiesIn the course of its business, the Company is subject to avariety of claims and lawsuits, including litigation relating toproduct liability and warranty, personal injury, environmental,intellectual property, commercial and contractual claims.Management believes that the Company has properly accruedfor all known liabilities that existed and those where a loss wasdeemed probable for which a fair value was available or anamount could be reasonably estimated in accordance with allpresent U.S. generally accepted accounting principles. However,because litigation is inherently subject to many uncertainties andthe ultimate result of any present or future litigation is unpredictable,the Company’s ultimate liability may result in costs thatare significantly higher than currently accrued. In the event thatthe Company’s loss contingency is ultimately determined to besignificantly higher than currently accrued, the recording of theliability may result in a material impact on net income for theannual or interim period during which such liability is accrued.Additionally, due to the uncertainties involved, any potentialliability determined to be attributable to the Company arisingout of such litigation may have a material adverse effect on theCompany’s results of operations, liquidity or financial condition.See pages 31 through 34 of this report and Note 9, on pages64 through 67 of this report, for information concerninglitigation.In addition, the Company may be subject to potential liabilitiesfor which a loss was not deemed probable at this time and anamount could not be reasonably estimated due to uncertaintiesinvolved. See pages 30 and 31 of this report for more informationconcerning contingent liabilities.Income TaxesThe Company estimated income taxes in each jurisdictionthat it operated. This involved estimating taxable earnings,specific taxable and deductible items, the likelihood of generatingsufficient future taxable income to utilize deferred taxassets and possible exposures related to future tax audits. Tothe extent these estimates change, adjustments to deferred and■ 23
MANAGEMENT’S DISCUSSION AND ANALYSIS OFFINANCIAL CONDITION AND RESULTS OF OPERATIONSaccrued income taxes will be made in the period in which thechanges occur.In October 2011, the Company reached a settlement of theIRS’ audit of the Company’s employee stock ownership plan(ESOP). The Company has fully resolved all IRS issues for the2003 through 2009 tax years relating to the matters challengingthe ESOP related federal income tax deductions claimed by theCompany and proposing substantial excise taxes and penalties.The IRS Settlement (including interest), which resolved allESOP related tax issues, resulted in an after-tax charge relatedto federal and state income taxes totaling approximately $75.0million, or $.70 per diluted common share, and an additionalreduction in Shareholders’ equity of approximately $51.2 millionin the Company’s fourth quarter of 2011. The Company paid$60.0 million of the IRS Settlement to the IRS during 2011 andmade a final payment of approximately $59.1 million in the firstquarter of <strong>2012</strong>. The Company received a refund of $8.9 millionfor other issues related to the 2006 and 2007 audit period. TheIRS commenced an examination of the Company’s U.S. incometax returns for the 2008 and 2009 tax years in the third quarterof 2011. Fieldwork is expected to be completed during 2013. Atthis time, the Company has determined that an insignificantrefund is due for issues under review during this audit period.See Note 14, on pages 71 and 72 of this report, for informationconcerning the Company’s unrecognized tax benefits,interest and penalties and current and deferred tax expense.Stock-Based CompensationThe cost of the Company’s stock-based compensation isrecorded in accordance with the Stock Compensation Topicof the ASC. The Company follows the “modified prospective”method as described in the Topic whereby compensationcost is recognized for all share-based payments granted afterDecember 31, 2005.The Company estimates the fair value of option rights usinga Black-Scholes-Merton option pricing model which requiresmanagement to make estimates for certain assumptions.Management and a consultant continuously review the followingsignificant assumptions: risk-free interest rate, expected life ofoptions, expected volatility of stock and expected dividend yieldof stock. An increase or decrease in the assumptions or economicevents outside management’s control could have a direct impacton the Company’s results of operations. See Note 12, on pages69 and 70 of this report, for more information on stockbasedcompensation.Revenue RecognitionThe Company’s revenue was primarily generated fromthe sale of products. All sales of products were recognizedwhen shipped and title had passed to unaffiliated customers.Collectibility of amounts recorded as revenue is reasonablyassured at time of sale. Discounts were recorded as a reductionto sales in the same period as the sale resulting in an appropriatenet sales amount for the period. Standard sales terms are finaland returns or exchanges are not permitted unless expresslystated. Estimated provisions for returns or exchanges, recordedas a reduction resulting in net sales, were established in caseswhere the right of return existed. The Company offered a varietyof programs, primarily to its retail customers, designed topromote sales of its products. Such programs required periodicpayments and allowances based on estimated results of specificprograms and were recorded as a reduction resulting in netsales. The Company accrued the estimated total payments andallowances associated with each transaction at the time of sale.Additionally, the Company offered programs directly to consumersto promote the sale of its products. Promotions that reducedthe ultimate consumer sale prices were recorded as a reductionresulting in net sales at the time the promotional offer was made,generally using estimated redemption and participation levels.The Company continually assesses the adequacy of accruals forcustomer and consumer promotional program costs earned butnot yet paid. To the extent total program payments differ fromestimates, adjustments may be necessary. Historically, these totalprogram payments and adjustments have not been material.FINANCIAL CONDITION, LIQUIDITYAND CASH FLOWOverviewThe Company’s financial condition and liquidity remainedstrong in <strong>2012</strong> and net operating cash improved primarily dueto improving domestic architectural paint demand. Net workingcapital improved $1.17 billion at December 31, <strong>2012</strong> comparedto 2011 due primarily to a significant increase in cash and cashequivalents of $829.9 million and a decrease in current liabilities.On December 4, <strong>2012</strong>, the Company issued $700.0 millionof 1.35% Senior Notes due 2017 and $300.0 million of 4.00%Senior Notes due 2042, which was the primary reason for thelarge increase in cash and cash equivalents. Accounts receivablewere up $42.6 million while Inventories were down $6.5million. Deferred tax net assets were down $22.5 million whilethe remaining current assets increased $44.1 million. Accountspayable decreased $42.2 million, Accrued taxes decreased $68.5million, and Short-term borrowings decreased $277.3 millionwhile all other current liabilities increased $101.7 million. TheCompany’s current ratio improved to 1.68 at December 31, <strong>2012</strong>from 1.05 at December 31, 2011. Total debt at December 31,<strong>2012</strong> increased $711.5 million to $1.70 billion from $993.4million at December 31, 2011 due primarily to the debt issuanceon December 4, <strong>2012</strong>. Total debt increased as a percentage oftotal capitalization to 48.8 percent from 39.6 percent at the end■ 24
MANAGEMENT’S DISCUSSION AND ANALYSIS OFFINANCIAL CONDITION AND RESULTS OF OPERATIONSof 2011. At December 31, <strong>2012</strong>, the Company had remainingborrowing ability of $2.20 billion. Net operating cash increased$152.1 million to $887.9 million in <strong>2012</strong> from $735.8 million in2011 due primarily to an increase in net income of $189.2 millionpartially offset by cash used to decrease Accrued taxes by $70.3million. Net operating cash increased as a percent to sales to 9.3percent in <strong>2012</strong> compared to 8.4 percent in 2011. Strong Net operatingcash provided the funds necessary to invest in new stores,manufacturing and distribution facilities, acquire businesses,and return cash to shareholders through dividends and treasurystock purchases. In <strong>2012</strong>, the Company used Net operating cashto invest $157.1 million in capital additions and improvements,purchase $557.8 million in treasury stock, pay $160.9 million incash dividends to its shareholders of common stock, and invest$99.2 million in acquisitions.Net Working CapitalTotal current assets less Total current liabilities (networking capital) improved $1.17 billion to a surplus of $1.27billion at December 31, <strong>2012</strong> from a surplus of $98.9 million atDecember 31, 2011. The improvement in net working capitalrelated primarily to a significant increase in cash and cashequivalents of $829.9 million and a decrease in current liabilities.Accounts receivable were up $42.6 million while Inventorieswere down $6.5 million. Deferred tax net assets were down $22.5million while the remaining current assets increased $44.1 million.Accounts payable decreased $42.2 million, Accrued taxesdecreased $68.5 million, and Short-term borrowings decreased$277.3 million while all other current liabilities increased $101.7million. The Company has sufficient total available borrowing capacityto fund its current operating needs. The increase in Totalcurrent assets and the decrease in Total current liabilities causedthe Company’s current ratio to improve to 1.68 at December 31,<strong>2012</strong> from 1.05 at December 31, 2011. Accounts receivable as apercent of Net sales decreased to 10.8 percent in <strong>2012</strong> from 11.3percent in 2011 as sales increased more than accounts receivablesdue primarily to a full year of sales for businesses acquiredduring 2011 versus only a partial year with comparable accountsreceivable balances in each period. Accounts receivable daysoutstanding decreased to 55 days in <strong>2012</strong> from 56 days 2011. In<strong>2012</strong>, provisions for allowance for doubtful collection of accountsdecreased $4.1 million, or 7.9 percent. Inventories decreased asa percent of Net sales to 9.7 percent in <strong>2012</strong> from 10.6 percent in2011 due primarily to a full year of sales for businesses acquiredduring 2011 versus only a partial year in 2011 with comparableinventory levels in each period partially offset by rising rawmaterial costs. Inventory days outstanding decreased to 90 daysin <strong>2012</strong> from 96 days in 2011. Accounts payable decreased in<strong>2012</strong> to $923.0 million compared to $965.1 million last year dueprimarily to timing of payments.Goodwill and Intangible AssetsGoodwill, which represents the excess of cost over the fairvalue of net assets acquired in purchase business combinations,increased $48.0 million in <strong>2012</strong> due primarily to $42.1 millionadditional goodwill resulting from acquisitions.Intangible assets increased $41.7 million in <strong>2012</strong>. Acquiredfinite-lived and indefinite-lived intangible assets of $66.5 millionand $3.8 million of capitalized software costs more than offsetamortization of finite-lived intangible assets of $27.0 millionand impairments of indefinite-lived intangible assets of $4.1million. Acquired finite-lived intangible assets included assetssuch as covenants not to compete, customer lists and productformulations. Costs related to designing, developing, obtainingand implementing internal use software are capitalized and amortizedin accordance with the Goodwill and Other IntangiblesTopic of the ASC. See Notes 2 and 4, on pages 51 through53 of this report, for a description of acquired goodwill,identifiable intangible assets and asset impairments recorded inaccordance with the Goodwill and Other Intangibles Topic of theASC and summaries of the remaining carrying values of goodwilland intangible assets.Deferred Pension and Other AssetsDeferred pension assets of $249.9 million at December 31,<strong>2012</strong> represent the excess of the fair value of assets over theactuarially determined projected benefit obligations, primarily ofthe domestic salaried defined benefit pension plan. The increasein Deferred pension assets during <strong>2012</strong> of $21.6 million, from$228.4 million last year, was due primarily to an increase in thefair value of equity securities held by the salaried defined benefitpension plan partially offset by increased projected benefitobligations resulting from changes in actuarial assumptions. Inaccordance with the accounting prescribed by the RetirementBenefits Topic of the ASC, the increase in the value of theDeferred pension assets is offset in Cumulative other comprehensiveloss and is amortized as a component of Net pensioncosts over a defined period of pension service. See Note 6, onpages 56 through 62 of this report, for more informationconcerning the excess fair value of assets over projected benefitobligations of the salaried defined benefit pension plan and theamortization of actuarial gains or losses relating to changes inthe excess assets and other actuarial assumptions.Other assets decreased $2.8 million to $366.1 million atDecember 31, <strong>2012</strong> due primarily to amortization of investmentsrelated to the affordable housing and historic renovation realestate properties.Property, Plant and EquipmentNet property, plant and equipment increased $9.4 millionto $965.9 million at December 31, <strong>2012</strong> due primarily to capital■ 25
MANAGEMENT’S DISCUSSION AND ANALYSIS OFFINANCIAL CONDITION AND RESULTS OF OPERATIONSexpenditures of $157.1 million, acquired assets of $11.4 millionand currency translation adjustments of $5.2 million partiallyoffset by depreciation expense of $152.2 million and sale ordisposition of assets with remaining net book value of $12.2million. Capital expenditures during <strong>2012</strong> in the Paint StoresGroup were primarily attributable to the opening of new paintstores and improvements in existing stores. In the ConsumerGroup, capital expenditures during <strong>2012</strong> were primarily relatedto efficiency improvements and maintenance items in existingproduction and distribution facilities. Capital expenditures in theGlobal Finishes Group were primarily attributable to improvementsin existing manufacturing and distribution facilities.Capital expenditures in the Latin America Coatings Group wereprimarily attributable to the opening of new specialty stores andimprovements in existing manufacturing and distribution facilities.The Administrative segment incurred capital expendituresprimarily for headquarters building and information systemshardware. In 2013, the Company expects to spend slightly morethan <strong>2012</strong> for capital expenditures. The predominant share ofthe capital expenditures in 2013 is expected to be for variousproductivity improvement and maintenance projects at existingmanufacturing and distribution facilities, new store openings andnew or upgraded information systems hardware. The Companydoes not anticipate the need for any specific long-term externalfinancing to support these capital expenditures.DebtThere were no borrowings outstanding under the domesticcommercial paper program at December 31, <strong>2012</strong>. Borrowingsoutstanding under this program at December 31, 2011 and2010 were $264.9 million and $173.5 million, respectively,with weighted-average interest rates of 0.2 percent for bothyears. Borrowings outstanding under various foreign programsat December 31, <strong>2012</strong> were $69.0 million with a weightedaverageinterest rate of 2.8 percent. At December 31, 2011 andDecember 31, 2010, foreign borrowings were $81.4 million and$215.1 million with weighted-average interest rates of 4.9 percentand 2.9 percent, respectively. Long-term debt, including thecurrent portion, increased a net $988.8 million during <strong>2012</strong> dueprimarily to the Senior Notes debt issuance totaling $1.00 billionon December 4, <strong>2012</strong>, partially offset by regularly scheduledprincipal payments made on short-term debt. The Senior Notesare covered under a shelf registration filed with the Securitiesand Exchange Commission (SEC) on December 16, 2009 . Theproceeds from the issuance of the Senior Notes will be used forgeneral corporate purposes, including repayment of short-termborrowings and financing acquisitions.On July 19, 2010, <strong>Sherwin</strong>-<strong>Williams</strong> Luxembourg S.à r.l.,a wholly-owned subsidiary of the Company, entered into a€200.0 million (Euro) credit facility. On December 28, 2010, theCompany reduced the aggregate amount of this credit facilityto €150.0 million (Euro). During 2011, the aggregate amount ofthis credit facility was further reduced to €97.0 million (Euro).On September 19, <strong>2012</strong>, this credit facility was replaced by anew €95.0 million (Euro) five-year revolving credit facility. OnJuly 19, 2010, <strong>Sherwin</strong>-<strong>Williams</strong> Canada Inc., a wholly-ownedsubsidiary of the Company, entered into a CAD 75.0 millioncredit facility. On June 29, <strong>2012</strong>, this credit facility was replacedby a new CAD 75.0 million five-year credit facility. These creditfacilities are being used for general corporate purposes, includingrefinancing indebtedness and for acquisitions.On January 30, <strong>2012</strong>, the Company entered into a five-yearcredit agreement, subsequently amended on multiple dates,which gives the Company the right to borrow and to obtain theissuance, renewal, extension and increase of a letter of credit ofup to an aggregate availability of $500.0 million. On April 23,<strong>2012</strong>, the Company entered into a five-year credit agreement,subsequently amended on multiple dates, which gives theCompany the right to borrow and to obtain the issuance, renewal,extension and increase of a letter of credit up to an aggregateavailability of $250.0 million. On November 14, <strong>2012</strong>, theCompany entered into a three-year credit agreement, subsequentlyamended on multiple dates, which gives the Companythe right to borrow and to obtain the issuance, renewal, extensionand increase of a letter of credit up to an aggregate availability of$250.0 million. The three credit agreements entered into in <strong>2012</strong>replace prior credit facilities that matured in <strong>2012</strong> and 2011. AtDecember 31, <strong>2012</strong>, 2011 and 2010, there were no borrowingsoutstanding under any of these credit agreements.The Company uses a revolving credit agreement primarily tosatisfy its commercial paper program’s dollar for dollar liquidityrequirement. On January 8, 2010, the Company terminated theexisting $845.0 million revolving credit agreement and enteredinto a new $500.0 million revolving credit agreement. On July 8,2011, the Company entered into a new five-year $1.05 billionrevolving credit agreement, which replaced the existing threeyear$500.0 million credit agreement. The new credit agreementallows the Company to extend the maturity of the facility withtwo one-year extension options and to increase the aggregateamount of the facility to $1.30 billion, both of which are subjectto the discretion of each lender.See Note 7, on pages 62 and 63 of this report, for adetailed description of the Company’s debt outstanding andother available financing programs.Defined Benefit Pension and Other PostretirementBenefit PlansIn accordance with the accounting prescribed by theRetirement Benefits Topic of the ASC, the Company’s total liabilityfor unfunded or underfunded defined benefit pension plans■ 26
MANAGEMENT’S DISCUSSION AND ANALYSIS OFFINANCIAL CONDITION AND RESULTS OF OPERATIONSincreased $7.4 million to $40.0 million. Postretirement benefitsother than pensions increased $21.3 million to $338.1 million atDecember 31, <strong>2012</strong>. The increase in the liability was due to theincrease in the actuarially determined postretirement benefitobligation due primarily to changes in the actuarial assumptionsand unfavorable claims experience and other demographics.Effective July 1, 2009, the domestic salaried defined benefitpension plan was revised. Prior to July 1, 2009, the contributionwas based on six percent of compensation for covered employees.Under the revised plan, such participants are creditedwith certain contribution credits that range from two percentto seven percent of compensation based on an age and serviceformula. Amounts previously recorded in Cumulative othercomprehensive loss in accordance with the provisions of theRetirement Benefits Topic of the ASC were modified in 2009resulting in a decrease in comprehensive loss due primarily tothe change in the domestic salaried defined benefit pension planand an increase in the excess plan assets over the actuariallycalculated projected benefit obligation in the domestic definedbenefit pension plans. Partially offsetting this decreased losswere modifications to actuarial assumptions used to calculateprojected benefit obligations.Effective October 1, 2011, participation in The <strong>Sherwin</strong>-<strong>Williams</strong> Company Salaried Employees’ Pension InvestmentPlan, a defined benefit plan, was frozen for new hires. All newlyhired U.S. non-collectively bargained employees will be eligibleto participate in The <strong>Sherwin</strong>-<strong>Williams</strong> Company SalariedEmployees’ Revised Pension Investment Plan.The assumed discount rate used to determine the actuarialpresent value of projected defined benefit pension and otherpostretirement benefit obligations for domestic plans wasdecreased from 4.40 percent to 3.73 percent at December 31,<strong>2012</strong> due to decreased rates of high-quality, long-term investmentsand was slightly higher for foreign defined benefit pensionplans. The rate of compensation increases used to determine theprojected benefit obligations remained at 4.0 percent for domesticpension plans and was slightly higher on most foreign plans.In deciding on the rate of compensation increases, managementconsidered historical Company increases as well as expectationsfor future increases. The expected long-term rate of return onassets remained at 7.5 percent for <strong>2012</strong> for domestic pensionplans and was slightly lower for most foreign plans. In establishingthe expected long-term rate of return on plan assets for <strong>2012</strong>,management considered the historical rates of return, the natureof investments and an expectation for future investment strategies.The assumed health care cost trend rates used to determinethe net periodic benefit cost of postretirement benefits otherthan pensions for <strong>2012</strong> were 8.0 percent for medical andprescription drug cost increases, both decreasing gradually to 5.0percent in 2019. The assumed health care cost trend rates usedto determine the benefit obligation at December 31, <strong>2012</strong> were8.0 percent for medical and prescription drug cost increases. Indeveloping the assumed health care cost trend rates, managementconsidered industry data, historical Company experienceand expectations for future health care costs.For 2013 Net pension cost and Net periodic benefit cost recognitionfor domestic plans, the Company will use a discount rateof 3.73 percent, an expected long-term rate of return on assets of6.0 percent, a rate of compensation increase of 4.0 percent andcost trend rates of 8.0 percent for health care and prescriptiondrug cost increases. Slightly higher discount rates and rates ofcompensation increases and lower expected long-term rates ofreturn on plan assets will be used for most foreign plans. Use ofthese assumptions, a change in the domestic salaried definedbenefit pension plan, and amortization of actuarial gains willresult in a domestic Net pension cost in 2013 that is expectedto be approximately $2.4 million lower than in <strong>2012</strong> and a Netperiodic benefit cost for postretirement benefits other thanpensions that is expected to increase slightly in 2013 comparedto <strong>2012</strong>. See Note 6, on pages 56 through 62 of this report,for more information on the Company’s obligations and fundedstatus of its defined benefit pension plans and postretirementbenefits other than pensions.Other Long-Term LiabilitiesOther long-term liabilities increased $1.2 million during<strong>2012</strong> due primarily to an increase in accruals for extendedenvironmental-related liabilities of $8.0 million, an increase indeferred compensation liabilities of $5.2 million, an increase inlong-term pension liabilities of $1.6 million, and an increase inlong-term commitments related to the affordable housing andhistoric renovation real estate properties of $2.5 million partiallyoffset by a decrease in non-current deferred tax liabilities of$14.9 million. See below and Note 8, on pages 63 and 64of this report, for further information on environmental-relatedlong-term liabilities.Environmental-Related LiabilitiesThe operations of the Company, like those of other companiesin the same industry, are subject to various federal, state andlocal environmental laws and regulations. These laws and regulationsnot only govern current operations and products, but alsoimpose potential liability on the Company for past operations.Management expects environmental laws and regulations toimpose increasingly stringent requirements upon the Companyand the industry in the future. Management believes that theCompany conducts its operations in compliance with applicableenvironmental laws and regulations and has implemented variousprograms designed to protect the environment and promotecontinued compliance.■ 27
MANAGEMENT’S DISCUSSION AND ANALYSIS OFFINANCIAL CONDITION AND RESULTS OF OPERATIONSDepreciation of capital expenditures and other expensesrelated to ongoing environmental compliance measures were includedin the normal operating expenses of conducting business.The Company’s capital expenditures, depreciation and otherexpenses related to ongoing environmental compliance measureswere not material to the Company’s financial condition, liquidity,cash flow or results of operations during <strong>2012</strong>. Management doesnot expect that such capital expenditures, depreciation and otherexpenses will be material to the Company’s financial condition,liquidity, cash flow or results of operations in 2013.The Company is involved with environmental investigationand remediation activities at some of its currently and formerlyowned sites (including sites which were previously ownedand/or operated by businesses acquired by the Company). Inaddition, the Company, together with other parties, has beendesignated a potentially responsible party under federal andstate environmental protection laws for the investigation andremediation of environmental contamination and hazardouswaste at a number of third-party sites, primarily Superfundsites. In general, these laws provide that potentially responsibleparties may be held jointly and severally liable for investigationand remediation costs regardless of fault. The Company may besimilarly designated with respect to additional third-party sitesin the future.The Company accrues for estimated costs of investigationand remediation activities at its currently or formerly ownedsites and third-party sites for which commitments or clean-upplans have been developed and when such costs can be reasonablyestimated based on industry standards and professionaljudgment. These estimated costs are determined based oncurrently available facts regarding each site. The Companyaccrues a specific estimated amount when such an amountand a time frame in which the costs will be incurred can bereasonably determined. If the best estimate of costs can only beidentified as a range and no specific amount within that rangecan be determined more likely than any other amount within therange, the minimum of the range is accrued by the Company inaccordance with applicable accounting rules and interpretations.The Company continuously assesses its potential liability forinvestigation and remediation activities and adjusts its environmental-relatedaccruals as information becomes availableupon which more accurate costs can be reasonably estimated. AtDecember 31, <strong>2012</strong>, 2011 and 2010, the Company had total currentand long-term accruals for environmental-related activitiesof $114.3 million, $132.1 million and $149.6 million, respectively.Due to the uncertainties of the scope and magnitude ofcontamination and the degree of investigation and remediationactivities that may be necessary at certain currently or formerlyowned sites and third-party sites, it is reasonably likely that furtherextensive investigations may be required and that extensiveremedial actions may be necessary not only on such sites but onadjacent properties. Depending on the extent of the additionalinvestigations and remedial actions necessary, the Company’sultimate liability may result in costs that are significantlyhigher than currently accrued. If the Company’s future losscontingency is ultimately determined to be at the maximum ofthe range of possible outcomes for every site for which costs canbe reasonably estimated, the Company’s aggregate accruals forenvironmental-related activities would be $88.7 million higherthan the accruals at December 31, <strong>2012</strong>.Two of the Company’s formerly owned sites, described below,account for the majority of the accruals for environmentalrelatedactivities and the unaccrued maximum of the estimatedrange of possible outcomes at December 31, <strong>2012</strong>, 2011 and2010. At December 31, <strong>2012</strong>, $59.1 million, or 51.7 percent, of thetotal accrual for environmental-related activities related directlyto these two sites. Of the aggregate unaccrued exposure atDecember 31, <strong>2012</strong>, $57.0 million, or 64.2 percent, related to thetwo manufacturing sites. While environmental investigations andremedial actions are in different stages at these sites, additionalinvestigations, remedial actions and/or monitoring will likely berequired at each site.Both of the sites are formerly owned manufacturing facilitiesin New Jersey that are in various stages of the environmentalrelatedprocess. At the first site, extensive soil remediation wasconducted on-site and completed in 2010 under an agencyapproved work plan. A small portion of soil remediation remainsto be conducted on-site as well as some additional determinationof possible off-site soil impacts. Investigation of the areagroundwater continues to determine the degree and extent ofcontamination, both on-site and off-site. Although contaminationdetermined to be associated with historical operations of theCompany exists at the second site and adjacent areas, the extentand magnitude of the contamination has not yet been fully quantified,a final remedial action plan has not yet been formulated orno clean up goals have been approved by the lead governmentalagency. It is reasonably likely that further extensive investigationsmay be required or that extensive remedial actions may benecessary at this formerly owned site, in adjacent areas or alongadjacent waterways. At both sites, depending on the extent ofthe additional remedial actions necessary, the ultimate liabilityfor these sites may exceed the amounts currently accrued andthe maximum of the ranges of reasonably possible outcomescurrently estimated by management.Management cannot presently estimate the ultimatepotential loss contingencies related to these two sites or otherless significant sites until such time as a substantial portion ofthe investigative activities at each site is completed and remedialaction plans are developed.■ 28
MANAGEMENT’S DISCUSSION AND ANALYSIS OFFINANCIAL CONDITION AND RESULTS OF OPERATIONSIn accordance with the Asset Retirement and EnvironmentalObligations Topic of the ASC, the Company has identifiedcertain conditional asset retirement obligations at variouscurrent manufacturing, distribution and store facilities. Theseobligations relate primarily to asbestos abatement and closuresof hazardous waste containment devices. Using investigative,remediation and disposal methods that are currently availableto the Company, the estimated cost of these obligations is notsignificant.In the event any future loss contingency significantly exceedsthe current amount accrued, the recording of the ultimate liabilitymay result in a material impact on net income for the annualor interim period during which the additional costs are accrued.Management does not believe that any potential liability ultimatelyattributed to the Company for its environmental-relatedmatters or conditional asset retirement obligations will have amaterial adverse effect on the Company’s financial condition,liquidity, or cash flow due to the extended period of time duringwhich environmental investigation and remediation takes place.An estimate of the potential impact on the Company’s operationscannot be made due to the aforementioned uncertainties.Management expects these contingent environmentalrelatedliabilities and conditional asset retirement obligationsto be resolved over an extended period of time. Management isunable to provide a more specific time frame due to the indefiniteamount of time to conduct investigation activities at any site, theindefinite amount of time to obtain governmental agency approval,as necessary, with respect to investigation and remediationactivities, and the indefinite amount of time necessary toconduct remediation activities.Contractual Obligations and Commercial CommitmentsThe Company has certain obligations and commitmentsto make future payments under contractual obligations andcommercial commitments. The following table summarizes suchobligations and commitments as of December 31, <strong>2012</strong>:(thousands of dollars)Payments Due by PeriodContractual ObligationsTotalLess than1 Year 1–3 Years 3–5 Years More than 5 YearsLong-term debt ............................................................. $ 1,638,403 $ 3,689 $ 500,813 $ 700,295 $ 433,606Operating leases ............................................................ 1,108,523 242,360 419,092 255,227 191,844Short-term borrowings ............................................... 69,035 69,035Interest on Long-term debt ....................................... 602,524 47,677 78,159 62,511 414,177Purchase obligations (a) ............................................... 132,235 132,235Other contractual obligations (b) .............................. 386,797 172,613 91,790 48,966 73,428Total contractual cash obligations .......................... $ 3,937,517 $ 667,609 $ 1,089,854 $ 1,066,999 $ 1,113,055(a) Relate to open purchase orders for raw materials at December 31, <strong>2012</strong>.(b) Relate primarily to the DOL Settlement, estimated future capital contributions to investments in the U.S. affordable housing and historic renovation real estatepartnerships and various other contractual obligations.Amount of Commitment Expiration Per PeriodCommercial CommitmentsTotalLess than1 Year 1–3 Years 3–5 YearsMore than5 YearsStandby letters of credit ............................................. $ 22,845 $ 22,845Surety bonds ................................................................... 34,630 34,630Other commercial commitments ............................ 56,052 56,052Total commercial commitments .............................. $ 113,527 $ 113,527 $ — $ — $ —WarrantiesThe Company offers product warranties for certain products.The specific terms and conditions of such warranties varydepending on the product or customer contract requirements.Management estimated the costs of unsettled product warrantyclaims based on historical results and experience. Managementperiodically assesses the adequacy of the accrual for productwarranty claims and adjusts the accrual as necessary. Changesin the Company’s accrual for product warranty claims during<strong>2012</strong>, 2011 and 2010, including customer satisfaction settlementsduring the year, were as follows:(thousands of dollars) <strong>2012</strong> 2011 2010Balance at January 1 ............. $ 22,071 $ 23,103 $ 22,214Charges to expense ............... 28,590 29,957 23,092Settlements .............................. (27,951) (30,989) (22,203)Balance at December 31 ...... $ 22,710 $ 22,071 $ 23,103Shareholders’ EquityShareholders’ equity increased $274.9 million to $1.79billion at December 31, <strong>2012</strong> from $1.52 billion last year. Theincrease in Shareholders’ equity resulted primarily from anincrease in retained earnings of $470.1 million and an increasein Other capital of $376.2 million, due primarily to stockoptions exercised, partially offset by the purchase of treasury■ 29
MANAGEMENT’S DISCUSSION AND ANALYSIS OFFINANCIAL CONDITION AND RESULTS OF OPERATIONSstock for $557.8 million and an increase in Cumulative othercomprehensive loss of $2.5 million. The Company purchased4.60 million shares of its common stock during <strong>2012</strong> fortreasury. The Company acquires its common stock for generalcorporate purposes and, depending on its cash position andmarket conditions, it may acquire additional shares in the future.The Company had remaining authorization from its Board ofDirectors at December 31, <strong>2012</strong> to purchase 16.45 million sharesof its common stock. The increase of $2.5 million in Cumulativeother comprehensive loss was due primarily to unfavorableforeign currency translation effects of $7.4 million attributable tothe weakening of most foreign operations’ functional currenciesagainst the U.S. dollar and the recognition, net of taxes, of $4.8million in net actuarial gains and prior service costs of definedbenefit pension and other postretirement benefit plans.The increase in Other capital of $376.2 million was dueprimarily to the recognition of stock-based compensationexpense, stock option exercises and related income tax effect.In <strong>2012</strong>, redemptions of Preferred stock and Unearned ESOPcompensation of $59.2 million occurred. Retained earnings increased$470.1 million during <strong>2012</strong> due to net income of $631.0million partially offset by $160.9 million in cash dividends paid.The Company’s cash dividend per common share payout target is30.0 percent of the prior year’s diluted net income per commonshare. The <strong>2012</strong> annual cash dividend of $1.56 per commonshare represented 37.7 percent of 2011 diluted net income percommon share. The <strong>2012</strong> annual dividend represented the thirtyfourthconsecutive year of dividend payments since the dividendwas suspended in 1978. At a meeting held on February 13, 2013,the Board of Directors increased the quarterly cash dividend to$.50 per common share. This quarterly dividend, if approvedin each of the remaining quarters of 2013, would result in anannual dividend for 2013 of $2.00 per common share or a 33.2percent payout of <strong>2012</strong> diluted net income per common share.See the Statements of Consolidated Shareholders’ Equity onpage 47 of this report, and Notes 10, 11 and 12, on pages 67through 70 of this report, for more information concerningShareholders’ equity.Cash FlowNet operating cash increased $152.1 million to $887.9 millionin <strong>2012</strong>, which included a first quarter IRS Settlement paymentof $59.1 million, from $735.8 million in 2011, which included afourth quarter IRS Settlement payment of $60.0 million, dueprimarily to an increase in net income of $189.2 million partiallyoffset by an increase in working capital of $5.0 million. Netoperating cash provided the funds necessary to support theCompany’s acquisitions, sustain its remaining manufacturingand distribution capabilities, maintain its financial stabilityand return a portion of the cash generated to its shareholdersthrough dividends and treasury stock purchases. Net investingcash decreased $64.7 million to a usage of $342.5 million in <strong>2012</strong>from a usage of $277.8 million in 2011 due primarily to increasedcash usage to acquired businesses. Net financing cash increased$761.8 million to a source of $286.6 million in <strong>2012</strong> from a usageof $475.2 million in 2011 due primarily to increased proceedsfrom total net debt activity of $753.3 million and increasedproceeds from stock option exercises and income tax effect ofstock-based compensation exercises and vesting totaling $243.5million partially offset by increased treasury stock purchases of$190.4 million. In <strong>2012</strong>, the Company used Net operating cashto invest $99.2 million in acquisitions, spend $157.1 million incapital additions and improvements, purchase $557.8 million intreasury stock, and pay $160.9 million in cash dividends to itsshareholders of common stock.Management considers a measurement of cash flow thatis not in accordance with U.S. generally accepted accountingprinciples to be a useful tool in its determination of appropriateuses of the Company’s Net operating cash. Management reducesNet operating cash, as shown in the Statements of ConsolidatedCash Flows, by the amount reinvested in the business for Capitalexpenditures and the return of investment to its shareholders bythe payments of cash dividends. The resulting value is referredto by management as “Free Cash Flow” which may not becomparable to values considered by other entities using the sameterminology. The reader is cautioned that the Free Cash Flowmeasure should not be compared to other entities unknowingly,and it does not consider certain non-discretionary cash flows,such as mandatory debt and interest payments. The amountshown below should not be considered an alternative to Net operatingcash or other cash flow amounts provided in accordancewith U.S. generally accepted accounting principles disclosed inthe Statements of Consolidated Cash Flows, on page 46 ofthis report. Free Cash Flow as defined and used by managementis determined as follows:Year Ended December 31,(thousands of dollars) <strong>2012</strong> 2011 2010Net operating cash ...... $ 887,886 $ 735,812 $ 706,590Capital expenditures .. (157,112) (153,801) (125,162)Cash dividends ............ (160,939) (153,512) (156,424)Free cash flow ............... $ 569,835 $ 428,499 $ 425,004Contingent LiabilitiesLife Shield Engineered Systems, LLC (Life Shield) is awholly owned subsidiary of the Company, which ceased operationsin <strong>2012</strong>. Life Shield developed and manufactured blast andfragment mitigating systems. The blast and fragment mitigatingsystems create a potentially higher level of product liability forthe Company (as an owner of and supplier to Life Shield) than isnormally associated with coatings and related products currentlymanufactured, distributed and sold by the Company.■ 30
MANAGEMENT’S DISCUSSION AND ANALYSIS OFFINANCIAL CONDITION AND RESULTS OF OPERATIONSCertain of Life Shield’s technology has been designated asQualified Anti-Terrorism Technology and granted a Designationunder the Support Anti-terrorism by Fostering EffectiveTechnologies Act of 2002 (SAFETY Act) and the regulationsadopted pursuant to the SAFETY Act. Under the SAFETY Act,the potentially higher level of possible product liability for LifeShield relating to the technology granted the Designation is limitedto $6.0 million per occurrence in the event any such liabilityarises from an Act of Terrorism (as defined in the SAFETY Act).The limitation of liability provided for under the SAFETY Actdoes not apply to any technology not granted a designation orcertification as a Qualified Anti-Terrorism Technology, nor inthe event that any such liability arises from an act or event otherthan an Act of Terrorism. Life Shield maintains insurance forliabilities up to the $6.0 million per occurrence limitation causedby failure of its products in the event of an Act of Terrorism.Management of the Company has reviewed the potentialincreased liabilities associated with Life Shield’s systems anddetermined that potential liabilities arising from an Act ofTerrorism that could ultimately affect the Company will beappropriately insured or limited by current regulations. However,due to the uncertainties involved in the future development,usage and application of Life Shield’s systems, the number ornature of possible future claims and legal proceedings, or theeffect that any change in legislation and/or administrativeregulations may have on the limitations of potential liabilities,management cannot reasonably determine the scope or amountof any potential costs and liabilities for the Company related toLife Shield or to Life Shield’s systems. Any potential liability forthe Company that may result from Life Shield or Life Shield’ssystems cannot reasonably be estimated. However, based upon,among other things, the limitation of liability under the SAFETYAct in the event of an Act of Terrorism, management does notcurrently believe that the costs or potential liability ultimatelydetermined to be attributable to the Company through itsownership of Life Shield or as a supplier to Life Shield arisingfrom the use of Life Shield’s systems will have a material adverseeffect on the Company’s results of operations, liquidity orfinancial conditions.LitigationIn the course of its business, the Company is subject to avariety of claims and lawsuits, including, but not limited to, litigationrelating to product liability and warranty, personal injury,environmental, intellectual property, commercial, contractualand antitrust claims that are inherently subject to many uncertaintiesregarding the possibility of a loss to the Company. Theseuncertainties will ultimately be resolved when one or morefuture events occur or fail to occur confirming the incurrence ofa liability or the reduction of a liability. In accordance with theContingencies Topic of the ASC, the Company accrues for thesecontingencies by a charge to income when it is both probablethat one or more future events will occur confirming the fact ofa loss and the amount of the loss can be reasonably estimated.In the event that the Company’s loss contingency is ultimatelydetermined to be significantly higher than currently accrued,the recording of the additional liability may result in a materialimpact on the Company’s results of operations, liquidity orfinancial condition for the annual or interim period during whichsuch additional liability is accrued. In those cases where noaccrual is recorded because it is not probable that a liability hasbeen incurred and the amount of any such loss cannot be reasonablyestimated, any potential liability ultimately determined to beattributable to the Company may result in a material impact onthe Company’s results of operations, liquidity or financial conditionfor the annual or interim period during which such liability isaccrued. In those cases where no accrual is recorded or exposureto loss exists in excess of the amount accrued, the ContingenciesTopic of the ASC requires disclosure of the contingency whenthere is a reasonable possibility that a loss or additional loss mayhave been incurred.Lead pigment and lead-based paint litigation. TheCompany’s past operations included the manufacture and saleof lead pigments and lead-based paints. The Company, alongwith other companies, is and has been a defendant in a numberof legal proceedings, including individual personal injuryactions, purported class actions, and actions brought by variouscounties, cities, school districts and other government-relatedentities, arising from the manufacture and sale of lead pigmentsand lead-based paints. The plaintiffs’ claims have been basedupon various legal theories, including negligence, strict liability,breach of warranty, negligent misrepresentations and omissions,fraudulent misrepresentations and omissions, concert of action,civil conspiracy, violations of unfair trade practice and consumerprotection laws, enterprise liability, market share liability, publicnuisance, unjust enrichment and other theories. The plaintiffsseek various damages and relief, including personal injury andproperty damage, costs relating to the detection and abatementof lead-based paint from buildings, costs associated with a publiceducation campaign, medical monitoring costs and others. TheCompany is also a defendant in legal proceedings arising fromthe manufacture and sale of non-lead-based paints that seekrecovery based upon various legal theories, including the failureto adequately warn of potential exposure to lead during surfacepreparation when using non-lead-based paint on surfaces previouslypainted with lead-based paint. The Company believes thatthe litigation brought to date is without merit or subject to meritoriousdefenses and is vigorously defending such litigation. TheCompany has not settled any lead pigment or lead-based paintlitigation. The Company expects that additional lead pigment■ 31
MANAGEMENT’S DISCUSSION AND ANALYSIS OFFINANCIAL CONDITION AND RESULTS OF OPERATIONSand lead-based paint litigation may be filed against the Companyin the future asserting similar or different legal theories and seekingsimilar or different types of damages and relief.Notwithstanding the Company’s views on the merits,litigation is inherently subject to many uncertainties, and theCompany ultimately may not prevail. Adverse court rulings ordeterminations of liability, among other factors, could affectthe lead pigment and lead-based paint litigation against theCompany and encourage an increase in the number and natureof future claims and proceedings. In addition, from time to time,various legislation and administrative regulations have beenenacted, promulgated or proposed to impose obligations on presentand former manufacturers of lead pigments and lead-basedpaints respecting asserted health concerns associated with suchproducts or to overturn the effect of court decisions in which theCompany and other manufacturers have been successful.Due to the uncertainties involved, management is unableto predict the outcome of the lead pigment and lead-basedpaint litigation, the number or nature of possible future claimsand proceedings, or the effect that any legislation and/oradministrative regulations may have on the litigation or againstthe Company. In addition, management cannot reasonablydetermine the scope or amount of the potential costs andliabilities related to such litigation, or resulting from any suchlegislation and regulations. The Company has not accrued anyamounts for such litigation. With respect to such litigation,including the public nuisance litigation, the Company does notbelieve that it is probable that a loss has occurred, and it is notpossible to estimate the range of potential losses as there is noprior history of a loss of this nature and there is no substantiveinformation upon which an estimate could be based. In addition,any potential liability that may result from any changes tolegislation and regulations cannot reasonably be estimated. Inthe event any significant liability is determined to be attributableto the Company relating to such litigation, the recordingof the liability may result in a material impact on net incomefor the annual or interim period during which such liability isaccrued. Additionally, due to the uncertainties associated withthe amount of any such liability and/or the nature of any otherremedy which may be imposed in such litigation, any potentialliability determined to be attributable to the Company arisingout of such litigation may have a material adverse effect on theCompany’s results of operations, liquidity or financial condition.An estimate of the potential impact on the Company’s results ofoperations, liquidity or financial condition cannot be made due tothe aforementioned uncertainties.Public nuisance claim litigation. The Company and othercompanies are or were defendants in legal proceedings seekingrecovery based on public nuisance liability theories, among othertheories, brought by the State of Rhode Island, the City of St.Louis, Missouri, various cities and counties in the State of NewJersey, various cities in the State of Ohio and the State of Ohio,the City of Chicago, Illinois, the City of Milwaukee, Wisconsinand the County of Santa Clara, California and other publicentities in the State of California. Except for the Santa ClaraCounty, California proceeding, all of these legal proceedings havebeen concluded in favor of the Company and other defendants atvarious stages in the proceedings.The proceedings initiated by the State of Rhode Islandincluded two jury trials. At the conclusion of the second trial, thejury returned a verdict finding that (i) the cumulative presenceof lead pigment in paints and coatings on buildings in the Stateof Rhode Island constitutes a public nuisance, (ii) the Company,along with two other defendants, caused or substantiallycontributed to the creation of the public nuisance, and (iii) theCompany and two other defendants should be ordered to abatethe public nuisance. The Company and two other defendantsappealed and, on July 1, 2008, the Rhode Island Supreme Court,among other determinations, reversed the judgment of abatementwith respect to the Company and two other defendants.The Rhode Island Supreme Court’s decision reversed the publicnuisance liability judgment against the Company on the basisthat the complaint failed to state a public nuisance claim as amatter of law.The Santa Clara County, California proceeding was initiatedin March 2000 in the Superior Court of the State of California,County of Santa Clara. In the original complaint, the plaintiffsasserted various claims including fraud and concealment, strictproduct liability/failure to warn, strict product liability/designdefect, negligence, negligent breach of a special duty, public nuisance,private nuisance, and violations of California’s Businessand Professions Code. A number of the asserted claims wereresolved in favor of the defendants through pre-trial proceedings.The named plaintiffs in the Fourth Amended Complaint, filedon March 16, 2011, are the Counties of Santa Clara, Alameda,Los Angeles, Monterey, San Mateo, Solano and Ventura, andthe Cities of Oakland, San Diego and San Francisco. The FourthAmended Complaint asserts a sole claim for public nuisance,alleging that the presence of lead products for use in paint andcoatings in, on and around buildings in the plaintiffs’ jurisdictionsconstitutes a public nuisance. The plaintiffs seek the abatementof the alleged public nuisance that exists within the plaintiffs’jurisdictions. A trial is currently scheduled to begin in June 2013.Litigation seeking damages from alleged personalinjury. The Company and other companies are defendants ina number of legal proceedings seeking monetary damages andother relief from alleged personal injuries. These proceedingsinclude claims by children allegedly injured from ingestionof lead pigment or lead-containing paint, claims for damagesallegedly incurred by the children’s parents or guardians, and■ 32
MANAGEMENT’S DISCUSSION AND ANALYSIS OFFINANCIAL CONDITION AND RESULTS OF OPERATIONSclaims for damages allegedly incurred by professional paintingcontractors. These proceedings generally seek compensatoryand punitive damages, and seek other relief including medicalmonitoring costs. These proceedings include purported claimsby individuals, groups of individuals and class actions.The plaintiff in Thomas v. Lead Industries Association,et al., initiated an action in state court against the Company,other alleged former lead pigment manufacturers and the LeadIndustries Association in September 1999. The claims againstthe Company and the other defendants included strict liability,negligence, negligent misrepresentation and omissions, fraudulentmisrepresentation and omissions, concert of action, civilconspiracy and enterprise liability. Implicit within these claimsis the theory of “risk contribution” liability (Wisconsin’s theorywhich is similar to market share liability) due to the plaintiff’s inabilityto identify the manufacturer of any product that allegedlyinjured the plaintiff. The case ultimately proceeded to trial and,on November 5, 2007, the jury returned a defense verdict, findingthat the plaintiff had ingested white lead carbonate, but was notbrain damaged or injured as a result. The plaintiff appealed and,on December 16, 2010, the Wisconsin Court of Appeals affirmedthe final judgment in favor of the Company and other defendants.Wisconsin is the only jurisdiction to date to apply a theory ofliability with respect to alleged personal injury (i.e., risk contribution/marketshare liability) that does not require the plaintiff toidentify the manufacturer of the product that allegedly injuredthe plaintiff in the lead pigment and lead-based paint litigation.Although the risk contribution liability theory was applied duringthe Thomas trial, the constitutionality of this theory as appliedto the lead pigment cases has not been judicially determinedby the Wisconsin state courts. However, in an unrelatedaction filed in the United States District Court for the EasternDistrict of Wisconsin, Gibson v. American Cyanamid, et al., onNovember 15, 2010, the District Court held that Wisconsin’s riskcontribution theory as applied in that case violated the defendants’right to substantive due process and is unconstitutionallyretroactive. The District Court’s decision in Gibson v. AmericanCyanamid, et al., has been appealed by the plaintiff.Insurance coverage litigation. The Company and itsliability insurers, including certain Underwriters at Lloyd’s ofLondon, initiated legal proceedings against each other to primarilydetermine, among other things, whether the costs and liabilitiesassociated with the abatement of lead pigment are coveredunder certain insurance policies issued to the Company. TheCompany’s action, filed on March 3, 2006 in the Common PleasCourt, Cuyahoga County, Ohio, is currently stayed and inactive.The liability insurers’ action, which was filed on February 23,2006 in the Supreme Court of the State of New York, County ofNew York, has been dismissed. An ultimate loss in the insurancecoverage litigation would mean that insurance proceedscould be unavailable under the policies at issue to mitigate anyultimate abatement related costs and liabilities. The Companyhas not recorded any assets related to these insurance policies orotherwise assumed that proceeds from these insurance policieswould be received in estimating any contingent liability accrual.Therefore, an ultimate loss in the insurance coverage litigationwithout a determination of liability against the Company in thelead pigment or lead-based paint litigation will have no impacton the Company’s results of operation, liquidity or financialcondition. As previously stated, however, the Company has notaccrued any amounts for the lead pigment or lead-based paintlitigation and any significant liability ultimately determined to beattributable to the Company relating to such litigation may resultin a material impact on the Company’s results of operations,liquidity or financial condition for the annual or interim periodduring which such liability is accrued.<strong>2012</strong> Subsequent Event - DOL Settlement. On February20, 2013, the Company reached a settlement with the DOL of thepreviously disclosed investigation of transactions related to theESOP that were implemented on August 1, 2006 and August 27,2003. The DOL had notified the Company, certain current andformer directors of the Company and the ESOP trustee of potentialenforcement claims asserting breaches of fiduciary obligations.The DOL sought compensatory and equitable remedies,including monetary damages to the ESOP for alleged losses tothe ESOP relating to third-party valuation of the Company’sconvertible serial preferred stock. The Company believes thatthe DOL’s claims are subject to meritorious defenses, however,the Company’s management and Board of Directors havedecided that it would be in the best interest of the Company andits shareholders to avoid potentially costly litigation and enterinto this settlement to resolve these claims.The Company agreed to resolve all ESOP related claimswith the DOL by making a one-time payment of $80.0 million tothe ESOP and has recorded a $49.2 million after tax charge toearnings. In accordance with U.S. generally accepted accountingprinciples, the Company is required to recognize this subsequentevent in its <strong>2012</strong> fiscal year results since this subsequent eventis related to conditions that existed at the balance sheet dateof December 31, <strong>2012</strong>. The Company’s financial results for thequarter and year ended December 31, <strong>2012</strong>, which were set forthin the Company’s earnings release issued on January 31, 2013and furnished on the Company’s Current <strong>Report</strong> on Form 8-Kdated January 31, 2013, have been revised and furnished on theCompany’s Current <strong>Report</strong> on Form 8-K dated February 20,2013 to reflect this subsequent event. As a result of recordingthis accrual in the Administrative segment, Cost of goods soldincreased $16.0 million and Selling, general and administrativeexpense increased $64.0 million while income tax expensedecreased $30.8 million and diluted net income per common■ 33
MANAGEMENT’S DISCUSSION AND ANALYSIS OFFINANCIAL CONDITION AND RESULTS OF OPERATIONSshare decreased $.47 per share for both the quarter and yearended December 31, <strong>2012</strong>.Market RiskThe Company is exposed to market risk associated withinterest rate, foreign currency and commodity fluctuations. TheCompany occasionally utilizes derivative instruments as partof its overall financial risk management policy, but does not usederivative instruments for speculative or trading purposes. TheCompany entered into foreign currency option and forwardcurrency exchange contracts with maturity dates of less thantwelve months in <strong>2012</strong>, 2011 and 2010, primarily to hedge againstvalue changes in foreign currency. There were no derivativecontracts outstanding at December 31, <strong>2012</strong>, 2011 and 2010.The Company believes it may be exposed to continuing marketrisk from foreign currency exchange rate and commodity pricefluctuations. However, the Company does not expect that foreigncurrency exchange rate and commodity price fluctuations orhedging contract losses will have a material adverse effect onthe Company’s financial condition, results of operations or cashflows. See Notes 1 and 13 on pages 48 and 71 of this report.Financial CovenantCertain borrowings contain a consolidated leverage covenant.The covenant states the Company’s leverage ratio is notto exceed 3.00 to 1.00. In connection with the new credit facilityentered into on July 8, 2011, the leverage ratio was increased to3.25 to 1.00. The leverage ratio is defined as the ratio of total indebtedness(the sum of Short-term borrowings, Current portionof long-term debt, and Long-term debt) at the reporting date toconsolidated “Earnings Before Interest, Taxes, Depreciation, andAmortization” (EBITDA) for the 12-month period ended on thesame date. Refer to the “Results of Operations” caption belowfor a reconciliation of EBITDA to Net income. At December 31,<strong>2012</strong>, the Company was in compliance with the covenant. TheCompany’s Notes, Debentures and revolving credit agreementcontain various default and cross-default provisions. In the eventof default under any one of these arrangements, acceleration ofthe maturity of any one or more of these borrowings may result.See Note 7 on pages 62 and 63 of this report.Employee Stock Ownership Plan (ESOP)Participants in the Company’s ESOP are allowed to contributeup to the lesser of twenty percent of their annual compensationor the maximum dollar amount allowed under the InternalRevenue Code. Prior to July 1, 2009, the Company matched onehundred percent of all contributions up to six percent of eligibleemployee contributions. Effective July 1, 2009, the ESOP wasamended to change the Company match to one hundred percenton the first three percent of eligible employee contributions andfifty percent on the next two percent of eligible contributions.Effective July 1, 2011, the ESOP was amended to reinstate theCompany match to six percent of eligible employee contributions.The Company’s matching contributions to the ESOP chargedto operations were $142.8 million in <strong>2012</strong>, including the $80.0million DOL Settlement, compared to $48.8 million in 2011.The Company can fund the ESOP by redeeming a portion of thePreferred stock held by the ESOP or with cash. At December 31,<strong>2012</strong>, there were 14,616,378 shares of the Company’s commonstock being held by the ESOP, representing 14.2 percent of thetotal number of voting shares outstanding. See Note 11, on pages68 and 69 of this report, for more information concerningthe Company’s ESOP and preferred stock.RESULTS OF OPERATIONS - <strong>2012</strong> vs. 2011Shown below are net sales and segment profit and thepercentage change for the current period by segment for<strong>2012</strong> and 2011:Year Ended December 31,(thousands of dollars) <strong>2012</strong> 2011 ChangeNet Sales:Paint Stores Group ............. $ 5,409,947 $ 4,779,826 13.2%Consumer Group ................ 1,321,887 1,274,281 3.7%Global Finishes Group ...... 1,960,699 1,878,326 4.4%Latin AmericaCoatings Group ............... 836,057 828,451 0.9%Administrative ..................... 5,872 4,815 22.0%Net sales ................................. $ 9,534,462 $ 8,765,699 8.8%Year Ended December 31,(thousands of dollars) <strong>2012</strong> 2011 ChangeIncome BeforeIncome Taxes:Paint Stores Group ............. $ 861,763 $ 645,743 33.5%Consumer Group ................ 216,422 173,654 24.6%Global Finishes Group ...... 147,231 90,271 63.1%Latin AmericaCoatings Group ............... 81,238 75,494 7.6%Administrative ..................... (399,345) (243,614) -63.9%Income beforeincome taxes .................... $ 907,309 $ 741,548 22.4%Consolidated net sales for <strong>2012</strong> increased due primarily tohigher paint sales volume in the Paint Stores Group and sellingprice increases across all <strong>Report</strong>able segments. Two acquisitionscompleted in <strong>2012</strong> and one acquisition completed in 2011 increasedconsolidated net sales 0.9 percent. Unfavorable currencytranslation rate changes decreased <strong>2012</strong> consolidated net sales1.8 percent. Net sales of all consolidated foreign subsidiarieswere up 3.4 percent to $2.05 billion for <strong>2012</strong> versus $1.98 billionfor 2011 due primarily to acquisitions and selling price increases.Unfavorable foreign currency translation rates reduced netsales for all consolidated foreign subsidiaries during <strong>2012</strong> by7.9 percent. Net sales of all operations other than consolidated■ 34
MANAGEMENT’S DISCUSSION AND ANALYSIS OFFINANCIAL CONDITION AND RESULTS OF OPERATIONSforeign subsidiaries were up 10.3 percent to $7.48 billion for <strong>2012</strong>versus $6.78 billion for 2011.Net sales in the Paint Stores Group in <strong>2012</strong> increasedprimarily due to higher paint sales volume and selling priceincreases. Net sales from stores open for more than twelvecalendar months increased 12.5 percent for the full year. During<strong>2012</strong>, the Paint Stores Group opened 81 new stores and closed11 redundant locations for a net increase of 70 stores, increasingthe total number of stores in operation at December 31, <strong>2012</strong> to3,520 in the United States, Canada and the Caribbean. The PaintStores Group’s objective is to expand its store base an averageof three percent each year, primarily through internal growth.Sales of products other than paint increased approximately 10.2percent for the year over 2011. A discussion of changes in volumeversus pricing for sales of products other than paint is not pertinentdue to the wide assortment of general merchandise sold.Net sales of the Consumer Group increased due primarily toselling price increases and acquisitions. Acquisitions increasednet sales 3.2 percent compared to 2011. Sales of aerosols,brushes, rollers, caulk and other paint related products wereall up mid-single digits as compared to 2011. A discussion ofchanges in volume versus pricing for sales of products other thanpaint is not pertinent due to the wide assortment of paint-relatedmerchandise sold. The Consumer Group plans to continueits promotions of new and existing products in 2013 andcontinue expanding its customer base and product assortment atexisting customers.The Global Finishes Group’s net sales in <strong>2012</strong>, when statedin U.S. dollars, increased due primarily to selling price increases,higher paint sales volume, and acquisitions partially offset byunfavorable currency translation rate changes. Acquisitionsincreased this Group’s net sales in U.S. dollars by 1.8 percent.Paint sales volume percentage, excluding acquisitions, increasedin the low-single digits. Unfavorable currency translation ratechanges in the year decreased net sales by 3.5 percent for <strong>2012</strong>.In <strong>2012</strong>, the Global Finishes Group opened 1 new branch andclosed 2 locations for a net decrease of 1 branch decreasing thetotal to 302 branches open in the United States, Canada, Mexico,South America, Europe and Asia at year-end. In 2013, the GlobalFinishes Group expects to continue expanding its worldwidepresence and improving its customer base.The Latin America Coatings Group’s net sales in <strong>2012</strong>,when stated in U.S. dollars, increased due primarily to sellingprice increases and higher paint sales volume partially offset byunfavorable currency translation rate changes. Paint sales volumepercentage increased in the low-single digits. Unfavorablecurrency translation rate changes in the year decreased net salesby 10.2 percent for <strong>2012</strong>. In <strong>2012</strong>, the Latin America CoatingsGroup opened 17 new stores and closed 6 locations for a netincrease of 11 stores increasing the total to 276 stores openin North and South America at year-end. In 2013, the LatinAmerica Coatings Group expects to continue expanding itsregional presence and improving its customer base.Net sales in the Administrative segment, which primarilyconsist of external leasing revenue of excess headquarters spaceand leasing of facilities no longer used by the Company in itsprimary business, increased by an insignificant amount in <strong>2012</strong>.Consolidated gross profit increased $461.7 million in <strong>2012</strong>and improved as a percent to net sales to 44.1 percent from42.7 percent in 2011 due primarily to higher paint sales volumeand selling price increases partially offset by increases in rawmaterial costs and unfavorable currency translation rate changes.The Paint Stores Group’s gross profit for <strong>2012</strong> increased $370.2million compared to 2011 and increased as a percent of sales dueprimarily to higher paint sales volume and selling price increasespartially offset by increases in raw material costs. The ConsumerGroup’s gross profit increased $62.5 million and increased asa percent of sales for <strong>2012</strong> over 2011 due primarily to sellingprice increases and improved operating efficiencies partiallyoffset by increases in raw material costs. Acquisitions increasedConsumer Group’s gross profits by $8.7 million, or 21.5 percentof acquisition net sales. The Global Finishes Group’s gross profitfor <strong>2012</strong> increased $52.3 million and increased as a percent ofsales due primarily to selling price increases and higher paintsales volume partially offset by increases in raw material costsand unfavorable currency translation rate changes. Acquisitionsincreased Global Finishes Group’s gross profit by $8.2 million, or23.7 percent of acquisition net sales, and foreign currency translationrate fluctuations decreased gross profit by $19.1 millionfor <strong>2012</strong>. The Latin America Coatings Group’s gross profit for<strong>2012</strong> decreased $2.3 million and decreased slightly as a percentof sales. Selling price increases and improved sales volumes werenot enough to offset higher raw material costs and unfavorablecurrency translation rate changes which reduced gross profitdollars. Foreign currency translation rate fluctuations decreasedgross profit by $26.6 million for <strong>2012</strong>. The Administrativesegment’s gross profit decreased by $21.0 million due primarilyto the DOL Settlement.SG&A increased by $298.8 million due primarily to increasedexpenses to support higher sales levels in all <strong>Report</strong>ableSegments, the DOL Settlement and acquisitions. Acquisitionsadded $16.3 million of SG&A in <strong>2012</strong>, representing 21.6 percentof acquisition net sales. SG&A increased as a percent of salesto 34.2 percent in <strong>2012</strong> from 33.8 percent in 2011. In the PaintStores Group, SG&A increased $153.7 million for the year dueprimarily to increased spending due to the number of new storeopenings and increased expenses to maintain customer service.The Consumer Group’s SG&A increased by $23.6 million forthe year due to increased sales levels and acquisitions SG&A of$7.1 million, or 17.6 percent of acquisition net sales. The Global■ 35
MANAGEMENT’S DISCUSSION AND ANALYSIS OFFINANCIAL CONDITION AND RESULTS OF OPERATIONSFinishes Group’s SG&A increased by $2.1 million for the yearrelating primarily to increased sales levels and acquisitionsSG&A of $9.2 million, or 26.4 percent of acquisition net sales,partially offset by foreign currency translation rate fluctuationsreducing SG&A by $15.9 million. The Latin America CoatingsGroup’s SG&A decreased by $2.4 million for the year relatingprimarily to foreign currency translation rate fluctuations of$17.5 million partially offset by increased expenses to supporthigher sales volume levels. The Administrative segment’s SG&Aincreased $121.9 million primarily due to an increase in incentivecompensation, including stock-based compensation expense,the DOL Settlement and information systems costs to integrateprevious years acquisitions. See Note 12, on pages 69 and70 of this report, for more information concerning stockbasedcompensation.Other general expense - net increased $2.5 million in <strong>2012</strong>compared to 2011. The increase was mainly caused by an increaseof $6.7 million of expense in the Administrative segment,primarily due to loss on sale or disposal of assets of $3.5 millionin <strong>2012</strong> versus a gain on sale of assets of $5.5 million in 2011.Partially offsetting this unfavorable comparison was a decreasein provisions for environmental matters of $2.4 million in theAdministrative segment. In addition, Other general expense- net in the Consumer Group had higher income adjustmentsassociated with prior exit or disposal activities of $3.1 million ascompared to 2011, while insignificant changes occurred in Othergeneral expense - net of the remaining <strong>Report</strong>able Segments.See Note 13, on page 71 of this report, for more informationconcerning Other general expense - net.Impairments of trademarks decreased $1.4 million in <strong>2012</strong>compared to 2011. As required by the Goodwill and OtherIntangibles Topic of the ASC, management performed an annualimpairment test of goodwill and indefinite-lived intangible assetsas of October 1, <strong>2012</strong>. The impairment test in <strong>2012</strong> and 2011resulted in no impairment of goodwill and an impairment of $4.1million and $5.5 million, respectively, of several indefinite-livedtrademarks primarily in the Paint Stores Group for both years asa result of planned conversion of various acquired brands. Theremaining book values of these trademarks are now being amortizedover their estimated future lives. The impairment chargesare shown as a separate line in the Statements of consolidatedincome in accordance with the Goodwill and Other IntangiblesTopic of the ASC. See Note 4, on pages 52 and 53 of thisreport, for more information concerning the impairment ofintangible assets.Interest expense, included in the Administrative segment,increased $0.3 million in <strong>2012</strong> versus 2011 due primarily tohigher average debt levels.Other income - net increased to $9.9 million income from$4.8 million income in 2011. This was primarily due to foreigncurrency related transaction gains of $3.1 million in <strong>2012</strong> versusforeign currency related transaction losses of $4.7 millionin 2011, primarily in the Global Finishes and Latin AmericaCoatings Groups. See Note 13, on page 71 of this report, formore information concerning Other income - net.Consolidated Income before income taxes in <strong>2012</strong> increased$165.8 million due primarily to an increase of $461.7 million ingross profit and a reduction of $1.5 million in interest expense,interest and net investment income and other expenses, partiallyoffset by an increase of $298.8 million in SG&A. Income beforeincome taxes increased $216.0 million in the Paint Stores Group,$57.0 million in the Global Finishes Group, $42.8 million in theConsumer Group and $5.7 million in the Latin America CoatingsGroup when compared to 2011. The Administrative segment hada unfavorable impact on Income before income taxes of $155.7million when compared to 2011. Segment profit of all consolidatedforeign subsidiaries increased 29.4 percent to $158.4 millionfor <strong>2012</strong> versus $122.4 million for 2011 due primarily to increasesin gross profit of $8.0 million and Other income - net of $43.0million partially offset by an increase in SG&A of $13.3 million.Favorable foreign currency translation rates, partially offset byacquisitions, decreased segment profit of all consolidated foreignsubsidiaries by 14.0 percent. Segment profit of all operationsother than consolidated foreign subsidiaries increased 21.0percent to $748.9 million for <strong>2012</strong> versus $619.1 million for 2011.Net income increased $189.2 million in <strong>2012</strong> due to theincrease in Income before income taxes.The effective income tax rate for <strong>2012</strong> was 30.4 percent. Theeffective income tax rate for 2011 was 40.4 percent, includingincome tax expense of $75.0 million relating to the IRSSettlement. Excluding the impact of the IRS Settlement wouldresult in an effective income tax rate for 2011 of 30.3 percent.Diluted net income per common share increased 45.4 percent to$6.02 per share for <strong>2012</strong>, which included charges relating to theDOL Settlement ($.47 per share), from $4.14 per share a yearago, which included charges relating to the IRS Settlement ($.70per share) and dilution from acquisitions ($.04 per share).Management considers a measurement that is not in accordancewith U.S. generally accepted accounting principles a usefulmeasurement of the operational profitability of the Company.Some investment professionals also utilize such a measurementas an indicator of the value of profits and cash that are generatedstrictly from operating activities, putting aside working capitaland certain other balance sheet changes. For this measurement,management increases Net income for significant non-operatingand non-cash expense items to arrive at an amount known asEBITDA. The reader is cautioned that the following value forEBITDA should not be compared to other entities unknowingly.EBITDA should not be considered an alternative to Net incomeor Net operating cash as an indicator of operating performance■ 36
MANAGEMENT’S DISCUSSION AND ANALYSIS OFFINANCIAL CONDITION AND RESULTS OF OPERATIONSor as a measure of liquidity. The reader should refer to the determinationof Net income and Net operating cash in accordancewith U.S. generally accepted accounting principles disclosedin the Statements of Consolidated Income and Statements ofConsolidated Cash Flows, on pages 44 and 46 of thisreport. EBITDA as used by management is calculated as follows:Year Ended December 31,(thousands of dollars) <strong>2012</strong> 2011 2010Net income ................ $ 631,034 $ 441,860 $ 462,485Interest expense ...... 42,788 42,497 70,595Income taxes ............ 276,275 299,688 215,299Depreciation ............. 152,217 151,212 140,347Amortization ............ 26,985 29,692 34,964EBITDA .................... $ 1,129,299 $ 964,949 $ 923,690RESULTS OF OPERATIONS - 2011 vs. 2010Shown below are net sales and segment profit and thepercentage change for the current period by segment for2011 and 2010:Year Ended December 31,(thousands of dollars) 2011 2010 ChangeNet Sales:Paint Stores Group ............. $ 4,779,826 $ 4,381,238 9.1%Consumer Group ................ 1,274,281 1,297,731 -1.8%Global Finishes Group ...... 1,878,326 1,417,142 32.5%Latin AmericaCoatings Group ............... 828,451 675,175 22.7%Administrative ..................... 4,815 5,138 -6.3%Net sales ................................. $ 8,765,699 $ 7,776,424 12.7%Year Ended December 31,(thousands of dollars) 2011 2010 ChangeIncome BeforeIncome Taxes:Paint Stores Group ............. $ 645,743 $ 619,578 4.2%Consumer Group ................ 173,654 203,974 -14.9%Global Finishes Group ...... 90,271 64,675 39.6%Latin AmericaCoatings Group ............... 75,494 59,005 27.9%Administrative ..................... (243,614) (269,448) 9.6%Income beforeincome taxes .................... $ 741,548 $ 677,784 9.4%Consolidated net sales for 2011 increased due primarily toselling price increases, acquisitions, and higher paint sales volumein the Global Finishes and Latin America Coatings Groups. Oneacquisition completed in 2011 and three acquisitions completedthroughout 2010 increased consolidated net sales 4.5 percent.Favorable currency translation rate changes increased 2011consolidated net sales 0.7 percent. Net sales of all consolidatedforeign subsidiaries were up 35.1 percent to $1.98 billion for2011 versus $1.47 billion for 2010 due primarily to acquisitionsand selling price increases. Of the increase in net sales for allconsolidated foreign subsidiaries during 2011, 2.7 percent relatedto favorable foreign currency translation rates. Net sales of alloperations other than consolidated foreign subsidiaries were up7.5 percent to $6.78 billion for 2011 versus $6.31 billion for 2010.Net sales in the Paint Stores Group in 2011 increasedprimarily due to selling price increases and improving domesticarchitectural paint sales. Net sales from stores open for morethan twelve calendar months increased 8.3 percent for thefull year. During 2011, the Paint Stores Group opened 66 newstores and closed 6 redundant locations for a net increase of60 stores, increasing the total number of stores in operation atDecember 31, 2011 to 3,450 in the United States, Canada andthe Caribbean. The Paint Stores Group’s objective is to expandits store base an average of three percent each year, primarilythrough internal growth. Selling price increases throughout theyear drove the increase in sales as paint sales volume was upslightly for the year as compared to 2010. Sales of products otherthan paint increased approximately 7.1 percent for the year over2010. A discussion of changes in volume versus pricing for salesof products other than paint is not pertinent due to the wideassortment of general merchandise sold.Net sales of the Consumer Group decreased due primarilyto the elimination of a portion of a paint program at a large retailcustomer partially offset by selling price increases. Excludingthe impact of the elimination of a portion of this paint program,paint volume sales percentage change in the Consumer Groupcompared to last year increased slightly. Sales of aerosols,brushes, rollers, caulk and other paint related products wereessentially flat as compared to 2010. A discussion of changesin volume versus pricing for sales of products other than paintis not pertinent due to the wide assortment of paint-relatedmerchandise sold. The Consumer Group plans to continue itsaggressive promotions of new and existing products in <strong>2012</strong> andcontinue expanding its customer base and product assortment atexisting customers.The Global Finishes Group’s net sales in 2011, when statedin U.S. dollars, increased due primarily to acquisitions, sellingprice increases, higher paint sales volume and favorable currencytranslation rate changes. Acquisitions increased this Group’snet sales in U.S. dollars by 20.7 percent. Paint sales volumepercentage, excluding acquisitions, increased in the mid-singledigits. Favorable currency translation rate changes in the yearincreased net sales by 1.4 percent for 2011. In 2011, the GlobalFinishes Group opened or acquired 1 new branch and closed 13locations for a net decrease of 12 branches decreasing the totalto 303 branches open in the United States, Canada, Mexico,South America, Europe and Asia at year-end. In <strong>2012</strong>, the GlobalFinishes Group expects to continue expanding its worldwidepresence and improving its customer base.The Latin America Coatings Group’s net sales in 2011, whenstated in U.S. dollars, increased due primarily to acquisitions,■ 37
MANAGEMENT’S DISCUSSION AND ANALYSIS OFFINANCIAL CONDITION AND RESULTS OF OPERATIONSselling price increases, higher paint sales volume and favorablecurrency translation rate changes. Acquisitions increased thisGroup’s net sales in U.S. dollars by 8.7 percent. Paint sales volumepercentage, excluding acquisitions, increased in the mid-singledigits. Favorable currency translation rate changes in the yearincreased net sales by 3.0 percent for 2011. In 2011, the LatinAmerica Coatings Group opened or acquired 19 new stores andclosed 3 locations for a net increase of 16 stores increasing thetotal to 265 stores open in North and South America at year-end.In <strong>2012</strong>, the Latin America Coatings Group expects to continueexpanding its regional presence and improving its customer base.Net sales in the Administrative segment, which primarilyconsist of external leasing revenue of excess headquarters spaceand leasing of facilities no longer used by the Company in itsprimary business, decreased by an insignificant amount in 2011.Consolidated gross profit increased $263.5 million relatedprimarily to higher sales in 2011, but decreased as a percent tonet sales to 42.7 percent from 44.8 percent in 2010 due primarilyto increasing raw material costs and the dilutive impact ofacquisitions partially offset by selling price increases, increasedpaint volume and good inventory management and cost control.The Paint Stores Group’s gross profit for 2011 increased $129.7million compared to 2010, but decreased as a percent of salesdue primarily to increasing raw material costs partially offset byselling price increases throughout 2011. The Consumer Group’sgross profit decreased $28.5 million for 2011 over 2010 dueprimarily to the elimination of a portion of a paint program at alarge retail customer. As a percent of sales, Consumer Group’sgross profit decreased primarily due to increasing raw materialcosts partially offset by selling price increases and good costcontrol. The Global Finishes Group’s gross profit for 2011increased $109.8 million and decreased as a percent of sales.Acquisitions, selling price increases, increased sales volumes, andfavorable foreign currency translation exchange rate changesincreased the gross profit dollars. Increasing raw materialcosts and the dilutive impact of acquisitions partially offset byselling price increases and increased paint volume decreasedgross profit as a percent of sales. Acquisitions increased GlobalFinishes Group’s gross profit by $79.5 million, or 27.1 percentof acquisition net sales, and foreign currency translation ratefluctuations increased gross profit by $7.2 million for 2011. TheLatin America Coatings Group’s gross profit for 2011 increased$48.1 million and decreased as a percent of sales. Acquisitions,selling price increases, increased sales volumes, and favorableforeign currency translation exchange rate changes increased thegross profit dollars. Increasing raw material costs and the dilutiveimpact of acquisitions partially offset by selling price increasesand increased paint volume decreased gross profit as a percentof sales. Acquisitions increased Latin America Coatings Group’sgross profit by $15.2 million, or 25.7 percent of acquisition netsales, and foreign currency translation rate fluctuations increasedgross profit by $7.2 million for 2011. The Administrative segment’sgross profit increased by an insignificant amount.SG&A increased by $232.7 million due primarily toacquisitions and increased expenses to support higher saleslevels in the Paint Stores, Global Finishes and Latin AmericaCoatings Groups. Acquisitions added $95.8 million of SG&A in2011, representing 27.2 percent of acquisition net sales. SG&Adecreased as a percent of sales to 33.8 percent in 2011 from 35.1percent in 2010. In the Paint Stores Group, SG&A increased$103.0 million for the year due primarily to increased spendingdue to the number of new store openings and increased expensesto maintain customer service. The Consumer Group’s SG&Adecreased by $3.1 million for the year due to good expensecontrol. The Global Finishes Group’s SG&A increased by $85.2million for the year relating primarily to acquisitions SG&A of$82.1 million, or 28.0 percent of acquisition net sales, and foreigncurrency translation rate fluctuations of $5.7 million. The LatinAmerica Coatings Group’s SG&A increased by $31.0 million forthe year relating primarily to acquisitions SG&A of $13.7 million,or 23.2 percent of acquisition net sales, foreign currency translationrate fluctuations of $5.5 million and increased expensesto support higher sales levels. The Administrative segment’sSG&A increased $16.6 million primarily due to an increase instock-based compensation expense and information systemscosts to integrate the 2010 acquisitions. See Note 12, on pages69 and 70 of this report, for more information concerningstock-based compensation.Other general expense - net decreased $1.1 million in2011 compared to 2010. The decrease was mainly caused by adecrease of $2.3 million in the Administrative segment, primarilydue to an increase of $4.2 million in the gain on sale of assetspartially offset by an increase in provisions for environmentalmatters of $2.0 million. In addition, Other general expense - netin the Consumer Group had lower income adjustments associatedwith exit or disposal activities of $3.1 million as comparedto 2010, while insignificant changes occurred in Other generalexpense - net of the remaining <strong>Report</strong>able Segments. See Note13, on page 71 of this report, for more information concerningOther general expense - net.Impairments of trademarks increased $1.0 million in 2011compared to 2010. As required by the Goodwill and OtherIntangibles Topic of the ASC, management performed an annualimpairment test of goodwill and indefinite-lived intangible assetsas of October 1, 2011. The impairment test in 2011 resulted inno impairment of goodwill and an impairment of $5.5 million ofseveral indefinite-lived trademarks primarily in the Paint StoresGroup. There were no material changes in goodwill and indefinite-livedintangible assets carrying values in 2010. However,reductions in the carrying value of $4.5 million were recorded for■ 38
MANAGEMENT’S DISCUSSION AND ANALYSIS OFFINANCIAL CONDITION AND RESULTS OF OPERATIONSdefinite-lived intangible assets whose undiscounted cash flowswere lower than the assets carrying values in the Global FinishesGroup. The impairment charges are shown as a separate line inthe Statements of consolidated income in accordance with theGoodwill and Other Intangibles Topic of the ASC. See Note 4,on pages 52 and 53 of this report, for more informationconcerning the impairment of intangible assets.Interest expense, included in the Administrative segment,decreased $28.1 million in 2011 versus 2010 due primarily tocosts related to the repurchase of a majority of the Company’s7.45% Debentures in 2010.Other income - net fluctuated to $4.8 million income from$0.8 million income in 2010. Increased income from othermiscellaneous income and expense items of $6.5 million,primarily in the Administrative segment, was partially offset byunfavorable foreign currency related transaction losses of $4.7million, primarily in the Global Finishes and Latin AmericaCoatings Groups. See Note 13, on page 71 of this report, formore information concerning Other income - net.Consolidated Income before income taxes in 2011 increased$63.8 million due primarily to an increase in gross profit of$263.5 million and a reduction of $34.0 million in interestexpense, interest and net investment income and other expenses,partially offset by an increase in SG&A of $232.7 million andan increase in trademark impairment charges of $1.0 million.Income before income taxes increased $26.2 million in thePaint Stores Group, $25.6 million in the Global Finishes Groupand $16.5 million in the Latin America Coatings Group anddecreased $30.3 million in the Consumer Group when comparedto 2010. The Administrative segment had a favorable impact onIncome before income taxes of $25.8 million when comparedto 2010. Segment profit of all consolidated foreign subsidiariesincreased 40.8 percent to $122.4 million for 2011 versus $87.0million for 2010 due primarily to an increase in gross profitof $152.2 million partially offset by an increase in SG&A of$121.6 million. Favorable foreign currency translation rates,partially offset by acquisitions, increased segment profit of allconsolidated foreign subsidiaries by 1.2 percent. Segment profitof all operations other than consolidated foreign subsidiariesincreased 4.8 percent to $619.1 million for 2011 versus $590.8million for 2010.Net income decreased $20.6 million in 2011 due to theimpact of the IRS Settlement partially offset by the increase inIncome before income taxes.The effective income tax rate for 2011 was 40.4 percent,including an increase in income tax expense of $75.0 millionrelating to the IRS Settlement. Excluding the impact of the IRSSettlement would results in an effective income tax rate for 2011of 30.3 percent. The effective income tax rate for 2010 was 31.8percent, including a one-time increase in income tax expense of$11.4 million relating to the Patient Protection and AffordableCare Act and the Health Care and Education ReconciliationAct of 2010 (the “Acts”). Diluted net income per common share,including charges relating to the IRS Settlement ($.70 per share)and dilution from acquisitions ($.04 per share) both in 2011,decreased 1.7 percent to $4.14 per share for 2011 from $4.21 pershare a year ago, which included charges relating to the Acts($.10 per share), repurchase of a majority of the Company’s7.45% debentures ($.12 per share), and dilution from acquisitions($.10 per share).■ 39
REPORT OF MANAGEMENT ON INTERNAL CONTROLOVER FINANCIAL REPORTINGShareholdersThe <strong>Sherwin</strong>-<strong>Williams</strong> CompanyWe are responsible for establishing and maintaining adequate internal control over financial reporting as defined in Rules 13a-15(f) and 15d-15(f) under the Securities Exchange Act of 1934, as amended. We recognize that internal control over financial reportingcannot provide absolute assurance of achieving financial reporting objectives because of its inherent limitations. Internal controlover financial reporting is a process that involves human diligence and is subject to the possibility of human error or the circumventionor the overriding of internal control. Therefore, there is a risk that material misstatements may not be prevented or detected on atimely basis by internal control over financial reporting. However, we believe we have designed into the process safeguards to reduce,though not eliminate, this risk. Projections of any evaluation of effectiveness to future periods are subject to the risk that controls maybecome inadequate because of changes in conditions, or that the degree of compliance with the policies or procedures may deteriorate.In order to ensure that the Company’s internal control over financial reporting was effective as of December 31, <strong>2012</strong>, weconducted an assessment of its effectiveness under the supervision and with the participation of our management group, includingour principal executive officer and principal financial officer. This assessment was based on criteria established in Internal Control –Integrated Framework issued by the Committee of Sponsoring Organizations of the Treadway Commission.Based on our assessment of internal control over financial reporting under the criteria established in Internal Control – IntegratedFramework, we have concluded that, as of December 31, <strong>2012</strong>, the Company’s internal control over financial reporting was effectiveto provide reasonable assurance regarding the reliability of financial reporting and the preparation of financial statements forexternal purposes in accordance with U.S. generally accepted accounting principles. Our internal control over financial reporting as ofDecember 31, <strong>2012</strong> has been audited by Ernst & Young LLP, an independent registered public accounting firm, and their report on theeffectiveness of our internal control over financial reporting is included on page 41 of this report.C. M. ConnorChairman and Chief Executive OfficerS. P. HennessySenior Vice President - Finance and Chief Financial OfficerA. J. MistysynVice President - Corporate Controller■ 40
REPORT OF THE INDEPENDENT REGISTERED PUBLIC ACCOUNTING FIRMON INTERNAL CONTROL OVER FINANCIAL REPORTINGShareholders and Board of DirectorsThe <strong>Sherwin</strong>-<strong>Williams</strong> CompanyWe have audited The <strong>Sherwin</strong>-<strong>Williams</strong> Company’s internal control over financial reporting as of December 31, <strong>2012</strong>, basedon criteria established in Internal Control – Integrated Framework issued by the Committee of Sponsoring Organizations of theTreadway Commission (the COSO criteria). The <strong>Sherwin</strong>-<strong>Williams</strong> Company’s management is responsible for maintaining effectiveinternal control over financial reporting, and for its assessment of the effectiveness of internal control over financial reporting includedin the accompanying <strong>Report</strong> of Management on Internal Control over Financial <strong>Report</strong>ing. Our responsibility is to express an opinionon the company’s internal control over financial reporting based on our audit.We conducted our audit in accordance with the standards of the Public Company Accounting Oversight Board (United States).Those standards require that we plan and perform the audit to obtain reasonable assurance about whether effective internal controlover financial reporting was maintained in all material respects. Our audit included obtaining an understanding of internal control overfinancial reporting, assessing the risk that a material weakness exists, testing and evaluating the design and operating effectiveness ofinternal control based on the assessed risk, and performing such other procedures as we considered necessary in the circumstances.We believe that our audit provides a reasonable basis for our opinion.A company’s internal control over financial reporting is a process designed to provide reasonable assurance regarding the reliabilityof financial reporting and the preparation of financial statements for external purposes in accordance with generally acceptedaccounting principles. A company’s internal control over financial reporting includes those policies and procedures that (1) pertain tothe maintenance of records that, in reasonable detail, accurately and fairly reflect the transactions and dispositions of the assets of thecompany; (2) provide reasonable assurance that transactions are recorded as necessary to permit preparation of financial statementsin accordance with generally accepted accounting principles, and that receipts and expenditures of the company are being made onlyin accordance with authorizations of management and directors of the company; and (3) provide reasonable assurance regardingprevention or timely detection of unauthorized acquisition, use, or disposition of the company’s assets that could have a material effecton the financial statements.Because of its inherent limitations, internal control over financial reporting may not prevent or detect misstatements. Also,projections of any evaluation of effectiveness to future periods are subject to the risk that controls may become inadequate because ofchanges in conditions, or that the degree of compliance with the policies or procedures may deteriorate.In our opinion, The <strong>Sherwin</strong>-<strong>Williams</strong> Company maintained, in all material respects, effective internal control over financialreporting as of December 31, <strong>2012</strong>, based on the COSO criteria.We also have audited, in accordance with the standards of the Public Company Accounting Oversight Board (United States), theconsolidated balance sheets of The <strong>Sherwin</strong>-<strong>Williams</strong> Company as of December 31, <strong>2012</strong>, 2011 and 2010, and the related statementsof consolidated income and comprehensive income, cash flows and shareholders’ equity for the years then ended and our report datedFebruary 28, 2013 expressed an unqualified opinion thereon.Cleveland, OhioFebruary 28, 2013■ 41
REPORT OF MANAGEMENT ON THECONSOLIDATED FINANCIAL STATEMENTSShareholdersThe <strong>Sherwin</strong>-<strong>Williams</strong> CompanyWe are responsible for the preparation and fair presentation of the consolidated financial statements, accompanying notes andrelated financial information included in this report of The <strong>Sherwin</strong>-<strong>Williams</strong> Company and its consolidated subsidiaries (collectively,the “Company”) as of December 31, <strong>2012</strong>, 2011 and 2010 and for the years then ended in accordance with U.S. generally acceptedaccounting principles. The consolidated financial information included in this report contains certain amounts that were based uponour best estimates, judgments and assumptions that we believe were reasonable under the circumstances.We have conducted an assessment of the effectiveness of internal control over financial reporting based on criteria established inInternal Control – Integrated Framework issued by the Committee of Sponsoring Organizations of the Treadway Commission. Asdiscussed in the <strong>Report</strong> of Management on Internal Control Over Financial <strong>Report</strong>ing on page 40 of this report, we concluded thatthe Company’s internal control over financial reporting was effective as of December 31, <strong>2012</strong>.The Board of Directors pursues its responsibility for the oversight of the Company’s accounting policies and procedures, financialstatement preparation and internal control over financial reporting through the Audit Committee, comprised exclusively of independentdirectors. The Audit Committee is responsible for the appointment and compensation of the independent registered publicaccounting firm. The Audit Committee meets at least quarterly with financial management, internal auditors and the independentregistered public accounting firm to review the adequacy of financial controls, the effectiveness of the Company’s internal control overfinancial reporting and the nature, extent and results of the audit effort. Both the internal auditors and the independent registeredpublic accounting firm have private and confidential access to the Audit Committee at all times.We believe that the consolidated financial statements, accompanying notes and related financial information included in thisreport fairly reflect the form and substance of all material financial transactions and fairly present, in all material respects, theconsolidated financial position, results of operations and cash flows as of and for the periods presented.C. M. ConnorChairman and Chief Executive OfficerS. P. HennessySenior Vice President - Finance and Chief Financial OfficerA. J. MistysynVice President - Corporate Controller■ 42
REPORT OF THE INDEPENDENT REGISTERED PUBLIC ACCOUNTING FIRMON THE CONSOLIDATED FINANCIAL STATEMENTSShareholders and Board of DirectorsThe <strong>Sherwin</strong>-<strong>Williams</strong> CompanyWe have audited the accompanying consolidated balance sheets of The <strong>Sherwin</strong>-<strong>Williams</strong> Company as of December 31, <strong>2012</strong>,2011 and 2010, and the related statements of consolidated income and comprehensive income, cash flows and shareholders’ equity forthe years then ended. These financial statements are the responsibility of the Company’s management. Our responsibility is to expressan opinion on these financial statements based on our audits.We conducted our audits in accordance with the standards of the Public Company Accounting Oversight Board (United States).Those standards require that we plan and perform the audit to obtain reasonable assurance about whether the financial statementsare free of material misstatement. An audit includes examining, on a test basis, evidence supporting the amounts and disclosures in thefinancial statements. An audit also includes assessing the accounting principles used and significant estimates made by management,as well as evaluating the overall financial statement presentation. We believe that our audits provide a reasonable basis for our opinion.In our opinion, the financial statements referred to above present fairly, in all material respects, the consolidated financial positionof The <strong>Sherwin</strong>-<strong>Williams</strong> Company at December 31, <strong>2012</strong>, 2011 and 2010, and the consolidated results of its operations and its cashflows for the years then ended, in conformity with U.S. generally accepted accounting principles.We also have audited, in accordance with the standards of the Public Company Accounting Oversight Board (United States),The <strong>Sherwin</strong>-<strong>Williams</strong> Company’s internal control over financial reporting as of December 31, <strong>2012</strong>, based on criteria established inInternal Control-Integrated Framework issued by the Committee of Sponsoring Organizations of the Treadway Commission and ourreport dated February 28, 2013 expressed an unqualified opinion thereon.Cleveland, OhioFebruary 28, 2013■ 43
STATEMENTS OF CONSOLIDATED INCOME AND COMPREHENSIVE INCOME(thousands of dollars except per common share data)Year Ended December 31,<strong>2012</strong> 2011 2010Net sales ...................................................................................... $ 9,534,462 $ 8,765,699 $ 7,776,424Cost of goods sold ....................................................................... 5,328,236 5,021,137 4,295,346Gross profit (1) ............................................................................. 4,206,226 3,744,562 3,481,078Percent to net sales 44.1% 42.7% 44.8%Selling, general and administrative expenses (1) ..................... 3,259,648 2,960,814 2,728,122Percent to net sales 34.2% 33.8% 35.1%Other general expense - net ...................................................... 5,248 2,731 3,803Impairment of trademarks ....................................................... 4,086 5,492 4,484Interest expense ......................................................................... 42,788 42,497 70,595Interest and net investment income ....................................... (2,913) (3,711) (2,929)Other income - net ..................................................................... (9,940) (4,809) (781)Income before income taxes .................................................... 907,309 741,548 677,784Income taxes (1), (2) ....................................................................... 276,275 299,688 215,299Net income .................................................................................. $ 631,034 $ 441,860 $ 462,485Net income per common share:Basic ........................................................................................ $ 6.15 $ 4.22 $ 4.28Diluted .................................................................................... $ 6.02 $ 4.14 $ 4.21(1) Includes DOL Settlement of $49,163, net of tax (Cost of goods sold $16,000, Selling, general and administrative expenses $64,000 and tax benefit $30,837), or$.47 per share in the Year ended December 31, <strong>2012</strong>.(2) Includes IRS Settlement of $74,982, or approximately $.70 per share, in the Year ended December 31, 2011. See Note 14 for more information on theIRS Settlement.Year Ended December 31,<strong>2012</strong> 2011 2010Net income ................................................................................................ $ 631,034 $ 441,860 $ 462,485Other comprehensive (loss) income, net of tax:Foreign currency translation adjustments ....................................... (7,403) (65,632) 25,131Employee benefit plans:Net actuarial losses and prior service costs arisingduring period (3) ............................................................................ (6,192) (36,415) (1,335)Less: amortization of net actuarial losses and priorservice costs included in Net pension costs (4) ......................... 10,973 13,045 14,8624,781 (23,370) 13,527Unrealized net gains (losses) on available-for-sale securities:Unrealized holding gains (losses) arising during period (5) .......... 123 (623) 476Less: reclassification adjustments for (gains) lossesincluded in net income (6) ............................................................ (12) 68111 (555) 476Other comprehensive (loss) income ..................................................... (2,511) (89,557) 39,134Comprehensive income .......................................................................... $ 628,523 $ 352,303 $ 501,619(3) Net of taxes of $2,846, $25,504 and $369, in <strong>2012</strong>, 2011 and 2010, respectively.(4) Net of taxes of $(13,350), $(8,183) and $(9,317), in <strong>2012</strong>, 2011 and 2010, respectively.(5) Net of taxes of $(77), $256 and $(183), in <strong>2012</strong>, 2011 and 2010, respectively.(6) Net of taxes of $7 and $(42) in <strong>2012</strong> and 2011, respectively.See notes to consolidated financial statements.■ 44
CONSOLIDATED BALANCE SHEETS(thousands of dollars)December 31,<strong>2012</strong> 2011 2010AssetsCurrent assets:Cash and cash equivalents ........................................................................................ $ 862,590 $ 32,696 $ 58,585Accounts receivable, less allowance .................................................................... 1,032,508 989,873 916,661Inventories:Finished goods ........................................................................................................... 732,359 730,727 743,953Work in process and raw materials ................................................................. 187,965 196,082 173,748920,324 926,809 917,701Deferred income taxes ............................................................................................... 126,730 149,207 127,348Other current assets .................................................................................................... 207,086 163,008 193,427Total current assets ................................................................................................ 3,149,238 2,261,593 2,213,722Goodwill ................................................................................................................................. 1,156,005 1,108,008 1,102,458Intangible assets ................................................................................................................. 347,553 305,873 320,504Deferred pension assets ................................................................................................. 249,911 228,350 248,333Other assets .......................................................................................................................... 366,134 368,898 332,100Property, plant and equipment:Land ..................................................................................................................................... 102,336 105,010 106,101Buildings ........................................................................................................................... 677,944 668,802 668,506Machinery and equipment ....................................................................................... 1,750,729 1,657,874 1,617,530Construction in progress .......................................................................................... 56,582 41,264 34,0382,587,591 2,472,950 2,426,175Less allowances for depreciation .......................................................................... 1,621,695 1,516,420 1,474,057965,896 956,530 952,118Total Assets ........................................................................................................................... $ 6,234,737 $ 5,229,252 $ 5,169,235Liabilities and Shareholders’ EquityCurrent liabilities:Short-term borrowings .............................................................................................. $ 69,035 $ 346,313 $ 388,592Accounts payable .......................................................................................................... 922,999 965,149 909,649Compensation and taxes withheld ....................................................................... 314,892 251,060 253,247Accrued taxes .................................................................................................................. 52,104 120,555 62,547Current portion of long-term debt ....................................................................... 3,689 7,823 7,875Other accruals ................................................................................................................ 513,717 471,761 442,030Total current liabilities ......................................................................................... 1,876,436 2,162,661 2,063,940Long-term debt ................................................................................................................... 1,632,165 639,231 648,326Postretirement benefits other than pensions ...................................................... 320,223 297,528 295,896Other long-term liabilities ............................................................................................ 614,109 612,913 551,633Shareholders’ equity:Common stock - $1.00 par value:103,270,067, 103,854,234 and 107,020,728 shares outstandingat December 31, <strong>2012</strong>, 2011 and 2010, respectively ........................... 111,623 107,454 231,346Preferred stock - convertible, no par value:101,086, 160,273 and 216,753 shares outstanding atDecember 31, <strong>2012</strong>, 2011 and 2010, respectively ................................ 101,086 160,273 216,753Unearned ESOP compensation ........................................................................ (101,086) (160,273) (216,753)Other capital .............................................................................................................. 1,673,788 1,297,625 1,222,909Retained earnings .................................................................................................... 1,226,467 756,372 4,824,489Treasury stock, at cost ........................................................................................... (849,685) (276,654) (4,390,983)Cumulative other comprehensive loss .......................................................... (370,389) (367,878) (278,321)Total shareholders’ equity .............................................................................. 1,791,804 1,516,919 1,609,440Total Liabilities and Shareholders’ Equity ........................................................... $ 6,234,737 $ 5,229,252 $ 5,169,235See notes to consolidated financial statements.■ 45
STATEMENTS OF CONSOLIDATED CASH FLOWS(thousands of dollars)Year Ended December 31,Operating Activities <strong>2012</strong> 2011 2010Net income ............................................................................................................................... $ 631,034 $ 441,860 $ 462,485Adjustments to reconcile net income to net operating cash:Depreciation ...................................................................................................................... 152,217 151,212 140,347Amortization of intangible assets ............................................................................ 26,985 29,692 34,964Impairment of trademarks and goodwill ............................................................. 4,086 5,492 4,484Provisions for environmental-related matters ................................................. 6,736 9,100 7,089Provisions for (net credit from) qualified exit costs ....................................... 2,734 534 (3,811)Deferred income taxes .................................................................................................. (10,422) 16,913 20,070Defined benefit pension plans net cost .................................................................. 20,309 12,326 18,104Income tax effect of ESOP on other capital ........................................................ (3,211) (7,515)Stock-based compensation expense ....................................................................... 54,348 48,176 42,276Net increase in postretirement liability ............................................................... 3,666 6,793 4,627Decrease in non-traded investments ..................................................................... 72,861 62,540 53,407Loss (gain) on disposition of assets ......................................................................... 3,454 (5,469) 2,720Other ...................................................................................................................................... (18,349) 3,137 3,330Change in working capital accounts:(Increase) in accounts receivable ............................................................................ (33,578) (93,697) (111,113)Decrease (increase) in inventories .......................................................................... 19,929 (19,222) (82,060)(Decrease) increase in accounts payable ............................................................. (51,124) 64,053 155,116(Decrease) increase in accrued taxes ..................................................................... (70,264) 5,435 (19,410)Increase (decrease) in accrued compensation and taxes withheld ......... 63,697 (538) 75,210(Decrease) increase in refundable income taxes .............................................. (32,967) (572) 16,059DOL settlement accrual ............................................................................................... 80,000Other ...................................................................................................................................... 11,000 36,249 (78,910)Costs incurred for environmental-related matters ............................................. (31,689) (30,451) (30,880)Costs incurred for qualified exit costs ........................................................................ (4,577) (6,181) (11,275)Other ........................................................................................................................................... (12,200) 1,641 11,276Net operating cash ........................................................................................................... 887,886 735,812 706,590Investing ActivitiesCapital expenditures ........................................................................................................... (157,112) (153,801) (125,162)Acquisitions of businesses, net of cash acquired ................................................... (99,242) (44,436) (298,161)Proceeds from sale of assets ............................................................................................ 9,677 12,842 8,335Increase in other investments ........................................................................................ (95,778) (92,374) (74,961)Net investing cash ............................................................................................................ (342,455) (277,769) (489,949)Financing ActivitiesNet (decrease) increase in short-term borrowings .............................................. (284,839) (43,346) 357,835Proceeds from long-term debt ....................................................................................... 999,697 40,777 14,798Payments of long-term debt ............................................................................................. (14,000) (49,881) (159,422)Costs associated with repurchase of long-term debt ........................................... (22,192)Payments of cash dividends ............................................................................................. (160,939) (153,512) (156,424)Proceeds from stock options exercised ...................................................................... 221,126 69,536 102,209Income tax effect of stock-based compensation exercises and vesting ...... 104,858 12,958 19,676Treasury stock purchased ................................................................................................ (557,766) (367,372) (375,677)Other ........................................................................................................................................... (21,559) 15,631 (4,371)Net financing cash ........................................................................................................... 286,578 (475,209) (223,568)Effect of exchange rate changes on cash .................................................................... (2,115) (8,723) (3,817)Net increase (decrease) in cash and cash equivalents ......................................... 829,894 (25,889) (10,744)Cash and cash equivalents at beginning of year ..................................................... 32,696 58,585 69,329Cash and cash equivalents at end of year .................................................................. $ 862,590 $ 32,696 $ 58,585Taxes paid on income .......................................................................................................... $ 223,329 $ 196,147 $ 137,872Interest paid on debt ........................................................................................................... 41,551 42,897 78,747See notes to consolidated financial statements.■ 46
STATEMENTS OF CONSOLIDATED SHAREHOLDERS’ EQUITY(thousands of dollars except per common share data)CommonStockPreferredStockUnearnedESOPCompensationOtherCapitalCumulativeOtherRetainedEarnings Treasury StockComprehensiveLossTotalBalance at January 1, 2010 ....................................... $ 228,647 $ 216,753 $ (216,753) $ 1,068,963 $ 4,518,428 $ (4,007,633) $ (317,455) $ 1,490,950Net income ..................................................................... 462,485 462,485Other comprehensive income ................................. 39,134 39,134Treasury stock purchased ......................................... (375,677) (375,677)Income tax effect of ESOP ....................................... (7,515) (7,515)Stock options exercised ............................................. 2,351 99,857 (7,673) 94,535Income tax effect of stock options exercised ...... 19,676 19,676Restricted stock and stock option grants(net activity) ............................................................ 348 41,928 42,276Cash dividends – $1.44 per common share ......... (156,424) (156,424)Balance at December 31, 2010 ................................ 231,346 216,753 (216,753) 1,222,909 4,824,489 (4,390,983) (278,321) 1,609,440Net income ..................................................................... 441,860 441,860Other comprehensive loss ........................................ (89,557) (89,557)Treasury stock purchased ......................................... (367,372) (367,372)Treasury stock retired ................................................ (125,426) (4,356,465) 4,481,891Redemption of preferred stock ............................... (56,480) 56,480Income tax effect of ESOP* ..................................... (54,420) (54,420)Stock options exercised ............................................. 1,234 68,302 (190) 69,346Income tax effect of stock options exercised ...... 12,958 12,958Restricted stock and stock optiongrants (net activity) ............................................... 300 47,876 48,176Cash dividends – $1.46 per common share ......... (153,512) (153,512)Balance at December 31, 2011 ............................ 107,454 160,273 (160,273) 1,297,625 756,372 (276,654) (367,878) 1,516,919Net income ................................................................... 631,034 631,034Other comprehensive loss .................................... (2,511) (2,511)Treasury stock purchased ..................................... (557,766) (557,766)Redemption of preferred stock .......................... (59,187) 59,187Stock options exercised ......................................... 3,867 217,259 (15,265) 205,861Income tax effect of stock options exercised ... 104,858 104,858Restricted stock and stock option grants(net activity) .......................................................... 302 54,046 54,348Cash dividends – $1.56 per common share ... (160,939) (160,939)Balance at December 31, <strong>2012</strong> ............................ $ 111,623 $ 101,086 $ (101,086) $ 1,673,788 $ 1,226,467 $ (849,685) $ (370,389) $ 1,791,804* Includes $51,209 reduction in Other capital related to IRS Settlement. See Note 14 for more information on the IRS Settlement.See notes to consolidated financial statements.■ 47
NOTES TO CONSOLIDATED FINANCIAL STATEMENTS(thousands of dollars unless otherwise indicated)NOTE 1 – SIGNIFICANT ACCOUNTING POLICIESConsolidation. The consolidated financial statementsinclude the accounts of The <strong>Sherwin</strong>-<strong>Williams</strong> Company and itswholly owned subsidiaries (collectively, “the Company.”) Intercompanyaccounts and transactions have been eliminated.Use of estimates. The preparation of consolidatedfinancial statements in conformity with U.S. generally acceptedaccount ing principles requires management to make estimates,judgments and assumptions that affect the amounts reported inthe consolidated financial statements and accompanying notes.Actual results could differ from those amounts.Nature of operations. The Company is engaged in thedevelopment, manufacture, distribution and sale of paint, coatingsand related products to professional, industrial, commercialand retail customers primarily in North and South America, withadditional operations in the Caribbean region, Europe and Asia.<strong>Report</strong>able segments. See Note 18 for further details.Cash flows. Management considers all highly liquid investmentswith a maturity of three months or less when purchased tobe cash equivalents.Fair value of financial instruments. The following methodsand assumptions were used by the Company in estimating itsfair value disclosures for financial instruments:Cash and cash equivalents: The carrying amounts reportedfor Cash and cash equivalents approximate fair value.Short-term investments: The carrying amountsreported for Short-term investments approximate fair value.Investments in securities: Investments classified asavailable-for-sale are carried at market value. See the recurringfair value measurement table on page 49.Non-traded investments: The Company has investedin the U.S. affordable housing and historic renovation realestate markets. These non-traded investments have beenidentified as variable interest entities. However, because theCompany does not have the power to direct the day-to-dayoperations of the investments and the risk of loss is limitedto the amount of contributed capital, the Company is notconsidered the primary beneficiary. In accordance with theConsolidation Topic of the Financial Accounting StandardsBoard (FASB) Accounting Standards Codification (ASC),the investments are not consolidated. The Company uses theeffective yield method to determine the carrying value of theinvestments. Under the effective yield method, the initial costof the investments is amortized over the period that the taxcredits are recognized. The carrying amounts of the investments,included in Other assets, were $223,701, $232,366and $198,023 at December 31, <strong>2012</strong>, 2011 and 2010,respectively. The liabilities recorded on the balance sheetsfor estimated future capital contributions to the investmentswere $218,688, $235,355 and $194,807 at December 31,<strong>2012</strong>, 2011 and 2010, respectively.Short-term borrowings: The carrying amountsreported for Short-term borrowings approximate fair value.Long-term debt (including current portion): The fairvalues of the Company’s publicly traded debt, shown below,are based on quoted market prices. The fair values of theCompany’s non-traded debt, also shown below, are estimatedusing discounted cash flow analyses, based on the Company’scurrent incremental borrowing rates for similar types ofborrowing arrangements. The Company’s publicly tradeddebt and non-traded debt are classified as level 1 and level 2,respectively, in the fair value hierarchy. See Note 7.December 31,<strong>2012</strong> 2011 2010CarryingAmountFairValueCarryingAmountFairValueCarryingAmountFairValuePublicly traded debt ................ $ 1,630,056 $ 1,706,487 $ 632,423 $ 703,238 $ 632,375 $ 662,193Non-traded debt ........................ 5,798 5,600 14,631 14,070 23,826 22,454Derivative instruments: The Company utilizes derivativeinstruments as part of its overall financial risk managementpolicy. The Company entered into foreign currency option andforward currency exchange contracts with maturity dates of lessthan twelve months in <strong>2012</strong>, 2011 and 2010, primarily to hedgeagainst value changes in foreign currency. See Note 13. Therewere no derivative contracts outstanding at December 31, <strong>2012</strong>,2011 and 2010.Fair value measurements. The following tables summarizethe Company’s assets and liabilities measured on a recurringand non-recurring basis in accordance with the Fair ValueMeasurements and Disclosures Topic of the ASC:■ 48
NOTES TO CONSOLIDATED FINANCIAL STATEMENTS(thousands of dollars unless otherwise indicated)equipment are leasehold improvements. The major classes ofassets and ranges of annual depreciation rates are:Buildings .................................................................................. 2.5% – 20.0%Machinery and equipment ......................................... 5.0% – 20.0%Furniture and fixtures .................................................... 10.0% – 33.3%Automobiles and trucks ............................................... 10.0% – 33.3%Standby letters of credit. The Company occasionally entersinto standby letter of credit agreements to guarantee variousoperating activities. These agreements provide credit availabilityto the various beneficiaries if certain contractual events occur.Amounts outstanding under these agreements totaled $22,845,$18,819 and $22,300 at December 31, <strong>2012</strong>, 2011 and 2010,respectively.Product warranties. The Company offers product warrantiesfor certain products. The specific terms and conditionsof such warranties vary depending on the product or customercontract requirements. Management estimated the costs ofunsettled product warranty claims based on historical resultsand experience and included an amount in Other accruals.Management periodically assesses the adequacy of the accrualfor product warranty claims and adjusts the accrual as necessary.Changes in the Company’s accrual for product warranty claimsduring <strong>2012</strong>, 2011 and 2010, including customer satisfactionsettlements during the year, were as follows:<strong>2012</strong> 2011 2010Balance at January 1 .................. $ 22,071 $ 23,103 $ 22,214Charges to expense ..................... 28,590 29,957 23,092Settlements ....................................... (27,951) (30,989) (22,203)Balance at December 31 .......... $ 22,710 $ 22,071 $ 23,103Environmental matters. Capital expenditures for ongoingenvironmental compliance measures were recorded in Property,plant and equipment, and related expenses were included inthe normal operating expenses of conducting business. TheCompany is involved with environmental investigation andremediation activities at some of its currently and formerlyowned sites and at a number of third-party sites. The Companyaccrued for environmental-related activities for which commitmentsor clean-up plans have been developed and when suchcosts could be reasonably estimated based on industry standardsand professional judgment. All accrued amounts were recordedon an undiscounted basis. Environmental-related expensesincluded direct costs of investigation and remediation andindirect costs such as compensation and benefits for employeesdirectly involved in the investigation and remediation activitiesand fees paid to outside engineering, consulting and law firms.See Notes 8 and 13.Employee Stock Purchase and Savings Plan andpreferred stock. The Company accounts for the EmployeeStock Purchase and Savings Plan (ESOP) in accordance with theEmployee Stock Ownership Plans Subtopic of the Compensation– Stock Ownership Topic of the ASC. The Company recognizedcompensation expense for amounts contributed to the ESOP,and the ESOP used dividends on unallocated preferred sharesto service debt. Unallocated preferred shares held by the ESOPwere not considered outstanding in calculating earnings pershare of the Company. See Note 11.Defined benefit pension and other postretirementbenefit plans. The Company accounts for its defined benefitpension and other postretirement benefit plans in accordancewith the Retirement Benefits Topic of the ASC, which requiresthe recognition of a plan’s funded status as an asset for overfundedplans and as a liability for unfunded or underfundedplans. See Note 6.Stock-based compensation. The cost of the Company’sstock-based compensation is recorded in accordance with theStock Compensation Topic of the ASC. See Note 12.Foreign currency translation. All consolidated non-highlyinflationary foreign operations use the local currency of thecountry of operation as the functional currency and translatedthe local currency asset and liability accounts at year-endexchange rates while income and expense accounts weretranslated at average exchange rates. The resulting translationadjustments were included in Cumulative other comprehensiveloss, a component of Shareholders’ equity.Cumulative other comprehensive loss. At December 31,<strong>2012</strong>, the ending balance of Cumulative other comprehensiveloss included adjustments for foreign currency translation of$204,195, net prior service costs and net actuarial losses relatedto pension and other postretirement benefit plans of $166,595and unrealized net gains on marketable equity securities of$401. At December 31, 2011 and 2010, the ending balance ofCumulative other comprehensive loss included adjustments forforeign currency translation of $196,792 and $131,160, respectively,net prior service costs and net actuarial losses relatedto pension and other postretirement benefit plans of $171,376and $148,006, respectively, and unrealized gains on marketableequity securities and derivative instruments used in cash flowhedges of $290 and $845, respectively.Revenue recognition. All revenues were recognized whenproducts were shipped and title had passed to unaffiliatedcustomers. Collectibility of amounts recorded as revenue wasreasonably assured at the time of recognition.Customer and vendor consideration. The Companyoffered certain customers rebate and sales incentive programswhich were classified as reductions in Net sales. Such programswere in the form of volume rebates, rebates that constituted a■ 50
NOTES TO CONSOLIDATED FINANCIAL STATEMENTS(thousands of dollars unless otherwise indicated)percentage of sales or rebates for attaining certain sales goals.The Company received consideration from certain suppliersof raw materials in the form of volume rebates or rebates thatconstituted a percentage of purchases. These rebates were recognizedon an accrual basis by the Company as a reduction of thepurchase price of the raw materials and a subsequent reductionof Cost of goods sold when the related product was sold.Costs of goods sold. Included in Costs of goods sold werecosts for materials, manufacturing, distribution and relatedsupport. Distribution costs included all expenses related tothe distribution of products including inbound freight charges,purchase and receiving costs, warehousing costs, internaltransfer costs and all costs incurred to ship products. Alsoincluded in Costs of goods sold were total technical expenditures,which included research and development costs, quality control,product formulation expenditures and other similar items.Research and development costs included in technical expenditureswere $44,648, $41,719 and $39,883 for <strong>2012</strong>, 2011 and2010, respectively.Selling, general and administrative expenses. Sellingcosts included advertising expenses, marketing costs, employeeand store costs and sales commissions. The cost of advertisingwas expensed as incurred. The Company incurred $247,469,$227,303 and $217,637 in advertising costs during <strong>2012</strong>, 2011and 2010, respectively. General and administrative expensesincluded human resources, legal, finance and other support andadministrative functions.Earnings per share. Shares of preferred stock held in anunallocated account of the ESOP (see Note 11) and commonstock held in a revocable trust (see Note 10) were not consideredoutstanding shares for basic or diluted income per commonshare calculations. All references to “shares” or “per share”information throughout this report relate to common shares andare stated on a diluted per common share basis, unless otherwiseindicated. Basic and diluted net income per common sharewere calculated using the two-class method in accordance withthe Earnings Per Common Share Topic of the ASC. Basic netincome per common share amounts were computed based on theweighted-average number of common shares outstanding duringthe year. Diluted net income per common share amounts werecomputed based on the weighted-average number of commonshares outstanding plus all dilutive securities potentiallyoutstanding during the year. See Note 15.Impact of recently issued accounting standards. EffectiveJanuary 1, <strong>2012</strong>, the Company adopted Accounting StandardsUpdate (ASU) No. 2011-5 and 2011-12, which amend theComprehensive Income Topic of the ASC. The updated guidancerequires the components of income and other comprehensiveincome to be presented in a single continuous statement ortwo consecutive statements in annual periods. The change inpresentation did not have an impact on the Company’s results ofoperations, financial condition or liquidity.In July <strong>2012</strong>, the FASB issued ASU No. <strong>2012</strong>-2, whichamends the Intangibles - Goodwill and Other Topic of the ASC.The updated standard gives companies the option to performa qualitative assessment to determine whether indefinite-livedintangible assets are impaired. If the qualitative analysisshows that it is unlikely that an indefinite-lived intangibleasset is impaired, then the annual fair value calculation doesnot need to be performed. However, if it is not unlikely that anindefinite-lived intangible asset is impaired, then the annualfair value calculation must still be performed. ASU No. <strong>2012</strong>-2is effective for annual and interim impairment tests performedfor fiscal years beginning after September 15, <strong>2012</strong>, with earlyadoption permitted. The Company will consider performing thequalitative assessment as part of its future annual impairmenttests for indefinite-lived intangible assets. ASU No. <strong>2012</strong>-2 issimilar to ASU No. 2011-8, which was adopted by the Companyin <strong>2012</strong>, and amends the Intangibles - Goodwill and Other Topicof the ASC to give companies the option to perform a qualitativeassessment that can potentially alleviate the need to performthe quantitative two-step test. These standards may affect theCompany’s disclosures, but they will not affect its results ofoperations, financial condition or liquidity.NOTE 2 – ACQUISITIONSOn November 9, <strong>2012</strong>, the Company entered into a definitiveStock Purchase Agreement to purchase all of the issued andoutstanding shares of Consorcio Comex, S.A. de C.V. (Comex)for an aggregate purchase price of approximately $2.34 billion,including assumed debt. Comex is a leader in the paint andcoatings market in Mexico with headquarters in Mexico City.Completion of the transaction is subject to certain conditionsand regulatory approvals.All completed acquisitions below have been accounted foras purchases and their results of operations have been includedin the consolidated financial statements since the date ofacquisition.Effective December 18, <strong>2012</strong>, the Company acquiredJiangsu Pulanna Coating Co., Ltd. (Pulanna). Headquartered inChangzhou, China, Pulanna is a leading automotive refinishescoatings manufacturer in China. The acquisition strengthens theGlobal Finishes Group’s established presence in China and itsability to serve automotive customers around the world.Effective June 1, <strong>2012</strong>, the Company acquired GeocelHoldings Corporation. Geocel manufactures innovative caulks,sealants, and adhesives specially designed for tough constructionand repair applications in commercial, residential, industrial and■ 51
NOTES TO CONSOLIDATED FINANCIAL STATEMENTS(thousands of dollars unless otherwise indicated)transport non-automotive markets. Geocel has operations inboth the United States and United Kingdom. The acquisitionstrengthens the Consumer Group’s sealant and adhesivemarket position.The aggregate consideration paid for Pulanna and Geocelwas $99,242, net of cash acquired. Both acquisitions resulted inthe recognition of goodwill and intangible assets. See Note 4.The Company acquired a controlling interest in LeighsPaints in July 2011, and the remaining interest in December 2011.Headquartered in Bolton, United Kingdom, Leighs Paints is oneof the leading industrial fire protection coatings manufacturersin the world, with a growing global platform driven by technologyinnovation and quality products. Leighs Paints strengthens theGlobal Finishes Group’s growing global platform. The aggregateconsideration paid for Leighs Paints was $41,824, net of cashacquired. The acquisition resulted in the recognition of goodwilland intangible assets. See Note 4.The following unaudited pro-forma summary presents consolidatedfinancial information as if Pulanna, Geocel and LeighsPaints had been acquired at the beginning of 2011. The unauditedpro-forma consolidated financial information does not necessarilyreflect the actual results that would have occurred had theacquisitions taken place on January 1, 2011 or the future resultsof operations of the combined companies under ownership andoperation of the Company.<strong>2012</strong> 2011Net sales ......................................................... $ 9,589,229 $ 8,888,661Net income ................................................... 641,090 448,751Net income per common share:Basic ............................................................ 6.25 4.29Diluted ...................................................... 6.12 4.20NOTE 3 – INVENTORIESInventories were stated at the lower of cost or market withcost determined principally on the last-in, first-out (LIFO)method. The following presents the effect on inventories, netincome and net income per common share had the Companyused the first-in, first-out (FIFO) inventory valuation methodadjusted for income taxes at the statutory rate and assuming noother adjustments. Management believes that the use of LIFOresults in a better matching of costs and revenues. This informationis presented to enable the reader to make comparisonswith companies using the FIFO method of inventory valuation.During <strong>2012</strong> and 2011, certain inventories accounted for onthe LIFO method were reduced, resulting in the liquidation ofcertain quantities carried at costs prevailing in prior years. The<strong>2012</strong> liquidations reduced net income by $160 and the 2011liquidations increased net income by $1,067.<strong>2012</strong> 2011 2010Percentage of totalinventories on LIFO .......... 75% 77% 76%Excess of FIFO over LIFO .. $ 357,303 $ 378,986 $ 277,164Increase (decrease) in netincome due to LIFO .......... 13,365 (62,636) (16,394)Increase (decrease) in netincome per commonshare due to LIFO .............. .13 (.59) (.15)NOTE 4 – GOODWILL, INTANGIBLE ANDLONG-LIVED ASSETSDuring <strong>2012</strong>, the Company recognized $42,064 of goodwilland $15,899 of indefinite-lived trademarks in the acquisitionsof Geocel and Pulanna. Acquired customer relationships,finite-lived trademarks and covenants not to compete recognizedin these acquisitions valued at $27,487, $13,000 and $9,720,respectively, are being amortized over periods ranging from 6 to15 years from the date of acquisition.During 2011, the Company recognized $5,039 of goodwill inthe acquisition of Leighs Paints. Acquired technology, trademarksand customer relationships recognized in this acquisitionvalued at $4,794, $2,125 and $1,918, respectively, are beingamortized over periods ranging from 5 to 10 years from the dateof acquisition.During 2010, the Company recognized $79,909 of goodwilland $18,007 of trademarks in the acquisitions of SayerlackIndustrial Coatings (Sayerlack), Becker Industrial ProductsAB (Acroma) and Pinturas Condor S.A. (Pinturas Condor).Customer relationships valued at $35,886 recognized in theacquisitions of Acroma and Pinturas Condor are being amortizedover periods of 15 and 19 years, respectively, from the date ofacquisition.In accordance with the Property, Plant and EquipmentTopic of the ASC, whenever events or changes in circumstancesindicate that the carrying value of long-lived assets may not berecoverable or the useful life may have changed, impairment testsare to be performed. Undiscounted cash flows are to be used tocalculate the recoverable value of long-lived assets to determineif such assets are impaired. Where impairment is identified, adiscounted cash flow valuation model, incorporating discountrates commensurate with the risks involved for each group ofassets, is to be used to determine the fair value for the assets tomeasure any potential impairment.In 2011, a reduction in the carrying value of property, plantand equipment associated with a facility closed during 2008 wasrecorded (see Note 5).During 2010, a reduction in the carrying value of property,plant and equipment associated with one manufacturing facilityclosed during 2009 was recorded (see Note 5). In addition,finite-lived intangible assets and property, plant and equipment■ 52
NOTES TO CONSOLIDATED FINANCIAL STATEMENTS(thousands of dollars unless otherwise indicated)in the Global Finishes Group had reductions in carrying value of$4,364 and $2,177, respectively, due to undiscounted cash flowprojections below carrying values.In accordance with the Goodwill and Other IntangiblesTopic of the ASC, goodwill and indefinite-lived intangible assetsare tested for impairment annually, and interim impairmenttests are performed whenever an event occurs or circumstanceschange that indicate an impairment has more likely thannot occurred. October 1 has been established for the annualimpairment review. At the time of impairment testing, values areestimated separately for goodwill and trademarks with indefinitelives using a discounted cash flow valuation model, incorporatingdiscount rates commensurate with the risks involved for eachgroup of assets. An optional qualitative assessment may alleviatethe need to perform the quantitative goodwill impairment testwhen impairment is unlikely. The Company used the qualitativeassessment for each of its reporting units in <strong>2012</strong>. Impairmentsof trademarks with indefinite lives have been reported as aseparate line in the Statements of Consolidated Income.The annual impairment review performed as of October1, <strong>2012</strong> resulted in trademark impairments in the Paint StoresGroup and Global Finishes Group of $3,400 and $686,respectively, and no goodwill impairment. The trademarkimpairments related primarily to the planned conversion ofvarious acquired brands.The annual impairment review performed as of October 1,2011 resulted in trademark impairments in the Paint StoresGroup and Global Finishes Group of $4,669 and $823,respectively, and no goodwill impairment. The trademarkimpairments related primarily to lower-than-anticipated sales ofacquired brands.The annual impairment review performed as of October 1,2010 resulted in trademark impairment in the Paint StoresGroup of $120 and no goodwill impairment. The trademarkimpairment related primarily to lower-than-anticipated sales ofan acquired brand.Amortization of finite-lived intangible assets is as follows forthe next five years: $33,279 in 2013, $29,840 in 2014, $25,866 in2015 and $22,145 in 2016 and $18,003 in 2017.A summary of changes in the Company’s carrying value ofgoodwill by reportable segment is as follows:Paint StoresGroupConsumerGroupGlobal FinishesGroupLatin AmericaCoatings GroupConsolidatedTotalsGoodwillBalance at January 1, 2010 (a) ......................... $ 285,445 $ 686,612 $ 42,397 $ 371 $ 1,014,825Acquisitions .......................................................... 70,594 9,315 79,909Currency and other adjustments ........... 1,299 2,776 2,728 921 7,724Balance at December 31, 2010 (a) ................. 286,744 689,388 115,719 10,607 1,102,458Acquisitions .......................................................... 5,039 5,039Currency and other adjustments ........... 254 (109) (408) 774 511Balance at December 31, 2011 (a) .................. 286,998 689,279 120,350 11,381 1,108,008Acquisitions ........................................................ 17,357 24,707 42,064Currency and other adjustments .... (214) (344) 7,230 (739) 5,933Balance at December 31, <strong>2012</strong> (a) ............ $ 286,784 $ 706,292 $ 152,287 $ 10,642 $ 1,156,005(a) Net of accumulated impairment losses of $8,904 ($8,113 in the Consumer Group and $791 in the Global Finishes Group).A summary of the Company’s carrying value of intangible assets is as follows:Finite-lived intangible assetsTrademarks Total intangibleSoftware All other Subtotal with indefinite lives assetsDecember 31, <strong>2012</strong>Weighted-average amortization period ... 8 years 12 years 11 yearsGross .................................................................................... $ 107,779 $ 337,089 $ 444,868Accumulated amortization .............................. (66,106) (193,959) (260,065)Net value ..................................................................... $ 41,673 $ 143,130 $ 184,803 $ 162,750 $ 347,553December 31, 2011Weighted-average amortization period ....... 7 years 13 years 11 yearsGross ..................................................................................... $ 109,401 $ 274,086 $ 383,487Accumulated amortization ................................... (60,030) (177,706) (237,736)Net value ....................................................................... $ 49,371 $ 96,380 $ 145,751 $ 160,122 $ 305,873December 31, 2010Weighted-average amortization period ....... 8 years 13 years 11 yearsGross ..................................................................................... $ 107,141 $ 254,462 $ 361,603Accumulated amortization ................................... (57,480) (171,153) (228,633)Net value ....................................................................... $ 49,661 $ 83,309 $ 132,970 $ 187,534 $ 320,504■ 53
NOTES TO CONSOLIDATED FINANCIAL STATEMENTS(thousands of dollars unless otherwise indicated)NOTE 5 – EXIT OR DISPOSAL ACTIVITIESManagement is continually re-evaluating the Company’s operatingfacilities, including acquired operating facilities, againstits long-term strategic goals. Liabilities associated with exitor disposal activities are recognized as incurred in accordancewith the Exit or Disposal Cost Obligations Topic of the ASC.Provisions for qualified exit costs are made at the time a facilityis no longer operational. Qualified exit costs primarily includepost-closure rent expenses or costs to terminate the contractbefore the end of its term and costs of employee terminations.Adjustments may be made to liabilities accrued for qualifiedexit costs if information becomes available upon which moreaccurate amounts can be reasonably estimated. Concurrently,property, plant and equipment is tested for impairment inaccordance with the Property, Plant and Equipment Topic of theASC, and if impairment exists, the carrying value of the relatedassets is reduced to estimated fair value. Additional impairmentmay be recorded for subsequent revisions in estimated fair value.Adjustments to prior provisions and additional impairmentcharges for property, plant and equipment of closed sites beingheld for disposal are recorded in Other general expense – net.During <strong>2012</strong>, 19 stores and branches were closed due tolower demand or redundancy. Provisions for severance and otherqualified exit cost of $7,363 and $313 were charged to the GlobalFinishes Group and Paint Stores Group, respectively. Therewere no provisions for severance and other qualified exit costscharged to the Consumer Group or Latin America CoatingsGroup. Adjustments to prior provisions related to manufacturingfacilities, distribution facilities, stores and branches closed priorto <strong>2012</strong> of $(4,942) were recorded.During 2011, 22 stores and branches were closed due tolower demand or redundancy. Provisions for severance andother qualified exit costs of $913, $339 and $182 were chargedto the Global Finishes Group, Consumer Group and Paint StoresGroup, respectively. There were no provisions for severance andother qualified exit costs charged to the Latin America CoatingsGroup. Adjustments to prior provisions related to manufacturingfacilities, distribution facilities, stores and branches closed priorto 2011 of $(900) were recorded. In 2011, a reduction of $3,263in the carrying value of property, plant and equipment associatedwith a facility closed in 2008 was recorded in the PaintStores Group.During 2010, 23 stores and branches were closed due tolower demand or redundancy. Provisions for severance and otherqualified exit costs of $1,314, $457 and $182 were charged tothe Global Finishes Group, Consumer Group and Paint StoresGroup, respectively. Adjustments to prior provisions relatedto manufacturing facilities, distribution facilities, stores andbranches closed prior to 2010 of $(5,764) were recorded. In2010, a reduction of $1,164 in the carrying value of the property,plant and equipment associated with a manufacturing facilityclosed in 2009 was recorded.At December 31, <strong>2012</strong>, a portion of the remaining accrual forqualified exit costs relating to facilities shutdown prior to 2010is expected to be incurred by the end of 2013. The remainingportion of the ending accrual for facilities shutdown prior to2010 primarily represented post-closure contractual expensesrelated to certain owned facilities which are closed and beingheld for disposal or involved in ongoing environmental-relatedactivities. The Company cannot reasonably estimate when suchmatters will be concluded to permit disposition.The tables on the following pages summarize the activity andremaining liabilities associated with qualified exit costs:■ 54
NOTES TO CONSOLIDATED FINANCIAL STATEMENTS(thousands of dollars unless otherwise indicated)Balance atDecember 31,2011Provisions inCost of goodssold or SG&AActualexpenditurescharged toaccrualAdjustments toprior provisionsin Other generalexpense - netBalance atDecember 31,<strong>2012</strong>Exit PlanPaint Stores Group stores shutdownin <strong>2012</strong>:Other qualified exit costs ................................. $ 313 $ 313Global Finishes Group facilityshutdown in <strong>2012</strong>:Severance and related costs .......................... 3,933 $ (1,697) 2,236Other qualified exit costs ................................. 3,430 3,430Consumer Group manufacturingfacilities shutdown in 2011:Severance and related costs .......................... $ 197 (133) $ (64)Paint Stores Group stores shutdownin 2011:Other qualified exit costs ................................. 156 (144) (12)Global Finishes Group branchesshutdown in 2011:Severance and related costs .......................... 129 (134) 5Other qualified exit costs ................................. 470 (180) 290Global Finishes Group branchesshutdown in 2010:Other qualified exit costs ................................. 955 (133) 822Other qualified exit costs for facilitiesshutdown prior to 2010 ........................................... 8,493 (2,156) (4,871) 1,466Totals .............................................................................................. $ 10,400 $ 7,676 $ (4,577) $ (4,942) $ 8,557Balance atDecember 31,2010Provisions inCost of goodssold or SG&AActualexpenditurescharged toaccrualAdjustments toprior provisionsin Other generalexpense - netBalance atDecember 31,2011Exit PlanConsumer Group manufacturing facilitiesshutdown in 2011:Severance and related costs ................................ $ 339 $ (142) $ 197Paint Stores Group stores shutdown in 2011:Other qualified exit costs ...................................... 182 (26) 156Global Finishes Group branches shutdownin 2011:Severance and related costs ................................ 316 (187) 129Other qualified exit costs ...................................... 597 (127) 470Global Finishes Group branches shutdownin 2010:Other qualified exit costs ...................................... $ 1,114 (159) 955Paint Stores Group stores shutdown in 2010:Other qualified exit costs ...................................... 4 $ (4)Paint Stores Group stores shutdown in 2009:Other qualified exit costs ...................................... 2,022 (805) 3 1,220Global Finishes Group manufacturing facilityand branches shutdown in 2009:Other qualified exit costs ...................................... 1,820 (918) 262 1,164Consumer Group manufacturing facilitiesshutdown in 2009:Other qualified exit costs ...................................... 721 (245) (74) 402Other qualified exit costs for facilitiesshutdown prior to 2009 ............................................... 10,366 (3,572) (1,087) 5,707Totals ................................................................................................ $ 16,047 $ 1,434 $ (6,181) $ (900) $ 10,400■ 55
NOTES TO CONSOLIDATED FINANCIAL STATEMENTS(thousands of dollars unless otherwise indicated)Balance atJanuary 1,2010Provisions inCost of goodssold or SG&AActualexpenditurescharged toaccrualAdjustments toprior provisionsin Other generalexpense - netBalance atDecember 31,2010Exit PlanGlobal Finishes Group branches shutdownin 2010:Severance and related costs .................................. $ 31 $ (31)Other qualified exit costs ........................................ 1,283 (169) $ 1,114Paint Stores Group stores shutdown in 2010:Other qualified exit costs ........................................ 182 (178) 4Paint Stores Group stores shutdown in 2009:Other qualified exit costs ........................................ $ 3,213 (1,213) $ 22 2,022Consumer Group manufacturing facilitiesshutdown in 2009:Severance and related costs .................................. 4,532 457 (3,534) (1,455)Other qualified exit costs ........................................ 2,258 (612) (925) 721Global Finishes Group manufacturing facilityand branches shutdown in 2009:Severance and related costs .................................. 204 (78) (126)Other qualified exit costs ........................................ 3,703 (1,288) (595) 1,820Paint Stores Group manufacturing anddistribution facilities, administrativeoffices and stores shutdown in 2008:Severance and related costs .................................. 70 (66) (4)Other qualified exit costs ........................................ 5,426 (1,864) (504) 3,058Consumer Group manufacturing anddistribution facilities shutdown in 2008:Severance and related costs .................................. 311 (311)Other qualified exit costs ........................................ 83 (60) 219 242Global Finishes Group administrative officesand branches shutdown in 2008:Other qualified exit costs ........................................ 88 (88)Other qualified exit costs for facilitiesshutdown prior to 2008 ................................................ 11,245 (2,094) (2,085) 7,066Totals ................................................................................................. $ 31,133 $ 1,953 $ (11,275) $ (5,764) $ 16,047NOTE 6 – PENSION, HEALTH CARE ANDPOSTRETIREMENT BENEFITS OTHERTHAN PENSIONSThe Company provides pension benefits to substantially allemployees through primarily noncontributory defined contributionor defined benefit plans and certain health care and lifeinsurance benefits to domestic active employees and eligibleretirees. In accordance with the Retirement Benefits Topic of theASC, the Company recognizes an asset for overfunded definedbenefit pension or other postretirement benefit plans and a liabilityfor unfunded or underfunded plans. In addition, actuarialgains and losses and prior service costs of such plans are recordedin Cumulative other comprehensive loss, a component ofShareholders’ equity. The amounts recorded in Cumulative othercomprehensive loss will continue to be modified as actuarialassumptions and service costs change, and all such amounts willbe amortized to expense over a period of years through the netpension cost (credit) and net periodic benefit cost.Health care plans. The Company provides certain domestichealth care plans that are contributory and contain cost-sharingfeatures such as deductibles and coinsurance. There were 18,609,18,189 and 17,841 active employees entitled to receive benefitsunder these plans at December 31, <strong>2012</strong>, 2011 and 2010, respectively.The cost of these benefits for active employees, whichincludes claims incurred and claims incurred but not reported,amounted to $163,011, $155,501 and $144,927 for <strong>2012</strong>, 2011 and2010, respectively.Defined contribution pension plans. The Company’sannual contribution for its domestic defined contributionpension plan was $25,147, $23,344 and $22,512 for <strong>2012</strong>, 2011and 2010, respectively. The contribution percentage rangesfrom two percent to seven percent of compensation for coveredemployees based on an age and service formula. Assets inemployee accounts of the domestic defined contribution pensionplan are invested in various investment funds as directed by theparticipants. These investment funds did not own a significant■ 56
NOTES TO CONSOLIDATED FINANCIAL STATEMENTS(thousands of dollars unless otherwise indicated)number of shares of the Company’s common stock for anyyear presented.The Company’s annual contribution for its foreign definedcontribution pension plans, which is based on various percentagesof compensation for covered employees up to certainlimits, was $4,621, $3,807 and $3,968 for <strong>2012</strong>, 2011 and 2010,respectively. Assets in employee accounts of the foreign definedcontribution pension plans are invested in various investmentfunds. These investment funds did not own a significantnumber of shares of the Company’s common stock for any yearpresented.Defined benefit pension plans. The Company has onesalaried and one hourly domestic defined benefit pension plan,and fifteen foreign defined benefit pension plans, includingtwo European plans acquired in connection with the 2011 and2010 acquisitions of Leighs Paints and Acroma. All participantsin the domestic salaried defined benefit pension plan prior toJanuary 1, 2002 retain the previous defined benefit formulafor computing benefits with certain modifications for activeemployees. Eligible domestic salaried employees hired orre-hired between January 1, 2002 and September 30, 2011became participants in the revised domestic salaried definedbenefit pension plan upon completion of six months of service.All employees who became participants on or after January 1,2002 and before January 1, 2005 were credited with certaincontribution credits equivalent to six percent of their salary. Allemployees who became participants on or after January 1, 2005were credited with certain contribution credits that range fromtwo percent to seven percent of compensation based on an ageand service formula. Effective July 1, 2009, the domestic salarieddefined benefit pension plan was revised, and all employees whobecome participants on or after January 1, 2002 were creditedwith certain contribution credits that range from two percentto seven percent of compensation based on an age and serviceformula. Contribution credits are converted into units to accountfor each participant’s benefits. Participants will receive a variableannuity benefit upon retirement or a lump sum distribution upontermination (if vested). The variable annuity benefit is subject tothe hypothetical returns achieved on each participant’s allocationof units from investments in various investment funds as directedby the participant. Contribution credits to the revised domesticsalaried defined benefit pension plan are being funded throughexisting plan assets. Effective October 1, 2011, the domesticsalaried defined benefit pension plan was frozen for new hires,and all newly hired U.S. non-collectively bargained employeesare eligible to participate in the Company’s domestic definedcontribution plan.At December 31, <strong>2012</strong>, the domestic salaried defined benefitpension plan was overfunded, with a projected benefit obligationof $313,964, fair value of plan assets of $559,552 and excess planassets of $245,588. The domestic hourly defined benefit pensionplan was underfunded, with a projected benefit obligation of$152,863, fair value of plan assets of $144,011 and a deficiencyof plan assets of $8,852. The plans are funded in accordancewith all applicable regulations at December 31, <strong>2012</strong> and nofunding will be required in 2013. At December 31, 2011, thedomestic salaried defined benefit pension plan was overfunded,with a projected benefit obligation of $269,314, fair value of planassets of $487,990 and excess plan assets of $218,676, and thedomestic hourly defined benefit pension plan was underfunded,with a projected benefit obligation of $140,715, fair value of planassets of $126,473 and a deficiency of plan assets of $14,242.At December 31, 2010, the domestic salaried defined benefitpension plan was overfunded, with a projected benefit obligationof $261,996, fair value of plan assets of $502,707 and excessplan assets of $240,711, and the domestic hourly defined benefitpension plan was overfunded, with a projected benefit obligationof $128,261, fair value of plan assets of $132,018 and excess planassets of $3,757.At December 31, <strong>2012</strong>, twelve of the Company’s foreigndefined benefit pension plans were unfunded or underfunded,with combined projected benefit obligations, fair values of netassets and deficiencies of plan assets of $105,045, $65,026 and$40,019, respectively. An increase of $27,294 from 2011 in thecombined projected benefit obligations of all foreign definedbenefit pension plans was primarily due to changes in planassumptions.The Company expects to make the following benefit paymentsfor all domestic and foreign defined benefit pension plans:$41,784 in 2013; $42,435 in 2014; $43,457 in 2015; $43,631 in2016; $43,992 in 2017; and $225,564 in 2018 through 2022.The estimated net actuarial losses and prior service (credits)for the defined benefit pension plans that are expected to beamortized from Cumulative other comprehensive loss into thenet pension costs in 2013 are $15,111 and $(310), respectively.The following table summarizes the components of the netpension costs and Cumulative other comprehensive loss relatedto the defined benefit pension plans:■ 57
NOTES TO CONSOLIDATED FINANCIAL STATEMENTS(thousands of dollars unless otherwise indicated)DomesticDefined Benefit Pension PlansForeignDefined Benefit Pension Plans<strong>2012</strong> 2011 2010 <strong>2012</strong> 2011 2010Net pension costs:Service costs ............................................................................... $ 19,061 $ 17,933 $ 16,906 $ 3,654 $ 3,055 $ 2,061Interest costs .............................................................................. 17,442 18,602 18,028 6,927 5,954 4,266Expected returns on plan assets .......................................... (44,841) (46,441) (42,311) (6,799) (5,535) (2,842)Amortization of prior service costs ..................................... 1,591 1,635 1,661 29Amortization of actuarial losses .......................................... 22,205 16,865 18,943 1,022 493 1,363Ongoing pension costs ....................................................... 15,458 8,594 13,227 4,804 3,967 4,877Settlement costs (credits) ...................................................... 47 (235)Net pension costs ................................................................. 15,458 8,594 13,227 4,851 3,732 4,877Other changes in plan assets and projected benefitobligation recognized in Cumulative othercomprehensive loss (before taxes):Net actuarial (gains) losses arising during the year ...... (26,459) 48,745 681 14,131 15,944 (10,043)Prior service costs during the year ...................................... 2,495 1,195Amortization of prior service costs ..................................... (1,591) (1,635) (1,661) (29)Amortization of actuarial losses .......................................... (22,205) (16,865) (18,943) (1,022) (493) (1,363)Exchange rate gain (loss) recognized during the year .. 1,464 (387) (1,536)Total recognized in Cumulative othercomprehensive loss .................................................. (47,760) 31,440 (19,923) 14,573 15,064 (12,971)Total recognized in net pension costs andCumulative other comprehensive loss ............... $ (32,302) $ 40,034 $ (6,696) $ 19,424 $ 18,796 $ (8,094)The Company employs a total return investment approach for the domestic and foreign defined benefit pension plan assets. A mixof equities and fixed income investments are used to maximize the long-term return of assets for a prudent level of risk. In determiningthe expected long-term rate of return on defined benefit pension plan assets, management considers the historical rates of return, thenature of investments and an expectation of future investment strategies. The target allocations for plan assets are 45 – 65 percentequity securities and 30 – 40 percent fixed income securities.■ 58
NOTES TO CONSOLIDATED FINANCIAL STATEMENTS(thousands of dollars unless otherwise indicated)The following tables summarize the fair value of the defined benefit pension plan assets at December 31, <strong>2012</strong>, 2011 and 2010:Fair Value atDecember 31,<strong>2012</strong>Quoted Prices inActive Markets forIdentical Assets(Level 1)Significant OtherObservable Inputs(Level 2)SignificantUnobservable Inputs(Level 3)Investments at fair value:Short-term investments (a) .............. $ 68,795 $ 68,795Equity investments (b) ........................ 490,993 $ 243,553 247,440Fixed income investments (c) ........ 239,558 131,276 108,282Other assets (d) ......................................... 37,230 18,380 $ 18,850$ 836,576 $ 374,829 $ 442,897 $ 18,850Fair Value atDecember 31,2011Quoted Prices inActive Markets forIdentical Assets(Level 1)Significant OtherObservable Inputs(Level 2)SignificantUnobservable Inputs(Level 3)Investments at fair value:Short-term investments (a) .............. $ 9,408 $ 9,408Equity investments (b) ........................ 482,694 $ 268,307 214,387Fixed income investments (c) ........ 202,939 103,485 99,454Other assets (d) ......................................... 37,482 16,582 $ 20,900$ 732,523 $ 371,792 $ 339,831 $ 20,900Fair Value atDecember 31,2010Quoted Prices inActive Markets forIdentical Assets(Level 1)Significant OtherObservable Inputs(Level 2)SignificantUnobservable Inputs(Level 3)Investments at fair value:Short-term investments (a) .............. $ 33,050 $ 33,050Equity investments (b) ........................ 463,108 $ 257,616 205,492Fixed income investments (c) ........ 185,163 101,227 78,401 $ 5,535Other assets (d) ......................................... 19,152 19,152$ 700,473 $ 358,843 $ 316,943 $ 24,687(a) This category includes a full range of high quality, short-term money market securities.(b) This category includes actively managed equity assets that track primarily to the S&P 500.(c) This category includes government and corporate bonds that track primarily to the Barclays Capital Aggregate Bond Index.(d) This category consists of venture capital funds.The following tables summarize the changes in the fair value of the defined benefit pension plan assets classified as level 3 atDecember 31, <strong>2012</strong>, 2011 and 2010:Balance atDecember 31,2011 DispositionsRealized andUnrealized GainsBalance atDecember 31,<strong>2012</strong>Other assets ...................................................................... $ 20,900 $ (3,827) $ 1,777 $ 18,850Balance atDecember 31,2010 DispositionsBalance atDecember 31,2011Realized andUnrealized GainsFixed income investments ..................................... $ 5,535 $ (5,717) $ 182Other assets ...................................................................... 19,152 (1,389) 3,137 $ 20,900$ 24,687 $ (7,106) $ 3,319 $ 20,900Balance atJanuary 1,2010 DispositionsBalance atDecember 31,2010Realized andUnrealized GainsFixed income investments ..................................... $ 5,265 $ (269) $ 539 $ 5,535Other assets ...................................................................... 17,728 (695) 2,119 19,152$ 22,993 $ (964) $ 2,658 $ 24,687Included as equity investments in the domestic defined benefit pension plan assets at December 31, <strong>2012</strong> were 300,000 sharesof the Company’s common stock with a market value of $46,146, representing 6.6 percent of total domestic plan assets. Dividendsreceived on the Company’s common stock during <strong>2012</strong> totaled $1,334.■ 59
NOTES TO CONSOLIDATED FINANCIAL STATEMENTS(thousands of dollars unless otherwise indicated)The following table summarizes the obligations, plan assets and assumptions used for the defined benefit pension plans, which areall measured as of December 31:DomesticDefined Benefit Pension PlansForeignDefined Benefit Pension Plans<strong>2012</strong> 2011 2010 <strong>2012</strong> 2011 2010Accumulated benefit obligations atend of year ..................................................................... $ 460,591 $ 415,163 $ 371,195 $ 142,769 $ 121,137 $ 67,964Projected benefit obligations:Balances at beginning of year .................... $ 410,029 $ 390,257 $ 339,275 $ 141,465 $ 85,936 $ 75,175Service costs .......................................................... 19,061 17,933 16,906 3,654 3,055 2,061Interest costs ......................................................... 17,442 18,602 18,028 6,927 5,954 4,266Actuarial losses (gains) .................................. 48,346 8,428 41,739 17,532 11,395 (6,950)Acquisitions of businesses and other ... 2,496 1,194 (975) 42,131 14,378Effect of foreign exchange ............................ 6,633 (3,760) (1,063)Benefits paid .......................................................... (30,547) (26,385) (25,691) (6,478) (3,246) (1,931)Balances at end of year ................................... 466,827 410,029 390,257 168,758 141,465 85,936Plan assets:Balances at beginning of year ..................... 614,463 634,725 577,047 118,060 65,748 55,870Actual returns on plan assets ...................... 119,647 6,123 83,369 10,201 987 5,935Acquisitions of businesses and other .... 6,205 57,761 7,085Effect of foreign exchange ............................. 5,025 (3,190) (1,211)Benefits paid ........................................................... (30,547) (26,385) (25,691) (6,478) (3,246) (1,931)Balances at end of year .................................... 703,563 614,463 634,725 133,013 118,060 65,748Excess (deficient) plan assets overprojected benefit obligations ........................... $ 236,736 $ 204,434 $ 244,468 $ (35,745) $ (23,405) $ (20,188)Assets and liabilities recognized in theConsolidated Balance Sheets:Deferred pension assets ................................. $ 245,588 $ 218,676 $ 244,468 $ 4,323 $ 9,674 $ 3,865Other accruals ....................................................... (869) (829) (272)Other long-term liabilities ............................ (8,852) (14,242) (39,199) (32,250) (23,781)$ 236,736 $ 204,434 $ 244,468 $ (35,745) $ (23,405) $ (20,188)Amounts recognized in Cumulativeother comprehensive loss:Net actuarial losses ........................................... $ (163,088) $ (211,752) $ (179,871) $ (41,567) $ (26,994) $ (11,930)Prior service costs .............................................. (6,110) (5,206) (5,647)$ (169,198) $ (216,958) $ (185,518) $ (41,567) $ (26,994) $ (11,930)Weighted-average assumptions used todetermine projected benefit obligations:Discount rate .......................................................... 3.73% 4.40% 4.97% 4.58% 4.94% 5.45%Rate of compensation increase ................. 4.00% 4.00% 4.00% 4.08% 4.05% 4.06%Weighted-average assumptions used todetermine net pension costs:Discount rate .......................................................... 4.40% 4.97% 5.50% 4.94% 5.48% 5.57%Expected long-term rate of returnon assets ............................................................... 7.50% 7.50% 7.50% 6.04% 6.12% 5.46%Rate of compensation increase ................. 4.00% 4.00% 4.00% 4.04% 4.06% 3.74%Postretirement Benefits Other Than Pensions.Employees of the Company hired in the United States prior toJanuary 1, 1993 who are not members of a collective bargainingunit, and certain groups of employees added through acquisitions,are eligible for health care and life insurance benefitsupon retirement, subject to the terms of the unfunded plans.There were 4,402, 4,436 and 4,768 retired employees entitled toreceive such postretirement benefits at December 31, <strong>2012</strong>, 2011and 2010, respectively.■ 60
NOTES TO CONSOLIDATED FINANCIAL STATEMENTS(thousands of dollars unless otherwise indicated)The following table summarizes the obligation and the assumptions used for postretirement benefits other than pensions:Postretirement Benefits Other than Pensions<strong>2012</strong> 2011 2010Benefit obligation:Balance at beginning of year - unfunded ...................................................... $ 316,795 $ 315,572 $ 300,526Service cost ............................................................................................................ 2,943 3,495 3,532Interest cost ........................................................................................................... 13,520 15,580 16,066Actuarial loss (gain) ............................................................................................ 18,961 (3,965) 11,067Benefits paid .......................................................................................................... (14,085) (13,887) (15,619)Balance at end of year - unfunded .................................................................. $ 338,134 $ 316,795 $ 315,572Liabilities recognized in the Consolidated Balance Sheets:Postretirement benefits other than pensions ............................................. $ (320,223) $ (297,528) $ (295,896)Other accruals ...................................................................................................... (17,911) (19,267) (19,676)$ (338,134) $ (316,795) $ (315,572)Amounts recognized in Cumulative other comprehensive loss:Net actuarial losses ............................................................................................. $ (62,814) $ (45,567) $ (52,037)Prior service costs ............................................................................................... 328 983 1,640$ (62,486) $ (44,584) $ (50,397)Weighted-average assumptions used to determine benefit obligation:Discount rate ......................................................................................................... 3.70% 4.40% 5.10%Health care cost trend rate - pre-65 .............................................................. 8.00% 8.00% 7.50%Health care cost trend rate - post-65 ............................................................ 8.00% 8.00% 7.50%Prescription drug cost increases ..................................................................... 8.00% 8.00% 8.00%Weighted-average assumptions used to determine net periodicbenefit cost:Discount rate ......................................................................................................... 4.40% 5.10% 5.50%Health care cost trend rate - pre-65 .............................................................. 8.00% 7.50% 8.00%Health care cost trend rate - post-65 ............................................................ 8.00% 7.50% 8.00%Prescription drug cost increases ..................................................................... 8.00% 8.00% 9.00%The following table summarizes the components of the net periodic benefit cost and cumulative other comprehensive loss relatedto postretirement benefits other than pensions:Postretirement Benefits Other than Pensions<strong>2012</strong> 2011 2010Net periodic benefit cost:Service cost .......................................................................................................... $ 2,943 $ 3,495 $ 3,532Interest cost ......................................................................................................... 13,520 15,580 16,066Amortization of actuarial losses ................................................................... 1,715 2,505 1,304Amortization of prior service credit ............................................................ (656) (657) (656)Net periodic benefit cost ............................................................................ 17,522 20,923 20,246Other changes in projected benefit obligation recognized inCumulative other comprehensive loss (before taxes):Net actuarial loss (gain) .................................................................................. 18,961 (3,965) 11,067Amortization of actuarial losses ................................................................... (1,715) (2,505) (1,304)Amortization of prior service credit ............................................................ 656 657 656Total recognized in Cumulative other comprehensive loss ............ 17,902 (5,813) 10,419Total recognized in net periodic benefit cost andCumulative other comprehensive loss ............................................. $ 35,424 $ 15,110 $ 30,665The estimated net actuarial loss and prior service credit forpostretirement benefits other than pensions that are expected tobe amortized from Cumulative other comprehensive loss into netperiodic benefit cost in 2013 are $3,934 and $(328), respectively.The assumed health care cost trend rate and prescriptiondrug cost increases used to determine the net periodic benefitcost for postretirement health care benefits for 2013 both decreasein each successive year until reaching 5.0 percent in 2019.■ 61
NOTES TO CONSOLIDATED FINANCIAL STATEMENTS(thousands of dollars unless otherwise indicated)The assumed health care and prescription drug cost trend rateshave a significant effect on the amounts reported for the postretirementhealth care benefit obligation. A one-percentage-pointchange in assumed health care and prescription drug cost trendrates would have had the following effects at December 31, <strong>2012</strong>:One-Percentage-PointIncrease (Decrease)Effect on total of service andinterest cost components .................... $ 117 $ (124)Effect on the postretirementbenefit obligation ...................................... $ 2,938 $ (3,039)The Medicare Prescription Drug, Improvement andModernization Act of 2003 (the Medicare Act) introduced aprescription drug benefit under Medicare (Medicare Part D) aswell as a federal subsidy to sponsors of retiree health care benefitplans that provide a benefit that is at least actuarially equivalentto Medicare Part D. In accordance with the accounting guidancerelated to the Medicare Act included in the Retirement BenefitsTopic of the ASC, the effects of the federal subsidy resulted ina $21,400 reduction of the accumulated postretirement benefitobligation for benefits attributed to past service, which is beingrecognized prospectively beginning July 1, 2004. During <strong>2012</strong>,this recognition resulted in a $5,712 reduction of the net periodicbenefit cost, which consisted of changes in actuarial experienceand reductions in interest cost of $5,278 and $434, respectively.During 2011, this recognition resulted in a $7,073 reductionof the net periodic benefit cost, which consisted of changes inactuarial experience and reductions in interest cost of $6,831 and$242, respectively. During 2010, this recognition resulted in a$4,170 reduction of the net periodic benefit cost, which consistedof reductions in interest cost, amortization of changes inactuarial experience and service cost of $1,973, $1,852 and $345,respectively. The initial effects of the federal subsidy attributableto past service have been fully recognized.In the first quarter of 2010, the Patient Protection andAffordable Care Act and the Health Care and EducationReconciliation Act of 2010 (the “Acts”) were enacted and becameU.S. law. The Acts eliminated the tax deduction previouslyallowed for the Medicare Part D subsidy beginning in years afterDecember 31, <strong>2012</strong>. The Company recognized the deferred taxeffects of the reduced deductibility of the subsidy during the firstquarter of 2010. The resulting one-time increase in income taxesof $11,400 reduced 2010 basic and diluted earnings per share by$.11 and $.10, respectively.The Company expects to make retiree health care benefitcash payments and to receive Medicare Part D prescription cashreimbursements as follows:RetireeHealth Care BenefitsMedicare PrescriptionReimbursementExpected CashPayments - Net2013 ............................................................................................................... $ 20,087 $ (2,176) $ 17,9112014 ............................................................................................................... 21,324 (2,357) 18,9672015 ............................................................................................................... 22,305 (2,531) 19,7742016 ............................................................................................................... 23,011 (2,698) 20,3132017 ............................................................................................................... 23,357 (680) 22,6772018 through 2022 ............................................................................. 114,784 (2,187) 112,597Total expected benefit cash payments ................................. $ 224,868 $ (12,629) $ 212,239NOTE 7 – DEBTLong-term debtDue Date <strong>2012</strong> 2011 20101.35% Senior Notes ........................................................................... 2017 $ 699,0913.125% Senior Notes ........................................................................ 2014 499,912 $ 499,867 $ 499,8224.00% Senior Notes ......................................................................... 2042 298,4937.375% Debentures ........................................................................... 2027 129,060 129,056 129,0537.45% Debentures .............................................................................. 2097 3,500 3,500 3,5002.00% to 2.02% Promissory Notes ....................................... Through 2023 2,109 6,808 15,951$ 1,632,165 $ 639,231 $ 648,326Maturities of long-term debt are as follows for the next five years: $3,689 in 2013; $500,488 in 2014; $325 in 2015; $146 in 2016and $700,149 in 2017. Interest expense on long-term debt was $36,188, $31,883 and $64,442 for <strong>2012</strong>, 2011 and 2010, respectively.Among other restrictions, the Company’s Notes, Debenturesand revolving credit agreement contain certain covenantsrelating to liens, ratings changes, merger and sale of assets,consolidated leverage and change of control as defined in theagreements. In the event of default under any one of thesearrangements, acceleration of the maturity of any one or more ofthese borrowings may result. The Company was in compliancewith all covenants for all years presented.On December 4, <strong>2012</strong>, the Company issued $700,000 of1.35% Senior Notes due 2017 and $300,000 of 4.00% Senior■ 62
NOTES TO CONSOLIDATED FINANCIAL STATEMENTS(thousands of dollars unless otherwise indicated)Notes due 2042. The Senior Notes are covered under a shelfregistration filed with the Securities and Exchange Commission(SEC) on December 16, 2009. The proceeds will be used forgeneral corporate purposes, including repayment of short-termborrowings and financing acquisitions.During 2010, the Company repurchased $136,500 of itspublicly traded 7.45% Debentures due 2097. Costs related to therepurchase increased interest expense by $24,165.Short-term borrowings. At December 31, <strong>2012</strong>, there wereno borrowings outstanding under the domestic commercialpaper program. At December 31, 2011 and 2010, borrowingsoutstanding under the domestic commercial paper programtotaled $264,902 and $173,490, respectively, and were includedin Short-term borrowings. The weighted-average interest raterelated to these borrowings was 0.2% at December 31, 2011 and2010. Borrowings outstanding under various foreign programsof $69,035, $81,375 and $215,102 at December 31, <strong>2012</strong>, 2011and 2010, respectively, were included in Short-term borrowings.The weighted-average interest rate related to these borrowingswas 2.8%, 4.9% and 2.9% at December 31, <strong>2012</strong>, 2011 and 2010,respectively.On July 19, 2010, <strong>Sherwin</strong>-<strong>Williams</strong> Luxembourg S.à r.l.,a wholly-owned subsidiary of the Company, entered into a€200,000 (Euro) credit facility. On December 28, 2010, theCompany reduced the aggregate amount of this credit facilityto €150,000 (Euro). During 2011, the aggregate amount ofthis credit facility was further reduced to €97,000 (Euro). OnSeptember 19, <strong>2012</strong>, this credit facility was replaced by a new€95,000 (Euro) five-year revolving credit facility. On July 19,2010, <strong>Sherwin</strong>-<strong>Williams</strong> Canada Inc., a wholly-owned subsidiaryof the Company, entered into a CAD 75,000 credit facility. OnJune 29, <strong>2012</strong>, this credit facility was replaced by a new CAD75,000 five-year credit facility. These credit facilities are beingused for general corporate purposes, including refinancingindebtedness and for acquisitions.On January 30, <strong>2012</strong>, the Company entered into a five-yearcredit agreement, subsequently amended on multiple dates,which gives the Company the right to borrow and to obtain theissuance, renewal, extension and increase of a letter of credit ofup to an aggregate availability of $500,000. On April 23, <strong>2012</strong>,the Company entered into a five-year credit agreement, subsequentlyamended on multiple dates, which gives the Companythe right to borrow and to obtain the issuance, renewal, extensionand increase of a letter of credit up to an aggregate availability of$250,000. On November 14, <strong>2012</strong>, the Company entered into athree-year credit agreement, subsequently amended on multipledates, which gives the Company the right to borrow and to obtainthe issuance, renewal, extension and increase of a letter of creditup to an aggregate availability of $250,000. The three creditagreements entered into in <strong>2012</strong> replace prior credit facilitiesthat matured in <strong>2012</strong> and 2011. At December 31, <strong>2012</strong>, 2011 and2010, there were no borrowings outstanding under any of thesecredit agreements.The Company uses a revolving credit agreement primarily tosatisfy its commercial paper program’s dollar for dollar liquidityrequirement. On January 8, 2010, the Company terminated theexisting $845,000 revolving credit agreement and entered intoa new $500,000 revolving credit agreement. On July 8, 2011,the Company entered into a new five-year $1.05 billion revolvingcredit agreement, which replaced the existing three-year$500,000 credit agreement. The new credit agreement allowsthe Company to extend the maturity of the facility with twoone-year extension options and to increase the aggregate amountof the facility to $1.30 billion, both of which are subject to thediscretion of each lender.NOTE 8 – OTHER LONG-TERM LIABILITIESThe operations of the Company, like those of other companiesin our industry, are subject to various domestic and foreignenvironmental laws and regulations. These laws and regulationsnot only govern current operations and products, but alsoimpose potential liability on the Company for past operations.Management expects environmental laws and regulations toimpose increasingly stringent requirements upon the Companyand the industry in the future. Management believes that theCompany conducts its operations in compliance with applicableenvironmental laws and regulations and has implemented variousprograms designed to protect the environment and promotecontinued compliance.The Company is involved with environmental investigationand remediation activities at some of its currently and formerlyowned sites (including sites which were previously ownedand/or operated by businesses acquired by the Company). Inaddition, the Company, together with other parties, has beendesignated a potentially responsible party under federal andstate environmental protection laws for the investigation andremediation of environmental contamination and hazardouswaste at a number of third-party sites, primarily Superfundsites. In general, these laws provide that potentially responsibleparties may be held jointly and severally liable for investigationand remediation costs regardless of fault. The Company may besimilarly designated with respect to additional third-party sitesin the future.The Company initially provides for estimated costs ofenvironmental-related activities relating to its past operationsand third-party sites for which commitments or clean-up planshave been developed and when such costs can be reasonablyestimated based on industry standards and professionaljudgment. These estimated costs are determined based oncurrently available facts regarding each site. If the best estimate■ 63
NOTES TO CONSOLIDATED FINANCIAL STATEMENTS(thousands of dollars unless otherwise indicated)of costs can only be identified as a range and no specific amountwithin that range can be determined more likely than any otheramount within the range, the minimum of the range is provided.The Company continuously assesses its potential liability forinvestigation and remediation-related activities and adjustsits environmental-related accruals as information becomesavailable upon which more accurate costs can be reasonablyestimated and as additional accounting guidelines are issued.Included in Other long-term liabilities at December 31, <strong>2012</strong>,2011, and 2010 were accruals for extended environmentalrelatedactivities of $97,220, $89,266 and $89,562, respectively.Included in Other accruals at December 31, <strong>2012</strong>, 2011, and2010 were accruals for estimated costs of current investigationand remediation activities of $17,101, $42,847 and $60,048,respectively.Actual costs incurred may vary from the accrued estimatesdue to the inherent uncertainties involved including, amongothers, the number and financial condition of parties involvedwith respect to any given site, the volumetric contribution whichmay be attributed to the Company relative to that attributed toother parties, the nature and magnitude of the wastes involved,the various technologies that can be used for remediation andthe determination of acceptable remediation with respect toa particular site. If the Company’s future loss contingency isultimately determined to be at the unaccrued maximum of theestimated range of possible outcomes for every site for whichcosts can be reasonably estimated, the Company’s accrual forenvironmental-related activities would be $88,671 higher thanthe minimum accruals at December 31, <strong>2012</strong>.Two of the Company’s currently and formerly ownedmanufacturing sites account for the majority of the accrual forenvironmental-related activities and the unaccrued maximumof the estimated range of possible outcomes at December 31,<strong>2012</strong>. At December 31, <strong>2012</strong>, $59,132, or 51.7 percent of thetotal accrual, related directly to these two sites. In the aggregateunaccrued maximum of $88,671 at December 31, <strong>2012</strong>, $56,952,or 64.2 percent, related to the two manufacturing sites. Whileenvironmental investigations and remedial actions are indifferent stages at these sites, additional investigations, remedialactions and monitoring will likely be required at each site.Management cannot presently estimate the ultimatepotential loss contingencies related to these sites or other lesssignificant sites until such time as a substantial portion of theinvestigation at the sites is completed and remedial action plansare developed. In the event any future loss contingency significantlyexceeds the current amount accrued, the recording of theultimate liability may result in a material impact on net incomefor the annual or interim period during which the additionalcosts are accrued. Management does not believe that anypotential liability ultimately attributed to the Company for itsenvironmental-related matters will have a material adverse effecton the Company’s financial condition, liquidity, or cash flowdue to the extended period of time during which environmentalinvestigation and remediation takes place. An estimate of thepotential impact on the Company’s operations cannot be madedue to the aforementioned uncertainties.Management expects these contingent environmentalrelatedliabilities to be resolved over an extended period of time.Management is unable to provide a more specific time framedue to the indefinite amount of time to conduct investigationactivities at any site, the indefinite amount of time to obtainenvironmental agency approval, as necessary, with respectto investigation and remediation activities, and the indefiniteamount of time necessary to conduct remediation activities.The Asset Retirement and Environmental ObligationsTopic of the ASC requires a liability to be recognized for the fairvalue of a conditional asset retirement obligation if a settlementdate and fair value can be reasonably estimated. The Companyrecognizes a liability for any conditional asset retirementobligation when sufficient information is available to reasonablyestimate a settlement date to determine the fair value of such aliability. The Company has identified certain conditional assetretirement obligations at various current and closed manufacturing,distribution and store facilities. These obligations relateprimarily to asbestos abatement, hazardous waste ResourceConservation and Recovery Act (RCRA) closures, well abandonment,transformers and used oil disposals and undergroundstorage tank closures. Using investigative, remediation anddisposal methods that are currently available to the Company,the estimated costs of these obligations were accrued and arenot significant. The recording of additional liabilities for futureconditional asset retirement obligations may result in a materialimpact on net income for the annual or interim period duringwhich the costs are accrued. Management does not believe thatany potential liability ultimately attributed to the Company forits conditional asset retirement obligations will have a materialadverse effect on the Company’s financial condition, liquidity,or cash flow due to the extended period of time over which sufficientinformation may become available regarding the closureor modification of any one or group of the Company’s facilities.An estimate of the potential impact on the Company’s operationscannot be made due to the aforementioned uncertainties.NOTE 9 – LITIGATIONIn the course of its business, the Company is subject to avariety of claims and lawsuits, including, but not limited to, litigationrelating to product liability and warranty, personal injury,environmental, intellectual property, commercial, contractualand antitrust claims that are inherently subject to many uncertaintiesregarding the possibility of a loss to the Company. These■ 64
NOTES TO CONSOLIDATED FINANCIAL STATEMENTS(thousands of dollars unless otherwise indicated)uncertainties will ultimately be resolved when one or morefuture events occur or fail to occur confirming the incurrence ofa liability or the reduction of a liability. In accordance with theContingencies Topic of the ASC, the Company accrues for thesecontingencies by a charge to income when it is both probablethat one or more future events will occur confirming the fact ofa loss and the amount of the loss can be reasonably estimated.In the event that the Company’s loss contingency is ultimatelydetermined to be significantly higher than currently accrued,the recording of the additional liability may result in a materialimpact on the Company’s results of operations, liquidity orfinancial condition for the annual or interim period during whichsuch additional liability is accrued. In those cases where noaccrual is recorded because it is not probable that a liability hasbeen incurred and the amount of any such loss cannot be reasonablyestimated, any potential liability ultimately determined to beattributable to the Company may result in a material impact onthe Company’s results of operations, liquidity or financial conditionfor the annual or interim period during which such liability isaccrued. In those cases where no accrual is recorded or exposureto loss exists in excess of the amount accrued, the ContingenciesTopic of the ASC requires disclosure of the contingency whenthere is a reasonable possibility that a loss or additional loss mayhave been incurred.Lead pigment and lead-based paint litigation. TheCompany’s past operations included the manufacture and saleof lead pigments and lead-based paints. The Company, alongwith other companies, is and has been a defendant in a numberof legal proceedings, including individual personal injuryactions, purported class actions, and actions brought by variouscounties, cities, school districts and other government-relatedentities, arising from the manufacture and sale of lead pigmentsand lead-based paints. The plaintiffs’ claims have been basedupon various legal theories, including negligence, strict liability,breach of warranty, negligent misrepresentations and omissions,fraudulent misrepresentations and omissions, concert of action,civil conspiracy, violations of unfair trade practice and consumerprotection laws, enterprise liability, market share liability, publicnuisance, unjust enrichment and other theories. The plaintiffsseek various damages and relief, including personal injury andproperty damage, costs relating to the detection and abatementof lead-based paint from buildings, costs associated with a publiceducation campaign, medical monitoring costs and others. TheCompany is also a defendant in legal proceedings arising fromthe manufacture and sale of non-lead-based paints that seekrecovery based upon various legal theories, including the failureto adequately warn of potential exposure to lead during surfacepreparation when using non-lead-based paint on surfacespreviously painted with lead-based paint. The Company believesthat the litigation brought to date is without merit or subject tomeritorious defenses and is vigorously defending such litigation.The Company has not settled any lead pigment or lead-basedpaint litigation. The Company expects that additional leadpigment and lead-based paint litigation may be filed against theCompany in the future asserting similar or different legal theoriesand seeking similar or different types of damages and relief.Notwithstanding the Company’s views on the merits,litigation is inherently subject to many uncertainties, and theCompany ultimately may not prevail. Adverse court rulings ordeterminations of liability, among other factors, could affectthe lead pigment and lead-based paint litigation against theCompany and encourage an increase in the number and natureof future claims and proceedings. In addition, from time to time,various legislation and administrative regulations have beenenacted, promulgated or proposed to impose obligations on presentand former manufacturers of lead pigments and lead-basedpaints respecting asserted health concerns associated with suchproducts or to overturn the effect of court decisions in which theCompany and other manufacturers have been successful.Due to the uncertainties involved, management is unableto predict the outcome of the lead pigment and lead-basedpaint litigation, the number or nature of possible future claimsand proceedings, or the effect that any legislation and/oradministrative regulations may have on the litigation or againstthe Company. In addition, management cannot reasonablydetermine the scope or amount of the potential costs andliabilities related to such litigation, or resulting from any suchlegislation and regulations. The Company has not accrued anyamounts for such litigation. With respect to such litigation,including the public nuisance litigation, the Company does notbelieve that it is probable that a loss has occurred, and it is notpossible to estimate the range of potential losses as there is noprior history of a loss of this nature and there is no substantiveinformation upon which an estimate could be based. In addition,any potential liability that may result from any changes tolegislation and regulations cannot reasonably be estimated. Inthe event any significant liability is determined to be attributableto the Company relating to such litigation, the recordingof the liability may result in a material impact on net incomefor the annual or interim period during which such liability isaccrued. Additionally, due to the uncertainties associated withthe amount of any such liability and/or the nature of any otherremedy which may be imposed in such litigation, any potentialliability determined to be attributable to the Company arisingout of such litigation may have a material adverse effect on theCompany’s results of operations, liquidity or financial condition.An estimate of the potential impact on the Company’s results ofoperations, liquidity or financial condition cannot be made due tothe aforementioned uncertainties.■ 65
NOTES TO CONSOLIDATED FINANCIAL STATEMENTS(thousands of dollars unless otherwise indicated)Public nuisance claim litigation. The Company and othercompanies are or were defendants in legal proceedings seekingrecovery based on public nuisance liability theories, among othertheories, brought by the State of Rhode Island, the City of St.Louis, Missouri, various cities and counties in the State of NewJersey, various cities in the State of Ohio and the State of Ohio,the City of Chicago, Illinois, the City of Milwaukee, Wisconsinand the County of Santa Clara, California and other publicentities in the State of California. Except for the Santa ClaraCounty, California proceeding, all of these legal proceedings havebeen concluded in favor of the Company and other defendants atvarious stages in the proceedings.The proceedings initiated by the State of Rhode Islandincluded two jury trials. At the conclusion of the second trial, thejury returned a verdict finding that (i) the cumulative presenceof lead pigment in paints and coatings on buildings in the Stateof Rhode Island constitutes a public nuisance, (ii) the Company,along with two other defendants, caused or substantiallycontributed to the creation of the public nuisance, and (iii) theCompany and two other defendants should be ordered to abatethe public nuisance. The Company and two other defendantsappealed and, on July 1, 2008, the Rhode Island Supreme Court,among other determinations, reversed the judgment of abatementwith respect to the Company and two other defendants.The Rhode Island Supreme Court’s decision reversed the publicnuisance liability judgment against the Company on the basisthat the complaint failed to state a public nuisance claim as amatter of law.The Santa Clara County, California proceeding was initiatedin March 2000 in the Superior Court of the State of California,County of Santa Clara. In the original complaint, the plaintiffsasserted various claims including fraud and concealment, strictproduct liability/failure to warn, strict product liability/designdefect, negligence, negligent breach of a special duty, public nuisance,private nuisance, and violations of California’s Businessand Professions Code. A number of the asserted claims wereresolved in favor of the defendants through pre-trial proceedings.The named plaintiffs in the Fourth Amended Complaint, filedon March 16, 2011, are the Counties of Santa Clara, Alameda,Los Angeles, Monterey, San Mateo, Solano and Ventura, andthe Cities of Oakland, San Diego and San Francisco. The FourthAmended Complaint asserts a sole claim for public nuisance,alleging that the presence of lead products for use in paint andcoatings in, on and around buildings in the plaintiffs’ jurisdictionsconstitutes a public nuisance. The plaintiffs seek the abatementof the alleged public nuisance that exists within the plaintiffs’jurisdictions. A trial is currently scheduled to begin in June 2013.Litigation seeking damages from alleged personalinjury. The Company and other companies are defendants ina number of legal proceedings seeking monetary damages andother relief from alleged personal injuries. These proceedingsinclude claims by children allegedly injured from ingestionof lead pigment or lead-containing paint, claims for damagesallegedly incurred by the children’s parents or guardians, andclaims for damages allegedly incurred by professional paintingcontractors. These proceedings generally seek compensatoryand punitive damages, and seek other relief including medicalmonitoring costs. These proceedings include purported claimsby individuals, groups of individuals and class actions.The plaintiff in Thomas v. Lead Industries Association,et al., initiated an action in state court against the Company,other alleged former lead pigment manufacturers and the LeadIndustries Association in September 1999. The claims againstthe Company and the other defendants included strict liability,negligence, negligent misrepresentation and omissions, fraudulentmisrepresentation and omissions, concert of action, civilconspiracy and enterprise liability. Implicit within these claimsis the theory of “risk contribution” liability (Wisconsin’s theorywhich is similar to market share liability) due to the plaintiff’s inabilityto identify the manufacturer of any product that allegedlyinjured the plaintiff. The case ultimately proceeded to trial and,on November 5, 2007, the jury returned a defense verdict, findingthat the plaintiff had ingested white lead carbonate, but was notbrain damaged or injured as a result. The plaintiff appealed and,on December 16, 2010, the Wisconsin Court of Appeals affirmedthe final judgment in favor of the Company and other defendants.Wisconsin is the only jurisdiction to date to apply a theory ofliability with respect to alleged personal injury (i.e., risk contribution/marketshare liability) that does not require the plaintiff toidentify the manufacturer of the product that allegedly injuredthe plaintiff in the lead pigment and lead-based paint litigation.Although the risk contribution liability theory was applied duringthe Thomas trial, the constitutionality of this theory as appliedto the lead pigment cases has not been judicially determinedby the Wisconsin state courts. However, in an unrelatedaction filed in the United States District Court for the EasternDistrict of Wisconsin, Gibson v. American Cyanamid, et al., onNovember 15, 2010, the District Court held that Wisconsin’s riskcontribution theory as applied in that case violated the defendants’right to substantive due process and is unconstitutionallyretroactive. The District Court’s decision in Gibson v. AmericanCyanamid, et al., has been appealed by the plaintiff.Insurance coverage litigation. The Company and itsliability insurers, including certain Underwriters at Lloyd’s ofLondon, initiated legal proceedings against each other to primarilydetermine, among other things, whether the costs and liabilitiesassociated with the abatement of lead pigment are coveredunder certain insurance policies issued to the Company. TheCompany’s action, filed on March 3, 2006 in the Common PleasCourt, Cuyahoga County, Ohio, is currently stayed and inactive.■ 66
NOTES TO CONSOLIDATED FINANCIAL STATEMENTS(thousands of dollars unless otherwise indicated)The liability insurers’ action, which was filed on February 23,2006 in the Supreme Court of the State of New York, County ofNew York, has been dismissed. An ultimate loss in the insurancecoverage litigation would mean that insurance proceedscould be unavailable under the policies at issue to mitigate anyultimate abatement related costs and liabilities. The Companyhas not recorded any assets related to these insurance policies orotherwise assumed that proceeds from these insurance policieswould be received in estimating any contingent liability accrual.Therefore, an ultimate loss in the insurance coverage litigationwithout a determination of liability against the Company in thelead pigment or lead-based paint litigation will have no impacton the Company’s results of operation, liquidity or financialcondition. As previously stated, however, the Company has notaccrued any amounts for the lead pigment or lead-based paintlitigation and any significant liability ultimately determined to beattributable to the Company relating to such litigation may resultin a material impact on the Company’s results of operations,liquidity or financial condition for the annual or interim periodduring which such liability is accrued.<strong>2012</strong> Subsequent Event - DOL Settlement. On February20, 2013, the Company reached a settlement with the DOL of thepreviously disclosed investigation of transactions related to theESOP that were implemented on August 1, 2006 and August 27,2003. The DOL had notified the Company, certain current andformer directors of the Company and the ESOP trustee of potentialenforcement claims asserting breaches of fiduciary obligations.The DOL sought compensatory and equitable remedies,including monetary damages to the ESOP for alleged losses tothe ESOP relating to third-party valuation of the Company’sconvertible serial preferred stock. The Company believes thatthe DOL’s claims are subject to meritorious defenses, however,the Company’s management and Board of Directors havedecided that it would be in the best interest of the Company andits shareholders to avoid potentially costly litigation and enterinto this settlement to resolve these claims.The Company agreed to resolve all ESOP related claims withthe DOL by making a one-time payment of $80,000 to the ESOPand has recorded a $49,163 after tax charge to earnings. Inaccordance with U.S. generally accepted accounting principles,the Company is required to recognize this subsequent event in its<strong>2012</strong> fiscal year results since this subsequent event is related toconditions that existed at the balance sheet date of December 31,<strong>2012</strong>. The Company’s financial results for the quarter and yearended December 31, <strong>2012</strong>, which were set forth in the Company’searnings release issued on January 31, 2013 and furnished onthe Company’s Current <strong>Report</strong> on Form 8-K dated January31, 2013, have been revised and furnished on the Company’sCurrent <strong>Report</strong> on Form 8-K dated February 20, 2013 to reflectthis subsequent event. As a result of recording this accrual in theAdministrative segment, Cost of goods sold increased $16,000and Selling, general and administrative expense increased$64,000 while income tax expense decreased $30,837 anddiluted net income per common share decreased $.47 per sharefor both the quarter and year ended December 31, <strong>2012</strong>.NOTE 10 – CAPITAL STOCKAt December 31, <strong>2012</strong>, there were 300,000,000 shares ofcommon stock and 30,000,000 shares of serial preferred stockauthorized for issuance. Of the authorized serial preferred stock,3,000,000 shares are designated as cumulative redeemable serialpreferred and 1,000,000 shares are designated as convertibleserial preferred stock. See Note 11. Effective April 21, 2010, the2006 Equity and Performance Incentive Plan (2006 EmployeePlan) was amended and restated to increase the number ofcommon shares that may be issued or transferred by 9,200,000shares to 19,200,000 shares. See Note 12. An aggregate of13,558,565, 18,013,429 and 19,835,391 shares of common stockat December 31, <strong>2012</strong>, 2011 and 2010, respectively, were reservedfor future grants of restricted stock and the exercise and futuregrants of option rights. See Note 12. Common shares outstandingshown in the following table included 484,872, 475,628 and475,628 shares of common stock held in a revocable trust atDecember 31, <strong>2012</strong>, 2011 and 2010, respectively. The revocabletrust is used to accumulate assets for the purpose of fundingthe ultimate obligation of certain non-qualified benefit plans.Transactions between the Company and the trust are accountedfor in accordance with the Deferred Compensation – RabbiTrusts Subtopic of the Compensation Topic of the ASC, whichrequires the assets held by the trust be consolidated with theCompany’s accounts. Effective March 31, 2011, the companyretired 125,425,977 common shares held in treasury, whichresulted in decreases in Treasury stock, common stock andretained earnings.■ 67
NOTES TO CONSOLIDATED FINANCIAL STATEMENTS(thousands of dollars unless otherwise indicated)Common Sharesin TreasuryCommon SharesOutstandingBalance at January 1, 2010 ................................................................................................................ 119,209,669 109,436,869Shares tendered as payment for option rights exercised .................................................... 15,752 (15,752)Shares issued for exercise of option rights .............................................................................. 2,436,639Shares tendered in connection with grants of restricted stock ........................................ 99,441 (99,441)Net shares issued for grants of restricted stock ..................................................................... 262,413Treasury stock purchased ............................................................................................................. 5,000,000 (5,000,000)Balance at December 31, 2010 ......................................................................................................... 124,324,862 107,020,728Shares tendered as payment for option rights exercised .................................................... 2,274 (2,274)Shares issued for exercise of option rights .............................................................................. 1,480,058Net shares issued for grants of restricted stock ..................................................................... 55,722Treasury stock purchased ............................................................................................................. 4,700,000 (4,700,000)Treasury stock retired .................................................................................................................... (125,425,977)Balance at December 31, 2011 ..................................................................................................... 3,601,159 103,854,234Shares tendered as payment for option rights exercised ........................................... 7,766 (7,766)Shares issued for exercise of option rights ....................................................................... 4,140,822Shares tendered in connection with grants of restricted stock ...................................... 143,979 (143,979)Net shares issued for grants of restricted stock ............................................................. 26,756Treasury stock purchased ........................................................................................................ 4,600,000 (4,600,000)Balance at December 31, <strong>2012</strong> ..................................................................................................... 8,352,904 103,270,067NOTE 11 – STOCK PURCHASE PLAN ANDPREFERRED STOCKAs of December 31, <strong>2012</strong>, 28,256 employees contributedto the Company’s ESOP, a voluntary defined contribution planavailable to all eligible salaried employees. Participants areallowed to contribute, on a pretax or after-tax basis, up to thelesser of twenty percent of their annual compensation or themaximum dollar amount allowed under the Internal RevenueCode. Prior to July 1, 2009, the Company matched one hundredpercent of all contributions up to six percent of eligible employeecontributions. Effective July 1, 2009, the ESOP was amended tochange the Company match to one hundred percent on the firstthree percent of eligible employee contributions and fifty percenton the next two percent of eligible contributions. Effective July 1,2011, the ESOP was amended to reinstate the Company matchup to six percent of eligible employee contributions. Such participantcontributions may be invested in a variety of investmentfunds or a Company common stock fund and may be exchangedbetween investments as directed by the participant. Participantsare permitted to diversify both future and prior Company matchingcontributions previously allocated to the Company commonstock fund into a variety of investment funds.The Company made contributions to the ESOP on behalfof participating employees, representing amounts authorizedby employees to be withheld from their earnings, of $88,363,$79,266 and $70,601 in <strong>2012</strong>, 2011 and 2010, respectively.The Company’s matching contributions to the ESOP chargedto operations were $142,791, $48,816 and $37,894 for <strong>2012</strong>,2011 and 2010, respectively. The <strong>2012</strong> Company contributionsinclude $80,000 related to the DOL Settlement. See Note 9 foradditional information on the DOL Settlement.At December 31, <strong>2012</strong>, there were 14,616,378 shares of theCompany’s common stock being held by the ESOP, representing14.2 percent of the total number of voting shares outstanding.Shares of Company common stock credited to each member’saccount under the ESOP are voted by the trustee underinstructions from each individual plan member. Shares for whichno instructions are received are voted by the trustee in the sameproportion as those for which instructions are received.On August 1, 2006, the Company issued 500,000 sharesof convertible serial preferred stock, no par value (Series 2Preferred stock) with cumulative quarterly dividends of $11.25per share, for $500,000 to the ESOP. The ESOP financedthe acquisition of the Series 2 Preferred stock by borrowing$500,000 from the Company at the rate of 5.5 percent per annum.This borrowing is payable over ten years in equal quarterlyinstallments. Each share of Series 2 Preferred stock is entitled toone vote upon all matters presented to the Company’s shareholdersand generally votes with the common stock together as oneclass. The Series 2 Preferred stock is held by the ESOP in anunallocated account. As the value of compensation expenserelated to contributions to the ESOP is earned, the Company hasthe option of funding the ESOP by redeeming a portion of thepreferred stock or with cash. Contributions are credited to themembers’ accounts at the time of funding. The Series 2 Preferredstock is redeemable for cash or convertible into common stock orany combination thereof at the option of the ESOP based on therelative fair value of the Series 2 Preferred and common stockat the time of conversion. At December 31, <strong>2012</strong>, 2011 and 2010,there were no allocated or committed-to-be released shares ofSeries 2 Preferred stock outstanding. In <strong>2012</strong>, the Companyredeemed 59,187 shares of the Series 2 Preferred stock for cash.■ 68
NOTES TO CONSOLIDATED FINANCIAL STATEMENTS(thousands of dollars unless otherwise indicated)In 2011, the Company redeemed 56,480 shares of the Series 2Preferred stock for cash. In 2010, the Company elected to fundthe ESOP with cash. The fair value of the Series 2 Preferredstock is based on a conversion/redemption formula outlinedin the preferred stock terms and was $210,773, $328,495 and$411,655 at December 31, <strong>2012</strong>, 2011, and 2010 respectively.NOTE 12 – STOCK-BASED COMPENSATIONEffective April 19, 2006, the shareholders approved the 2006Employee Plan, replacing the 2003 Stock Plan and authorizingthe Board of Directors, or a committee of the Board of Directors,to issue or transfer up to an aggregate of 10,000,000 shares ofcommon stock, plus any shares relating to awards that expire,are forfeited or cancelled. Effective April 21, 2010, the 2006Employee Plan was amended and restated to increase thenumber of shares that may be issued or transferred by 9,200,000shares to 19,200,000 shares. The 2006 Employee Plan permitsthe granting of option rights, appreciation rights, restricted stock,restricted stock units, performance shares and performance unitsto eligible employees. At December 31, <strong>2012</strong>, no appreciationrights, restricted stock units, performance shares or performanceunits had been granted under the 2006 Employee Plan. Nofurther grants may be made under the 2003 Stock Plan, all rightsgranted under that plan remain.Effective April 19, 2006, the shareholders also approved the2006 Stock Plan for Nonemployee Directors (NonemployeeDirector Plan), replacing the 1997 Stock Plan for NonemployeeDirectors and authorizing the Board of Directors, or a committeeof the Board of Directors, to issue or transfer up to anaggregate of 200,000 shares of common stock, plus any sharesrelating to awards that expire, are forfeited or are cancelled.The Nonemployee Director Plan permits the granting of optionrights, appreciation rights, restricted stock and restricted stockunits to members of the Board of Directors who are not employeesof the Company. At December 31, <strong>2012</strong>, no option rights,appreciation rights or restricted stock units had been grantedunder the Nonemployee Director Plan. No further grants maybe made under the 1997 Stock Plan, all rights granted under thatplan remain.The cost of the Company’s stock-based compensation isrecorded in accordance with the Stock Compensation Topic ofthe ASC. The tax benefits associated with these share-basedpayments are classified as financing activities in the Statementsof Consolidated Cash Flows.At December 31, <strong>2012</strong>, the Company had total unrecognizedstock-based compensation expense of $68,558 that is expectedto be recognized over a weighted-average period of 1.30 years.Stock-based compensation expense during <strong>2012</strong>, 2011 and 2010was $54,348, $48,176 and $42,276, respectively. The Companyrecognized a total income tax benefit related to stock-basedcompensation expense of $20,948, $18,570 and $16,290during <strong>2012</strong>, 2011 and 2010, respectively. The impact of totalstock-based compensation expense, net of taxes, on net incomereduced Basic and Diluted net income per common share by $.33and $.32 during <strong>2012</strong>, respectively.Option rights. The fair value of the Company’s option rightswas estimated at the date of grant using a Black-Scholes-Mertonoption-pricing model with the following weighted-averageassumptions for all options granted:<strong>2012</strong> 2011 2010Risk-free interest rate ............. .78% 1.13% 1.16%Expected life of option rights ... 5.11 years 5.27 years 5.27 yearsExpected dividend yieldof stock .................................... 1.43% 1.77% 1.84%Expected volatility of stock ... .274 .303 .304The risk-free interest rate is based upon the U.S. Treasuryyield curve at the time of grant. The expected life of option rightswas calculated using a scenario analysis model. Historical datawas used to aggregate the holding period from actual exercises,post-vesting cancellations and hypothetical assumed exerciseson all outstanding option rights. The expected dividend yieldof stock is the Company’s best estimate of the expected futuredividend yield. Expected volatility of stock was calculated usinghistorical and implied volatilities. The Company applied anestimated forfeiture rate of 2.60 percent to the <strong>2012</strong> grants.This rate was calculated based upon historical activity and isan estimate of granted shares not expected to vest. If actualforfeitures differ from the expected rate, the Company may be requiredto make additional adjustments to compensation expensein future periods.Grants of option rights for non-qualified and incentive stockoptions have been awarded to certain officers, key employeesand nonemployee directors under the 2006 Employee Plan,the 2003 Stock Plan, and the 1997 Plan. The option rightsgenerally become exercisable to the extent of one-third of theoptioned shares for each full year following the date of grant andgenerally expire ten years after the date of grant. Unrecognizedcompensation expense with respect to option rights granted toeligible employees amounted to $37,974 at December 31, <strong>2012</strong>.The unrecognized compensation expense is being amortizedon a straight-line basis over the three-year vesting period andis expected to be recognized over a weighted average period of1.36 years.The weighted-average per share grant date fair value ofoptions granted during <strong>2012</strong>, 2011 and 2010, respectively, was$32.74, $18.47 and $16.83. The total intrinsic value of exercisedoption rights for employees was $298,883, $53,100 and $74,440,and for nonemployee directors was $1,412, $1,129 and $626during <strong>2012</strong>, 2011 and 2010, respectively. The total fair valueof options vested during the year was $25,879, $25,868 and■ 69
NOTES TO CONSOLIDATED FINANCIAL STATEMENTS(thousands of dollars unless otherwise indicated)$25,073 during <strong>2012</strong>, 2011 and 2010, respectively. The outstandingoption rights for nonemployee directors were 3,500, 17,500and 37,500 for <strong>2012</strong>, 2011 and 2010, respectively. The Companyissues new shares upon exercise of option rights or granting ofA summary of the Company’s non-qualified and incentivestock option right activity for employees and nonemployee directors,and related information for the years ended December 31 isshown in the following table:restricted stock.<strong>2012</strong> 2011 2010OptionedSharesWeighted-AverageExercise PricePer ShareAggregateIntrinsicValueOptionedSharesWeighted-AverageExercise PricePer ShareAggregateIntrinsicValueOptionedSharesWeighted-AverageExercise PricePer ShareAggregateIntrinsicValueOutstandingbeginning of year .. 9,857,695 $ 60.31 10,009,385 $ 55.82 10,897,652 $ 50.30Granted ......................... 1,089,240 152.93 1,407,259 78.72 1,586,984 72.48Exercised ...................... (4,140,822) 53.40 (1,480,058) 47.15 (2,436,639) 41.95Forfeited ....................... (57,730) 78.01 (76,354) 67.02 (34,999) 58.90Expired .......................... (257) 72.65 (2,537) 53.65 (3,613) 54.71Outstanding endof year ....................... 6,748,126 $ 79.39 $ 494,699 9,857,695 $ 60.31 $ 287,526 10,009,385 $ 55.82 $ 281,349Exercisable at endof year ....................... 4,245,891 $ 61.43 $ 386,484 6,908,116 $ 54.24 $ 243,440 6,655,569 $ 50.78 $ 220,647The weighted average remaining term for options outstandingat the end of <strong>2012</strong>, 2011 and 2010, respectively, was 6.99, 6.54and 6.76 years. The weighted average remaining term for optionsexercisable at the end of <strong>2012</strong>, 2011 and 2010, respectively, was5.79, 5.39 and 5.58 years. Shares reserved for future grants ofoption rights and restricted stock were 6,810,439, 8,155,734 and9,826,006 at December 31, <strong>2012</strong>, 2011 and 2010, respectively.Restricted stock. Grants of restricted stock, which generallyrequire three years of continuous employment from the dateof grant before vesting and receiving the stock without restriction,have been awarded to certain officers and key employeesunder the 2006 Employee Plan. Prior to 2010, all awards wereperformance-based, and the shares of stock to be received withoutrestriction under these plans were based on the Company’sachievement of specified financial goals relating to averagereturn on average equity and earnings before interest, taxes, depreciationand amortization. The February <strong>2012</strong>, 2011 and 2010grants consisted of approximately two-thirds performance-basedawards that vest at the end of a three year period based on theCompany’s achievement of specified financial goals relating toaverage return on average equity and earnings per share (for theFebruary 2010 grant) and earnings per share (for the February2011 and <strong>2012</strong> grants) and one-third time-based awards thatvest at the end of a three year period based on continuousemployment. Unrecognized compensation expense with respectto grants of restricted stock to eligible employees amountedto $29,286 at December 31, <strong>2012</strong> and is being amortized on astraight-line basis over the vesting period and is expected to berecognized over a weighted average period of 1.12 years.Grants of restricted stock have been awarded to nonemployeedirectors under the Nonemployee Plan and the 1997Plan. These grants generally vest and stock is received withoutrestriction to the extent of one-third of the granted stock for eachyear following the date of grant. Unrecognized compensationexpense with respect to grants of restricted stock to nonemployeedirectors amounted to $1,298 at December 31, <strong>2012</strong> andis being amortized on a straight-line basis over the three-yearvesting period and is expected to be recognized over a weightedaverage period of 1.43 years.A summary of grants of restricted stock to certain officers,key employees and nonemployee directors during each year isas follows:<strong>2012</strong> 2011 2010Restricted stock granted .......... 301,856 300,677 348,460Weighted-average per sharefair value of restricted stockgranted during the year ........ $ 99.47 $ 84.86 $ 64.49A summary of the Company’s restricted stock activity for theyears ended December 31 is shown in the following table:<strong>2012</strong> 2011 2010Outstanding atbeginning of year .............. 1,304,891 1,266,201 1,304,386Granted .................................... 301,856 300,677 348,460Vested ....................................... (412,859) (16,072) (300,598)Forfeited .................................. (274,140) (245,915) (86,047)Outstanding atend of year .......................... 919,748 1,304,891 1,266,201■ 70
NOTES TO CONSOLIDATED FINANCIAL STATEMENTS(thousands of dollars unless otherwise indicated)NOTE 13 – OTHEROther general expense - net. Included in Other generalexpense - net were the following:<strong>2012</strong> 2011 2010Provisions for environmentalmatters - net ............................... $ 6,736 $ 9,100 $ 7,089Loss (gain) on dispositionof assets ....................................... 3,454 (5,469) 2,720Net income of exit or disposalactivities ....................................... (4,942) (900) (6,006)Total ................................................... $ 5,248 $ 2,731 $ 3,803Provisions for environmental matters–net represent initialprovisions for site-specific estimated costs of environmentalinvestigation or remediation and increases or decreases toenvironmental-related accruals as information becomesavailable upon which more accurate costs can be reasonablyestimated and as additional accounting guidelines are issued.Environmental-related accruals are not recorded net of insuranceproceeds in accordance with the Offsetting Subtopic of theBalance Sheet Topic of the ASC. See Note 8 for further details onthe Company’s environmental-related activities.The loss (gain) on disposition of assets represents netrealized gains and losses associated with the disposal of property,plant and equipment and intangible assets previously used in theconduct of the primary business of the Company.The net income of exit or disposal activities includes changesto accrued qualified exit costs as information becomes availableupon which more accurate amounts can be reasonably estimated,initial impairments of carrying value and additional impairmentsfor subsequent reductions in estimated fair value of property,plant and equipment held for disposal. See Note 5 for furtherdetails on the Company’s exit or disposal activities.Other income - net. Included in Other income - net werethe following:<strong>2012</strong> 2011 2010Dividend and royaltyincome ................................... $ (4,666) $ (4,963) $ (3,857)Net expense fromfinancing activities ............. 9,220 8,023 9,256Foreign currency transactionrelated (gains) losses ........ (3,071) 4,748 22Other income ........................... (21,074) (22,167) (14,059)Other expense .......................... 9,651 9,550 7,857Total ............................................ $ (9,940) $ (4,809) $ (781)The Net expense from financing activities includes the netexpense relating to changes in the Company’s financing fees.Foreign currency transaction related (gains) losses representnet realized (gains) losses on U.S. dollar-denominated liabilitiesof foreign subsidiaries and net realized and unrealized (gains)losses from foreign currency option and forward contracts. Therewere no foreign currency option and forward contracts outstandingat December 31, <strong>2012</strong>, 2011 and 2010.Other income and Other expense included items ofrevenue, gains, expenses and losses that were unrelated to theprimary business purpose of the Company. There were no itemswithin Other income or Other expense that were individuallysignificant.NOTE 14 – INCOME TAXESDeferred income taxes reflect the net tax effects of temporarydifferences between the carrying amounts of assets andliabilities for financial reporting purposes and the amounts usedfor income tax purposes using the enacted tax rates and laws thatare currently in effect. Significant components of the Company’sdeferred tax assets and liabilities as of December 31, <strong>2012</strong>, 2011and 2010 were as follows:<strong>2012</strong> 2011 2010Deferred tax assets:Exit costs, environmentaland other similar items ... $ 45,403 $ 53,928 $ 64,773Deferred employeebenefit items ..................... 93,039 74,577 57,810Other items (each less than5 percent of total assets) ... 73,388 83,192 79,014Total deferred tax assets ... $ 211,830 $ 211,697 $ 201,597Deferred tax liabilities:Depreciation andamortization ..................... $ 202,891 $ 192,035 $ 165,917Netted against the Company’s other deferred tax assetswere valuation reserves of $11,474, $8,017 and $17,756 atDecember 31, <strong>2012</strong>, 2011 and 2010, respectively, resulting fromthe uncertainty as to the realization of the tax benefits fromcertain foreign net operating losses and certain other foreignassets. The Company has $8,650 of domestic net operating losscarryforwards acquired through acquisitions that have expirationdates through the tax year 2030 and foreign net operating lossesof $47,412. The foreign net operating losses are related to variousjurisdictions that provide for either indefinite carryforwardperiods or carryforward periods with various expiration periods.Significant components of the provisions for income taxeswere as follows:<strong>2012</strong> 2011 2010Current:Federal ......................... $ 207,791 $ 204,284 $ 127,498Foreign ........................ 51,264 50,272 50,765State and local ........... 27,642 28,219 16,966Total current ........ 286,697 282,775 195,229Deferred:Federal ......................... 8,692 20,713 27,903Foreign ........................ (16,964) (3,922) (7,145)State and local ........... (2,150) 122 (688)Total deferred ...... (10,422) 16,913 20,070Total provisions forincome taxes .............. $ 276,275 $ 299,688 $ 215,299■ 71
NOTES TO CONSOLIDATED FINANCIAL STATEMENTS(thousands of dollars unless otherwise indicated)The provisions for income taxes included estimated taxespayable on that portion of retained earnings of foreign subsidiariesexpected to be received by the Company. The effect of therepatriation provisions of the American Jobs Creation Act of2004 and the provisions of the Income Taxes Topic of the ASC,was $7,572 in <strong>2012</strong>, $(491) in 2011 and $1,885 in 2010. A provisionwas not made with respect to $19,274 of retained earnings atDecember 31, <strong>2012</strong> that have been invested by foreign subsidiaries.The unrecognized deferred tax liability related to thoseearnings is approximately $1.0 million.Significant components of income before income taxes asused for income tax purposes, were as follows:<strong>2012</strong> 2011 2010Domestic ................. $ 712,873 $ 560,395 $ 539,120Foreign ..................... 194,436 181,153 138,664$ 907,309 $ 741,548 $ 677,784A reconciliation of the statutory federal income tax rate tothe effective tax rate follows:<strong>2012</strong> 2011 2010Statutory federal income tax rate ....... 35.0% 35.0% 35.0%Effect of:State and local income taxes ........... 1.8 2.1 1.6Investment vehicles ........................... (2.1) (1.9) (1.6)ESOP IRS audit settlement ............ 10.1Domestic production activities ...... (1.9) (2.4) (2.5)Other - net ............................................. (2.4) (2.5) (0.7)Effective tax rate ...................................... 30.4% 40.4% 31.8%The <strong>2012</strong> state and local income tax and investment vehiclescomponents of the effective tax rate were consistent with the2011 tax year. The domestic production activities componentof the effective tax rate decreased compared to 2011 due to thedomestic taxable income limitation as set forth in the InternalRevenue Code. During the fourth quarter of 2011, the Companyreached a settlement with the Internal Revenue Service (IRS)that resolved all ESOP related tax issues for the 2003 through2009 tax years. The settlement negatively impacted the effectivetax rate for 2011.On January 2, 2013, the American Taxpayer Relief Act(ATRA) was enacted which retroactively reinstated and extendedthe Federal Research and Development Tax Credit fromJanuary 1, <strong>2012</strong> to December 31, 2013. As a result, the Companyexpects to recognize an immaterial discrete tax benefit duringthe first quarter of 2013. The other provisions of the Act will havea negligible impact on the Company’s effective tax rate in 2013.The Company and its subsidiaries file income tax returns inthe U.S. federal jurisdiction, and various state and foreign jurisdictions.The IRS commenced an examination of the Company’sU.S. income tax returns for the 2008 and 2009 tax years in thethird quarter of 2011. Fieldwork is expected to be completedduring 2013. At this time, the Company has determined that aninsignificant refund is due for issues under review during this auditperiod. The Company has fully resolved all IRS issues for the2003 through 2009 tax years relating to the matters challengingthe ESOP related federal income tax deductions claimed by theCompany. With the exception of $2.0 million of interest relatedto the 2008 tax year, all ESOP related settlement payments havebeen made to the IRS.As of December 31, <strong>2012</strong>, the Company is subject to non-U.S.income tax examinations for the tax years of 2005 through <strong>2012</strong>.In addition, the Company is subject to state and local income taxexaminations for the tax years 2002 through <strong>2012</strong>.A reconciliation of the beginning and ending amount ofunrecognized tax benefits is as follows:<strong>2012</strong> 2011 2010Balance at beginningof year ................................ $ 29,666 $ 31,268 $ 36,963Additions based on taxpositions related tothe current year ............... 3,760 2,807 3,109Additions for tax positionsof prior years .................... 7,392 1,354 1,841Reductions for tax positionsof prior years ..................... (6,583) (3,339) (9,123)Settlements ............................ (1,139) (1,089) (55)Lapses of Statutes ofLimitations ....................... (4,977) (1,335) (1,467)Balance at end of year ........ $ 28,119 $ 29,666 $ 31,268Included in the balance of unrecognized tax benefits atDecember 31, <strong>2012</strong>, 2011 and 2010 is $25,011, $25,569 and$27,428 in unrecognized tax benefits, the recognition of whichwould have an effect on the effective tax rate.Included in the balance of unrecognized tax benefits atDecember 31, <strong>2012</strong> is $6,981 related to tax positions for which itis reasonably possible that the total amounts could significantlychange during the next twelve months. This amount representsa decrease in unrecognized tax benefits comprised primarilyof items related to federal audits of partnership investments,assessed state income tax audits, state settlement negotiationscurrently in progress and expiring statutes in federal, foreign andstate jurisdictions.The Company classifies all income tax related interestand penalties as income tax expense. During the years endedDecember 31, <strong>2012</strong>, 2011 and 2010, the Company recognized arelease of $1,532, $1,163 and $1,544, respectively, in income taxinterest and penalties. At December 31, <strong>2012</strong>, 2011 and 2010, theCompany has accrued $6,178, $8,095 and $10,197, respectively,for the potential payment of interest and penalties.■ 72
NOTES TO CONSOLIDATED FINANCIAL STATEMENTS(thousands of dollars unless otherwise indicated)NOTE 15 – NET INCOME PER COMMON SHARE<strong>2012</strong> 2011 2010BasicAverage common shares outstanding ................................................. 101,714,901 103,471,323 107,021,624Net income ................................................................................................... $ 631,034 $ 441,860 $ 462,485Less net income allocated to unvested restricted shares ............. (5,114) (4,825) (4,817)Net income allocated to common shares ........................................... $ 625,920 $ 437,035 $ 457,668Net income per common share ............................................................. $ 6.15 $ 4.22 $ 4.28DilutedAverage common shares outstanding ................................................. 101,714,901 103,471,323 107,021,624Stock options and other contingently issuable shares (a) .............. 2,215,528 2,200,650 1,763,893Average common shares outstanding assuming dilution ............. 103,930,429 105,671,973 108,785,517Net income ................................................................................................... $ 631,034 $ 441,860 $ 462,485Less net income allocated to unvested restricted sharesassuming dilution ................................................................................. (5,008) (4,756) (4,749)Net income allocated to common shares assuming dilution ....... $ 626,026 $ 437,104 $ 457,736Net income per common share ............................................................. $ 6.02 $ 4.14 $ 4.21(a) Stock options and other contingently issuable shares excludes 1,047,734, 101,260 and 1,544,620 shares at December 31, <strong>2012</strong>, 2011 and 2010, respectively, dueto their anti-dilutive effect.The Company has two classes of participating securities: common shares and restricted shares, representing 99% and 1% ofoutstanding shares, respectively. The restricted shares are shares of unvested restricted stock granted under the Company’s restrictedstock award program. Unvested restricted shares granted prior to April 21, 2010 received non-forfeitable dividends. Accordingly,the shares are considered a participating security and the two-class method of calculating basic and diluted earnings per share isrequired. Effective April 21, 2010, the restricted stock award program was revised and dividends on performance-based restrictedshares granted after this date are deferred and payment is contingent upon the awards vesting. Only the time-based restricted shares,which continue to receive non-forfeitable dividends, are considered a participating security. Basic and diluted earnings per share arecalculated using the two-class method in accordance with the Earnings Per Share Topic of the ASC.NOTE 16 – SUMMARY OF QUARTERLY RESULTS OF OPERATIONS (UNAUDITED)<strong>2012</strong>1st Quarter 2nd Quarter 3rd Quarter 4th Quarter Full YearNet sales ......................................................................... $ 2,136,344 $ 2,573,022 $ 2,603,226 $ 2,221,870 $ 9,534,462Gross profit ................................................................... 909,839 1,150,597 1,150,282 995,508 4,206,226Net income .................................................................... 100,216 227,813 234,953 68,052 631,034Net income per common share - basic ................ .97 2.23 2.29 0.66 6.15Net income per common share - diluted ............. .95 2.17 2.24 0.65 6.02Net income in the fourth quarter was decreased by $49,163 ($.47 per share) due to the DOL Settlement (see Note 9) andincreased by inventory adjustments and adjustments to compensation and benefit expenses. Gross profit increased by $28,724 ($.17per share), primarily as a result of adjustments of $29,488 based on an annual physical inventory count performed during the fourthquarter, year-end inventory levels and related cost adjustments. Selling, general and administrative expenses decreased $5,645 ($.03per share) related to compensation and benefit expense adjustments.20111st Quarter 2nd Quarter 3rd Quarter 4th Quarter Full YearNet sales .......................................................................... $ 1,855,586 $ 2,354,751 $ 2,484,920 $ 2,070,442 $ 8,765,699Gross profit .................................................................... 797,408 1,022,755 1,038,299 886,100 3,744,562Net income ..................................................................... 68,316 179,115 179,877 14,552 441,860Net income per common share - basic ................. .64 1.69 1.74 .14 4.22Net income per common share - diluted .............. .63 1.66 1.71 .14 4.14Net income in the fourth quarter was decreased by $74,982 ($.71 per share) due to the settlement of the IRS’ audit of theCompany’s ESOP. Net income in the fourth quarter was increased by physical inventory adjustments and adjustments to compensationand benefit expenses. Gross profit increased by $25,123 ($.15 per share), primarily as a result of physical inventory adjustments of$23,394 based on an annual physical inventory count performed during the fourth quarter, year-end inventory levels and related costs.■ 73
NOTES TO CONSOLIDATED FINANCIAL STATEMENTS(thousands of dollars unless otherwise indicated)NOTE 17 – OPERATING LEASESThe Company leases certain stores, warehouses, manufacturingfacilities, office space and equipment. Renewal options areavailable on the majority of leases and, under certain conditions,options exist to purchase certain properties. Rental expensefor operating leases, recognized on a straight-line basis overthe lease term in accordance with the Leases Topic of the ASCwas $310,109, $292,516 and $282,309 for <strong>2012</strong>, 2011 and 2010,respectively. Certain store leases require the payment of contingentrentals based on sales in excess of specified minimums.Contingent rentals included in rent expense were $39,340,$36,917 and $37,602 in <strong>2012</strong>, 2011 and 2010, respectively.Rental income, as lessor, from real estate leasing activities andsublease rental income for all years presented was not significant.The following schedule summarizes the future minimum leasepayments under noncancellable operating leases having initial orremaining terms in excess of one year at December 31, <strong>2012</strong>:2013 ................................................................................ $ 242,3602014 ................................................................................ 226,9752015 ................................................................................ 192,1172016 ................................................................................ 151,6542017 ................................................................................ 103,573Later years ................................................................... 191,844Total minimum lease payments ............................ $ 1,108,523NOTE 18 – REPORTABLE SEGMENT INFORMATIONThe Company reports its segment information in the sameway that management internally organizes its business for assessingperformance and making decisions regarding allocationof resources in accordance with the Segment <strong>Report</strong>ing Topicof the ASC. The Company has determined that it has fourreportable operating segments: Paint Stores Group, ConsumerGroup, Global Finishes Group and Latin America CoatingsGroup (individually, a “<strong>Report</strong>able Segment” and collectively, the“<strong>Report</strong>able Segments”). Factors considered in determining thefour <strong>Report</strong>able Segments of the Company include the nature ofbusiness activities, the management structure directly accountableto the Company’s chief operating decision maker (CODM)for operating and administrative activities, availability of discretefinancial information and information presented to the Boardof Directors. The Company reports all other business activitiesand immaterial operating segments that are not reportable in theAdministrative segment. See pages 8 through 15 of this report formore information about the <strong>Report</strong>able Segments.The Company’s CODM has been identified as theChief Executive Officer because he has final authority overperformance assessment and resource allocation decisions.Because of the diverse operations of the Company, the CODMregularly receives discrete financial information about each<strong>Report</strong>able Segment as well as a significant amount of additionalfinancial information about certain divisions, business units orsubsidiaries of the Company. The CODM uses all such financialinformation for performance assessment and resource allocationdecisions. The CODM evaluates the performance of andallocates resources to the <strong>Report</strong>able Segments based on profitor loss before income taxes and cash generated from operations.The accounting policies of the <strong>Report</strong>able Segments are thesame as those described in Note 1 of this report.The Paint Stores Group consisted of 3,520 company-operatedspecialty paint stores in the United States, Canada, PuertoRico, Virgin Islands, Trinidad and Tobago, St. Maarten, Jamaica,Curacao and Aruba at December 31, <strong>2012</strong>. Each store in this segmentis engaged in the related business activity of selling paint,coatings and related products to end-use customers. The PaintStores Group markets and sells <strong>Sherwin</strong>-<strong>Williams</strong>® brandedarchitectural paint and coatings, protective and marine products,OEM product finishes and related items. These products areproduced by manufacturing facilities in the Consumer Group.In addition, each store sells selected purchased associatedproducts. The loss of any single customer would not have amaterial adverse effect on the business of this segment. During<strong>2012</strong>, this segment opened 70 net new stores, consisting of 81new stores opened (63 in the United States, 14 in Canada, 1 inPuerto Rico and 3 in Trinidad) and 11 stores closed in the UnitedStates. In 2011 and 2010, this segment opened 60 and 36 netnew stores, respectively. A map on the cover flap of this reportshows the number of paint stores and their geographic location.The CODM uses discrete financial information about the PaintStores Group, supplemented with information by geographicregion, product type and customer type, to assess performanceof and allocate resources to the Paint Stores Group as a whole.In accordance with ASC 280-10-50-9, the Paint Stores Groupas a whole is considered the operating segment, and because itmeets the criteria in ASC 280-10-50-10, it is also considered a<strong>Report</strong>able Segment.The Consumer Group develops, manufactures and distributesa variety of paint, coatings and related products to thirdparty customers primarily in the United States and Canadaand the Paint Stores Group. Approximately 64 percent of thetotal sales of the Consumer Group in <strong>2012</strong> were inter-segmenttransfers of products primarily sold through the Paint StoresGroup. Sales and marketing of certain controlled brand andprivate labeled products is performed by a direct sales staff. Theproducts distributed through third party customers are intendedfor resale to the ultimate end-user of the product. The ConsumerGroup had sales to certain customers that, individually, may be asignificant portion of the sales of the segment. However, the lossof any single customer would not have a material adverse effecton the overall profitability of the segment. This segment incurredmost of the Company’s capital expenditures related to ongoing■ 74
NOTES TO CONSOLIDATED FINANCIAL STATEMENTS(thousands of dollars unless otherwise indicated)environmental compliance measures. The CODM uses discretefinancial information about the Consumer Group, supplementedwith information by product types and customer, to assessperformance of and allocate resources to the Consumer Groupas a whole. In accordance with ASC 280-10-50-9, the ConsumerGroup as a whole is considered the operating segment, andbecause it meets the criteria in ASC 280-10-50-10, it is alsoconsidered a <strong>Report</strong>able Segment.The Global Finishes Group develops, licenses, manufactures,distributes and sells a variety of protective and marine products,automotive finishes and refinish products, OEM product finishesand related products in North and South America, Europe andAsia. This segment meets the demands of its customers for aconsistent worldwide product development, manufacturingand distribution presence and approach to doing business.This segment licenses certain technology and trade namesworldwide. <strong>Sherwin</strong>-<strong>Williams</strong>® and other controlled brandproducts are distributed through the Paint Stores Group andthis segment’s 302 company-operated branches and by a directsales staff and outside sales representatives to retailers, dealers,jobbers, licensees and other third party distributors. During<strong>2012</strong>, this segment opened 1 new branch in the United Statesand closed 2 in the United States for a net decrease of 1 branch.At December 31, <strong>2012</strong>, the Global Finishes Group consistedof operations in the United States, subsidiaries in 34 foreigncountries and income from licensing agreements in 16 foreigncountries. The CODM uses discrete financial information aboutthe Global Finishes Group reportable segment, supplementedwith information about geographic divisions, business units, andsubsidiaries, to assess performance of and allocate resources tothe Global Finishes Group as a whole. In accordance with ASC280-10-50-9, the Global Finishes Group as a whole is consideredthe operating segment, and because it meets the criteria in ASC280-10-50-10, it is also considered a <strong>Report</strong>able Segment. A mapon the cover flap of this report shows the number of branchesand their geographic locations.The Latin America Coatings Group develops, licenses, manufactures,distributes and sells a variety of architectural paint andcoatings, protective and marine products, OEM product finishesand related products in North and South America. This segmentmeets the demands of its customers for consistent regionalproduct development, manufacturing and distribution presenceand approach to doing business. <strong>Sherwin</strong>-<strong>Williams</strong>® and othercontrolled brand products are distributed through this segment’s276 company-operated stores and by a direct sales staff andoutside sales representatives to retailers, dealers, licensees andother third party distributors. During <strong>2012</strong>, this segment opened17 new stores (9 in South America and 8 in Mexico) and closed 6in South America for a net increase of 11 stores. At December 31,<strong>2012</strong>, the Latin America Coatings Group consisted of operationsfrom subsidiaries in 9 foreign countries, 4 foreign joint venturesand income from licensing agreements in 10 foreign countries.The CODM uses discrete financial information about the LatinAmerica Coatings Group, supplemented with information aboutgeographic divisions, business units, and subsidiaries, to assessperformance of and allocate resources to the Latin AmericaCoatings Group as a whole. In accordance with ASC 280-10-50-9, the Latin America Coatings Group as a whole is consideredthe operating segment, and because it meets the criteria in ASC280-10-50-10, it is also considered a <strong>Report</strong>able Segment. A mapon the cover flap of this report shows the number of stores andtheir geographic locations.The Administrative segment includes the administrativeexpenses of the Company’s corporate headquarters site. Alsoincluded in the Administrative segment was interest expense,interest and investment income, certain expenses related toclosed facilities and environmental-related matters, and otherexpenses which were not directly associated with the <strong>Report</strong>ableSegments. The Administrative segment did not include any significantforeign operations. Also included in the Administrativesegment was a real estate management unit that is responsiblefor the ownership, management and leasing of non-retailproperties held primarily for use by the Company, including theCompany’s headquarters site, and disposal of idle facilities. Salesof this segment represented external leasing revenue of excessheadquarters space or leasing of facilities no longer used bythe Company in its primary businesses. Gains and losses fromthe sale of property were not a significant operating factor indetermining the performance of the Administrative segment.Net external sales of all consolidated foreign subsidiarieswere $2,049,814, $1,982,859 and $1,468,116 for <strong>2012</strong>, 2011 and2010, respectively. Segment profit of all consolidated foreignsubsidiaries was $158,377, $122,436 and $86,951 for <strong>2012</strong>, 2011and 2010, respectively. Domestic operations accounted for theremaining net external sales and segment profits. Long-livedassets consisted of Property, plant and equipment, Goodwill,Intangible assets, Deferred pension assets and Other assets.The aggregate total of long-lived assets for the Company was$3,085,499, $2,967,660 and, $2,955,513 at December 31, <strong>2012</strong>,2011 and 2010, respectively. Long-lived assets of consolidatedforeign subsidiaries totaled $718,409, $650,681 and $664,547at December 31, <strong>2012</strong>, 2011 and 2010, respectively. Total Assetsof the Company were $6,234,737, $5,229,252 and $5,169,235 atDecember 31, <strong>2012</strong>, 2011 and 2010, respectively. Total assets ofconsolidated foreign subsidiaries were $1,598,996, $1,443,034and $1,467,969, which represented 25.6 percent, 27.6 percent and28.4 percent of the Company’s total assets at December 31, <strong>2012</strong>,2011 and 2010, respectively. No single geographic area outsidethe United States was significant relative to consolidated netsales or operating profits. Export sales and sales to any individual■ 75
NOTES TO CONSOLIDATED FINANCIAL STATEMENTS(thousands of dollars unless otherwise indicated)customer were each less than 10 percent of consolidated sales tounaffiliated customers during all years presented.In the reportable segment financial information that follows,Segment profit was total net sales and intersegment transfersless operating costs and expenses. Identifiable assets werethose directly identified with each reportable segment. TheAdministrative segment assets consisted primarily of cash andcash equivalents, investments, deferred pension assets, andheadquarters property, plant and equipment. The margin foreach reportable segment was based upon total net sales andintersegment transfers. Domestic intersegment transfers wereaccounted for at the approximate fully absorbed manufacturedcost, based on normal capacity volumes, plus customary distributioncosts. International inter-segment transfers were accountedfor at values comparable to normal unaffiliated customer sales.(millions of dollars) <strong>2012</strong>GlobalFinishesGroupLatin AmericaCoatingsGroupPaint StoresGroupConsumerGroupAdministrativeConsolidatedTotalsNet external sales .............................................. $ 5,410 $ 1,322 $ 1,961 $ 836 $ 5 $ 9,534Intersegment transfers .................................. 2,320 7 47 (2,374)Total net sales and intersegment transfers .. $ 5,410 $ 3,642 $ 1,968 $ 883 $ (2,369) $ 9,534Segment profit .................................................... $ 862 $ 217 (1) $ 147 $ 81 $ 1,307Interest expense ................................................ $ (43) (43)Administrative expenses and other .......... (357) (2) (357)Income before income taxes ........................ $ 862 $ 217 $ 147 $ 81 $ (400) $ 907<strong>Report</strong>able segment margins ...................... 15.9 % 6.0 % 7.5 % 9.2 %Identifiable assets ............................................. $ 1,374 $ 1,701 $ 987 $ 485 $ 1,688 $ 6,235Capital expenditures ....................................... 67 47 14 9 20 157Depreciation ....................................................... 49 43 30 10 20 1522011Paint StoresGroupConsumerGroupGlobalFinishesGroupLatin AmericaCoatingsGroup AdministrativeConsolidatedTotalsNet external sales ................................................ $ 4,780 $ 1,274 $ 1,878 $ 828 $ 6 $ 8,766Intersegment transfers ...................................... 2,091 9 39 (2,139)Total net sales and intersegment transfers ... $ 4,780 $ 3,365 $ 1,887 $ 867 $ (2,133) $ 8,766Segment profit ...................................................... $ 646 $ 174 (1) $ 90 $ 75 $ 985Interest expense ................................................... $ (42) (42)Administrative expenses and other ............... (201) (201)Income before income taxes ............................ $ 646 $ 174 $ 90 $ 75 $ (243) $ 742<strong>Report</strong>able segment margins ........................... 13.5 % 5.2 % 4.8 % 8.7 %Identifiable assets ................................................ $ 1,309 $ 1,682 $ 939 $ 469 $ 830 $ 5,229Capital expenditures .......................................... 50 35 14 14 41 154Depreciation .......................................................... 48 43 31 11 18 1512010Paint StoresGroupConsumerGroupGlobalFinishesGroupLatin AmericaCoatingsGroup AdministrativeConsolidatedTotalsNet external sales ................................................ $ 4,381 $ 1,298 $ 1,417 $ 675 $ 5 $ 7,776Intersegment transfers ...................................... 1,770 4 34 (1,808)Total net sales and intersegment transfers ... $ 4,381 $ 3,068 $ 1,421 $ 709 $ (1,803) $ 7,776Segment profit ...................................................... $ 620 $ 204 (1) $ 65 $ 59 $ 948Interest expense ................................................... $ (71) (71)Administrative expenses and other ............... (199) (199)Income before income taxes ............................ $ 620 $ 204 $ 65 $ 59 $ (270) $ 678<strong>Report</strong>able segment margins ........................... 14.2 % 6.6 % 4.6 % 8.3 %Identifiable assets ................................................ $ 1,238 $ 1,603 $ 1,089 $ 437 $ 802 $ 5,169Capital expenditures .......................................... 51 25 26 12 11 125Depreciation .......................................................... 47 39 28 10 16 140(1) Segment profit included $27, $24 and $22 of mark-up on intersegment transfers realized primarily as a result of external sales by the Paint Stores Group during<strong>2012</strong>, 2011 and 2010, respectively.(2) Includes $80 pre-tax charge related to DOL Settlement. See Note 9.■ 76
CAUTIONARY STATEMENT REGARDING(FORWARD-LOOKING INFORMATION)Certain statements contained in “Management’s Discussionand Analysis of Financial Condition and Results of Operations,”“Letter to Shareholders” and elsewhere in this report constitute“forward-looking statements” within the meaning of Section 27Aof the Securities Act of 1933 and Section 21E of the SecuritiesExchange Act of 1934. These forward-looking statements arebased upon management’s current expectations, estimates,assumptions and beliefs concerning future events and conditionsand may discuss, among other things, anticipated futureperformance (including sales and earnings), expected growth,future business plans and the costs and potential liability forenvironmental-related matters and the lead pigment andlead-based paint litigation. Any statement that is not historicalin nature is a forward-looking statement and may be identifiedby the use of words and phrases such as “expects,” “anticipates,”“believes,” “will,” “will likely result,” “will continue,” “plans to” andsimilar expressions.Readers are cautioned not to place undue reliance on anyforward-looking statements. Forward-looking statements arenecessarily subject to risks, uncertainties and other factors, manyof which are outside the control of the Company, that couldcause actual results to differ materially from such statementsand from the Company’s historical results and experience.These risks, uncertainties and other factors include suchthings as: (a) the duration and severity of the current negativeglobal economic and financial conditions; (b) general businessconditions, strengths of retail and manufacturing economiesand the growth in the coatings industry; (c) competitive factors,including pricing pressures and product innovation and quality;(d) changes in raw material and energy supplies and pricing;(e) changes in the Company’s relationships with customers andsuppliers; (f) the Company’s ability to attain cost savings fromproductivity initiatives; (g) the Company’s ability to successfullyintegrate past and future acquisitions into its existing operations,including the planned acquisition of Comex and the recentacquisitions of Leighs Paints, Geocel and Jiangsu Pulanna, aswell as the performance of the businesses acquired; (h) risks anduncertainties associated with the Company’s ownership of LifeShield Engineered Systems LLC; (i) changes in general domesticeconomic conditions such as inflation rates, interest rates, taxrates, unemployment rates, higher labor and healthcare costs,recessions, and changing government policies, laws and regulations;( j) risks and uncertainties associated with the Company’sexpansion into and its operations in Asia, Europe, Mexico, SouthAmerica and other foreign markets, including general economicconditions, inflation rates, recessions, foreign currency exchangerates, foreign investment and repatriation restrictions, legal andregulatory constraints, civil unrest and other external economicand political factors; (k) the achievement of growth in foreignmarkets, such as Asia, Europe, Mexico and South America;(l) increasingly stringent domestic and foreign governmentalregulations including those affecting health, safety and theenvironment; (m) inherent uncertainties involved in assessingthe Company’s potential liability for environmental-relatedactivities; (n) other changes in governmental policies, laws andregulations, including changes in accounting policies and standardsand taxation requirements (such as new tax laws and newor revised tax law interpretations); (o) the nature, cost, quantityand outcome of pending and future litigation and other claims,including the lead pigment and lead-based paint litigation,and the effect of any legislation and administrative regulationsrelating thereto; and (p) unusual weather conditions.Readers are cautioned that it is not possible to predict oridentify all of the risks, uncertainties and other factors thatmay affect future results and that the above list should not beconsidered to be a complete list. Any forward-looking statementspeaks only as of the date on which such statement is made, andthe Company undertakes no obligation to update or revise anyforward-looking statement, whether as a result of new information,future events or otherwise.■ 77
SHAREHOLDER INFORMATIONANNUAL MEETINGThe annual meeting of shareholders willbe held in the Landmark ConferenceCenter, 927 Midland Building, 101 W.Prospect Avenue, Cleveland, Ohio onWednesday, April 17, 2013 at 9:00 A.M.,local time.HEADQUARTERS101 W. Prospect AvenueCleveland, Ohio 44115-1075(216) 566-2000www.sherwin.comINVESTOR RELATIONSRobert J. WellsSenior Vice President - CorporateCommunications and Public AffairsThe <strong>Sherwin</strong>-<strong>Williams</strong> Company101 W. Prospect AvenueCleveland, Ohio 44115-1075INDEPENDENT REGISTEREDPUBLIC ACCOUNTING FIRMErnst & Young LLPCleveland, OhioSTOCK TRADING<strong>Sherwin</strong>-<strong>Williams</strong> Common Stock—Symbol, SHW—is traded on the NewYork Stock Exchange.DIVIDEND REINVESTMENTPROGRAMA dividend reinvestment program isavailable to shareholders of commonstock. For information, contact WellsFargo Shareowner Services.FORM 10-KThe Company’s <strong>Annual</strong> <strong>Report</strong> onForm 10-K, filed with the Securitiesand Exchange Commission, isavailable without charge. To obtaina copy, contact <strong>Investor</strong> <strong>Relations</strong>.TRANSFER AGENT & REGISTRAROur transfer agent, Wells FargoShareowner Services, maintains therecords for our registered shareholdersand can help with a wide variety ofshareholder related services, includingthe direct deposit of dividends and onlineaccess to your account. Contact:Wells Fargo Shareowner ServicesP.O. Box 64856St. Paul, MN 55164-0856www.shareowneronline.com1-800-468-9716 Toll-free651-450-4064 outside the United States651-450-4144 TDD■ 78
SHAREHOLDER INFORMATIONCOMMON STOCK TRADING STATISTICS<strong>2012</strong> 2011 2010 2009 2008High ..................................................... $ 159.80 $ 90.42 $ 84.99 $ 64.13 $ 65.00Low ...................................................... 90.21 69.47 57.86 42.19 44.51Close December 31 ........................ 153.82 89.27 83.75 61.65 59.75Shareholders of record .................. 7,954 8,360 8,706 9,151 9,469Shares traded (thousands) .......... 282,397 286,276 316,582 430,216 519,438QUARTERLY STOCK PRICES AND DIVIDENDS<strong>2012</strong> 2011Quarter High Low Dividend Quarter High Low Dividend1st $ 110.79 $ 90.21 $ .390 1st $ 86.77 $ 79.25 $ .3652nd 133.97 107.29 .390 2nd 87.87 80.70 .3653rd 150.80 122.79 .390 3rd 86.50 69.47 .3654th 159.80 138.36 .390 4th 90.42 73.06 .365■ 79
CORPORATE OFFICERS ANDOPERATING MANAGEMENTCORPORATE OFFICERSChristopher M. Connor, 56*Chairman and Chief Executive OfficerJohn G. Morikis, 49*President and Chief Operating OfficerSean P. Hennessy, 55*Senior Vice President - Finance andChief Financial OfficerThomas E. Hopkins, 55*Senior Vice President -Human ResourcesCatherine M. Kilbane, 49*Senior Vice President, GeneralCounsel and SecretarySteven J. Oberfeld, 60*Senior Vice President -Corporate Planning and DevelopmentRobert J. Wells, 55*Senior Vice President - CorporateCommunications and Public AffairsAllen J. Mistysyn, 44*Vice President -Corporate ControllerCynthia D. Brogan, 61Vice President and TreasurerMichael T. Cummins, 54Vice President - Taxes andAssistant SecretaryEdward C. Thompson, 45Vice President - Corporate Auditand Loss PreventionRichard M. Weaver, 58Vice President - AdministrationOPERATING MANAGEMENTJoel Baxter, 52President & General ManagerGlobal Supply Chain DivisionConsumer GroupRobert J. Davisson, 52*PresidentPaint Stores GroupTimothy J. Drouilhet, 51President & General ManagerEastern DivisionPaint Stores GroupMonty J. Griffin, 52President & General ManagerSouth Western DivisionPaint Stores GroupThomas C. Hablitzel, 50President & General ManagerAutomotive DivisionGlobal Finishes GroupGeorge E. Heath, 47*PresidentGlobal Finishes GroupPeter J. Ippolito, 48President & General ManagerMid Western DivisionPaint Stores GroupTimothy A. Knight, 48*PresidentLatin America Coatings GroupDavid B. Sewell, 44President & General ManagerProduct Finishes DivisionGlobal Finishes GroupCheri M. Phyfer, 41President & General ManagerSoutheastern DivisionPaint Stores GroupRonald B. Rossetto, 46President & General ManagerProtective & Marine Coatings DivisionGlobal Finishes GroupHarvey P. Sass, 55President & General ManagerDiversified Brands DivisionConsumer GroupThomas W. Seitz, 64*Senior Vice President -Strategic Excellence Initiatives* Executive Officer as defined by the Securities Exchange Act of 1934.■ 80
<strong>2012</strong> DIRECTORS1. JOHN M. STROPKI, 62Executive ChairmanLincoln Electric Holdings, Inc.2. RICHARD K. SMUCKER, 64Chief Executive OfficerThe J. M. Smucker Company3. ARTHUR F. ANTON, 55*President andChief Executive OfficerSwagelok Company4. SUSAN J. KROPF, 64Retired, former President andChief Operating OfficerAvon Products, Inc.5. CHRISTOPHER M. CONNOR, 56Chairman andChief Executive OfficerThe <strong>Sherwin</strong>-<strong>Williams</strong> Company6. THOMAS G. KADIEN, 56*Senior Vice PresidentConsumer Packaging and IP AsiaInternational Paper Company7. RICHARD J. KRAMER, 49*Chairman of the Board,Chief Executive Officer and PresidentThe Goodyear Tire & Rubber Company8. A . MALACHI MIXON, III, 72ChairmanInvacare Corporation9. DAVID F. HODNIK, 65*Retired, former President andChief Executive OfficerAce Hardware Corporation*Audit Committee Member1 2 3456789
The <strong>Sherwin</strong>-<strong>Williams</strong> Company101 W. Prospect AvenueCleveland, Ohio 44115-1075www.sherwin-williams.com