- Page 2 and 3:
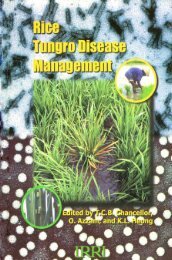
RICERATOONING1988INTERNATIONAL RICE
- Page 4 and 5:
ContentsForewordWelcome 1OverviewRi
- Page 6 and 7:
Genetics and varietal improvementIn
- Page 9 and 10:
2 RICE RATOONINGthe main crop. Harv
- Page 11 and 12:
4 RICE RATOONINGTable 1. Area, prod
- Page 13 and 14:
6 RICE RATOONINGTable 2. Rice varie
- Page 15 and 16:
8 RICE RATOONING1. Effect of spacin
- Page 17 and 18:
10 RICE RATOONINGHowever, no signif
- Page 19 and 20:
12 RICE RATOONINGrelating to seed v
- Page 21 and 22:
14 RICE RATOONING5. Cultivars that
- Page 24 and 25:
Economic perspectivesof rice ratoon
- Page 26 and 27:
ECONOMIC PERSPECTIVES OF RICE RATOO
- Page 28 and 29:
ECONOMIC PERSPECTIVES OF RICE RATOO
- Page 30 and 31:
ECONOMIC PERSPECTIVES OF RICE RATOO
- Page 32 and 33:
ECONOMIC PERSPECTIVES OF RICE RATOO
- Page 34 and 35:
ECONOMIC PERSPECTIVES OF RICE RATOO
- Page 36:
ECONOMIC PERSPECTIVES OF RICE RATOO
- Page 39 and 40:
32 RICE RATOONINGla) Developmental
- Page 41 and 42:
34 RICE RATOONINGCutting heightStub
- Page 43 and 44:
36 RICE RATOONINGEarly flooding enc
- Page 45 and 46:
38 RICE RATOONING2. Factors affecti
- Page 47 and 48:
40 RICE RATOONING27. Nair, N.R., an
- Page 49 and 50:
42 RICE RATOONING1. Changes in till
- Page 51 and 52:
44 RICE RATOONINGTable 2. Character
- Page 53 and 54:
46 RICE RATOONING9. International R
- Page 55 and 56:
48 RICE RATOONINGplot size is 6 row
- Page 57 and 58:
50 RICE RATOONINGimproved ratooning
- Page 59 and 60:
52 RICE RATOONINGTable 6. Simple co
- Page 62 and 63:
Utilization of rice ratooningby far
- Page 64 and 65:
RICE RATOONING IN RIO DE JANEIRO 57
- Page 66 and 67:
RICE RATOONING IN RIO DE JANEIRO 59
- Page 68 and 69:
Rice ratooningin the Dominican Repu
- Page 70 and 71:
RICE RATOONING IN THE DOMINICAN REP
- Page 72 and 73:
RICE RATOONING IN THE DOMINICAN REP
- Page 74:
RICE RATOONING IN THE DOMINICAN REP
- Page 77 and 78:
89111306514772Special points Refere
- Page 79 and 80:
72 RICE RATOONINGANDHRA PRADESHBasu
- Page 81 and 82:
74 RICE RATOONINGrice observed at t
- Page 83 and 84:
76 RICE RATOONINGTAMIL NADUBalasubr
- Page 85 and 86:
78 RICE RATOONING19. Reddy, T.G., M
- Page 87 and 88:
80 RICE RATOONING1. Rice-growing re
- Page 89 and 90:
82 RICE RATOONING2. High cutting he
- Page 91 and 92:
84 RICE RATOONINGTable 3. Yield tri
- Page 94 and 95:
Rice ratoon crop managementin the h
- Page 96 and 97:
RICE RATOON CROP MANAGEMENT IN KARN
- Page 98 and 99:
RICE RATOON CROP MANAGEMENT IN KARN
- Page 100 and 101:
23123722821721922222421423122421722
- Page 102:
RICE RATOON CROP MANAGEMENT IN KARN
- Page 105 and 106:
98 RICE RATOONING1. The Tungabhadra
- Page 107 and 108:
100 RICE RATOONINGthe results of po
- Page 109 and 110:
102 RICE RATOONINGTable 4. Effect o
- Page 112 and 113:
Ratoon rice researchin Karnataka, I
- Page 114 and 115:
RATOON RICE RESEARCH IN KARNATAKA 1
- Page 116:
RATOON RICE RESEARCH IN KARNATAKA 1
- Page 119 and 120:
112 RICE RATOONINGTable 1. Area and
- Page 121 and 122:
114 RICE RATOONINGonly 7.5-49.7% of
- Page 123 and 124:
116 RICE RATOONINGTable 5. Relation
- Page 126 and 127:
Scope for rice ratoon croppingin th
- Page 128 and 129:
RATOON CROPPING IN NORTHEASTERN IND
- Page 130 and 131:
Scope for rice ratoon croppingin th
- Page 132 and 133:
RATOON CROPPING IN CENTRAL AND NORT
- Page 134 and 135:
RATOON CROPPING IN CENTRAL AND NORT
- Page 136 and 137:
Potential of rice ratooningin Madag
- Page 138 and 139:
RICE RATOONING IN MADAGASCAR 131a.
- Page 140 and 141:
RICE RATOONING IN MADAGASCAR 133Tab
- Page 142 and 143:
Potential for rice ratooningin east
- Page 144 and 145:
RICE RATOONING IN EASTERN INDIA 137
- Page 146 and 147:
RICE RATOONING IN EASTERN INDIA 139
- Page 148 and 149: RICE RATOONING IN EASTERN INDIA 141
- Page 150 and 151: Ratooning in Bangladesh:prospects a
- Page 152 and 153: RATOONING IN BANGLADESH 145RATOON C
- Page 154 and 155: RATOONING IN BANGLADESH 147Table 4.
- Page 156: RATOONING IN BANGLADESH 149OTHER FA
- Page 159 and 160: 152 RICE RATOONINGTable 1. Hybrid s
- Page 161 and 162: 154 RICE RATOONINGThe studies sugge
- Page 163 and 164: 156 RICE RATOONINGVARIETIES AND CUL
- Page 165 and 166: 158 RICE RATOONINGspikelet primordi
- Page 167 and 168: 160 RICE RATOONINGTable 5. Effect o
- Page 170 and 171: Agronomic principles and practiceso
- Page 172 and 173: AGRONOMIC PRINCIPLES AND PRACTICES
- Page 174 and 175: AGRONOMIC PRINCIPLES AND PRACTICES
- Page 176 and 177: AGRONOMIC PRINCIPLES AND PRACTICES
- Page 178 and 179: AGRONOMIC PRINCIPLES AND PRACTICES
- Page 180 and 181: AGRONOMIC PRINCIPLES AND PRACTICES
- Page 182 and 183: AGRONOMIC PRINCIPLES AND PRACTICES
- Page 184 and 185: Rice ratooning: breeding,agronomic
- Page 186 and 187: BREEDING, AGRONOMIC PRACTICES, AND
- Page 188 and 189: BREEDING, AGRONOMIC PRACTICES, AND
- Page 190 and 191: BREEDING, AGRONOMIC PRACTICES, AND
- Page 192: BREEDING, AGRONOMIC PRACTICES, AND
- Page 195 and 196: 188 RICE RATOONINGwas the most effe
- Page 197: 190 RICE RATOONINGRESULTSMain crop
- Page 201 and 202: 194 RICE RATOONING9. Rister, M. E.,
- Page 203 and 204: 196 RICE RATOONINGExcept for rice w
- Page 205 and 206: 198 RICE RATOONINGInsect survivorsh
- Page 207 and 208: 200 RICE RATOONING1. Stem borer occ
- Page 209 and 210: 202 RICE RATOONING3. Population dyn
- Page 211 and 212: 204 RICE RATOONING2, 3). Microvelia
- Page 213 and 214: 206 RICE RATOONINGplant chemicals a
- Page 215 and 216: 208 RICE RATOONING17. Krishnamurthy
- Page 217 and 218: 210 RICE RATOONING1. Yellow dwarf c
- Page 219 and 220: 212 RICE RATOONING3. The effect of
- Page 221 and 222: 214 RICE RATOONINGAlthough the inte
- Page 223 and 224: 216 RICE RATOONINGTable 6. Sheath b
- Page 226 and 227: Yellow dwarf disease in ratoon rice
- Page 228 and 229: YELLOW DWARF DISEASE IN RATOON RICE
- Page 230 and 231: YELLOW DWARF DISEASE IN RATOON RICE
- Page 232: YELLOW DWARF DISEASE IN RATOON RICE
- Page 235 and 236: 228 RICE RATOONINGTable 1. Estimate
- Page 237 and 238: Main crop a Ratoon crop b53.956.155
- Page 240 and 241: Disease and insect pestsand their c
- Page 242 and 243: DISEASE AND INSECT PESTS IN RICE RA
- Page 244 and 245: DISEASE AND INSECT PESTS IN RICE RA
- Page 246 and 247: Inheritance of ratooning abilityin
- Page 248 and 249:
INHERITANCE OF RATOONING ABILITY IN
- Page 250 and 251:
INHERITANCE OF RATOONING ABILITY IN
- Page 252:
INHERITANCE OF RATOONING ABILITY IN
- Page 255 and 256:
248 RICE RATOONINGShould the season
- Page 257 and 258:
250 RICE RATOONINGYield and yield-c
- Page 259 and 260:
252 RICE RATOONINGMain-crop photosy
- Page 261 and 262:
254 RICE RATOONINGShort-termGiven t
- Page 264 and 265:
Commercial ratoon rice productionin
- Page 266 and 267:
COMMERCIAL RATOON RICE PRODUCTION I
- Page 268 and 269:
COMMERCIAL RATOON RICE PRODUCTION I
- Page 270:
COMMERCIAL RATOON RICE PRODUCTION I
- Page 273 and 274:
0.180.200.490.250.160.270.390.350.3
- Page 275 and 276:
268 RICE RATOONING1. Path analysis
- Page 277 and 278:
270 RICE RATOONINGRecommendationsVa
- Page 280 and 281:
ParticipantsT. AhmedRice Experiment
- Page 282 and 283:
Varietal indexA200, 221Achra 108/1,
- Page 284 and 285:
VARIETAL INDEX 277IR2061-465-1, 12I
- Page 286:
VARIETAL INDEX 279RU7502006, 49, 51


