You also want an ePaper? Increase the reach of your titles
YUMPU automatically turns print PDFs into web optimized ePapers that Google loves.
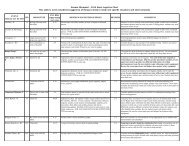
<strong>Enzyme</strong> <strong>Action</strong>:Testing Catalase ActivityDataQuest12Many organisms can decompose hydrogen peroxide (H 2 O 2 ) enzymatically. <strong>Enzyme</strong>s are globularproteins, responsible for most of the chemical activities of living organisms. They act ascatalysts, substances that speed up chemical reactions without being destroyed or altered duringthe process. <strong>Enzyme</strong>s are extremely efficient and may be used over and over again. One enzymemay catalyze thousands of reactions every second. Both the temperature and the pH at whichenzymes function are extremely important. Most organisms have a preferred temperature range inwhich they survive, and their enzymes most likely function best within that temperature range. Ifthe environment of the enzyme is too acidic or too basic, the enzyme may irreversibly denature,or unravel, until it no longer has the shape necessary for proper functioning.H 2 O 2 is toxic to most living organisms. Many organisms are capable of enzymatically destroyingthe H 2 O 2 before it can do much damage. H 2 O 2 can be converted to oxygen and water, as follows:2 H 2 O 2 2 H 2 O + O 2Although this reaction occurs spontaneously, the enzyme catalase increases the rate considerably.Catalase is found in most living organisms. A great deal can be learned about enzymes bystudying the rates of enzyme-catalyzed reactions.In this experiment, you will measure the rate of enzyme activity under various conditions, such asdifferent enzyme concentrations, pH values, and temperatures. It is possible to measure thepressure of oxygen gas formed as H 2 O 2 is destroyed. If a plot is made, it may appear similar tothe graph shown.At the start of the reaction, there is no product, and the pressure is the same as the atmosphericpressure. After a short time, oxygen accumulates at a rather constant rate. The slope of the curveat this initial time is constant and is called the initial rate. As the peroxide is destroyed, less of itis available to react and the O 2 is produced at lower rates. When no more peroxide is left, O 2 isno longer produced.Science with TI-Nspire Technology © Vernier Software & Technology 12 - 1
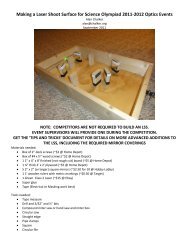
DataQuest 121 2 3 4OBJECTIVESIn this experiment you willFigure 1 Use a Gas Pressure Sensor to measure the production of oxygen gas as hydrogen peroxideis destroyed by the enzyme catalase or peroxidase at various enzyme concentrations. Measure and compare the initial rates of reaction for this enzyme when differentconcentrations of enzyme react with H 2 O 2 . Measure the production of oxygen gas as hydrogen peroxide is destroyed by the enzymecatalase or peroxidase at various temperatures. Measure and compare the initial rates of reaction for the enzyme at each temperature. Measure the production of oxygen gas as hydrogen peroxide is destroyed by the enzymecatalase or peroxidase at various pH values. Measure and compare the initial rates of reaction for the enzyme at each pH value.MATERIALSTI-Nspire handheld or600 mL beakercomputer and TI-Nspire softwareenzyme suspensiondata-collection interfacefour 18 150 mm test tubesVernier Gas Pressure Sensoricerubber-stopper assemblypH buffers10 mL graduated cylinder test tube rack250 mL beaker of water3% H 2 O 2thermometerfour dropper pipettesPROCEDURE1. Obtain and wear goggles.2. Connect the plastic tubing to the valve on the Gas Pressure Sensor.3. Connect the Gas Pressure Sensor to the data-collection interface. Connect the interface to theTI-Nspire handheld or computer.4. Choose New Experiment from the Experiment menu. Choose Collection Setup from theExperiment menu. Enter 0.5 as the rate (samples/second) and 180 as the experimentduration in seconds. The number of points collected should be 91. Select OK.12 - 2 Science with TI-Nspire Technology
B. Anatomy/Physiology Defined (Pg. 2)C. Subdivisions of Anatomy/Physiology (Pg. 2)D. Structural Heirarchy (Cells, Tissues, Organsand Systems (Pg. 3-4)E. Necessary Life Functions (Pg. 4-8)F. Homeostasis (Pg. 8-12)G. Anatomical Terminology/Language (Pg. 12-19)H. Review Questions (Pg. 22-23)2. Cellular Anatomy (Marieb, Chap. 3)A. Historical PerspectiveB. Basic Concepts/Cell Theory (Pg. 65-66)D. Cellular Properties (Pg. 65-66)E. Components of a Typical Generalized Cell(Pg. 66)F. Fluid Mosaic Model? (Pg. 67-69)G. Selected portions of Chapter Summary (Pg.1123-116)3. Tissue of the Human Body (Marieb, Chap. 4)A. Introduction to Tissues/Types (Pg. 118)B. Epithelial Tissue (Pg. 118-126)C. Connective Tissue (Pg. 126-139)D. Nervous Tissue (Pg. 139)E. Muscle Tissue (Pg. 139-141)F. Blood as a Separate Tissue? (Pg. 137-139)G. Tissue Repair (Pg. 143-145)H. Developmental Aspects of Tissues (Pg. 145)I. Selected portions of Chapter Summary (Pg. 148-150)UNIT II - COVERING AND SUPPORT OF THE BODY1. Integumentary System (Marieb, Chap. 5)A. The Skin (Pg. 152)B. Epidermis (Pg. 152-155)C. Dermis (Pg. 155-157)D. Skin Color (Pg. 157)H. Appendages/Organs of the Skin (Pg. 158-160)I. Functions (Pg. 163-165)J. Homeostatic Imbalances (Pg. 165-167)K. Selected Developmental Aspects (Pg. 170)3
23. Graph all four runs of data on a single graph.<strong>Enzyme</strong> <strong>Action</strong>: Testing Catalase Activitya. Click run4, and select All. All four runs will now be displayed on the same graph axes.b. Use the displayed graph and the data in Table 2 to answer the questions for Part II.Part III Testing the Effect of pH24. Insert a new problem in the document. Insert a new DataQuest App into problem 3. ChooseNew Experiment from the Experiment menu. Choose Collection Setup from theExperiment menu. Enter 0.5 as the rate (samples/second) and 180 as the experimentduration in seconds. The number of points collected should be 91. Select OK.25. Place three clean test tubes in a rack and label them pH 4, pH 7, and pH 10.26. Add 3 mL of 3% H 2 O 2 and 3 mL of the appropriate pH buffer to each labeled test tube label.27. In the tube labeled pH 4, add 2 drops of the enzyme solution. Repeat Steps 8–13, except thistime record the reaction rate in Table 3.28. Click the Store Latest Data Set button ( ) to save the first run. In the tube labeled pH 7, add2 drops of the enzyme solution. Repeat Steps 8–13, again recording the reaction rate in Table3.29. Click the Store Latest Data Set button ( ) to save the second run. In the tube labeled pH 10,add 2 drops of the enzyme solution. Repeat Steps 8–13, again recording the reaction rate inTable 3.30. Graph all three runs of data on a single graph.a. Click run3 and select All. All three runs will now be displayed on the same graph axes.b. Use the displayed graph and the data in Table 3 to answer the questions for Part III.DATATable 1Label1 drop2 drops3 drops4 dropsRate(kPa/s)Reaction Rate(kPa/min)Science with TI-Nspire Technology 12 - 5
DataQuest 12DATA (CONT.)Table 2LabelActualTemperature (°C)Rate(kPa/s)Reaction Rate(kPa/min)0–5°C20–25°C30–35°C50–55°CTable 3LabelRate(kPa/s)Reaction Rate(kPa/min)pH 4pH 7pH 10PROCESSING THE DATA1. Convert your reaction rates from kPa/s to kPa/min. Record the rates in the appropriate tables.2. Create summary graphs for the data in each part.a. Insert a new problem in the document, then Insert a new DataQuest App into problem 4.Click on the Table View tab ( ) to view the Table.b. Double click on the X column to access the column options. Enter Test Tube for thecolumn name. Change the Display Precision to 0 decimal places. Select OK.c. Double click on the Y column to access the column options. Enter Rate for the columnname. Enter kPa/min as the units. Select OK.d. Using the data from Table 1, enter the values in the DataQuest Table. Use the number ofdrops in the Test Tube column.e. Choose New Data Set from the Data menu. Using the data from Table 2, enter thevalues in the DataQuest Table. Use the actual temperature in the Test Tube column.f. Choose New Data Set from the Data menu. Using the data from Table 3, enter thevalues in the DataQuest Table. Use the pH value in the Test Tube column.g. For each data set, double click the data set name and change the name to something moremeaningful (for example, change run1 to Concentration).h. Click on the Graph View tab ( ) to view the summary graphs. To view the differentsummary graphs, click on the run indicator and select the desired run.12 - 6 Science with TI-Nspire Technology
<strong>Enzyme</strong> <strong>Action</strong>: Testing Catalase ActivityQUESTIONSPart I Effect of <strong>Enzyme</strong> Concentration1. How does changing the concentration of enzyme affect the rate of decomposition of H 2 O 2 ?2. What do you think will happen to the rate of reaction if the concentration of enzyme isincreased to five drops? Predict what the rate would be for 5 drops.Part II Effect of Temperature3. At what temperature is the rate of enzyme activity the highest? Lowest? Explain.4. How does changing the temperature affect the rate of enzyme activity? Does this follow apattern you anticipated?5. Why might the enzyme activity decrease at very high temperatures?Part III Effect of pH6. At what pH is the rate of enzyme activity the highest? Lowest?7. How does changing the pH affect the rate of enzyme activity? Does this follow a pattern youanticipated?EXTENSIONS1. Different organisms often live in very different habitats. Design a series of experiments toinvestigate how different types of organisms might affect the rate of enzyme activity.Consider testing a plant, an animal, and a protist.2. Presumably, at higher concentrations of H 2 O 2 , there is a greater chance that an enzymemolecule might collide with H 2 O 2 . If so, the concentration of H 2 O 2 might alter the rate ofoxygen production. Design a series of experiments to investigate how differingconcentrations of the substrate hydrogen peroxide might affect the rate of enzyme activity.3. Design an experiment to determine the effect of boiling catalase on the reaction rate.4. Explain how environmental factors affect the rate of enzyme-catalyzed reactions.Science with TI-Nspire Technology 12 - 7