Temporal Trends in Lake Erie Plankton Biomass - University of ...
Temporal Trends in Lake Erie Plankton Biomass - University of ...
Temporal Trends in Lake Erie Plankton Biomass - University of ...

Create successful ePaper yourself
Turn your PDF publications into a flip-book with our unique Google optimized e-Paper software.
J. Great <strong>Lake</strong>s Res. 31(Suppl. 2):89–110Internat. Assoc. Great <strong>Lake</strong>s Res., 2005<strong>Temporal</strong> <strong>Trends</strong> <strong>in</strong> <strong>Lake</strong> <strong>Erie</strong> <strong>Plankton</strong> <strong>Biomass</strong>:Roles <strong>of</strong> External Phosphorus Load<strong>in</strong>g and Dreissenid MusselsJoseph D. Conroy 1,* , Douglas D. Kane 1 , David M. Dolan 2 , William J. Edwards 3 ,Murray N. Charlton 4 , and David A. Culver 11 Department <strong>of</strong> Evolution, Ecology, and Organismal BiologyThe Ohio State <strong>University</strong>Columbus, Ohio 432102 Department <strong>of</strong> Natural and Applied Sciences<strong>University</strong> <strong>of</strong> Wiscons<strong>in</strong>–Green BayGreen Bay, Wiscons<strong>in</strong> 543113 Department <strong>of</strong> BiologyNiagara <strong>University</strong>Lewiston, New York 141094 National Water Research InstituteEnvironment CanadaBurl<strong>in</strong>gton, Ontario L7R 4A6ABSTRACT. We compare the results <strong>of</strong> lakewide plankton studies conducted dur<strong>in</strong>g 1996–2002 withdata reported <strong>in</strong> the literature from previous years to evaluate the effectiveness <strong>of</strong> cont<strong>in</strong>ued nutrient control,the relationship between external phosphorus load<strong>in</strong>g and plankton abundance, and the many predictedoutcomes <strong>of</strong> the dreissenid <strong>in</strong>vasion. We found that although recent external annual phosphorusload<strong>in</strong>g has not changed s<strong>in</strong>ce reach<strong>in</strong>g mandated target levels <strong>in</strong> the early- to mid-1980s, phytoplanktoncommunities have. Total phytoplankton biomass, measured through enumeration and size-frequency distributions,has <strong>in</strong>creased s<strong>in</strong>ce m<strong>in</strong>ima were observed <strong>in</strong> 1996 or 1997, with summer (July–September)biomasses generally greater than before the dreissenid establishment <strong>in</strong> the late 1980s. Cyanobacteriabiomass also <strong>in</strong>creased dur<strong>in</strong>g summer <strong>in</strong> all bas<strong>in</strong>s after the dreissenid <strong>in</strong>vasion. In contrast, chlorophylla concentration has decreased <strong>in</strong> all bas<strong>in</strong>s dur<strong>in</strong>g both spr<strong>in</strong>g and summer. However chlorophyll a concentrationwas poorly correlated with total phytoplankton biomass. Relative to the mid-1980s, crustaceanzooplankton biomass dur<strong>in</strong>g the years 1996–2002 <strong>in</strong>creased <strong>in</strong> the western bas<strong>in</strong> dur<strong>in</strong>g spr<strong>in</strong>g and summer,<strong>in</strong>creased <strong>in</strong> the central bas<strong>in</strong> dur<strong>in</strong>g spr<strong>in</strong>g but rema<strong>in</strong>ed the same dur<strong>in</strong>g summer, and decreasedto low levels <strong>in</strong> the eastern bas<strong>in</strong>. Several <strong>of</strong> these observations are consistent with predictions made byprevious researchers on the effects <strong>of</strong> reduced total external phosphorus load<strong>in</strong>g and the stimulatory or<strong>in</strong>hibitory effects <strong>of</strong> dreissenid mussels. However, several were not. Results from this study, particularlythe <strong>in</strong>consistencies with tested predictions, highlight the need for further research <strong>in</strong>to the factors thatregulate plankton community dynamics <strong>in</strong> <strong>Lake</strong> <strong>Erie</strong>.INDEX WORDS:<strong>Lake</strong> <strong>Erie</strong>, plankton, chlorophyll, phosphorus, eutrophication, Dreissena.INTRODUCTION* Correspond<strong>in</strong>g author. E-mail: conroy.27@osu.eduOver the past 30 years, the <strong>Lake</strong> <strong>Erie</strong> ecosystemhas dramatically changed. Dur<strong>in</strong>g the late 1960sand early 1970s, much <strong>in</strong>ternational effort went <strong>in</strong>tosampl<strong>in</strong>g and quantify<strong>in</strong>g <strong>Lake</strong> <strong>Erie</strong> system parameters<strong>in</strong> order to understand how cultural eutrophicationhad impacted its function (Burns and Ross1972). With the passage <strong>of</strong> the Great <strong>Lake</strong>s WaterQuality Agreement (GLWQA) <strong>of</strong> 1972 and its revision<strong>in</strong> 1978, reduced phosphorus load from municipalsources was predicted to lead to a reduction <strong>in</strong>the total algal biomass, the <strong>in</strong>cidence and extent <strong>of</strong>89
90 Conroy et al.harmful algal blooms (e.g., cyanobacterial blooms),and the frequency and duration <strong>of</strong> central bas<strong>in</strong> hypoxia/anoxia(McGucken 2000, Beeton 2002). Asannual phosphorus loads to <strong>Lake</strong> <strong>Erie</strong> decreased <strong>in</strong>the mid-1980s (Dolan 1993), decreased total phytoplanktonbiomass and a reduction <strong>in</strong> the abundance<strong>of</strong> eutrophic <strong>in</strong>dicator species (e.g., Aphanizomenonflos-aquae) suggested that <strong>Lake</strong> <strong>Erie</strong> water qualitywas <strong>in</strong>deed improv<strong>in</strong>g (Makarewicz 1993a). However,central bas<strong>in</strong> hypolimnetic dissolved oxygenconcentrations cont<strong>in</strong>ued to show hypoxia (concentrations< 4 mg L –1 ) dur<strong>in</strong>g late summer (Charltonet al. 1993). More recent <strong>in</strong>vestigations reportedthat the frequency <strong>of</strong> cyanobacterial blooms was <strong>in</strong>creas<strong>in</strong>g(Vanderploeg et al. 2001, Budd et al.2001, V<strong>in</strong>cent et al. 2004, Conroy and Culver2005), suggest<strong>in</strong>g that <strong>Lake</strong> <strong>Erie</strong> was return<strong>in</strong>g tomore eutrophic conditions. Concomitantly, stillother researchers observed decreases <strong>in</strong> phytoplanktonbiomass (measured as chlorophyll a concentration)<strong>in</strong> the central and eastern bas<strong>in</strong>s (Matis<strong>of</strong>f andCiborowski 2005) with <strong>in</strong>creas<strong>in</strong>g total phosphorusconcentrations (Charlton and Milne 2004). Accord<strong>in</strong>gly,the <strong>Lake</strong> <strong>Erie</strong> Trophic Status (LETS) studywas <strong>in</strong>itiated <strong>in</strong> 2002 as a partnership between researchersfrom Canada and the United States underthe sponsorship <strong>of</strong> Environment Canada and theUnited States Environmental Protection Agency to<strong>in</strong>vestigate these seem<strong>in</strong>gly contradictory phenomena(Matis<strong>of</strong>f and Ciborowski 2005).One <strong>of</strong> the ma<strong>in</strong> goals <strong>of</strong> GLWQA was to preventgrowth <strong>of</strong> nuisance algae (Koonce et al. 1996). Becausephosphorus is usually the growth-limit<strong>in</strong>g element<strong>in</strong> freshwater systems (Sch<strong>in</strong>dler 1974),external phosphorus load<strong>in</strong>g to <strong>Lake</strong> <strong>Erie</strong> needed tobe reduced <strong>in</strong> order to accomplish this goal. Over$8 billion (USD, adjusted to 1990) has been spenton build<strong>in</strong>g and updat<strong>in</strong>g sewage treatment plantsalone (USEPA 2004). Millions (or billions) <strong>of</strong> dollarsmore have been spent on research, outreach,and implementation <strong>of</strong> new technologies to reduceexternal phosphorus load<strong>in</strong>g to <strong>Lake</strong> <strong>Erie</strong>(McGucken 2000). Dur<strong>in</strong>g most years s<strong>in</strong>ce theearly 1980s, these measures have worked to br<strong>in</strong>gexternal phosphorus load<strong>in</strong>g to <strong>Lake</strong> <strong>Erie</strong> below the11 kilotonne year –1 target load established byGLWQA (Dolan 1993, Dolan and McGunagle2005). Because successfully reduc<strong>in</strong>g externalphosphorus load<strong>in</strong>g to <strong>Lake</strong> <strong>Erie</strong> was so expensive,it is important to ask whether the reductions haveled to reduced nuisance algal growth.The establishment <strong>of</strong> Ponto-Caspian zebra (Dreissenapolymorpha, Hebert et al. 1989) and quaggamussels (D. bugensis, May and Marsden 1992) <strong>in</strong> thelate 1980s, hereafter collectively referred to as dreissenids,signified another possible explanation for decreas<strong>in</strong>gphytoplankton stand<strong>in</strong>g stock. As voraciousfilter feeders, these mussels were <strong>in</strong>itially hypothesizedto be able to filter enough water to potentiallydeplete phytoplankton stand<strong>in</strong>g stocks (MacIsaac etal. 1992). Nearshore Secchi transparency <strong>in</strong>creases<strong>in</strong> the early 1990s (Holland 1993) provided <strong>in</strong>directevidence for a reduction <strong>of</strong> phytoplankton communities.Removal <strong>of</strong> large amounts <strong>of</strong> phytoplanktoncould potentially reduce zooplankton stand<strong>in</strong>gstocks, possibly harm<strong>in</strong>g the productive lake fisherythrough reduction <strong>in</strong> food resources for young-<strong>of</strong>the-yearfish (MacIsaac 1996).Conversely, dreissenids may stimulate phytoplanktonstand<strong>in</strong>g stock and productivity throughnutrient rem<strong>in</strong>eralization, i.e., conversion <strong>of</strong> <strong>in</strong>gestedparticles <strong>in</strong>to soluble nutrients (Heath et al.1995, Arnott and Vanni 1996, Conroy et al. 2005a),and/or selective filtration <strong>of</strong> some algal taxa (Vanderploeget al. 2001, 2002). The rem<strong>in</strong>eralization <strong>of</strong>ammonia-nitrogen and phosphate-phosphorus(Heath et al. 1995, Arnott and Vanni 1996, Conroyet al. 2005a) may be especially important. Conroyet al. (2005a) compared estimated dreissenid communityexcretion with that <strong>of</strong> the zooplankton communityat a nearshore station <strong>in</strong> the western bas<strong>in</strong> <strong>of</strong><strong>Lake</strong> <strong>Erie</strong>, and found that dreissenids added approximately50 mg m –2 d –1 <strong>of</strong> ammonia-nitrogen (twicethat <strong>of</strong> the crustacean zooplankton community) and3 mg m –2 d –1 <strong>of</strong> phosphate-phosphorus (one-quarter<strong>of</strong> the crustacean zooplankton community). Becausethe nitrogen:phosphorus ratio <strong>of</strong> excreted nutrientswas below Smith’s (1983) threshold (29:1 bymass) said to favor cyanobacterial growth (Arnottand Vanni 1996, Conroy et al. 2005a), dreissenidsmay facilitate growth <strong>of</strong> these phytoplankton taxathroughout the western bas<strong>in</strong> and <strong>in</strong> nearshore areaswhere physical mix<strong>in</strong>g rates are high (Conroy et al.2005a). Vanderploeg et al. (2001) performed dreissenidfiltration experiments with various comb<strong>in</strong>ations<strong>of</strong> natural seston and culture media and foundthat dreissenids selected aga<strong>in</strong>st <strong>in</strong>gestion <strong>of</strong> Microcystisspp. from <strong>Lake</strong> <strong>Erie</strong> but selected for a Microcystisstra<strong>in</strong> from a laboratory culture (their Fig. 4).In this same study, they found that dreissenids selectedfor phytoplankton mixtures conta<strong>in</strong><strong>in</strong>g cryptophytes.The balance between stimulatory and<strong>in</strong>hibitory effects <strong>of</strong> dreissenids on various phytoplanktontaxa has not been fully elucidated, butboth effects likely dom<strong>in</strong>ate at different times and<strong>in</strong> different locations.
<strong>Temporal</strong> <strong>Trends</strong> <strong>in</strong> <strong>Lake</strong> <strong>Erie</strong> <strong>Plankton</strong> <strong>Biomass</strong> 91TABLE 1. Literature-derived proposed effects <strong>of</strong> dreissenids on Laurentian Great <strong>Lake</strong> total phytoplanktonbiomass, cyanobacterial biomass, and/or chlorophyll a concentration. A downward po<strong>in</strong>t<strong>in</strong>g arrow<strong>in</strong>dicates a negative relationship was proposed; an upward po<strong>in</strong>t<strong>in</strong>g arrow, a positive relationship; a zero,no relationship was found; and, a dash, a relationship was not proposed.Dreissenid effect onTotal Phytoplankton Chlorophyll a CyanobacteriaStudy Spr<strong>in</strong>g Summer Spr<strong>in</strong>g Summer Spr<strong>in</strong>g SummerVanderploeg et al. 2001, 2002 ↓ ↑ — — — ↑Barbiero and Tuchman 2004b WB — — ↓ ↓ — —CB — — 0 ↓ — —EB — — 0 ↓ — —Makarewicz et al. 1999* WB ↓ ↓ ↓ 0 ↑ ↓CB ↑ 0 ↑ 0 ↑ 0EB 0 0 0 0 ↓ 0Conroy et al. 2005a ↑ ↑ 0 0 ↑ ↑Hecky et al. 2004 @ ↑ ↑ 0 0 0 0↓<strong>in</strong>dicates a proposed negative effect, ↑ a proprosed positive effect, 0 no effect, — relationship not given, * proposedeffect for the <strong>of</strong>fshore only, @ nearshore onlyVanderploeg et al. (2002), supported by severalyears’ worth <strong>of</strong> data from Sag<strong>in</strong>aw Bay (their Fig.6b), proposed that dur<strong>in</strong>g the spr<strong>in</strong>g, dreissenidsfreely grazed phytoplankton, reduc<strong>in</strong>g total phytoplanktonbiomass. However, dur<strong>in</strong>g summer, dreissenidswere unable to control cyanobacterialblooms due to selective filtration aga<strong>in</strong>st cyanobacteriaand, consequently, total phytoplankton biomass<strong>in</strong>creased. In direct contrast to their study,Barbiero and Tuchman’s (2004b) multi-year(1983–2004) study <strong>of</strong> water clarity throughout <strong>Lake</strong><strong>Erie</strong> before and after the dreissenid <strong>in</strong>vasion foundthat transparency decreased <strong>in</strong> the western and centralbas<strong>in</strong>s and <strong>in</strong>creased <strong>in</strong> the eastern bas<strong>in</strong> dur<strong>in</strong>gspr<strong>in</strong>g after dreissenids arrived and <strong>in</strong>creased <strong>in</strong> thecentral bas<strong>in</strong> but rema<strong>in</strong>ed the same <strong>in</strong> the westernand eastern bas<strong>in</strong>s dur<strong>in</strong>g summer <strong>in</strong> years withdreissenids present. However, Barbiero and Tuchman(2004b) found chlorophyll a concentrationssignificantly decreased <strong>in</strong> the western bas<strong>in</strong> dur<strong>in</strong>gspr<strong>in</strong>g, support<strong>in</strong>g Vanderploeg et al.’s (2002) f<strong>in</strong>d<strong>in</strong>gs,yet concentrations decreased <strong>in</strong> all threebas<strong>in</strong>s <strong>in</strong> summer, conflict<strong>in</strong>g with Vanderploeg etal.’s f<strong>in</strong>d<strong>in</strong>gs. Makarewicz et al. (1999) comparedphytoplankton biomass from before (1983–88/9)and after (1989/90–93) dreissenid establishment <strong>in</strong><strong>Lake</strong> <strong>Erie</strong> and found both <strong>in</strong>creases and decreases<strong>in</strong> total phytoplankton biomass, cyanobacterial biomass,and chlorophyll a concentration, depend<strong>in</strong>gon the bas<strong>in</strong> and season (spr<strong>in</strong>g or summer) be<strong>in</strong>g<strong>in</strong>vestigated. Hecky et al. (2004) have observednearshore benthic algal <strong>in</strong>creases <strong>in</strong> the late 1990sthat they attributed to dreissenid re-eng<strong>in</strong>eer<strong>in</strong>g <strong>of</strong>energy and nutrient flow <strong>in</strong> the nearshore benthos, aphenomenon that they termed the “nearshoreshunt.” We have summarized the effects <strong>of</strong> dreissenidson total phytoplankton biomass, cyanobacteriabiomass, and chlorophyll a concentrationsproposed <strong>in</strong> the literature reviewed above (Table 1).The resultant effect <strong>of</strong> purported dreissenid-mediatedchanges to the phytoplankton community onthe crustacean zooplankton community could be eitherstimulatory or <strong>in</strong>hibitory, depend<strong>in</strong>g onwhether dreissenid mussels decreased or <strong>in</strong>creasedphytoplankton biomass and whether their activity<strong>in</strong>creased the abundance <strong>of</strong> cyanobacteria. Furthermore,if dreissenid mussels directly compete withzooplankton for phytoplankton, we would expectdecreased crustacean zooplankton abundance(MacIsaac 1996). However, low turbulent mix<strong>in</strong>grestricts adult dreissenids’ ability to affect planktoncommunities to shallow, well-mixed areas (Yu andCulver 1999, Ackerman et al. 2001, Noonburg etal. 2003, Edwards et al. 2005), so it is unreasonable
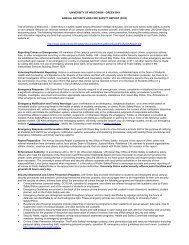
92 Conroy et al.to expect persistent decl<strong>in</strong>es <strong>in</strong> <strong>of</strong>fshore phytoplanktonand zooplankton to be associated withdreissenid graz<strong>in</strong>g <strong>in</strong> large lakes.We comb<strong>in</strong>ed recent lake-wide plankton surveydata with historical data to <strong>in</strong>vestigate whether thechronological pattern <strong>of</strong> phytoplankton and zooplanktonchanges <strong>in</strong> <strong>Lake</strong> <strong>Erie</strong> can be better expla<strong>in</strong>edby observed changes <strong>in</strong> phosphorus load<strong>in</strong>gor by the establishment <strong>of</strong> dreissenid mussels <strong>in</strong> thethree bas<strong>in</strong>s <strong>of</strong> <strong>Lake</strong> <strong>Erie</strong>. In particular, we askedwhether or not plankton populations have cont<strong>in</strong>uedto decrease <strong>in</strong> concert with phosphorus load<strong>in</strong>g controls,to determ<strong>in</strong>e whether estimated annual totalexternal phosphorus load to <strong>Lake</strong> <strong>Erie</strong> is a goodpredictor <strong>of</strong> plankton biomass, and to test publishedpredictions <strong>of</strong> the role <strong>of</strong> <strong>in</strong>vasive dreissenid filterfeeders on phytoplankton community abundanceand composition. We tested whether (1) phytoplanktonbiomass (characterized by wet mass andchlorophyll a) <strong>in</strong> the western, central, and easternbas<strong>in</strong>s were <strong>in</strong>deed at their historical m<strong>in</strong>ima <strong>in</strong>2002; (2) <strong>Lake</strong> <strong>Erie</strong> plankton biomass is directlycorrelated to annual estimated phosphorus load<strong>in</strong>g;and, (3) phytoplankton and zooplankton abundancepatterns dur<strong>in</strong>g spr<strong>in</strong>g and summer are consistentwith stimulatory or <strong>in</strong>hibitory effects <strong>of</strong> dreissenidmussels as proposed by previous studies (Table 1).The overall goal <strong>of</strong> this study is to better understand<strong>Lake</strong> <strong>Erie</strong> plankton abundance as predicted by nutrientload<strong>in</strong>g and how it may be affected by awidespread, <strong>in</strong>vasive filter feeder.METHODSWe comb<strong>in</strong>ed our recent measures <strong>of</strong> phytoplanktonbiomass (1996–2002; Conroy et al. 2005b) withthose <strong>of</strong> Munawar and Munawar (1976), DeVaultand Rockwell (1986), Makarewicz (1993a), andMakarewicz et al. (1999), our chlorophyll a concentrationdata with those <strong>of</strong> Glooschenko et al.(1974) and Makarewicz et al. (1999), and our zooplanktonbiomass data with those <strong>of</strong> Watson (1976),Watson and Carpenter (1974), Bean (1980),Makarewicz (1993b), and Weisgerber (2000), andcompared all <strong>of</strong> them with estimates <strong>of</strong> annual totalexternal phosphorus load to <strong>Lake</strong> <strong>Erie</strong> (Dolan 1993,Dolan and McGunagle 2005). Integrat<strong>in</strong>g manydatasets <strong>in</strong> this manner allowed us to exam<strong>in</strong>e atime period extend<strong>in</strong>g from the period <strong>of</strong> greatestcultural eutrophication <strong>in</strong> <strong>Lake</strong> <strong>Erie</strong> (1970), throughphosphorus load reductions (mid-1980s) and the establishment<strong>of</strong> dreissenids (late 1980s and early1990s), and <strong>in</strong>to recent years (late 1990s and early2000s). Unfortunately, the assembled planktondataset is neither cont<strong>in</strong>uous (there are large gapsbetween sampl<strong>in</strong>g years) nor were the same sitesvisited at the same times <strong>in</strong> each year. To controlfor these shortcom<strong>in</strong>gs, we have tried to draw datafrom as many different sources as possible, havesplit the available data <strong>in</strong>to spr<strong>in</strong>g and summer periodsfor the various studies, and have used severalmeasures <strong>of</strong> central tendency (arithmetic and geometricmeans and medians) and data dispersion(standard deviations and quartiles) to better understandthe <strong>in</strong>herent variability <strong>in</strong> seasonal planktondata. Total phosphorus load<strong>in</strong>g estimates are basedon Dolan (1993) and Dolan and McGunagle (2005),and <strong>in</strong>clude contributions from monitored and unmonitoredtributaries, atmospheric deposition, direct<strong>in</strong>dustrial and municipal po<strong>in</strong>t sources, and<strong>in</strong>put from <strong>Lake</strong> Huron. Below, we more fully describeour recent plankton dataset and the sources<strong>of</strong> the historical plankton data.Sampl<strong>in</strong>g PeriodLEPAS—The <strong>Lake</strong> <strong>Erie</strong> <strong>Plankton</strong>Abundance StudyS<strong>in</strong>ce 1995, an <strong>in</strong>ternational, multi-agency, <strong>in</strong>tensivesampl<strong>in</strong>g program (LEPAS) has been conductedto determ<strong>in</strong>e the abundance and biomass <strong>of</strong>phyto- and zooplankton along with chlorophyll aconcentration, water temperature, water columndissolved oxygen concentration, and Secchi depththroughout <strong>Lake</strong> <strong>Erie</strong> (Fig. 1). Semi-monthly sampleshave generally been collected annually fromMay through September (Table 2; 1995 data are not<strong>in</strong>cluded <strong>in</strong> this manuscript because sampl<strong>in</strong>g extendedonly through late June <strong>in</strong> that year). Allsamples were taken by personnel from the Ohio Division<strong>of</strong> Wildlife Fisheries Research Units (Sanduskyand Fairport Harbor, Ohio), the NationalWater Research Institute (Burl<strong>in</strong>gton, Ontario,Canada) or the Ontario M<strong>in</strong>istry <strong>of</strong> Natural Resources(Wheatley, Ontario, Canada). Regular annualsampl<strong>in</strong>g was supplemented <strong>in</strong> June, July,August, and September 2002 by cruises aboard theUSEPA’s R/V <strong>Lake</strong> Guardian to better connect withother analyses be<strong>in</strong>g performed for the <strong>Lake</strong> <strong>Erie</strong>Trophic Status study (this volume).Field MethodsPhytoplankton and chlorophyll a samples weretaken from an <strong>in</strong>tegrated water column sampleus<strong>in</strong>g a tube sampler (2.5-cm ID polyv<strong>in</strong>yl chloride
<strong>Temporal</strong> <strong>Trends</strong> <strong>in</strong> <strong>Lake</strong> <strong>Erie</strong> <strong>Plankton</strong> <strong>Biomass</strong> 93FIG. 1. <strong>Lake</strong> <strong>Erie</strong> <strong>Plankton</strong> Abundance Study collection sites, 1996 through 2002. Open andclosed circles show sampl<strong>in</strong>g locations <strong>of</strong> the Sandusky and Fairport Fishery Research Units <strong>of</strong>the Ohio Department <strong>of</strong> Natural Resources, Division <strong>of</strong> Wildlife, respectively; stars show sitessampled by the National Water Research Institute; and, crosses show sampl<strong>in</strong>g locations fromthe <strong>Lake</strong> <strong>Erie</strong> Trophic Status Project. Note: Not all sites were sampled <strong>in</strong> all years.pipe or v<strong>in</strong>yl tube) to twice the Secchi depth. Supplementalsampl<strong>in</strong>g <strong>in</strong> 2002 aboard the R/V <strong>Lake</strong>Guardian used comb<strong>in</strong>ed surface and bottom <strong>of</strong> theepilimnion (as def<strong>in</strong>ed by <strong>in</strong> situ SeaBird CTDtraces) water samples <strong>in</strong>stead <strong>of</strong> the <strong>in</strong>tegrated tubesampler for phytoplankton and chlorophyll a. Watercolumn samples were dispensed <strong>in</strong>to a bucket fromwhich <strong>in</strong>tegrated <strong>in</strong>dividual phytoplankton andchlorophyll a samples were taken and immediatelypreserved. For phytoplankton, a 500-mL subsamplewas preserved with Lugol’s solution; for chlorophylla samples, at least a 1,000-mL subsample wastaken and stored on ice <strong>in</strong> an amber Nalgene bottle,filtered through a Whatman GF/C (1.2-µm nom<strong>in</strong>alpore size) filter, and frozen <strong>in</strong> light-pro<strong>of</strong> conta<strong>in</strong>ersfor later chlorophyll a determ<strong>in</strong>ation.Zooplankton was sampled by vertically tow<strong>in</strong>g afront-weighted zooplankton net (0.5 m diameter, 64µm mesh) fitted with a General Oceanics 2030Rmodel flow meter and 500-mL jar. The net waslowered with the open end po<strong>in</strong>t<strong>in</strong>g downward untilthe 2-kg weight fastened to the front bridle by a 1-m l<strong>in</strong>e hit bottom. The net was then retrieved, allow<strong>in</strong>gthe water column to be sampled both as thenet was lowered and as it was pulled up, whileavoid<strong>in</strong>g collect<strong>in</strong>g mud from the bottom. Sampleswere concentrated and preserved with a 4% sugarformaldehyde solution (Haney and Hall 1973). Volumesampled was calculated from the calibratedflow meter read<strong>in</strong>gs (m) and the cross-sectionalarea sampled by the net (0.1963 m 2 ). Four cubicmeters <strong>of</strong> water was typically sampled <strong>in</strong> the westernbas<strong>in</strong>. Proportionately larger volumes weresampled from deeper areas <strong>of</strong> the lake.
94 Conroy et al.TABLE 2. <strong>Lake</strong> <strong>Erie</strong> <strong>Plankton</strong> Abundance Study annual bas<strong>in</strong>-specific phytoplankton biomass (A; mg wet mass L –1 ) and zooplanktonbiomass (B; mg dry mass L –1 ), show<strong>in</strong>g beg<strong>in</strong> and end sampl<strong>in</strong>g dates, number <strong>of</strong> samples, spr<strong>in</strong>g (May and June) and summer(July–September) measures <strong>of</strong> biomass central tendency (arithmetic [Mean A ] and geometric means [Mean G ] and median) and dataspread (arithmetic and geometric (lower and upper bounds) standard deviations [s A and s G , respectively] and first and third quartiles).(A) Spr<strong>in</strong>g Total Phytoplankton <strong>Biomass</strong> Summer Total Phytoplankton <strong>Biomass</strong>#Start End Samples Quartiles QuartilesBas<strong>in</strong> Year Date Date Sp./Su. Mean A s A Mean G s G Median (1st,3rd) Mean A s A Mean G s G Median (1st,3rd)Western 1996 22/5 25/9 123/231 0.65 0.67 0.41 (0.15,1.14) 0.44 (0.22,0.83) 0.79 1.38 0.27 (0.06,1.35) 0.32 (0.11,0.80)1997 9/5 24/9 36/57 0.63 0.70 0.41 (0.16,1.03) 0.41 (0.20,0.68) 1.03 1.26 0.53 (0.15,1.83) 0.59 (0.22,1.30)1998 26/5 28/9 47/87 1.67 1.39 1.16 (0.41,3.23) 1.15 (0.79,2.28) 5.48 9.94 2.27 (0.67,7.15) 1.83 (1.06,3.87)1999 17/5 28/9 32/53 1.25 0.84 1.03 (0.55,1.93) 0.94 (0.64,1.72) 2.52 2.25 1.86 (0.84,4.07) 1.98 (0.98,2.79)2000 2/5 18/9 23/29 1.87 1.44 1.38 (0.61,3.16) 1.39 (0.86,2.89) 2.33 2.06 1.61 (0.65,3.95) 1.91 (0.74,3.29)2001 14/5 17/9 33/28 2.20 1.23 1.86 (0.99,3.48) 2.11 (1.14,2.80) 3.80 2.86 2.97 (1.46,6.03) 2.65 (1.59,5.64)2002 7/5 30/9 21/44 3.31 6.49 1.42 (0.32,6.23) 1.68 (0.95,2.64) 3.12 4.22 0.62 (0.04,9.59) 2.04 (0.31,3.52)Central 1996 12/6 20/9 29/42 0.70 0.71 0.53 (0.26,1.06) 0.50 (0.34,0.74) 0.56 0.57 0.38 (0.15,0.97) 0.40 (0.22,0.57)1997 7/5 29/8 23/26 0.54 0.67 0.29 (0.09,1.00) 0.33 (0.13,0.62) 0.33 0.39 0.18 (0.05,0.62) 0.22 (0.10,0.37)1998 9/6 27/8 24/49 0.93 0.61 0.78 (0.42,1.43) 0.85 (0.57,1.01) 1.27 1.34 0.88 (0.38,2.01) 0.81 (0.49,1.25)1999 18/5 9/9 23/32 0.68 0.54 0.55 (0.30,1.03) 0.57 (0.37,0.75) 1.34 1.89 0.78 (0.20,3.02) 0.88 (0.63,1.33)2000 9/5 8/9 28/16 1.32 1.10 0.88 (0.34,2.33) 1.11 (0.40,2.10) 1.07 5.75 0.92 (0.51,1.67) 0.94 (0.68,1.34)2001 23/5 2/8 20/8 2.94 11.24 0.47 (0.14,1.60) 0.36 (0.29,0.56) 0.93 0.96 0.70 (0.34,1.44) 0.64 (0.44,0.88)2002 25/6 26/9 10/85 0.63 0.50 0.21 (0.02,2.76) 0.69 (0.23,0.97) 1.21 1.24 0.78 (0.29,2.12) 0.91 (0.39,1.62)Eastern 1996 24/6 18/9 4/7 0.25 0.17 0.22 (0.12,0.38) 0.18 (0.15,0.28) 0.47 0.60 0.30 (0.12,0.76) 0.28 (0.18,0.37)1997 7/5 28/8 7/12 0.09 0.13 0.05 (0.01,0.15) 0.06 (0.01,0.08) 0.38 0.73 0.16 (0.04,0.61) 0.19 (0.08,0.30)1998 8/6 25/8 10/20 0.40 0.22 0.36 (0.22,0.59) 0.33 (0.24,0.47) 3.47 11.41 0.88 (0.26,2.93) 0.68 (0.54,1.02)1999 17/5 8/9 10/15 0.95 1.04 0.58 (0.20,1.68) 0.54 (0.38,0.94) 3.87 10.38 0.73 (0.16,3.24) 0.56 (0.32,0.83)2000 1/6 29/8 11/17 0.61 0.84 0.35 (0.13,0.98) 0.27 (0.18,0.62) 0.67 0.54 0.50 (0.22,1.11) 0.54 (0.29,0.83)2001 1/5 14/9 38/42 4.08 18.98 0.93 (0.33,2.60) 0.74 (0.53,1.22) 1.10 2.39 0.56 (0.22,1.45) 0.52 (0.32,0.82)2002 1/5 17/9 8/30 1.82 2.09 0.88 (0.22,3.50) 0.78 (0.34,2.82) 1.06 1.85 0.55 (0.16,1.83) 0.50 (0.32,1.08)
<strong>Temporal</strong> <strong>Trends</strong> <strong>in</strong> <strong>Lake</strong> <strong>Erie</strong> <strong>Plankton</strong> <strong>Biomass</strong> 95(B) Spr<strong>in</strong>g Total Crustacean Zooplankton <strong>Biomass</strong> Summer Total Crustacean Zooplankton <strong>Biomass</strong>#Start End Samples Quartiles QuartilesBas<strong>in</strong> Year Date Date Sp./Su. Mean A s A Mean G s G Median (1st,3rd) Mean A s A Mean G s G Median (1st,3rd)Western 1996 22/5 25/9 136/332 0.149 0.156 0.084 (0.024,0.297) 0.094 (0.053,0.185) 0.090 0.131 0.035 (0.008,0.155) 0.036 (0.012,0.112)1997 9/5 24/9 61/74 0.060 0.079 0.026 (0.006,0.110) 0.025 (0.011,0.073) 0.161 0.219 0.064 (0.014,0.282) 0.056 (0.023,0.234)1998 10/6 29/9 42/102 0.110 0.092 0.070 (0.023,0.216) 0.083 (0.041,0.143) 0.098 0.095 0.058 (0.019,0.183) 0.067 (0.027,0.124)1999 17/5 28/9 25/52 0.117 0.022 0.053 (0.012,0.226) 0.060 (0.044,0.100) 0.081 0.079 0.043 (0.012,0.157) 0.052 (0.014,0.121)2000 2/5 18/9 42/46 0.100 0.103 0.040 (0.007,0.223) 0.074 (0.127,0.170) 0.171 0.189 0.092 (0.028,0.303) 0.078 (0.038,0.281)2001 14/5 17/9 30/39 0.175 0.131 0.120 (0.044,0.328) 0.162 (0.063,0.229) 0.106 0.090 0.071 (0.027,0.190) 0.085 (0.045,0.131)2002 7/5 30/9 40/55 0.069 0.082 0.025 (0.005,0.131) 0.025 (0.007,0.110) 0.174 0.157 0.109 (0.036,0.332) 0.117 (0.050,0.249)Central 1996 12/6 20/9 33/54 0.127 0.127 0.087 (0.036,0.210) 0.084 (0.047,0.153) 0.039 0.053 0.022 (0.008,0.061) 0.021 (0.011,0.042)1997 7/5 29/8 26/32 0.040 0.041 0.017 (0.003,0.087) 0.025 (0.007,0.065) 0.112 0.129 0.058 (0.017,0.194) 0.048 (0.026,0.159)1998 9/6 4/9 27/51 0.111 0.077 0.085 (0.039,0.187) 0.083 (0.055,0.180) 0.050 0.049 0.030 (0.010,0.093) 0.036 (0.013,0.066)1999 18/5 9/9 23/30 0.080 0.081 0.037 (0.008,0.182) 0.056 (0.016,0.122) 0.059 0.043 0.046 (0.021,0.098) 0.050 (0.030,0.074)2000 9/5 8/9 46/41 0.238 0.162 0.165 (0.056,0.485) 0.217 (0.112,0.334) 0.091 0.084 0.051 (0.012,0.208) 0.070 (0.026,0.131)2001 23/5 2/8 20/8 0.141 0.071 0.120 (0.064,0.227) 0.143 (0.093,0.174) 0.079 0.086 0.052 (0.020,0.134) 0.036 (0.030,0.096)2002 25/6 26/9 22/113 0.114 0.066 0.094 (0.046,0.187) 0.112 (0.052,0.159) 0.095 0.096 0.058 (0.019,0.180) 0.079 (0.029,0.123)Eastern 1996 24/6 18/9 6/8 0.055 0.012 0.054 (0.043,0.067) 0.055 (0.048,0.062) 0.020 0.009 0.018 (0.012,0.028) 0.020 (0.016,0.021)1997 2/6 28/8 8/12 0.035 0.057 0.010 (0.002,0.053) 0.006 (0.003,0.032) 0.041 0.046 0.027 (0.011,0.066) 0.025 (0.015,0.035)1998 8/6 25/8 10/11 0.026 0.028 0.011 (0.002,0.055) 0.014 (0.003,0.044) 0.042 0.028 0.036 (0.021,0.063) 0.032 (0.029,0.041)1999 17/5 8/9 7/17 0.031 0.070 0.003 (0.0003,0.030) 0.001 (0.001,0.012) 0.030 0.023 0.019 (0.006,0.063) 0.026 (0.016,0.049)2000 1/6 29/8 9/17 0.049 0.056 0.018 (0.003,0.124) 0.043 (0.007,0.073) 0.053 0.035 0.043 (0.021,0.087) 0.046 (0.030,0.070)2001 1/5 14/9 41/21 0.023 0.042 0.006 (0.001,0.039) 0.007 (0.002,0.025) 0.029 0.020 0.023 (0.012,0.047) 0.021 (0.015,0.046)2002 1/5 17/9 30/55 0.029 0.035 0.012 (0.003,0.056) 0.013 (0.004,0.047) 0.062 0.046 0.046 (0.018,0.115) 0.045 (0.034,0.084)
96 Conroy et al.Laboratory MethodsPhytoplankton whole water samples were condensedby settl<strong>in</strong>g <strong>in</strong> 250-mL graduated cyl<strong>in</strong>ders <strong>in</strong>a dark chamber for at least 3 d. Condensed sampleswere collected by draw<strong>in</strong>g <strong>of</strong>f the upper 220 mLand pour<strong>in</strong>g the rema<strong>in</strong><strong>in</strong>g 30 mL <strong>in</strong>to a labeledsample vial. Enumeration <strong>of</strong> phytoplankton samplesgenerally followed the Utermöhl (1958) technique.Subsamples <strong>of</strong> approximately 3–5 mL were obta<strong>in</strong>edfrom the concentrated samples and placed<strong>in</strong>to a count<strong>in</strong>g chamber. All phytoplankton generawere identified and counted us<strong>in</strong>g a Wild <strong>in</strong>vertedmicroscope at 400×. Sequential transects <strong>of</strong> thechamber were viewed until 100 algal units (cells,filaments, or colonies) <strong>of</strong> the most common taxonwere encountered and recorded. In each sample,however, all algal units <strong>in</strong> at least two transectswere counted even if 100 algal units <strong>of</strong> the mostcommon taxa were enumerated before two transectswere completed. Dimensions for the first 20 algalunits <strong>of</strong> each enumerated taxon were measured. Forfilamentous algal taxa, all filament lengths weremeasured, summed, and recorded as the total filamentlength for each taxon. Average dimensionswere then used <strong>in</strong> geometric equations that best describedthe shape <strong>of</strong> each species accord<strong>in</strong>g to Frostand Culver (2001; equations listed <strong>in</strong> Kane 2004)from which we computed average cell volume foreach species <strong>in</strong> a particular sample. For colonies,the mean number <strong>of</strong> cells per colony was calculatedand multiplied by the average volume per cell todeterm<strong>in</strong>e volume per colony. Subsequently, volumeswere converted to wet biomass (mg L –1 ) assum<strong>in</strong>gthe specific gravity <strong>of</strong> phytoplankton to be1.0 (Munawar and Munawar 1976, Makarewicz1993a). Total phytoplankton biomass (mg L –1 ) wasf<strong>in</strong>ally determ<strong>in</strong>ed for all samples by summ<strong>in</strong>gtaxon-specific total biomass over all taxa present <strong>in</strong>a sample.Chlorophyll a concentration (µg L –1 ) was determ<strong>in</strong>edus<strong>in</strong>g aqueous acetone extraction accord<strong>in</strong>gto USEPA Method 446.0 (USEPA 1997). Thismulti-laboratory validated, standard method correctedfor the presence <strong>of</strong> phaeophyt<strong>in</strong> by measur<strong>in</strong>gchlorophyll and phaeophyt<strong>in</strong> absorbance beforeand after sample acidification (Lorenzen 1967). Notall total phytoplankton biomass samples had correspond<strong>in</strong>gchlorophyll a concentration samples.For zooplankton enumeration, each sample wasfirst diluted to a known volume (typically500–3,000 mL) unless the sample conta<strong>in</strong>ed few ormany zooplankters, requir<strong>in</strong>g smaller or larger dilutionvolumes. All zooplankton taxa (rotifers, cladocerans,cyclopoid and calanoid copepods, and dreissenidveliger larvae) <strong>in</strong> at least two subsamples <strong>of</strong>5–10 mL were enumerated with a Wild dissect<strong>in</strong>gmicroscope at 50×. Cladocerans and copepods wereidentified to species and sex while rotifers anddreissenid veligers were identified to genus. Additionalsubsamples were analyzed until at least 100<strong>in</strong>dividuals <strong>of</strong> the most common taxa (exclud<strong>in</strong>gcopepod nauplii, rotifers, and veligers) wererecorded. The lengths <strong>of</strong> the first 20 <strong>in</strong>dividuals <strong>in</strong>each taxon (except rotifers and veligers) were alsomeasured to the nearest 0.05 mm with an ocular micrometer.Crustacean zooplankton biomass (i.e., exclud<strong>in</strong>grotifers and dreissenid veligers) was calculated bydeterm<strong>in</strong><strong>in</strong>g the average <strong>in</strong>dividual biomass foreach taxon counted, multiply<strong>in</strong>g by the number <strong>of</strong><strong>in</strong>dividuals m –3 , and summ<strong>in</strong>g over all taxa. We excludedrotifers from our analysis s<strong>in</strong>ce many <strong>of</strong>these zooplankton were not adequately sampledby our sampl<strong>in</strong>g gear due to large net mesh size(64 µm). We excluded dreissenid veligers becausewe wanted to compare only changes <strong>in</strong> the crustaceanzooplankton community. Average <strong>in</strong>dividualbiomass was determ<strong>in</strong>ed us<strong>in</strong>g length-weight regressions(Culver et al. 1985) and the lengths measureddur<strong>in</strong>g sample enumeration. Taxon-specificregression equations converted length (mm) to drybiomass (µg) for each crustacean zooplankton taxon(<strong>in</strong>clud<strong>in</strong>g eggs). Species-specific total biomasseswere summed over all taxa giv<strong>in</strong>g the total crustaceanzooplankton biomass (mg L –1 ) at a givensampl<strong>in</strong>g site, for a given date.For all recent plankton biomass measures exceptcyanobacteria biomass, we have calculated threemeasures <strong>of</strong> central tendency and data spread.These <strong>in</strong>clude the arithmetic and geometric meansand standard deviations, and the median and thefirst (25%) and third (75%) quartiles. We did notcalculate geometric means and standard deviationsfor cyanobacteria due to the frequent absence <strong>of</strong>cyanobacteria <strong>in</strong> our samples. We do not presentmedians and quartiles for cyanobacteria aga<strong>in</strong> because<strong>of</strong> the high number <strong>of</strong> zeros <strong>in</strong> the data set,especially <strong>in</strong> spr<strong>in</strong>g samples, which <strong>of</strong>ten made themedian and first quartile less than 0.001 mg L –1 .We felt that both <strong>of</strong> these latter measures forcyanobacteria were un<strong>in</strong>formative, but they areavailable on request. Calculation <strong>of</strong> these threemeasures was important for two reasons. First, <strong>in</strong>order to compare recent data to published data <strong>in</strong> anunbiased manner, we needed to calculate arithmetic
<strong>Temporal</strong> <strong>Trends</strong> <strong>in</strong> <strong>Lake</strong> <strong>Erie</strong> <strong>Plankton</strong> <strong>Biomass</strong> 97means and standard deviations because the historicaldata were summarized this way (Glooschenko etal. 1974, Watson and Carpenter 1974, Munawar andMunawar 1976, Watson 1976, Bean 1980, DeVaultand Rockwell 1986, Makarewicz 1993a,Makarewicz 1993b, Makarewicz et al. 1999, Weisgerber2000). Second, even though we had a largenumber <strong>of</strong> samples for most seasons and bas<strong>in</strong>s(Table 2), our data still were subject to the <strong>in</strong>fluence<strong>of</strong> a few outliers with extremely high biomassvalues. Because the geometric mean, median, andquartiles are more resistant to bias caused by thepresence <strong>of</strong> outliers (Zar 1999), we used these measuresto control for their <strong>in</strong>fluence.Historical DatasetsEstimates <strong>of</strong> <strong>Lake</strong> <strong>Erie</strong> phytoplankton biomass bybas<strong>in</strong> were available <strong>in</strong> the literature from 1970(Munawar and Munawar 1976), 1978 (DeVault andRockwell 1986), and 1983–93 (Makarewicz 1993a,Makarewicz et al. 1999). Sampl<strong>in</strong>g, enumeration,and total biomass calculation methods were broadlysimilar to those used <strong>in</strong> LEPAS. The most consequentialdifference between the published and newdatasets is the sampl<strong>in</strong>g period (Table 3A), whichmay <strong>in</strong>fluence the <strong>in</strong>terpretation and comparability<strong>of</strong> the computed central tendency measures amongsamples. Samples from 1970 were collectedmonthly from 25 stations distributed throughout<strong>Lake</strong> <strong>Erie</strong>’s three bas<strong>in</strong>s (Fig. 1 <strong>in</strong> Munawar andMunawar 1976) from April to December. For comparisonwith recent data, average total phytoplanktonbiomass for May through September was readfrom an optically scanned and digitized version <strong>of</strong>Munawar and Munawar’s (1976) Figure 8. Samplesfrom 1978 were collected on n<strong>in</strong>e cruises from Mayto November <strong>in</strong> the three bas<strong>in</strong>s <strong>of</strong> <strong>Lake</strong> <strong>Erie</strong> at 80stations (Fig. 1 <strong>in</strong> DeVault and Rockwell 1986).Total phytoplankton biomass data were read fromscanned versions <strong>of</strong> their Figures 3, 6, and 10. Phytoplanktondata were also available from samplescollected dur<strong>in</strong>g 1979 (DeVault and Rockwell1986), but were not used <strong>in</strong> the present analysis dueto less frequent, spatially limited sampl<strong>in</strong>g. Samplesfrom 1983–93 were collected from stations distributedthroughout the lake (Fig. 1 <strong>in</strong> Makarewicz1993a and Makarewicz et al. 1999). Annual,lakewide averages <strong>of</strong> April and August phytoplanktondata for 1983–87 were available from Table 7<strong>of</strong> Makarewicz (1993a), whereas bas<strong>in</strong>-specificgrand means were available for spr<strong>in</strong>g and summerfrom Tables 2, 3, and 4 from Makarewicz et al.(1999). <strong>Plankton</strong> biomasses <strong>in</strong> their 1999 paperwere broken <strong>in</strong>to two periods: before the dreissenid<strong>in</strong>vasion (1983–88 for the western and centralbas<strong>in</strong>s and 1983–89 for the eastern bas<strong>in</strong>) and post<strong>in</strong>vasion(1989–93 <strong>in</strong> the western and central bas<strong>in</strong>sand 1990–93 <strong>in</strong> the eastern bas<strong>in</strong>).We obta<strong>in</strong>ed chlorophyll a concentration data for1970 from Glooschenko et al. (1974) from the samestations as those from which samples were analyzedfor algal taxonomic composition by Munawar andMunawar (1976). Cruise means reported <strong>in</strong> Table 1<strong>of</strong> Glooschenko et al. (1974) were compiled <strong>in</strong>tospr<strong>in</strong>g (May and June) and summer (July–August)estimates by arithmetic averag<strong>in</strong>g to enable parallelcomparisons with our 1996–2002 chlorophyll concentrationmeasurements. Spr<strong>in</strong>g and summerchlorophyll concentrations from 1983–93 weretaken directly from Makarewicz et al.’s (1999) Tables2, 3, and 4.Cyanobacteria biomass was available from 1970(Munawar and Munawar 1976) and 1983–93(Makarewicz et al. 1999). Cyanobacteria averagebiomass from 1970 was computed by multiply<strong>in</strong>gthe average total phytoplankton biomass determ<strong>in</strong>edabove by the seasonal percent compositionvalues <strong>in</strong> Table 7 <strong>of</strong> Munawar and Munawar (1976).<strong>Biomass</strong> estimates from the 1983–93 period weretaken directly from Tables 2, 3, and 4 fromMakarewicz et al. (1999).Zooplankton total crustacean average biomassmeasurements were available <strong>in</strong> the literature from1970 (abundance data from Watson 1976, Watsonand Carpenter 1974; biomass calculations by Bean1980), 1974–75 (abundance data from Center for<strong>Lake</strong> <strong>Erie</strong> Area Research; biomass calculations byWeisgerber 2000), and 1984–87 (Makarewicz1993b). Field sampl<strong>in</strong>g, enumeration, and biomasscalculations <strong>in</strong> all historical studies were similar toLEPAS (Table 3B). Abundance estimates (<strong>in</strong>dividualsm –3 ) were determ<strong>in</strong>ed us<strong>in</strong>g net efficiency, towdepth, and net diameter. These estimates were moreaccurate <strong>in</strong> later studies (1984–87 and LEPAS) becauseflow meters were used on the mouths <strong>of</strong> thenets. Sampl<strong>in</strong>g stations and dates for 1970 (Watson1976) and 1984–87 (Makarewicz 1993b) were identicalto those given for phytoplankton (see above).Samples from 1974–75 were collected only <strong>in</strong> thewestern bas<strong>in</strong> at 19 stations from April to December(Fig. 2 <strong>in</strong> Weisgerber 2000). Spr<strong>in</strong>g and summerbas<strong>in</strong>-specific average biomass estimates forthe 1970 samples were calculated from Bean’s(1980) Table 16 while those for 1974–75 were calculatedus<strong>in</strong>g the data that contributed to Weisger-
98 Conroy et al.TABLE 3. Summary <strong>of</strong> major differences <strong>in</strong> phytoplankton (A) and zooplankton (B) sampl<strong>in</strong>g period, field sampl<strong>in</strong>g, and laboratorymethods between literature-derived and recent datasets. The sampl<strong>in</strong>g period perta<strong>in</strong>s to the data actually used for comparisons withrecent data from LEPAS; the actual sampl<strong>in</strong>g period may have been longer.(A) PhytoplanktonSampl<strong>in</strong>g Period Station Sampl<strong>in</strong>g DepthPeriod Spr<strong>in</strong>g Summer Unstratified Stratified Magnification Enumeration Data Source1970 May–Jun., ~1 Jul.–Sept., ~1 1, 5 m 1, 5 m 300×, orgs. > 64 µm 300 units <strong>in</strong> settl<strong>in</strong>g chamber; Munawar & Munawarcruise mo. –1 cruise mo. –1 600×, orgs. < 64 µm diatoms on cleared slides (1976) Fig. 81978 May–Jun., ~1 Jul.–Sept., ~1 1 m, mid-depth, 1 m, 1 m ↑ metalimn., 250×, orgs. > 10 µm 2 perp. 13.6 mm long strips DeVault & Rockwellcruise mo. –1 cruise mo. –1 1 m above bottom thermocl<strong>in</strong>e, 1 m ↓ 500×, orgs. < 10 µm (1986) Figs. 3, 6, 10thermocl., 1 m ↑ bottom1983– Apr. (1 May Aug. 1 m, mid-depth, 1, 5, 10, 20 m 500×; diatoms @ Settl<strong>in</strong>g chamber; diatoms on Makarewicz et al.1993 1983–84 cruise) 1 m above bottom 1250× separate cleared slides (1999), Tables 2, 3, 41996– May–Jun. Jul.–Sep. 2× Secchi disk 2× Secchi disk 400× At least 100 units <strong>in</strong> a LEPAS2002 transparency transparency settl<strong>in</strong>g chamber(B) ZooplanktonSampl<strong>in</strong>g PeriodPeriod Spr<strong>in</strong>g Summer Sampl<strong>in</strong>g Depth Net Characteristics Enumeration Data Source1970 May–Jun., ~1 Jul.–Sep., ~ 1 Surf. to 50 m or to 40 cm dia., 64 µm, unmetered At least 200 <strong>in</strong>dividuals from 1 mL Watson (1976),cruise mo. –1 cruise mo. –1 1 m ↑ bottom subsamples <strong>of</strong> the undiluted sample Bean (1980)1974 May–Jun., ~1 Jul.–Sep., ~ 1 Surf. to 1 m ↑ 50 cm dia., 64 µm, metered (read<strong>in</strong>gs At least 200 <strong>in</strong>dividuals <strong>of</strong> Center for <strong>Lake</strong> <strong>Erie</strong>cruise mo. –1 cruise mo. –1 bottom were unavailable; assumed 70% eff.) one taxon from subsamples Area Research,<strong>of</strong> the diluted sample Weisgerber (2000)1983–87 Apr. (1 May Aug. Surf. to 20 m or to 50 cm dia., 62 µm, metered Followed Gannon (1971) Makarewicz1983–84 cruise) 1 m ↑ bottom (1993b) Table 21996– May–Jun Jul.–Sep. Surf. to 1 m ↑ 50 cm dia., 64 µm, metered At least 100 adults <strong>of</strong> one taxon from LEPAS2002 bottom subsamples <strong>of</strong> the diluted sample
<strong>Temporal</strong> <strong>Trends</strong> <strong>in</strong> <strong>Lake</strong> <strong>Erie</strong> <strong>Plankton</strong> <strong>Biomass</strong> 99ber’s (2000) Table 1. For 1984–87, only annual,lakewide averages could be calculated fromMakarewicz’s (1993b) Table 2 (by subtract<strong>in</strong>g the“Rotifera” biomass column from the “Mean Abundance”biomass column).Phytoplankton <strong>Biomass</strong> Relationships withPhosphorus LoadTo test whether phytoplankton biomass was correlatedwith external phosphorus load<strong>in</strong>g, we performedl<strong>in</strong>ear regressions (M<strong>in</strong>itab 2000) with ourrecent phytoplankton data (1996–2002) and externalphosphorus load<strong>in</strong>g. We were unable to expandthese relationships to previous periods due to theunavailability <strong>of</strong> data from some periods (just grandmeans were reported for 1989/90–93) or due to thelarge plankton biomass values <strong>in</strong> other years (e.g.,1970), which would have added undue <strong>in</strong>fluence tothe tested relationship. We performed analyses <strong>of</strong>both spr<strong>in</strong>g and summer arithmetic mean total phytoplanktonbiomass and arithmetic mean cyanobacteriabiomass versus both total external load to<strong>Lake</strong> <strong>Erie</strong> and load by bas<strong>in</strong> (Dolan and McGunagle2005). Significance was judged aga<strong>in</strong>st an α-level<strong>of</strong> 0.05 for all analyses.We also tested whether external annual phosphorusload significantly varied dur<strong>in</strong>g the four periodsfor which we have plankton data (1970–78,1983–87, 1988–93, and 1996–2002). These four periodswere chosen because they differ <strong>in</strong> both externalphosphorus load<strong>in</strong>g (high load<strong>in</strong>g [typically >16 kilotonnes y –1 ] <strong>in</strong> 1970–78; low load<strong>in</strong>g [typicallynear the target load <strong>of</strong> 11 kilotonnes y –1 ] <strong>in</strong>1983–87, 1988–93, and 1996–2001) and <strong>in</strong>vasionstage <strong>of</strong> dreissenid mussels (no dreissenids <strong>in</strong>1970–78 and 1983–87, early dreissenid <strong>in</strong>vasionstage <strong>in</strong> 1988–93, and later dreissenid <strong>in</strong>vasionstage <strong>in</strong> 1996–2001). Analysis <strong>of</strong> Variance (M<strong>in</strong>itab2000) was used to determ<strong>in</strong>e whether these four periodsdiffered <strong>in</strong> external phosphorus load<strong>in</strong>g to<strong>Lake</strong> <strong>Erie</strong>. Significance was judged at an α-level <strong>of</strong>0.05 and Tukey’s HSD method for multiple comparisonswas used with a family error rate <strong>of</strong> 0.05.Test<strong>in</strong>g Effects <strong>of</strong> External Load<strong>in</strong>g andDreissenids on <strong>Lake</strong> <strong>Erie</strong> <strong>Plankton</strong>Test<strong>in</strong>g the predictions <strong>of</strong> external load<strong>in</strong>g anddreissenid effects on <strong>Lake</strong> <strong>Erie</strong> phytoplankton requiresadequate sampl<strong>in</strong>g data from before and afterexternal phosphorus load<strong>in</strong>g controls and the dreissenid<strong>in</strong>vasion. While post-load<strong>in</strong>g and post-<strong>in</strong>vasiondata were abundant (Makarewicz et al. 1999,Conroy et al. 2005b), pre-load<strong>in</strong>g and pre-<strong>in</strong>vasiondata were less obta<strong>in</strong>able. Furthermore, most reports<strong>of</strong> both pre- and post-data only conta<strong>in</strong> summarystatistics, not the raw data, or when the rawdata are available, they are <strong>in</strong> a form that is difficultto use (i.e., micr<strong>of</strong>iche or pr<strong>in</strong>touts). To test thedreissenid effects predictions, therefore, we comparedour recent LEPAS phytoplankton data withpublished data through comparisons <strong>of</strong> bas<strong>in</strong>- andseason-specific grand means. We subjectively comparedgrand means from four periods based uponthe level <strong>of</strong> phosphorus load<strong>in</strong>g and the state <strong>of</strong> thedreissenid <strong>in</strong>vasion: (1) 1970–1978, high phosphorusload<strong>in</strong>g, no dreissenid mussels; (2)1983–1988/9, low phosphorus load<strong>in</strong>g, no dreissenidmussels; (3) 1989/90–93, low phosphorusload<strong>in</strong>g, early mussel <strong>in</strong>vasion; and, (4) 1996–2002,low phosphorus load<strong>in</strong>g, later <strong>in</strong> the mussel <strong>in</strong>vasion.S<strong>in</strong>ce we did not have the orig<strong>in</strong>al raw data,we were unable to compare data from the four timeperiods statistically. While we could have statisticallycompared annual means, this was unfeasibledue to the low power associated with few annualmeans <strong>in</strong> some periods (e.g., only two annualmeans <strong>in</strong> the 1970–78 period) or due to not hav<strong>in</strong>gsome annual means (i.e., only grand means were reportedfor the 1989/90–93 period <strong>in</strong> Makarewicz etal. 1999).RESULTS AND DISCUSSIONIs <strong>Lake</strong> <strong>Erie</strong> <strong>Plankton</strong> <strong>Biomass</strong> at aRecent M<strong>in</strong>imum?Determ<strong>in</strong><strong>in</strong>g the absolute direction and magnitude<strong>of</strong> change <strong>of</strong> <strong>Lake</strong> <strong>Erie</strong> plankton communities<strong>in</strong> reference to historical data was difficult <strong>in</strong> thisstudy due to the unavailability <strong>of</strong> the orig<strong>in</strong>al historicaldata. All trends (or lack there<strong>of</strong>) <strong>in</strong> the datadiscussed below were determ<strong>in</strong>ed by comparison <strong>of</strong>recent measures <strong>of</strong> central tendency (Table 2) withthose from previous time periods (Tables 4–7). Weargue that if the trends consistently po<strong>in</strong>t to differences<strong>in</strong> the same direction (or are lack<strong>in</strong>g), that thedifferences (or lack there<strong>of</strong>) are likely biologicallyimportant. This method has been used throughoutthe <strong>Lake</strong> <strong>Erie</strong> plankton literature when more precise<strong>in</strong>formation is unavailable (DeVault and Rockwell1986; Makarewicz 1993a, 1993b).Both spr<strong>in</strong>g and summer phytoplankton total wetbiomass grand means (mg L –1 ) were at their greatestlevel dur<strong>in</strong>g the 1970–78 period. M<strong>in</strong>ima wereobserved <strong>in</strong> the late 1980s or 1990s (Table 4). West-
100 Conroy et al.TABLE 4. <strong>Lake</strong> <strong>Erie</strong> total phytoplankton wet biomass (mg L –1 ) period grand means for spr<strong>in</strong>g (A) andsummer (B). Data from 1970–78 are from Munawar and Munawar (1976) and DeVault and Rockwell(1986); data from 1983–93 are from Makarewicz et al. (1999); and, recent data are from LEPAS.(A)Period: 1970–78 1983–88/9 1989/90–93 1996–2002Spr<strong>in</strong>gQuartiles GrandBas<strong>in</strong> Mean Grand Mean Grand Mean Grand Mean A,Grand s A,Grand Mean G,Grand s G,Grand Median Grand (1st, 3rd)Western 2.6 1.97 1.27 1.29 2.04 0.73 (0.24,2.27) 0.79 (0.39,1.63)Central 2.1 1.37 1.79 1.11 4.09 0.53 (0.17,1.68) 0.55 (0.30,0.94)Eastern 2.3 0.80 0.60 2.57 14.1 0.47 (0.11,1.99) 0.46 (0.20,1.01)(B)Period: 1970–78 1983–88/9 1989/90–93 1996–2002SummerQuartiles GrandBas<strong>in</strong> Mean Grand Mean Grand Mean Grand Mean A,Grand s A,Grand Mean G,Grand s G,Grand Median Grand (1st, 3rd)Western 5.9 2.51 1.79 2.20 4.78 0.68 (0.11,3.97) 0.89 (0.27,2.28)Central 3.1 0.86 0.85 1.01 1.21 0.61 (0.20,1.86) 0.70 (0.35,1.22)Eastern 1.9 0.63 0.52 1.56 5.60 0.53 (0.16,1.73) 0.50 (0.25,0.90)TABLE 5. <strong>Lake</strong> <strong>Erie</strong> chlorophyll a concentration (µg L –1 ) period grand means for spr<strong>in</strong>g (A) and summer(B). Data from 1970 are from Glooschenko et al. (1974); data from 1983–93 are from Makarewicz etal. (1999); and, recent data are from LEPAS.(A)Period: 1970 1983–88/9 1989/90–93 1996–2002Spr<strong>in</strong>gQuartiles GrandBas<strong>in</strong> Mean Grand Mean Grand Mean Grand Mean A,Grand s A,Grand Mean G,Grand s G,Grand Median Grand (1st, 3rd)Western 5.15 7.46 3.06 3.53 3.39 2.34 (0.87,6.32) 2.55 (1.30,4.62)Central 2.80 3.33 4.20 1.96 1.93 1.22 (0.40,3.68) 1.40 (0.76,2.25)Eastern 4.45 1.32 1.28 0.77 0.62 0.56 (0.24,1.32) 0.63 (0.40,0.85)(B)Period: 1970 1983–88/9 1989/90–93 1996–2002SummerQuartiles GrandBas<strong>in</strong> Mean Grand Mean Grand Mean Grand Mean A,Grand s A,Grand Mean G,Grand s G,Grand Median Grand (1st, 3rd)Western 12.80 10.20 9.20 6.55 4.62 4.85 (2.01,11.67) 5.39 (2.79,9.17)Central 4.88 3.50 2.70 2.04 1.52 1.56 (0.68,3.59) 1.53 (1.12,2.60)Eastern 3.33 2.37 2.00 1.43 0.66 1.28 (0.79,2.09) 1.47 (0.84,1.87)ern bas<strong>in</strong> spr<strong>in</strong>g phytoplankton biomass was greatest<strong>in</strong> the 1970–78 period (Table 4), but annual values<strong>in</strong> 2001 and 2002 approached or exceeded thisperiod mean. M<strong>in</strong>imum western bas<strong>in</strong> spr<strong>in</strong>g meanphytoplankton biomass values were found <strong>in</strong> 1996and 1997 (Table 2A). Central bas<strong>in</strong> spr<strong>in</strong>g phytoplanktonbiomass was lowest <strong>in</strong> 1997 (Table 2A).The lowest period mean values were also found <strong>in</strong>the recent (1996–2002) period (Table 4). Easternbas<strong>in</strong> spr<strong>in</strong>g mean phytoplankton biomass wasgreatest <strong>in</strong> the recent period (Table 4). Samplesfrom the most recent sample years (2001 and 2002)were important to this trend. Aga<strong>in</strong>, 1997 had thelowest biomass <strong>of</strong> any annual mean (Table 2A).Western bas<strong>in</strong> summer phytoplankton biomasswas greatest <strong>in</strong> the 1970–78 period. The m<strong>in</strong>imumoccurred <strong>in</strong> the 1989–93 period (Table 4). The meanbiomass <strong>in</strong> 1996 was the lowest (Table 2A) <strong>of</strong> any
<strong>Temporal</strong> <strong>Trends</strong> <strong>in</strong> <strong>Lake</strong> <strong>Erie</strong> <strong>Plankton</strong> <strong>Biomass</strong> 101TABLE 6. <strong>Lake</strong> <strong>Erie</strong> cyanobacteria wet biomass (mg L –1 ) period grand means for spr<strong>in</strong>g (A) and summer(B). Data from 1970 are calculated from Munawar and Munawar (1976); data from 1983–93 arefrom Makarewicz et al. (1999); and, recent data are from LEPAS.(A)Period: 1970 1983–88/9 1989/90–93 1996–2002Spr<strong>in</strong>gBas<strong>in</strong> Mean Grand Mean Grand Mean Grand Mean A,Grand s A,GrandWestern 0.010 0.001 0.05 0.06 0.70Central 0.068 0.010 0.03 0.01 0.03Eastern 0.177 0.005 0.02 0.01 0.04(B)Period: 1970 1983–88/9 1989/90–93 1996–2002SummerBas<strong>in</strong> Mean Grand Mean Grand Mean Grand Mean A,Grand s A,GrandWestern 1.17 0.51 0.17 0.94 4.34Central 0.22 0.07 0.05 0.30 1.02Eastern 0.29 0.03 0.05 0.86 5.40TABLE 7. <strong>Lake</strong> <strong>Erie</strong> total crustacean dry biomass (mg L –1 ) period grand means for spr<strong>in</strong>g (A) and summer(B). Data from 1970–75 are from Watson and Carpenter (1974), Watson (1976), Bean (1980), andWeisgerber (2000); data from 1984–87 are from Makarewicz (1993b); and, recent data are from LEPAS.(A)Period: 1970–75or 1970 1984–87 1996–2002Spr<strong>in</strong>gQuartiles GrandBas<strong>in</strong> Mean Grand Mean Grand Mean A,Grand s A,Grand Mean G,Grand s G,Grand Median Grand (1st, 3rd)Western 0.322 0.0808 0.108 0.127 0.050 (0.011,0.218) 0.065 (0.019,0.147)Central 0.296 0.0742 0.134 0.125 0.076 (0.020,0.286) 0.096 (0.052,0.159)Eastern 0.106 0.0614 0.030 0.043 0.009 (0.002,0.056) 0.011 (0.002,0.046)(B)Period: 1970–75or 1970 1984–87 1996–2002SummerQuartiles GrandBas<strong>in</strong> Mean Grand Mean Grand Mean A,Grand s A,Grand Mean G,Grand s G,Grand Median Grand (1st, 3rd)Western 0.332 0.0808 0.111 0.144 0.050 (0.012,0.201) 0.056 (0.019,0.149)Central 0.268 0.0742 0.076 0.086 0.043 (0.013,0.139) 0.047 (0.019,0.106)Eastern 0.274 0.0614 0.047 0.039 0.033 (0.013,0.082) 0.035 (0.020,0.065)s<strong>in</strong>gle year. Annual means from 1998–2002 wereapproximately 50% <strong>of</strong> the 1970–78 mean biomass.However, these values were consistently higherthan the 1996–97 values (Tables 2A, 4). All meanbiomasses <strong>in</strong> the recent period except those <strong>in</strong>1996–97 were higher than those reported <strong>in</strong> the1989–93 period (Tables 2A, 4). Additionally, meanbiomasses <strong>in</strong> four <strong>of</strong> the seven recent years(1998–99, 2001–02) were equal to or greater thanthe grand mean for the 1983–89 period. Centralbas<strong>in</strong> summer phytoplankton biomass was greatest<strong>in</strong> the 1970–78 period, was lower <strong>in</strong> 1983–93, and<strong>in</strong>creased <strong>in</strong> the recent period (Table 4). For recentannual mean biomasses, only annual values for1996 and 1997 were lower than the grand means forthe period 1983–93 (Tables 2A, 4). None <strong>of</strong> the re-
102 Conroy et al.cent annual means were greater than 43% <strong>of</strong> themean biomass for the 1970–78 period (Tables 2A,4). In the eastern bas<strong>in</strong>, the greatest grand meanbiomass was recorded <strong>in</strong> the 1996–2002 period, althoughthis value was affected primarily by two extremeyears (1998 and 1999; Table 2A). Exclusive<strong>of</strong> these 2 years, 2 years’ biomasses were lower(1996 and 1997) and one was slightly above (2000).Estimates for the 2 most recent sampl<strong>in</strong>g years(2001 and 2002) were higher than those from1983–93 (Tables 2A, 4).These comparisons show that <strong>Lake</strong> <strong>Erie</strong> phytoplanktonbiomass is not at a recent m<strong>in</strong>imum. Ofthe compiled data, the lowest mean biomasses generallyoccurred <strong>in</strong> 1996 and 1997, whereas the years1998–2002 generally had the highest mean biomasses<strong>of</strong> the three major periods s<strong>in</strong>ce the1970–78 period. These data, measured from directalgal counts and size-frequency measurements, donot support the suggestion by other scientists that<strong>Lake</strong> <strong>Erie</strong> phytoplankton biomass was at a m<strong>in</strong>imum<strong>in</strong> the late 1990s and early 2000s (Carrick etal. 2005, Ghadouani and Smith 2005), probably becausethey estimated biomass by measurement <strong>of</strong>chlorophyll a.Data from our measurements, however, do <strong>in</strong>dicatethat chlorophyll a concentration was at a m<strong>in</strong>imum<strong>in</strong> the last few years (Table 5). All bas<strong>in</strong> grandmeans from 1996–2002 were less than those from1970 and the mid-1980s and all except spr<strong>in</strong>g westernbas<strong>in</strong> chlorophyll a concentration were less thanthose from the early 1990s (Table 5). Summergrand means from 1996–2002 were greater thanthose from the spr<strong>in</strong>g, follow<strong>in</strong>g the general trendreported <strong>in</strong> previous periods (Table 5).The greatest values <strong>of</strong> cyanobacteria biomass <strong>in</strong>all bas<strong>in</strong>s were reported <strong>in</strong> 1970. However,cyanobacteria biomass has <strong>in</strong>creased <strong>in</strong> the westernand eastern bas<strong>in</strong>s dur<strong>in</strong>g spr<strong>in</strong>g and <strong>in</strong> all bas<strong>in</strong>sdur<strong>in</strong>g the summer s<strong>in</strong>ce the mid-1980s (Table 6).No consistent change <strong>in</strong> spr<strong>in</strong>g cyanobacteria biomasshas occurred <strong>in</strong> any bas<strong>in</strong> from the early1990s to more recent sampl<strong>in</strong>g periods (Table 6A).However, summer biomass was dramatically <strong>in</strong>creasedfor the most recent period (Table 6B). Thelarge amount <strong>of</strong> <strong>in</strong>terannual and spatial variability<strong>in</strong> the cyanobacteria data <strong>in</strong>dicated by the largestandard deviation reported for the recent period(Table 6) reflects an <strong>in</strong>creas<strong>in</strong>g frequency <strong>in</strong> the occurrence<strong>of</strong> samples with high cyanobacteria biomasses.Discern<strong>in</strong>g recent trends <strong>in</strong> bas<strong>in</strong>-specific seasonaltotal crustacean zooplankton biomass is difficultbecause data from the mid-1980s were summarizedover the whole <strong>of</strong> <strong>Lake</strong> <strong>Erie</strong> (Makarewicz1993b). Western bas<strong>in</strong> crustacean biomass <strong>in</strong> the1996–2002 period was greater than that reportedfrom the mid-1980s but less than that from the1970s (Table 7). Western bas<strong>in</strong> spr<strong>in</strong>g annual crustaceanzooplankton biomasses were generallygreater than those from the mid-1980s (5 <strong>of</strong> 7 years;Tables 2B, 7). All 1996–2002 annual average biomasseswere greater than the lowest <strong>of</strong> the annualmeans reported by Makarewicz (1993b, his Table2). The lowest recent western bas<strong>in</strong> spr<strong>in</strong>g crustaceanzooplankton biomass was observed <strong>in</strong> 1997(Table 2B). The 1996–2002 central bas<strong>in</strong> spr<strong>in</strong>g annualgrand mean <strong>of</strong> crustacean zooplankton biomasswas nearly twice the grand mean reported forthe mid-1980s, but was just less than one-half <strong>of</strong>that from the 1970s (Table 7). This grand mean was<strong>in</strong>fluenced by the most recent three years’ data(Table 2B). The lowest annual central bas<strong>in</strong> spr<strong>in</strong>gbiomass occurred <strong>in</strong> 1997 (Table 2B); this biomasswas also less than all those reported by Makarewicz(1993b). Eastern bas<strong>in</strong> spr<strong>in</strong>g crustacean zooplanktonbiomass was low <strong>in</strong> recent years (Tables 2B, 7)relative to that <strong>of</strong> previous periods. The 1996–2002spr<strong>in</strong>g grand mean (Table 7) was one-half <strong>of</strong> the1984–87 grand mean reported by Makarewicz(1993b). All eastern bas<strong>in</strong> annual spr<strong>in</strong>g meanswere lower than the grand mean from the mid-1980s (Table 7), with the lowest eastern bas<strong>in</strong>spr<strong>in</strong>g annual mean occurr<strong>in</strong>g <strong>in</strong> 2001 (Table 2B).Summer crustacean zooplankton biomass grandmeans were nearly three times higher <strong>in</strong> the 1970sthan <strong>in</strong> all other periods (Table 7). In the westernbas<strong>in</strong>, summer crustacean zooplankton biomass washigher <strong>in</strong> 1996–2002 than <strong>in</strong> the mid-1980s (Table7), with all years exceed<strong>in</strong>g the 1980s grand mean(Table 2B). The 1996–2002 central bas<strong>in</strong> summercrustacean zooplankton biomass grand mean wasmarg<strong>in</strong>ally higher than the mid-1980s (Table 7)with several years with biomasses greater than andseveral years less than the mid-1980s grand mean(Table 2B). The eastern bas<strong>in</strong> 1996–2002 crustaceanzooplankton grand mean was less than themid-1980s (Table 7). All recent-period summer biomassesvalues were less than the mid-1980s annualgrand mean except for 2002 (Table 2B).Overall, total crustacean zooplankton biomasshas decreased s<strong>in</strong>ce maxima <strong>in</strong> the 1970s. M<strong>in</strong>imalvalues were observed <strong>in</strong> 1986 for the western bas<strong>in</strong>and summer 1996 for the central and eastern bas<strong>in</strong>s(Table 2 <strong>of</strong> Makarewicz 1993b, Table 2B). <strong>Trends</strong>s<strong>in</strong>ce the mid-1980s were either <strong>in</strong>creas<strong>in</strong>g, de-
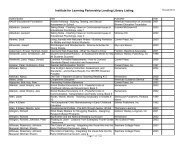
creas<strong>in</strong>g, or rema<strong>in</strong>ed the same, depend<strong>in</strong>g on theseason and bas<strong>in</strong> (Table 7).Does Phytoplankton <strong>Biomass</strong> Correlate withAnnual External Phosphorus Load?Phosphorus load<strong>in</strong>gs to <strong>Lake</strong> <strong>Erie</strong> were significantlydifferent (one-way ANOVA, F 3,23 = 13.3, P< 0.001) among the four time periods (1970–78,1983–87, 1988–93, and 1996–2002) analyzed.Mean (±SD) external phosphorus load<strong>in</strong>g was significantlygreater dur<strong>in</strong>g 1970–78 (19.8 ± 4.9 kilotonnes)than dur<strong>in</strong>g 1983–87 (10.7 ± 1.7kilotonnes), 1988–93 (10.1 ± 2.2 kilotonnes), and1996–2002 (10.4 ± 3.7 kilotonnes) (Tukey’s HSDtest, P < 0.05). Phosphorus loads dur<strong>in</strong>g the threelater time periods were not significantly differentfrom one another (P > 0.05).None <strong>of</strong> the total phytoplankton biomass versusexternal phosphorus load<strong>in</strong>g regressions were statisticallysignificant (P > 0.05), either when us<strong>in</strong>gtotal external loads <strong>of</strong> phosphorus to <strong>Lake</strong> <strong>Erie</strong> orbas<strong>in</strong>-specific loads. Additionally, when Cyanobacteriabiomass was regressed aga<strong>in</strong>st external phosphorusload<strong>in</strong>g, no significant relationships werefound.<strong>Temporal</strong> <strong>Trends</strong> <strong>in</strong> <strong>Lake</strong> <strong>Erie</strong> <strong>Plankton</strong> <strong>Biomass</strong> 103Total Phytoplankton <strong>Biomass</strong>—Chlorophyll a RelationshipsMost studies <strong>of</strong> <strong>Lake</strong> <strong>Erie</strong> phytoplankton usechlorophyll a as a surrogate for algal abundance(e.g., MacIsaac et al. 1999, Ackerman et al. 2001,Smith et al. 2005) because chlorophyll a concentrationis easier to determ<strong>in</strong>e than phytoplankton biomass.Ideally, total phytoplankton biomass shouldbe accurately and precisely estimated from chlorophylla concentration. From 1996 to 2002, however,there were different trends <strong>in</strong> total phytoplanktonbiomass, chlorophyll a concentration, andcyanobacteria biomass. To further <strong>in</strong>vestigate therelationship between these measures <strong>of</strong> phytoplanktonabundance on a bas<strong>in</strong>- and season-specificbasis, we performed l<strong>in</strong>ear regression analyses onthe recent (1996–2002) total phytoplankton biomassversus chlorophyll a concentration data. Weconducted two separate regressions—one us<strong>in</strong>g siteand date-specific data, and the other us<strong>in</strong>g the annualaverages. Regressions were constructed withchlorophyll a concentration as the explanatory variableand total phytoplankton biomass as the dependentvariable because chlorophyll a concentration is<strong>of</strong>ten used to estimate phytoplankton biomass (Fig.FIG. 2. Phytoplankton biomass (mg L –1 ) as afunction <strong>of</strong> chlorophyll a concentration (µg L –1 )from <strong>in</strong>dividual stations <strong>in</strong> the western (filled circles),central (open squares), and eastern (opentriangles) bas<strong>in</strong>s <strong>of</strong> <strong>Lake</strong> <strong>Erie</strong> from 1996–2001 (n= 1049). Raw data are plotted <strong>in</strong> (A) (slope = 0.21,R 2 = 0.04, P < 0.001) while natural log-transformeddata are plotted <strong>in</strong> (B) (slope = 0.34, R 2 =0.07, P < 0.001). All data are from LEPAS.2A). The regression us<strong>in</strong>g the orig<strong>in</strong>al data (Fig.2A; n = 1049) was highly statistically significant(Total <strong>Biomass</strong> = (0.74 ± 0.17) + [(0.21 ± 0.03) ×Chlorophyll a]; F 1,1047 = 48.11, P < 0.001) but hadlittle explanatory power (R 2 = 0.04). Natural logtransformeddata provided little improvement (Fig.2B; ln (Total <strong>Biomass</strong>) = (–0.78 ± 0.05) + [(0.34 ±0.04) × ln (Chlorophyll a)]; F 1,1047 = 77.65, P
104 Conroy et al.cant (western bas<strong>in</strong> summer; Total <strong>Biomass</strong> =(–0.82 ± 1.37) + [(0.53 ± 0.19) × Chlorophyll a];F 1,5 = 7.46, P = 0.04, R 2 = 0.52. These results <strong>in</strong>dicatedthat chlorophyll a concentration did not predicttotal phytoplankton biomass well dur<strong>in</strong>g therecent (1996–2001) period.Test<strong>in</strong>g Predictions <strong>of</strong> Dreissenid Effectson <strong>Lake</strong> <strong>Erie</strong> <strong>Plankton</strong>The abundance <strong>of</strong> research on the effect <strong>of</strong> dreissenidson <strong>Lake</strong> <strong>Erie</strong> plankton abundance over thepast 15 years has generated many predictions(Table 1). We used the results <strong>of</strong> our summary <strong>of</strong>recent total phytoplankton biomass, chlorophyll aconcentration, cyanobacteria biomass, and totalcrustacean biomass to test these predictions. Asseen <strong>in</strong> the results above, there were many <strong>in</strong>consistencies<strong>in</strong> the response <strong>of</strong> these groups both with<strong>in</strong>a group (i.e., <strong>in</strong>creased crustacean zooplankton biomass<strong>in</strong> the western bas<strong>in</strong> but decreased biomass <strong>in</strong>the eastern bas<strong>in</strong>) and between groups (i.e., <strong>in</strong>creasedsummer cyanobacteria biomass but decreasedsummer chlorophyll a concentration <strong>in</strong> allbas<strong>in</strong>s). However, several predictions <strong>of</strong> dreissenideffects on <strong>Lake</strong> <strong>Erie</strong> plankton communities do havesome support from comparison <strong>of</strong> our results withthose from the mid-1980s (Makarewicz 1993a,1993b; Makarewicz et al. 1999).The <strong>in</strong>crease <strong>in</strong> total summer phytoplankton biomasspredicted to occur by Vanderploeg et al.(2001, 2002) and dur<strong>in</strong>g the spr<strong>in</strong>g and summer byConroy et al. (2005a) was observed: the recent annualphytoplankton biomasses (Tables 2A, 4) exceededthose <strong>of</strong> the mid-1980s (i.e., pre-dreissenid<strong>in</strong>vasion with low external phosphorus load; Table4). Similarly, the predicted <strong>in</strong>creases <strong>in</strong> cyanobacteria<strong>in</strong> the summer by Vanderploeg et al. (2001,2002), <strong>in</strong> the spr<strong>in</strong>g <strong>in</strong> the western bas<strong>in</strong> byMakarewicz et al. (1999), and <strong>in</strong> the spr<strong>in</strong>g andsummer by Conroy et al. (2005a) were generallyobserved (Table 6). It is noteworthy that these predictionswere based upon different mechanisms(i.e., selective filtration versus excretion). The decrease<strong>in</strong> chlorophyll a concentration observed byBarbiero and Tuchman (2004b) and Makarewicz etal. (1999) <strong>in</strong> the western bas<strong>in</strong> dur<strong>in</strong>g the 1980s andearly 1990s was observed <strong>in</strong> our more recent dataalso (Table 5). Our data were not consistent withthe rema<strong>in</strong><strong>in</strong>g predictions perta<strong>in</strong><strong>in</strong>g to total phytoplanktonbiomass, chlorophyll a concentration, orcyanobacteria biomass (Table 1).Total crustacean zooplankton biomass was lowerdur<strong>in</strong>g the recent period than previously <strong>in</strong> the easternbas<strong>in</strong> but not the central or western bas<strong>in</strong>s (Tables2B,7). This observation was not entirelyconsistent with the prediction that through competition,dreissenids would negatively impact zooplanktoncommunities (but see Patterson et al. 2005).IMPLICATIONS FORFUTURE LAKE ERIE RESEARCHOne <strong>of</strong> the key observations that stimulated researchby the <strong>Lake</strong> <strong>Erie</strong> Trophic Status group <strong>in</strong>2002 was the report <strong>of</strong> historically low phytoplanktonbiomass as measured by chlorophyll a concentration<strong>in</strong> the late 1990s (Rockwell et al. 2005).Low phytoplankton biomass was expected for tworeasons. First, through implementation <strong>of</strong> the Great<strong>Lake</strong>s Water Quality Agreement, phosphorus load<strong>in</strong>ghad decreased throughout the late 1970s and1980s (Dolan 1993, Dolan and McGunagle 2005)possibly limit<strong>in</strong>g phytoplankton production(Makarewicz 1993a, Nicholls 1997). Secondly, theestablishment <strong>of</strong> high densities <strong>of</strong> dreissenid mussels(Patterson et al. 2005) was accompanied by decreases<strong>in</strong> nearshore phytoplankton and <strong>in</strong>creases <strong>in</strong>the Secchi transparency (Holland 1993). Both predictedand observed decreases <strong>in</strong> phytoplanktonsuggested that zooplankton biomass would decreaseas well if zooplankton are food-limited. Here, wehave used the results <strong>of</strong> a multi-agency, lake-wideseasonal plankton study to test the hypothesized relationshipsamong plankton abundance and externalphosphorus load<strong>in</strong>g and the presence <strong>of</strong> dreissenidmussels.Our comparison <strong>of</strong> recent plankton data to thosepreviously reported <strong>in</strong> the literature showed severalmarked trends. First, total phytoplankton biomass<strong>in</strong> 2002 was not at a m<strong>in</strong>imum. While 1996 and1997 were low biomass years throughout <strong>Lake</strong> <strong>Erie</strong>,recent years’ data showed <strong>in</strong>creased biomass. Easternbas<strong>in</strong> total phytoplankton biomass showed thegreatest <strong>in</strong>creases s<strong>in</strong>ce that time. However, thesedata were <strong>in</strong>fluenced by outliers, as evidenced by acomparison <strong>of</strong> the arithmetic and geometric means(Tables 2A, 4). Although chlorophyll a concentrationdecreased <strong>in</strong> all bas<strong>in</strong>s <strong>in</strong> both seasons (Table5), our data <strong>in</strong>dicate that chlorophyll a concentrationdoes not predict total phytoplankton biomasswell dur<strong>in</strong>g the recent period <strong>in</strong> <strong>Lake</strong> <strong>Erie</strong>.Cyanobacteria biomass <strong>in</strong>creased <strong>in</strong> the summer <strong>in</strong>all bas<strong>in</strong>s, and some grand means from 1996–2002exceeded those reported from 1970 (Table 6). Totalcrustacean zooplankton biomass dur<strong>in</strong>g the recent
<strong>Temporal</strong> <strong>Trends</strong> <strong>in</strong> <strong>Lake</strong> <strong>Erie</strong> <strong>Plankton</strong> <strong>Biomass</strong> 105period was at levels similar to, or exceed<strong>in</strong>g thoseobserved dur<strong>in</strong>g the mid-1980s <strong>in</strong> the western andcentral bas<strong>in</strong>s. However, zooplankton biomass decreased<strong>in</strong> the eastern bas<strong>in</strong> (Tables 2B, 7).<strong>Trends</strong> <strong>in</strong> plankton biomass could not be consistentlyexpla<strong>in</strong>ed by either <strong>in</strong>terannual changes <strong>in</strong>external phosphorus load or by the presence <strong>of</strong>dreissenids. However, some changes were consistentwith patterns <strong>in</strong> these forc<strong>in</strong>g functions. Hightotal phytoplankton biomass <strong>in</strong> the 1970s (Table 4)corresponds to the time <strong>of</strong> the highest externalphosphorus load (Dolan 1993). All total phytoplanktonbiomasses <strong>in</strong> the other periods (Table 4)are dur<strong>in</strong>g times <strong>of</strong> lower phosphorus load (Dolan1993, Dolan and McGunagle 2005). Additionally,the dreissenid excretion (Conroy et al. 2005a) andselective filtration (Vanderploeg et al. 2001, 2002)hypotheses predicted recent <strong>in</strong>creases <strong>in</strong> total phytoplanktonbiomass and cyanobacteria biomass dur<strong>in</strong>gsummer.The <strong>in</strong>consistency between total phytoplanktonbiomass and chlorophyll a concentration trends andthe <strong>in</strong>ability <strong>of</strong> chlorophyll a concentration to predicttotal phytoplankton biomass is not a new f<strong>in</strong>d<strong>in</strong>g.Many studies have found that chlorophyll aconcentration was a poor predictor <strong>of</strong> total phytoplanktonbiomass (or cell volume) for many differentlakes (Nicholls 1976, Dolan et al. 1978,Nicholls and Dillon 1978, Tolstoy 1979, LaBaugh1995, Kalchev et al. 1996, Felip and Catalan 2000).In such relationships, a poor fit can commonly beattributed to overestimation <strong>of</strong> chlorophyll content,underestimation <strong>of</strong> total phytoplankton biomass, orboth (Tolstoy 1979). Further, convert<strong>in</strong>g from cellvolume to biomass is problematic due to the <strong>in</strong>clusion<strong>of</strong> vacuoles, which contribute little to functionalbiomass <strong>of</strong> cells, especially <strong>in</strong> diatoms(Smayda 1978). Similar problems occur <strong>in</strong> the conversion<strong>of</strong> cell biovolume or biomass to cell carbon,nitrogen, or other constituents (Smayda 1978).The slope <strong>of</strong> our regression relat<strong>in</strong>g all total phytoplanktonbiomasses to chlorophyll a concentrations(~ 0.21 µg chlorophyll mg –1 phytoplankton)was lower than those Tolstoy (1979) summarizedfrom many sources for freshwater lakes, mar<strong>in</strong>e andbrackish water, and freshwater and mar<strong>in</strong>e phytoplanktoncultures (generally 1–6 µg chlorophyllmg –1 phytoplankton) and that reported by Nicholls(1976; 3.55 µg chlorophyll mg –1 phytoplankton).The slope <strong>of</strong> our estimated relationship for westernbas<strong>in</strong> spr<strong>in</strong>g and summer averages (~ 1.1 µg chlorophyllmg –1 total phytoplankton), however, waswith<strong>in</strong> but, at the lower end <strong>of</strong>, the range reportedTABLE 8. Median and range values <strong>of</strong> chlorophylla percent composition <strong>of</strong> total wet phytoplanktonbiomass. Range values were either takendirectly from the literature (Ahlgren 1970 as citedby Nicholls 1976), were estimated from figures(Dolan et al. 1978, Fig. 4a), or were calculated asthe first and third quartiles <strong>of</strong> all data po<strong>in</strong>ts (thisstudy). Where values are miss<strong>in</strong>g, data were notavailable to calculate the respective measure.Study Median RangeAhlgren 1970<strong>Lake</strong> Vattern 0.5%<strong>Lake</strong> Norrviken 1.5% 0.6–5.7%Nicholls 1976Holland Marsh 0.5%Dolan et al. 1978Sag<strong>in</strong>aw Bay ~0.3–3.8%This study<strong>Lake</strong> <strong>Erie</strong> 0.35% 0.17–0.80%by Tolstoy (1979) and Nicholls (1976). Our estimates<strong>of</strong> chlorophyll a percent content <strong>of</strong> wet biomassfor all <strong>of</strong> our data comb<strong>in</strong>ed (n = 1049) werewith<strong>in</strong> the range <strong>of</strong> those reported by Ahlgren(1970, cited <strong>in</strong> Nicholls 1976) for two Swedishlakes, Nicholls (1976) for Holland Marsh, andDolan et al. (1978) for Sag<strong>in</strong>aw Bay <strong>in</strong> <strong>Lake</strong> Huron(Table 8). Taken together, these data <strong>in</strong>dicate thatthe slope <strong>of</strong> our regression l<strong>in</strong>e was low and probablyreflected the undue <strong>in</strong>fluence <strong>of</strong> extreme outlierswith respect to total phytoplankton biomass(e.g., high total phytoplankton biomass and lowchlorophyll a concentrations for the same sample).S<strong>in</strong>ce cellular chlorophyll content varies by up totwo orders <strong>of</strong> magnitude throughout the season(Nicholls and Dillon 1978) and among taxa, is affectedby nutrient concentration (Nicholls 1976)and especially light <strong>in</strong>tensity (Ahlgren 1970 cited <strong>in</strong>Nicholls 1976), and the regression between phytoplanktonbiomass and chlorophyll a concentration<strong>in</strong> <strong>Lake</strong> <strong>Erie</strong> is so poor, the use <strong>of</strong> chlorophyll aconcentration as a surrogate for phytoplankton biomassshould be done with caution until the relationshipcan be better established for <strong>Lake</strong> <strong>Erie</strong>.The relationship between with<strong>in</strong>-lake total phosphorusconcentration and chlorophyll a concentrationand/or total phytoplankton biomass is wellestablished for a variety <strong>of</strong> lakes (Dillon and Rigler1974, Nicholls and Dillon 1978). In <strong>Lake</strong> <strong>Erie</strong>, data
106 Conroy et al.before the dreissenid <strong>in</strong>vasion showed a lower slopefor the chlorophyll a concentration versus <strong>in</strong>-laketotal phosphorus concentration compared to otherGreat <strong>Lake</strong>s (Smith et al. 2005). Smith et al.(2005), us<strong>in</strong>g Analysis <strong>of</strong> Covariance tests, did notf<strong>in</strong>d a significant reduction <strong>in</strong> this relationship subsequentto the dreissenid <strong>in</strong>vasion for the <strong>of</strong>fshorewaters. The predicted reduction <strong>in</strong> chlorophyll aconcentration, total phytoplankton biomass, andcyanobacteria biomass with reduction <strong>in</strong> externaltotal phosphorus load is also well established(Marsden 1989, Jeppesen et al. 2005). Consequently,our f<strong>in</strong>d<strong>in</strong>g <strong>of</strong> <strong>in</strong>creased total phytoplanktonbiomass and cyanobacteria biomass at loweredexternal phosphorus load is noteworthy. S<strong>in</strong>ce therelationship between the external phosphorus load<strong>in</strong>gto the lake or to <strong>in</strong>dividual bas<strong>in</strong>s was a poorpredictor <strong>of</strong> total phytoplankton biomass <strong>in</strong> <strong>Lake</strong><strong>Erie</strong>, we suspect that <strong>in</strong>ternal phosphorus load<strong>in</strong>g isbecom<strong>in</strong>g more important. This speculation reflectsthe f<strong>in</strong>d<strong>in</strong>gs <strong>of</strong> several studies that reported phosphorusconcentrations to be <strong>in</strong>creas<strong>in</strong>g <strong>in</strong> <strong>Lake</strong> <strong>Erie</strong>(Makarewicz et al. 2000, Charlton and Milne2004). External phosphorus load<strong>in</strong>g has apparentlynot changed significantly s<strong>in</strong>ce the 1980s (Dolanand McGunagle 2005), and tributary phosphorusconcentrations have decl<strong>in</strong>ed due to decreased nonpo<strong>in</strong>tsource loads (Richards and Baker 2002). Increased<strong>in</strong>ternal load<strong>in</strong>g <strong>of</strong> phosphorus can becaused by the release <strong>of</strong> phosphorus from sedimentsdur<strong>in</strong>g anoxic events (Nürnberg 1991) and/or by bioticactivity (Matis<strong>of</strong>f and Wang 1998). With respectto the biota, both bioturbation by mayflies(D.D. Kane unpublished data, Bachteram et al.2005) and phosphorus rem<strong>in</strong>eralization from dreissenids(Conroy et al. 2005a), other benthic <strong>in</strong>vertebrates(Dev<strong>in</strong>e and Vanni 2002), and fishes (Vanniet al. 2002, Bunnell et al. 2005) may be important.In addition to the cont<strong>in</strong>ued monitor<strong>in</strong>g <strong>of</strong> externalphosphorus loads, research <strong>in</strong>to elucidat<strong>in</strong>g phosphorusbudgets and cycl<strong>in</strong>g rates for <strong>Lake</strong> <strong>Erie</strong> mustbe conducted.Increased cyanobacteria biomass s<strong>in</strong>ce 1996 <strong>in</strong>all bas<strong>in</strong>s dur<strong>in</strong>g the summer and <strong>in</strong> the western andeastern bas<strong>in</strong>s dur<strong>in</strong>g spr<strong>in</strong>g <strong>in</strong>dicates that <strong>Lake</strong><strong>Erie</strong> system health (Conroy et al. 2005b) may bedecl<strong>in</strong><strong>in</strong>g. Most <strong>of</strong> the <strong>in</strong>creased summer cyanobacteriabiomass is due to a resurgence throughout<strong>Lake</strong> <strong>Erie</strong> <strong>of</strong> Microcystis spp., a non-nitrogen-fix<strong>in</strong>gcyanobacterium, (V<strong>in</strong>cent et al. 2004, R<strong>in</strong>ta-Kantoet al. 2005, Conroy et al. 2005a). In contrast,cyanobacterial biomass <strong>in</strong> 1970 was dom<strong>in</strong>ated bynitrogen-fix<strong>in</strong>g taxa such as Anabaena spp. andAphanizomenon spp. (Munawar and Munawar1976). The switch to Microcystis spp. now suggeststhat either the nutrient supply is sufficient to favorthis taxon or that selective filtration by dreissenidsis great enough to affect competition betweencyanobacteria taxa. Several recent studies provideevidence that nutrient supply is important (Raikowet al. 2004, Sarnelle et al. 2005, Conroy et al.2005a) while others support selective filtration(Vanderploeg et al. 2001, 2002). Of particular importancemay be the way <strong>in</strong> which dreissenids affectnitrogen cycl<strong>in</strong>g <strong>in</strong> <strong>Lake</strong> <strong>Erie</strong> through theirexcretion <strong>of</strong> ammonia (Conroy et al. 2005a). Whilethe effect <strong>of</strong> dreissenids is greatest <strong>in</strong> the nearshore(Hecky et al. 2004), direct-manipulative research todeterm<strong>in</strong>e how dreissenids affect nutrient supply <strong>in</strong>conjunction with selective filtration is needed for usto better understand why Microcystis spp. are thedom<strong>in</strong>ant cyanobacterial taxa now.Variable trends were found for the crustaceanzooplankton community (Table 7). It is unclear whycrustacean zooplankton abundance would consistently<strong>in</strong>crease <strong>in</strong> the western bas<strong>in</strong> and consistentlydecrease <strong>in</strong> the eastern bas<strong>in</strong> based upon similarchanges <strong>in</strong> the total phytoplankton biomass,cyanobacteria biomass, and chlorophyll a concentration.Ingestion <strong>of</strong> cyanobacteria by eastern bas<strong>in</strong>crustacean zooplankton could lead to decreased survival,reproduction, and biomass (Arnold 1971,Ghadouani et al. 2003) as the eastern bas<strong>in</strong> saw thegreatest <strong>in</strong>crease <strong>in</strong> cyanobacteria biomass and hasamounts approximat<strong>in</strong>g those <strong>in</strong> the western bas<strong>in</strong>(Table 6). Zooplanktivory due to one-year-andolderand young-<strong>of</strong>-the-year ra<strong>in</strong>bow smelt <strong>in</strong> theeastern bas<strong>in</strong> was hypothesized to be responsiblefor decreases <strong>in</strong> zooplankton <strong>in</strong> the mid-1990s (Johannssonet al. 1999), but ra<strong>in</strong>bow smelt populationsconcurrently decreased from the mid-1980sthrough at least the mid-1990s (Ryan et al. 1999).Barbiero and Tuchman (2004a), attribute decreases<strong>in</strong> abundance <strong>of</strong> eastern bas<strong>in</strong> cladocerans to the <strong>in</strong>vasion<strong>of</strong> Bythotrephes longimanus. The role <strong>of</strong> <strong>in</strong>vertebratezooplanktivores <strong>in</strong> affect<strong>in</strong>g crustaceanzooplankton community dynamics is amplified bythe <strong>in</strong>vasion <strong>of</strong> Cercopagis pengoi <strong>in</strong> both the western(Therriault et al. 2002) and eastern (D.A. Culver,unpublished data) bas<strong>in</strong>s. However, thecontrast<strong>in</strong>g response by the crustacean zooplanktoncommunity to changes <strong>in</strong> bottom-up and top-downforces <strong>in</strong> different bas<strong>in</strong>s <strong>of</strong> <strong>Lake</strong> <strong>Erie</strong> rema<strong>in</strong>s to beexpla<strong>in</strong>ed mechanistically.In this article we have comb<strong>in</strong>ed the results <strong>of</strong> arecent (1996–2002) plankton study with published
<strong>Temporal</strong> <strong>Trends</strong> <strong>in</strong> <strong>Lake</strong> <strong>Erie</strong> <strong>Plankton</strong> <strong>Biomass</strong> 107plankton abundances from previous years to testwhether recent changes <strong>in</strong> phytoplankton and zooplanktonabundances are consistent with predictionsbased upon changes <strong>in</strong> external phosphorus load<strong>in</strong>gand the effects <strong>of</strong> <strong>in</strong>vasive dreissenid mussels. Ourresults suggest that phytoplankton biomass (especiallycyanobacteria biomass) is <strong>in</strong>creas<strong>in</strong>g, and thispattern is most consistent with an effect <strong>of</strong> nutrientrecycl<strong>in</strong>g by dreissenids. However, zooplanktonabundances have not <strong>in</strong>creased as rapidly as wouldbe expected if they are regulated by phytoplanktonabundance, suggest<strong>in</strong>g important areas for furtherresearch, given their importance to recruitment <strong>of</strong>juvenile fish <strong>in</strong> the lake.ACKNOWLEDGMENTSWe would like to thank the numerous techniciansfor process<strong>in</strong>g thousands <strong>of</strong> phytoplankton, zooplankton,and chlorophyll samples over the past 9years, particularly Nate Gargasz and Er<strong>in</strong> Haas. Wewould also like to thank the capta<strong>in</strong>s and crews <strong>of</strong>the various research vessels from which many sampleswere collected. This research was sponsored bythe Ohio Department <strong>of</strong> Natural Resources as part<strong>of</strong> the Federal Aid <strong>in</strong> Sport Fish Restoration Program(F-69-P, Fish Management <strong>in</strong> Ohio) adm<strong>in</strong>isteredjo<strong>in</strong>tly by the U.S. Fish and Wildlife Serviceand the Ohio Division <strong>of</strong> Wildlife and the UnitedStates Environmental Protection Agency (GL-97590101). J.D.C. was supported as a <strong>University</strong>Fellow by The Ohio State <strong>University</strong> and D.D.K.was supported by a Raymond C. Osborn MemorialGraduate Fellowship from The Ohio State <strong>University</strong>and the Department <strong>of</strong> Evolution, Ecology, andOrganismal Biology while work<strong>in</strong>g on part <strong>of</strong> thisproject. We would like to acknowledge the <strong>in</strong>ternationaleffort and cooperative spirit that supports ourwork and the stewardship for <strong>Lake</strong> <strong>Erie</strong> shown bythe various management agencies. Without such encouragement,this work would not be possible. Extensivecomments and suggestions by twoanonymous reviewers and Jan Ciborowski greatlyimproved the manuscript.REFERENCESAckerman, J.D., Loewen, M.R., and Hambl<strong>in</strong>, P.F. 2001.Benthic-pelagic coupl<strong>in</strong>g over a zebra mussel reef <strong>in</strong>western <strong>Lake</strong> <strong>Erie</strong>. Limnol. Oceanogr. 46:892–904.Ahlgren, G. 1970. Limnological studies <strong>of</strong> <strong>Lake</strong> Norrviken,a eutrophied Swedish lake. II. Phytoplanktonand its production. Schweiz. Z. Hydrol. 32:353–396.Arnold, D.E. 1971. Ingestion, assimilation, survival, andreproduction by Daphnia pulex fed seven species <strong>of</strong>blue-green algae. Limnol. Oceanogr. 16:906–920.Arnott, D.L., and Vanni, M.J. 1996. Nitrogen and phosphorusrecycl<strong>in</strong>g by the zebra mussel (Dreissena polymorpha)<strong>in</strong> the western bas<strong>in</strong> <strong>of</strong> <strong>Lake</strong> <strong>Erie</strong>. Can. J.Fish. Aquat. Sci. 53:646–659.Bachteram, A.M., Mazurek, K.A., and Ciborowski,J.J.H. 2005. Sediment suspension by burrow<strong>in</strong>gmayflies (Hexagenia spp., Ephemeroptera: Ephemeridae).J. Great <strong>Lake</strong>s Res. 31 (Suppl. 2):208–222.Barbiero, R.P., and Tuchman, M.L. 2004a. Changes <strong>in</strong>the crustacean communities <strong>of</strong> <strong>Lake</strong>s Michigan,Huron, and <strong>Erie</strong>, follow<strong>in</strong>g the <strong>in</strong>vasion <strong>of</strong> the predatorycladoceran Bythotrephes longimanus. Can. J.Fish. Aquat. Sci. 61:2111–2125.——— , and Tuchman, M.L. 2004b. Long-term dreissenidimpacts on water clarity <strong>in</strong> <strong>Lake</strong> <strong>Erie</strong>. J. Great <strong>Lake</strong>sRes. 30:557–566.Bean, D.J. 1980. Crustacean zooplankton production <strong>in</strong><strong>Lake</strong> <strong>Erie</strong>, 1970. M.S. thesis, The Ohio State <strong>University</strong>,Columbus, Ohio.Beeton, A.M. 2002. Large freshwater lakes: presentstate, trends, and future. Environ. Conserv. 29:21–38.Budd, J.W., Beeton, A.M., Stumpf, R.P., Culver, D.A.,and Kerfoot, W.C. 2001. Satellite observations <strong>of</strong>Microcystis blooms <strong>in</strong> western <strong>Lake</strong> <strong>Erie</strong>. Verh. Internat.Vere<strong>in</strong>. Limnol. 27:3787–3793.Bunnell, D.B., Johnson, T.B., and Knight, C.T. 2005.The impact <strong>of</strong> <strong>in</strong>troduced round gobies (Neogobiusmelanostomus) on phosphorus cycl<strong>in</strong>g <strong>in</strong> central <strong>Lake</strong><strong>Erie</strong>. Can. J. Fish. Aquat. Sci. 62:15–29.Burns, N.M., and Ross, C. 1972. Project Hypo. CanadaCentre for Inland Waters, Paper No. 6. United StatesEnvironmental Protection Agency, Technical ReportTS-05-71-208-24.Carrick, H.J., Moon, J.B., and Gaylord, B.F. 2005. Phytoplanktondynamics and hypoxia <strong>in</strong> <strong>Lake</strong> <strong>Erie</strong>: ahypothesis concern<strong>in</strong>g benthic-pelagic coupl<strong>in</strong>g <strong>in</strong> thecentral bas<strong>in</strong>. J. Great <strong>Lake</strong>s Res. 31 (Suppl. 2):111–124.Charlton, M.N., and Milne, J.E. 2004. Review <strong>of</strong> thirtyyears <strong>of</strong> change <strong>in</strong> <strong>Lake</strong> <strong>Erie</strong> water quality. NationalWater Research Institute Contribution No. 04-167.——— , Milne, J.E., Booth, W.G., and Chiocchio, F.1993. <strong>Lake</strong> <strong>Erie</strong> <strong>of</strong>fshore <strong>in</strong> 1990: restoration andresilience <strong>in</strong> the central bas<strong>in</strong>. J. Great <strong>Lake</strong>s Res.19:291–309.Conroy, J.D., and Culver, D.A.. 2005. Do dreissenidsaffect <strong>Lake</strong> <strong>Erie</strong> ecosystem stability processes? Am.Midl. Nat. 153:20–32.———, Edwards, W.J., Pontius, R.A., Kane, D.D.,Zhang, H., Shea, J.F., Richey, J.N., and Culver, D.A.2005a. Soluble nitrogen and phosphorus excretion <strong>of</strong>exotic freshwater mussels (Dreissena spp.): potentialimpacts for nutrient rem<strong>in</strong>eralisation <strong>in</strong> western <strong>Lake</strong><strong>Erie</strong>. Freshwater Biology 50:1146–1162.———, Kane, D.D., and Culver, D.A. 2005b. Decl<strong>in</strong><strong>in</strong>g
108 Conroy et al.<strong>Lake</strong> <strong>Erie</strong> ecosystem health—evidence from a multiyear,lake-wide plankton study. In Check<strong>in</strong>g the pulse<strong>of</strong> <strong>Lake</strong> <strong>Erie</strong>, M. Munawar and R.T. Heath, eds.Canada: Ecovision World Monograph Series, AquaticEcosystem Health and Management Society. In press.Culver, D.A., Boucherle, M.M., Bean, D.J., and Fletcher,J.W. 1985. <strong>Biomass</strong> <strong>of</strong> Great <strong>Lake</strong>s zooplankton fromlength-weight regressions. Can. J. Fish. Aquat. Sci.42:1380–1390.DeVault, D.S., and Rockwell, D.C. 1986. Prelim<strong>in</strong>aryresults <strong>of</strong> the 1978–79 <strong>Lake</strong> <strong>Erie</strong> Intensive Study—phytoplankton. Unpublished Report. Great <strong>Lake</strong>sNational Program Office, USEPA, Chicago, Ill<strong>in</strong>ois.Dev<strong>in</strong>e, J.A., and Vanni, M.J. 2002. Spatial and seasonalvariation <strong>in</strong> nutrient excretion by benthic <strong>in</strong>vertebrates<strong>in</strong> a eutrophic reservoir. Freshwater Biology47:1107–1121.Dillon, P.J., and Rigler, F.H. 1974. The phosphoruschlorophyllrelationship <strong>in</strong> lakes. Limnol. Oceanogr.19:767–773.Dolan, D.M. 1993. Po<strong>in</strong>t source load<strong>in</strong>gs <strong>of</strong> phosphorusto <strong>Lake</strong> <strong>Erie</strong>: 1986–1990. J. Great <strong>Lake</strong>s Res.19:212–223.———, and McGunagle, K. 2005. <strong>Lake</strong> <strong>Erie</strong> total phosphorusload<strong>in</strong>g analysis and update: 1996–2002. J.Great <strong>Lake</strong>s Res. 31 (Suppl. 2):11–22.——— , Bierman, V.J., Dipert, M.H., and Geist, R.D.1978. Statistical analysis <strong>of</strong> the spatial and temporalvariability <strong>of</strong> the ratio chlorophyll a to phytoplanktoncell volume <strong>in</strong> Sag<strong>in</strong>aw Bay, <strong>Lake</strong> Huron. J. Great<strong>Lake</strong>s Res. 4:75–83.Edwards, W.J., Rehmann, C.R., McDonald, E., and Culver,D.A. 2005. The impact <strong>of</strong> a benthic filter feeder:limitations imposed by physical transport <strong>of</strong> algae tothe benthos. Can. J. Fish. Aquat. Sci. 62:205–214.Felip, M., and Catalan, J. 2000. The relationship betweenphytoplankton biovolume and chlorophyll <strong>in</strong> a deepoligotrophic lake: decoupl<strong>in</strong>g <strong>in</strong> their spatial and temporalmaxima. J. <strong>Plankton</strong> Res. 22:91–105.Frost, P.C., and Culver, D.A. 2001. Spatial and temporalvariability <strong>of</strong> phytoplankton and zooplankton <strong>in</strong> western<strong>Lake</strong> <strong>Erie</strong>. J. Freshwater Ecology 16:435–443.Gannon, J.E. 1971. Two count<strong>in</strong>g cells for the enumeration<strong>of</strong> zooplankton micro-crustacea. Trans. Am.Microsc. Soc. 90:486–490.Ghadouani, A., P<strong>in</strong>el-Alloul, B., and Prepas, E.E. 2003.Effects <strong>of</strong> experimentally <strong>in</strong>duced cyanobacterialblooms on crustacean zooplankton communities.Freshwater Biology 48:363–381.——— , and Smith, R.E.H. 2005. Phytoplankton distribution<strong>in</strong> <strong>Lake</strong> <strong>Erie</strong> as assessed by a new <strong>in</strong> situ spectr<strong>of</strong>luorometrictechnique. J. Great <strong>Lake</strong>s Res. 31(Suppl. 2):154–167.Glooschenko, W.A., Moore, J.E., and Vollenweider,R.A. 1974. Spatial and temporal distribution <strong>of</strong>chlorophyll a and phaeopigments <strong>in</strong> surface waters <strong>of</strong><strong>Lake</strong> <strong>Erie</strong>. J. Fish. Res. Board Can. 31:265–274.Haney, J.F., and Hall, D.J. 1973. Sugar-coated Daphnia:a preservation technique for Cladocera. Limnol.Oceanogr. 18:331–333.Heath, R.T., Fahnenstiel, G.L., Gardner, W.S., Cavaletto,J.F., and Hwang, S.-J. 1995. Ecosystem-level effects <strong>of</strong>zebra mussels (Dreissena polymorpha): an enclosureexperiment <strong>in</strong> Sag<strong>in</strong>aw Bay, <strong>Lake</strong> Huron. J. Great<strong>Lake</strong>s Res. 21:501–516.Hebert, P.D.N., Muncaster, B.W., and Mackie, G.L.1989. Ecological and genetic studies on Dreissenapolymorpha (Pallas): a new mollusk <strong>in</strong> the Great<strong>Lake</strong>s. Can. J. Fish. Aquat. Sci. 46:1587–1591.Hecky, R.E., Smith, R.E.H., Barton, D.R., Guildford, S.J.,Taylor, W.D., Charlton, M.N., and Howell, T. 2004.The nearshore phosphorus shunt: a consequence <strong>of</strong>ecosystem eng<strong>in</strong>eer<strong>in</strong>g by dreissenids <strong>in</strong> the LaurentianGreat <strong>Lake</strong>s. Can. J. Fish. Aquat. Sci. 61:1285–1293.Holland, R.E. 1993. Changes <strong>in</strong> planktonic diatoms andwater transparency <strong>in</strong> Hatchery Bay, Bass Island area,western <strong>Lake</strong> <strong>Erie</strong> s<strong>in</strong>ce the establishment <strong>of</strong> the zebramussel. J. Great <strong>Lake</strong>s Res. 19:617–624.Jeppesen, E., Søndergaard, M., Jensen, J.P., Havens, K.E.,Anneville, O., Carvalho, L., Coveney, M.F., Deneke,R., Dokulil, M.T., Foy, B., Gerdeaux, D., Hampton,S.E., Hilt, S., Kangur, K., Köhler, J., Lammens,E.H.H.R., Lauridsen, T.L., Manca, M., Miracle, M.,Moss, B., Nõges, P., Persson, G., Phillips, G., Portielje,R., Romo, S., Schelske, C.L., Straile, D., Tatrai, I.,Willén, E., and W<strong>in</strong>der, M. 2005. <strong>Lake</strong> responses toreduced nutrient load<strong>in</strong>g—an analysis <strong>of</strong> contemporarylong-term data from 35 case studies. Freshwater Biology50:1747–1771.Johannsson, O.E., Graham, D.M., E<strong>in</strong>house, D.W.E., andMills, E.L. 1999. Historical and recent changes <strong>in</strong> the<strong>Lake</strong> <strong>Erie</strong> zooplankton community and their relationshipto ecosystem function. In State <strong>of</strong> <strong>Lake</strong> <strong>Erie</strong>: Past,Present and Future. M. Munawar, T. Edsall, and I.F.Munawar, eds., pp. 169–196. Leiden, The Netherlands:Backhuys Publishers.Kalchev, R.K., Beshkova, M.B., Boumbarova, C.S.,Tsvetkova, R.L., and Sais, D. 1996. Some allometricand non-allometric relationships between chlorophyll-aand abundance variables <strong>of</strong> phytoplankton. Hydrobiologia341:235–245.Kane, D.D. 2004. The development <strong>of</strong> a <strong>Plankton</strong>ic Index<strong>of</strong> Biotic Integrity for <strong>Lake</strong> <strong>Erie</strong>. Ph.D. dissertation,The Ohio State <strong>University</strong>, Columbus, Ohio.Koonce, J.F., Busch, W.-D.N., and Czapla, T. 1996.Restoration <strong>of</strong> <strong>Lake</strong> <strong>Erie</strong>: contribution <strong>of</strong> water qualityand natural resource management. Can. J. Fish.Aquat. Sci. 53 (Supplement 1):105–112.LaBaugh, J.W. 1995. Relation <strong>of</strong> algal biovolume tochlorophyll a <strong>in</strong> selected lakes and wetlands <strong>in</strong> thenorth-central United States. Can. J. Fish. Aquat. Sci.52:416–424.Lorenzen, C.J. 1967. Determ<strong>in</strong>ation <strong>of</strong> chlorophyll and
<strong>Temporal</strong> <strong>Trends</strong> <strong>in</strong> <strong>Lake</strong> <strong>Erie</strong> <strong>Plankton</strong> <strong>Biomass</strong> 109pheo-pigments: spectrophotometric equations. Limnol.Oceanogr. 12:343–346.MacIsaac, H.J. 1996. Potential abiotic and biotic impacts<strong>of</strong> zebra mussels on the <strong>in</strong>land waters <strong>of</strong> North America.Amer. Zool. 36:287–299.——— , Sprules, W.G., Johannsson, O.E., and Leach, J.H.1992. Filter<strong>in</strong>g impacts <strong>of</strong> larval and sessile zebra mussels(Dreissena polymorpha) <strong>in</strong> western <strong>Lake</strong> <strong>Erie</strong>.Oecologia 92:30–39.——— , Johannsson, O.E., Ye, J., Sprules, W.G., Leach,J.H., McCorquodale, J.A., and Grigorovich, I.A. 1999.Filter<strong>in</strong>g impacts <strong>of</strong> an <strong>in</strong>troduced bivalve (Dreissenapolymorpha) <strong>in</strong> a shallow lake: application <strong>of</strong> a hydrodynamicmodel. Ecosystems 2:338–350.Makarewicz, J.C. 1993a. Phytoplankton biomass andspecies composition <strong>in</strong> <strong>Lake</strong> <strong>Erie</strong>, 1970 to 1987. J.Great <strong>Lake</strong>s Res. 19:258–274.——— . 1993b. A lakewide comparison <strong>of</strong> zooplanktonbiomass and its species composition <strong>in</strong> <strong>Lake</strong> <strong>Erie</strong>,1983–87. J. Great <strong>Lake</strong>s Res. 19:275–290.——— , Lewis, T.W., and Bertram, P. 1999. Phytoplanktoncomposition and biomass <strong>in</strong> the <strong>of</strong>fshore waters <strong>of</strong><strong>Lake</strong> <strong>Erie</strong>: pre- and post-Dreissena <strong>in</strong>troduction(1983–1993). J. Great <strong>Lake</strong>s Res. 25:135–148.——— , Bertram, P., and Lewis, T.W. 2000. Chemistry <strong>of</strong>the <strong>of</strong>fshore surface waters <strong>of</strong> <strong>Lake</strong> <strong>Erie</strong>: pre- andpost-Dreissena <strong>in</strong>troduction (1983–1993). J. Great<strong>Lake</strong>s Res. 26:82–93.Marsden, M.W. 1989. <strong>Lake</strong> restoration by reduc<strong>in</strong>gexternal phosphorus load<strong>in</strong>g: the <strong>in</strong>fluence <strong>of</strong> sedimentphosphorus release. Freshwater Biology21:139–162.Matis<strong>of</strong>f, G.L., and Ciborowski, J.J.H. 2005. <strong>Lake</strong> <strong>Erie</strong>Trophic Status collaborative study. J. Great <strong>Lake</strong>sRes. 31 (Suppl. 2):1–10.———, and Wang, X. 1998. Solute transport <strong>in</strong> sedimentsby freshwater <strong>in</strong>faunal bioirrigators. Limnol.Oceanogr. 43:1487–1499.May, B., and Marsden, J.E. 1992. Genetic identificationand implications <strong>of</strong> another <strong>in</strong>vasive species <strong>of</strong> dreissenidmussel <strong>in</strong> the Great <strong>Lake</strong>s. Can. J. Fish. Aquat.Sci. 49:1501–1506.McGucken, W. 2000. <strong>Lake</strong> <strong>Erie</strong> rehabilitated: controll<strong>in</strong>gcultural eutrophication, 1960s–1990s. Akron,Ohio: The <strong>University</strong> <strong>of</strong> Akron Press.M<strong>in</strong>itab, Inc. 2000. M<strong>in</strong>itab Version 13.1. State College,Pennsylvania.Munawar, M., and Munawar, I.F. 1976. A lakewidestudy <strong>of</strong> phytoplankton biomass and its species composition<strong>in</strong> <strong>Lake</strong> <strong>Erie</strong>, April–December 1970. J. Fish.Res. Board Can. 33:581–600.Nicholls, K.H. 1976. Nutrient-phytoplankton relationships<strong>in</strong> the Holland Marsh, Ontario. Ecol. Monogr.46:179–199.——— . 1997. <strong>Plankton</strong>ic green algae <strong>in</strong> western <strong>Lake</strong><strong>Erie</strong>: the importance <strong>of</strong> temporal scale <strong>in</strong> the <strong>in</strong>terpretation<strong>of</strong> change. Freshwater Biology 38:419–425.——— , and Dillon, P.J. 1978. An evaluation <strong>of</strong> phosphorus-chlorophyll-phytoplanktonrelationships for lakes.Int. Revue. Ges. Hydrobiol. 63:141–154.Noonberg, E.G., Shuter, B.J., and Abrams, P.A. 2003.Indirect effects <strong>of</strong> zebra mussels (Dreissena polymorpha)on the planktonic food web. Can. J. Fish. Aquat.Sci. 60:1353–1368.Nürnberg, G.K. 1991. Phosphorus from <strong>in</strong>ternal sources<strong>in</strong> the Laurentian Great <strong>Lake</strong>s, and the concept <strong>of</strong>threshold external load. J. Great <strong>Lake</strong>s Res. 17:132–140.Patterson, M.W.R., Ciborowski, J.J.H., and Barton, D.R.2005. The distribution and abundance <strong>of</strong> Dreissenaspecies (Dreissenidae) <strong>in</strong> <strong>Lake</strong> <strong>Erie</strong>, 2002. J. Great<strong>Lake</strong>s Res. 31 (Suppl. 2):223–237.Raikow, D.F., Sarnelle, O., Wilson, A.E., and Hamilton,S.K. 2004. Dom<strong>in</strong>ance <strong>of</strong> the noxious cyanobacteriumMicrocystis aerug<strong>in</strong>osa <strong>in</strong> low-nutrient lakes is associatedwith exotic zebra mussels. Limnol. Oceanogr.49:482–487.Richards, R.P., and Baker, D.B. 2002. <strong>Trends</strong> <strong>in</strong> waterquality <strong>in</strong> LEASAQ rivers and streams (northwesternOhio), 1975–1995. J. Environ. Qual. 31:90–96.R<strong>in</strong>ta-Kanto, J.M., Ouelette, A.J.A., Boyer, G.L., Twiss,M.R., Bridgeman, T.B., and Wilhelm, S.W. 2005.Quantification <strong>of</strong> toxic Microcystis spp. dur<strong>in</strong>g the2003 and 2004 blooms <strong>in</strong> western <strong>Lake</strong> <strong>Erie</strong> us<strong>in</strong>gquantitative real-time PCR. Environ. Sci. Technol.39:4198–4205.Rockwell, D.C., Warren, G.J., Bertram, P.E., Salisbury,D.K., and Burns, N.M. 2005. The U.S. EPA <strong>Lake</strong> <strong>Erie</strong><strong>in</strong>dicators monitor<strong>in</strong>g program 1983 to 2002: trends <strong>in</strong>phosphorus, silica, and chlorophyll a <strong>in</strong> the centralbas<strong>in</strong>. J. Great <strong>Lake</strong>s Res. 31 (Suppl. 2):23–34.Ryan, P.A., Witzel, L.D., Pa<strong>in</strong>e, J., Freeman, M., Hardy,M., Scholten, S., Sztramko, L., and MacGregor, R.1999. Recent trends <strong>in</strong> fish populations <strong>in</strong> eastern<strong>Lake</strong> <strong>Erie</strong> <strong>in</strong> relation to chang<strong>in</strong>g lake trophic stateand food web. In State <strong>of</strong> <strong>Lake</strong> <strong>Erie</strong>: Past, Present andFuture. M. Munawar, T. Edsall, and I.F. Munawar,eds., pp. 241–289. Leiden, The Netherlands: BackhuysPublishers.Sarnelle, O., Wilson, A.E., Hamilton, S.K., Knoll, L.B.,and Raikow, D.F. 2005. Complex <strong>in</strong>teractionsbetween the zebra mussel, Dreissena polymorpha, andthe harmful phytoplankter, Microcystis aerug<strong>in</strong>osa.Limnol. Oceanogr. 50:896–904.Sch<strong>in</strong>dler, D.W. 1974. Eutrophication and recovery <strong>in</strong>experimental lakes: implications for lake management.Science 184:897–899.Smayda, T.J. 1978. From phytoplankters to biomass. InPhytoplankton manual, ed. A. Sournia, pp. 273–279.Paris, France: United Nations Educational, Scientificand Cultural Organization.Smith, R.E.H., Hiriart-Baer, V.P., Higg<strong>in</strong>s, S.N., Guildford,S.J., and Charlton, M.N. 2005. <strong>Plankton</strong>ic primaryproduction <strong>in</strong> the <strong>of</strong>fshore waters <strong>of</strong> dreissenid-
110 Conroy et al.<strong>in</strong>fested <strong>Lake</strong> <strong>Erie</strong> <strong>in</strong> 1997. J. Great <strong>Lake</strong>s Res. 31(Suppl. 2):50–62.Smith, V.H. 1983. Low nitrogen to phosphorus ratiosfavor dom<strong>in</strong>ance by blue-green algae <strong>in</strong> lake phytoplankton.Science 221:669–671.Therriault, T.W., Grigorovich, I.A., Kane, D.D., Haas,E.M., Culver, D.A., and MacIsaac, H.J. 2002. Rangeexpansion <strong>of</strong> the exotic zooplankter Cercopagis pengoi(Ostroumov) <strong>in</strong>to western <strong>Lake</strong> <strong>Erie</strong> andMuskegon <strong>Lake</strong>. J. Great <strong>Lake</strong>s Res. 28:698–701.Tolstoy, A. 1979. Chlorophyll a <strong>in</strong> relation to phytoplanktonvolume <strong>in</strong> some Swedish lakes. Arch.Hydrobiol. 85:133–151.United States Environmental Protection Agency. 1997.Methods for the determ<strong>in</strong>ation <strong>of</strong> chemical substances<strong>in</strong> mar<strong>in</strong>e and estuar<strong>in</strong>e environmental matrices. 2 ndEdition. EPA/600/R-97/072.——— . <strong>Lake</strong> <strong>Erie</strong>—<strong>Lake</strong>wide Management Plan: aprimer on phosphorus <strong>in</strong> <strong>Lake</strong> <strong>Erie</strong>. 10 March 2004.26 September 2005. .Utermöhl, H. 1958. Zur Vervollkommung der quantitativenphytoplankton-methodik. M. H. Ver. Limnol.9:1–38.Vanderploeg, H.A., Liebig, J.R., Carmichael, W.W.,Agy, M.A., Johengen, T.H., Fahnenstiel, G.L., andNalepa, T.F. 2001. Zebra mussel (Dreissena polymorpha)selective filtration promoted toxic Microcystisblooms <strong>in</strong> Sag<strong>in</strong>aw Bay (<strong>Lake</strong> Huron) and <strong>Lake</strong> <strong>Erie</strong>.Can. J. Fish. Aquat. Sci. 58:1208–1221.——— , Nalepa, T.F., Jude, D.J., Mills, E.L., Holeck,K.T., Liebig, J.R., Grigorovich, I.A., and Ojaveer, H.2002. Dispersal and emerg<strong>in</strong>g ecological impacts <strong>of</strong>Ponto-Caspian species <strong>in</strong> the Laurentian Great <strong>Lake</strong>s.Can. J. Fish. Aquat. Sci. 59:1209–1228.Vanni, M.J., Flecker, A.S., Hood, J.M., and Headworth,J.L. 2002. Stoichiometry <strong>of</strong> nutrient recycl<strong>in</strong>g by vertebrates<strong>in</strong> a tropical stream: l<strong>in</strong>k<strong>in</strong>g species identityand ecosystem processes. Ecology Letters 5:285–293.V<strong>in</strong>cent, R.K., Q<strong>in</strong>, X., McKay, R.M.L., M<strong>in</strong>er, J., Czajkowski,K., Sav<strong>in</strong>o, J., and Bridgeman, T. 2004. Phycocyan<strong>in</strong>detection from LANDSAT TM data formapp<strong>in</strong>g cyanobacterial blooms <strong>in</strong> <strong>Lake</strong> <strong>Erie</strong>. RemoteSens. Environ. 89:381–392.Watson, N.H.F. 1976. Seasonal distribution and abundance<strong>of</strong> crustacean zooplankton <strong>in</strong> <strong>Lake</strong> <strong>Erie</strong>, 1970.J. Fish. Res. Board Can. 33:612–621.——— , and Carpenter, G.F. 1974. Seasonal abundance <strong>of</strong>crustacean zooplankton and net plankton biomass <strong>of</strong><strong>Lake</strong>s Huron, <strong>Erie</strong>, and Ontario. J. Fish. Res. BoardCan. 31:309–317.Weisgerber, K.M. 2000. Lower trophic level dynamics <strong>in</strong>western bas<strong>in</strong>, <strong>Lake</strong> <strong>Erie</strong>: changes <strong>in</strong> biomass, clearance,and nutrient excretion rates <strong>in</strong> crustacean zooplanktonversus zebra mussels. M.S. thesis, The OhioState <strong>University</strong>, Columbus, Ohio.Yu, N., and Culver, D.A. 1999. Estimat<strong>in</strong>g the effectiveclearance rate and refiltration by zebra mussels,Dreissena polymorpha, <strong>in</strong> a stratified reservoir.Freshwater Biol. 41:481–492.Zar, J.H. 1999. Biostatistical analysis. 4 th Edition. UpperSaddle River, New Jersey: Prentice Hall, Inc.Submitted: 17 June 2004Accepted: 11 November 2005Editorial handl<strong>in</strong>g: Jan J.H. Ciborowski