

PDF Version
PDF Version
PDF Version

You also want an ePaper? Increase the reach of your titles
YUMPU automatically turns print PDFs into web optimized ePapers that Google loves.
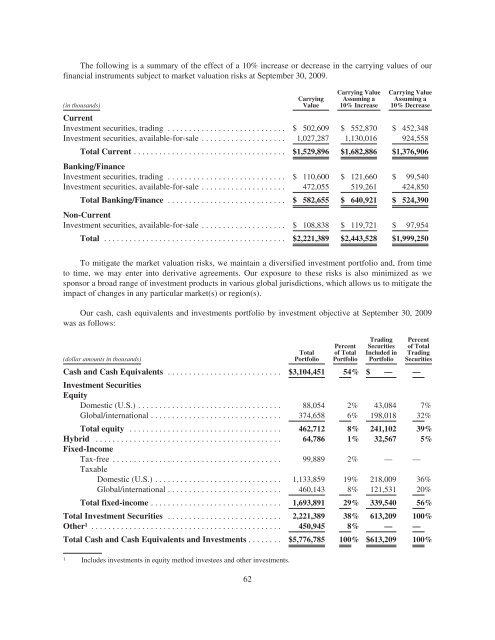
The following is a summary of the effect of a 10% increase or decrease in the carrying values of ourfinancial instruments subject to market valuation risks at September 30, 2009.(in thousands)CarryingValueCarrying ValueAssuming a10% IncreaseCarrying ValueAssuming a10% DecreaseCurrentInvestment securities, trading ............................ $ 502,609 $ 552,870 $ 452,348Investment securities, available-for-sale .................... 1,027,287 1,130,016 924,558Total Current .................................... $1,529,896 $1,682,886 $1,376,906Banking/FinanceInvestment securities, trading ............................ $ 110,600 $ 121,660 $ 99,540Investment securities, available-for-sale .................... 472,055 519,261 424,850Total Banking/Finance ............................ $ 582,655 $ 640,921 $ 524,390Non-CurrentInvestment securities, available-for-sale .................... $ 108,838 $ 119,721 $ 97,954Total ........................................... $2,221,389 $2,443,528 $1,999,250To mitigate the market valuation risks, we maintain a diversified investment portfolio and, from timeto time, we may enter into derivative agreements. Our exposure to these risks is also minimized as wesponsor a broad range of investment products in various global jurisdictions, which allows us to mitigate theimpact of changes in any particular market(s) or region(s).Our cash, cash equivalents and investments portfolio by investment objective at September 30, 2009was as follows:Percentof TotalPortfolioTradingSecuritiesIncluded inPortfolioPercentof TotalTradingSecuritiesTotal(dollar amounts in thousands)PortfolioCash and Cash Equivalents ........................... $3,104,451 54% $ — —Investment SecuritiesEquityDomestic (U.S.) .................................. 88,054 2% 43,084 7%Global/international ............................... 374,658 6% 198,018 32%Total equity .................................... 462,712 8% 241,102 39%Hybrid ............................................ 64,786 1% 32,567 5%Fixed-IncomeTax-free ........................................ 99,889 2% — —TaxableDomestic (U.S.) .............................. 1,133,859 19% 218,009 36%Global/international ........................... 460,143 8% 121,531 20%Total fixed-income ............................... 1,693,891 29% 339,540 56%Total Investment Securities ........................... 2,221,389 38% 613,209 100%Other 1 ............................................. 450,945 8% — —Total Cash and Cash Equivalents and Investments ........ $5,776,785 100% $613,209 100%1 Includes investments in equity method investees and other investments.62


