Determination of Radio Refractive Index using Meteorological Data.
Determination of Radio Refractive Index using Meteorological Data.
Determination of Radio Refractive Index using Meteorological Data.

You also want an ePaper? Increase the reach of your titles
YUMPU automatically turns print PDFs into web optimized ePapers that Google loves.
ELECTRONICS AND ELECTRICAL ENGINEERINGISSN 1392 – 1215 2010. No. 10(106)ELEKTRONIKA IR ELEKTROTECHNIKATELECOMMUNICATIONS ENGINEERINGT 180 ────────────────────────TELEKOMUNIKACIJŲ INŽINERIJA<strong>Determination</strong> <strong>of</strong> <strong>Radio</strong> <strong>Refractive</strong> <strong>Index</strong> <strong>using</strong> <strong>Meteorological</strong> <strong>Data</strong>E. ValmaVilnius University, Faculty <strong>of</strong> Physics,Saulėtekio al. 9, LT–10222 Vilnius, Lithuania, e–mail:egidijus.valma@ff.stud.vu.ltM. Tamošiūnaitė, S. TamošiūnasVilnius University, Faculty <strong>of</strong> Physics, Institute <strong>of</strong> Applied Research, Vilnius University,Saulėtekio al. 9, LT–10222 Vilnius, Lithuania, e-mails: milda.tamosiunaite@ff.stud.vu.lt, stasys.tamosiunas@ff.vu.ltM. TamošiūnienėCenter for Physical Sciences and Technology,A. Goštauto 11, LT–01108 Vilnius, Lithuania, e-mail: milda @pfi.ltM. ŽilinskasVilnius University, Faculty <strong>of</strong> Physics,Saulėtekio al. 9, LT–10222 Vilnius, Lithuania,Communications Regulatory Authority <strong>of</strong> the Republic <strong>of</strong> Lithuania, Department <strong>of</strong> <strong>Radio</strong> Communication,Algirdo 27 A, LT–03219 Vilnius, Lithuania, e-mail: mzilinskas@rrt.ltIntroductionThe value <strong>of</strong> radio refractive index <strong>of</strong> troposphere isan important parameter for the planning and design <strong>of</strong>microwave communications systems. The radio refractiveindex is defined as the ratio <strong>of</strong> the velocity <strong>of</strong> propagation<strong>of</strong> radio wave in a free space to the velocity <strong>of</strong> propagation<strong>of</strong> radio wave in a specified medium [1]. At standardatmosphere conditions near the Earth's surface, the radiorefractive index, n, is equal to approximately 1.0003 [1].The anomalous propagation is observed when theconditions <strong>of</strong> the propagation in the atmosphere vary fromthe standard one. Such anomalies are incident with somemeteorological conditions (inversion <strong>of</strong> temperature, highevaporation and humidity, passing <strong>of</strong> the cold air over thewarm surface and conversely). <strong>Refractive</strong> index is notconstant under conditions mentioned above. The refractiveindex <strong>of</strong> the atmosphere depends on the temperature,humidity, atmospheric pressure and water vapour pressure.The changes in the value <strong>of</strong> the radio refractive index cancurve the path <strong>of</strong> the wave. Even small changes in thesevariables can make a significant influence because radiosignals can be refracted over whole <strong>of</strong> the signal path [2].These parameters are highly variable and change rapidly intime and from place to place. For this reason,measurements <strong>of</strong> atmospheric pressure, temperature, andrelative humidity were conducted in Akure (7.15°N,5.12°E) to determine the radio refractive index [3]. Theresults obtained in [3] show that the local climate has anappreciable influence on the radio refractivity.125At high altitudes, the value <strong>of</strong> the refractive index napproximates to 1. In a well–mixed atmosphere, pressure,temperature and humidity decrease exponentially as afunction <strong>of</strong> height h above the Earth's surface [4]. Thevertical pr<strong>of</strong>iles <strong>of</strong> atmospheric pressure and opticalrefractive index have been theoretically analyzed in [5].At the ground surface, the N–values vary from 1.00027 upto 1.00035 in [6]. The gradient <strong>of</strong> the refractive index isresponsible for the bending <strong>of</strong> the propagation direction <strong>of</strong>the electromagnetic wave [7]. If it is negative, the signalbends downward. In [7], refraction seasonal variation inLatvia is presented.Lithuania, being in the transition geography zone fromthe Baltic Sea climate to Atlantic and continentals EastEurope climate, may be to distinguished for its variableclimate. Humid weather predominates in Lithuania all overthe year. The annual average precipitation is equal to 662mm. 68% <strong>of</strong> this collection vaporize. The relative humidityis 85–90 % in winter, and it is about 70 % in spring, and insummer [8]. The relative humidity minimum was only14% in Šilutė (in April 1995). The maximum temperature t= 37.5°C was in Zarasai on 30 July 1994. The minimumtemperature t = -42.9°C was in Utena on 1 st February 1956[9]. The influence <strong>of</strong> rain and clouds on theelectromagnetic wave propagation in Lithuania is analyzedin [10, 11]. The radio refractivity as far as we know hasnot been analyzed under Lithuanian climate conditions.In [6], it was mentioned that the specific attenuation <strong>of</strong>microwave increases by 0.07273 dB/km when thetemperature increases by 10%. And the specific attenuationincreases by 0.1251 dB/km when the relative humidity
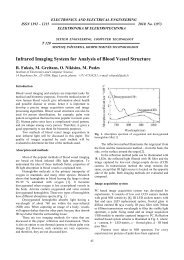
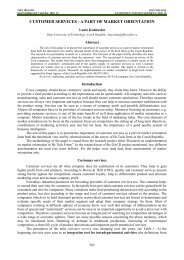
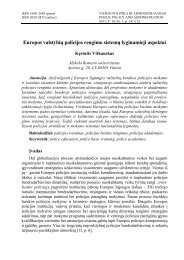
increases by 10%. The peculiarities <strong>of</strong> Lithuanian climaticconditions which are named above proves to becomereasons for <strong>using</strong> local geographical and meteorologicaldata when analyzing radio refractive index.For low latitudes (smaller than 22°) the seasonalvariations are not very important. For high latitudes (higherthan 45°) these variations are more pronounced [12]. As itwas described in [7], the seasonal variation <strong>of</strong> therefractivity gradient can cause microwave systemsunavailability. The geographical data <strong>of</strong> the localitiesinvestigated here is presented in Table 1. It is seen that thelatitudes <strong>of</strong> all investigated here localities here are higherthan 45° and the seasonal variations <strong>of</strong> the refractive index– value may be observed in these localities.The main goals <strong>of</strong> this paper were to apply the wellknownmodel [13] to determine the radio refractive index –values <strong>using</strong> local geographical and meteorological data <strong>of</strong>Lithuanian localities in different seasons <strong>of</strong> a year anddifferent day times and to compare these values withaverage value <strong>of</strong> refractive index at a ground level understandard atmosphere conditions.The results and discussionAs it was mentioned above, the climate <strong>of</strong> Lithuania isvariable and it was important to analyze the differences inthe seasonal and daily variations <strong>of</strong> the radio refractivity Nin the localities <strong>of</strong> Lithuania. We chose four localities <strong>of</strong>Lithuania situated in different climatic regions <strong>of</strong> Lithuania(see Table 1). The meteorological data were taken from[14].The dependences <strong>of</strong> average N – values on the time <strong>of</strong>day in different seasons <strong>of</strong> a year are presented in Figs. 1–4. Some regularities and differences have been observedwhen analyzing the dependences presented in Figs. 1 – 4.The maximum average value <strong>of</strong> radio refractivity was inKlaipėda (only in July at 9 o'clock these values wereexceeded in Kaunas) and minimum one was in Vilniusduring all the seasons and throughout all the daily time.Estimation <strong>of</strong> the value <strong>of</strong> the refractive indexThe atmospheric radio refractive index, n, can becalculated by the following formula [1, 4, 7, 13]−6n = 1 + N ⋅10, (1)where N, is the radio refractivity (N–units).The N–units are used in order to notice the changes inthe values <strong>of</strong> the refractive index which are usually small.These N–units are obtained by subtracting 1 from therefractive index and multiplying the remainder obtainsunits by a million (N = (n-1)·10 6 ) [4]. In this way moremanageable numbers are obtained.The radio refractivity N is expressed by [1, 7]77.6 ⎛N = ⎜ P + 4810T ⎝eT⎞⎟ , (2)⎠where P is atmospheric pressure (hPa), e is water vapourpressure, and T is absolute temperature.It is noted [7], that this expression may be used for allradio frequencies up to 100 GHz; the error is less than0.5%.The relationship between water vapour pressure e andrelative humidity is given by [13]Fig. 1. Dependences <strong>of</strong> average N – values on the time <strong>of</strong> day inVilnius (curve 1), Mažeikiai (curve 2), Kaunas (curve 3), andKlaipėda (curve 4) in February 2009The variations in the daily N – values are the least inKlaipėda in July, October, and April. In February, the leastdaily variation was observed in Mažeikiai (see Table 2).The most noticeable variations in the daily N – values wereobserved in April and July in Vilnius and Kaunas. InMažeikiai, the most noticeable variations in the daily N –values were observed in July.with= aHee = s, (3)100⎛ bt ⎞⎜ ⎟⎝ t + c ⎠e sexp , (4)where H is relative humidity (%), t is Celsius temperature(°C), e s is saturation vapour pressure (in hPa) at thetemperature t (in °C). For water a = 6.1121, b = 17.502, c= 240.97 (valid between –20ºC and +50ºC, with anaccuracy <strong>of</strong> ±0.20%) [1], [13].Fig. 2. Dependences <strong>of</strong> average N – values on the time <strong>of</strong> day inVilnius (curve 1), Mažeikiai (curve 2), Kaunas (curve 3), andKlaipėda (curve 4) in April 2009126
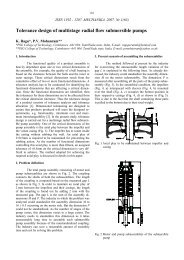
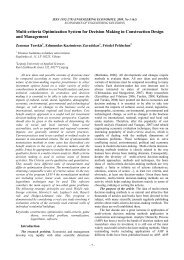
The differences in maximum yearly N – values andminimum ones are: 35.85 N – units in Vilnius, 32.03 N –units in Mažeikiai, 41.48 N – units in Kaunas, and 27.66N – units in Klaipėda. In Klaipėda, this difference wasminimum and maximum one was in Kaunas. It is worth tomentioning that the maximum N – value (N = 341.06 inJuly) and minimum one (N = 299.58 in April) wereobserved in Kaunas (see Table 3).Fig. 3. Dependences <strong>of</strong> average N – values on the time <strong>of</strong> a day inVilnius (curve 1), Mažeikiai (curve 2), Kaunas (curve 3), andKlaipėda (curve 4) in July 2008It is clearly seen that the N – values vary in the widerrange in October and April than in February in Vilnius. Itcan be explained by the variation <strong>of</strong> the humidity – values∆H in the periods mentioned above: ∆H = 75 % in April,∆H = 52 % in October, ∆H = 32 % in February.and February. Only in August, on 3 PM these values werelower in Vilnius and Kaunas.Table 1. Geographical dataLocality Longitude(East)Latitude(North)Altitude,mClimaticregionVilnius 25 0 06' 54°38' 162.0 SoutheasternPlainKaunas 23°50' 54°53' 77.0 MiddleLithuaniaLowlandKlaipėda 21°04' 55°44' 6.0 Coastial LowlMažeikiai 22°20' 56°18' 62.0 SamogitianHighlandTable 2. Daily variations Δ N s in average values <strong>of</strong> N s in thelocalities <strong>of</strong> Lithuania at the ground surfaceMonth July October February AprilLocality Δ N s Δ N s Δ N s Δ N sVilnius 13.63 6.96 1.98 13.07Kaunas 15.37 4.93 2.31 14.99Klaipėda 4.16 1.99 1.29 2.33Mažeikiai 12.42 6.07 1.12 6.59Table 3. Yearly variations in average values <strong>of</strong> N in the localities<strong>of</strong> Lithuania at the ground surfaceLocality Maximum N–value Minimum N–valueVilnius 332.50 296.65Kaunas 341.06 299.58Klaipėda 340.22 312.56Mažeikiai 335.52 303.49ConclusionsFig. 4. Dependences <strong>of</strong> average N – values on the time <strong>of</strong> day inVilnius (curve 1), Mažeikiai (curve 2), Kaunas (curve 3), andKlaipėda (curve 4) in October 2008In Klaipėda, the difference in maximum andminimum yearly values <strong>of</strong> radio refractivity obtained hereis by 1.66 N – units higher than one in Latvia presented in[7]. In Latvia, N – values varied starting from 313 up to315 in February and from 332 up to 339 in August.In all the localities investigated here the values <strong>of</strong> therefractivity N were higher than one at the standardatmosphere conditions presented in [1] in July, OctoberConsidering that the temperature, atmosphericpressure and water vapour pressure change withgeographical location and this can influence on the value<strong>of</strong> radio refractive index, we recommend the usage <strong>of</strong> localgeographical and meteorological data.The values <strong>of</strong> the refractive index in Klaipėda andKaunas are higher than in other investigated here regions<strong>of</strong> Lithuania in all the seasons and throughout the dailytime.The values <strong>of</strong> the radio refractive index calculatedhere under the local climate conditions differ from thevalue <strong>of</strong> average atmospheric radio refractive index closeto the ground surface [1] by starting from 1.82–N–units inVilnius (the minimum value) up to 41.06–N units inKaunas (the maximum value).The daily variations <strong>of</strong> N – values are most noticeable(in average, 14.1 N – units) in July (in Vilnius, Mažeikiai,and Kaunas) and in April (in Kaunas and Vilnius). InKlaipėda, the maximum value <strong>of</strong> daily variation <strong>of</strong> N –value is 4.16 N–units. The minimum variation <strong>of</strong> N –values was observed in February in all the localitiesinvestigated here (in average, 1.7 N – units). The values <strong>of</strong>N were higher than one at the standard atmosphereconditions presented in [1] in July, October, and Februaryexcept the cases in August on 3 PM in Vilnius and Kaunas.In Klaipėda, the difference between maximum and127
minimum values <strong>of</strong> radio refractivity obtained here is by1.66 N – units higher than one in Latvia presented in [7].References1. Freeman R. L. <strong>Radio</strong> System Design forTelecommunications. - New Jersey, Hoboken: JohnWiley&Sons Inc. Pb, – 2007. – 880 p.2. Priestley J. T., Hill R. J. Measuring High–Frequency<strong>Refractive</strong> <strong>Index</strong> in the Surface Layer // Journal <strong>of</strong>Atmospheric Surface Layer. Journal <strong>of</strong> Atmospheric andOceanic Technology. – 1985. – Vol. 2. - No. 2. – P. 233–251.3. Falodun S. E., Ajewole M. O. <strong>Radio</strong> refractive index in thelowest 100–m layer <strong>of</strong> the troposphere in Akure, SouthWestern Nigeria // Journal <strong>of</strong> Atmospheric and Solar–Terrestrial Physics.– 2006. – Vol. 68. - No. 2. – P. 236–243.4. Tamošiūnaitė M., Tamošiūnas S., Daukšas V.,Tamošiūnienė M., Žilinskas M. Prediction <strong>of</strong>Electromagnetic Waves Attenuation due to Rain in theLocalities <strong>of</strong> Lithuania // Electronics and ElectricalEngineering. – Kaunas: Technologija, 2010. – No. 9(105). –P. 9–12.5. Guanjun Guo, Shukai Li. Study on the vertical pr<strong>of</strong>ile <strong>of</strong>refractive index in the troposphere // International Journal <strong>of</strong>Infrared and Millimeter Waves, 2000. –Vol. 21. - No.7. – P.1103–1112.6. Ihara T. Applicability <strong>of</strong> specific rain attenuation models atmillimetre wavelengths // IEICE TransactionsCommunications, 1994. – Vol. E77–B. - No. 10. – P. 1275–1278.7. Serdega D., Ivanovs G. Refraction seasonal variation andthe influence on to GHz range microwaves availability //Electronics and Electrical Engineering. - Kaunas:Technologija, – 2007. - No. 6(78). – P. 39–42.8. Bagdonas A., Karalevičienė R. The Reference Book <strong>of</strong>Agrometeorologist. - Mokslas, 1987. – 144 p. (inLithuanian).9. Navaitis V. The Book <strong>of</strong> the Records in Lithuania. – Žara,2003. – 334 p. (in Lithuanian).10. Tamošiūnas S., Tamošiūnienė M., Žilinskas M.Calculation <strong>of</strong> electromagnetic wave attenuation due to rain<strong>using</strong> rainfall data <strong>of</strong> long and short duration // LithuanianJournal <strong>of</strong> Physics, 2007. – Vol. 47. - No. 2. – P. 163–168.11. Zilinskas M., Tamosiunaite M., Tamosiunas S.,Tamosiuniene M. The influence <strong>of</strong> the climatic peculiaritieson the electromagnetic waves attenuation in the Baltic Searegion // PIERS Online, 2008. – Vol. 4. - No. 3. – P. 321–325.12. Reference Standart Atmospheres. Draft Revision toRecommendation ITU–R P. 835–3. Document 3/33(Rev.1).E–2004.13. The radio refractive index: its formula and refractivity datain: Recommmendation ITU–R P. 453–9 – 1970-1986-1990-1992-1994-1995-1997-1999-2001-2003.Received 2010 02 13E. Valma, M. Tamošiūnaitė, S. Tamošiūnas, M. Tamošiūnienė, M. Žilinskas. <strong>Determination</strong> <strong>of</strong> <strong>Radio</strong> <strong>Refractive</strong> <strong>Index</strong> <strong>using</strong><strong>Meteorological</strong> <strong>Data</strong> // Electronics and Electrical Engineering. – Kaunas: Technologija, 2010. – No. 10(106). – P. 125–128.The International Telecommunications Union – <strong>Radio</strong>communications (ITU–R) model was used for calculation <strong>of</strong> the radiorefractive index according to the peculiarities <strong>of</strong> climatic conditions in Lithuania. For the first time the radio refractive index fordifferent localities in Lithuania have been determined <strong>using</strong> this model. The values <strong>of</strong> the radio refractive index have been determinedat altitude by starting from 6 m up to 162 m above the sea level in the troposphere. The daily and the seasonal variations <strong>of</strong> the radiorefractive index – value have been determined. It was obtained, that the maximum values <strong>of</strong> radio refractivity are in Klaipėda andKaunas and the minimum one was determined in Vilnius. The obtained data was compared with the known value <strong>of</strong> averageatmospheric radio refractive index close to the ground surface at the standard atmosphere conditions and with ones measured inneighbour state Latvia. Ill. 4, bibl. 13, tabl. 3 (in English; abstracts in English and Lithuanian).E. Valma, M. Tamošiūnaitė, S. Tamošiūnas, M. Tamošiūnienė, M. Žilinskas. Radijo bangų lūžio rodiklio apskaičiavimas pagalmeteorologinius duomenis // Elektronika ir elektrotechnika. – Kaunas: Technologija, 2010. – Nr. 10(106). – P. 125–128.Radijo bangos lūžio rodiklis apskaičiuotas Tarptautinės telekomunikacijų sąjungos (ITU–R) rekomenduojamu metodu,atsižvelgiant į Lietuvos klimato ypatumus. Pirmą kartą radijo bangos lūžio rodiklio vertės apskaičiuotos Lietuvos vietovėms, kurios yranuo 6 m iki 162 m virš jūros lygio. Gautos vertės palygintos su gerai žinoma atmosferos lūžio rodiklio verte prie Žemės paviršiausstandartinės atmosferos sąlygomis ir su vertėmis, išmatuotomis kaimyninėje šalyje Latvijoje. Ištirtos radijo lūžio rodikliopriklausomybės nuo paros ir metų laiko. Nustatyta, kad didžiausios radijo bangos lūžio rodiklio vertės yra Klaipėdoje ir Kaune, omažiausios – Vilniuje. Gauti duomenys gali būti naudojami projektuojant naujus radijo ryšio tinklus Lietuvoje. Il. 4, bibl. 13, lent. 3(anglų kalba; santraukos anglų ir lietuvių k.).128