60 JOURNAL OF APPLIED SEED PRODUCTION, VOL. 3, 1985and on refined observations. In a large scale breedingprogram however, thousands of plants have to be screenedfor seed productivity and simple screening characteristicsare required in order to cope with these numbers.The present study was set up to defme the factors affectingseed yield which could be determined for a large number ofplants.MATERIALS AND METHODSThe bluegrass material studied originated from two hybridizationprograms between cultivars, that were crossed in1976 and 1977 respectively as described by Hintzen and vanWijk (I985).The PI-plants that deviated positively (i.e. vigorous andhealthy growth with an adequate number of inflorescences)from the mother plant were selected. In 1979 2.9% of theFl-plants were selected; in 1980 this percentage was 1.2%.The origin and number of the selected plants is given in Table1.The selected plants were multiplied vegetatively. Of theTable 1. Origin and number of plants studied.Origin1979ParadeParadeParadeParadeFylkingContinentalAquila1980PionPionPionEn topperEntopperEntopperParadeParadeParadeParadeAquilaAquilaAquilaAquilaAquilaMentorMentorMentorMentorEnwartoBaron*Continental*Aquila*En topper*Baron*Aquila*Parade*Parade*Mentor*Aquila*Parade*Mentor*Aquila*Parade*Entopper*Pion*Mentor*Aquila*Bristol*Baron*Parade*Enwarto*En topper*Bristol*Baron*En topper*Pion*Pion*MentorNo.2492495534332222I32clones selected in 1979, 15 plants per clone were planted at adistance of 30 x 30 em on 9 August I979. Of the 1980-selected clones, 20 plants per clone were planted at the samedistance on 19 August 1980. The distance between plots was90 em. At time of planting in 1979, 100 kgN ha-t was appliedas calcium ammonium nitrate, while the 1980 planting received40 kg N ha-t at time of planting and 40 kg N ha-t on 20October 1980. The grass was not cut during autumn. On 28February 1980 and 19 February 1981 respectively, 60 kg Nha-t was applied.In the 1979- and 1980- program 50 and 45 F1-plants werechosen at random for making the observations describedbelow. The cultivars Aquila, Continental, Fylking and Paradewere included as standards in the 1979- program; Aquila,Baron, Birka, Entopper, Enwarto, Parade and Pion for the1980-program. The standard cultivars were planted as thePI-plants were. Observations made in I980 and 1981 arelisted in Table 2.One week before harvesting, an area of 30 x 30 em of thetreated plants in the vegetative stage was cut at ground level.Observations made on the material harvested are listed inTable 2.The remaining I4 (1980) or 19 plants (1981) were harvestedwhen the seed was ripe. After threshing and cleaning, thefollowing was determined or calculated: seed yield per plant,seed yield per inflorescence, and 1000 grain weight.The measured and calculated characteristics were subjectedto a regression analysis. Path coefficients were calculatedaccording to Dewey and Lu (1959) between number of inflorescences,number of florets, 1000 grain weight and floretutilization (1980), or number of germinating seeds (1981)with seed yield per plant and seed yield per inflorescence asdependent variables (excluding number of inflorescences forthe latter). The variables with the highest predictability of thedependent variables were selected according to Daniel andWood (1971), as described by van Wijk (1977). Of eachcharacteristic, the relative influence on the dependent variablewas calculated. The relative influence describes thefraction of the total change in the dependent variable that canbe accounted for by the accompanying total change in the ithindependent variable and is defined as: relative influence =( jbi jwJjwy in whichbi= the partial regression coefficient of the ithindependent variable xwi = the range of the ith independent variable xwy= the range of the dependent variable yRESULTSThough the plants studied were selected for high growthvigor and number of inflorescences, a wide variation in themeasured characteristics still occurred. In Table 3 the means,the coefficients of variation and the ranges of the measuredcharacteristics are presented (standard cultivars are included).In spite of their different genetic background, the 1979-and 1980- plants showed a fair agreement in these values.In both years, plant height and 1000-grain weight had thelowest coefficients of variation, while increase in culm num-
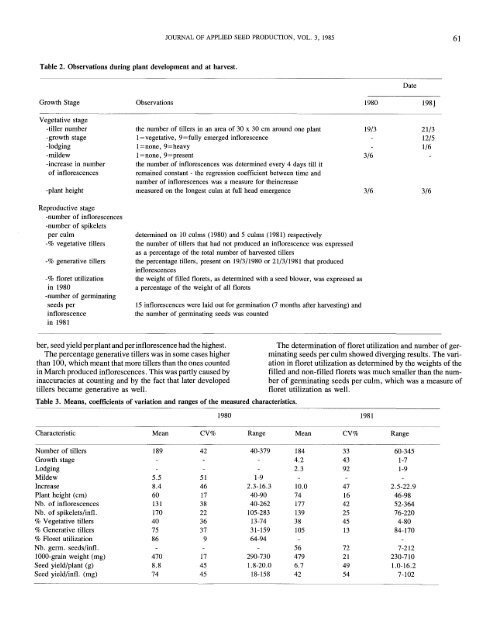
JOURNAL OF APPLIED SEED PRODUCTION, VOL. 3, 198561Table 2. Observations during plant development and at harvest.Growth StageVegetative stage-tiller number-growth stage-lodging-mildew-increase in numberof inflorescences-plant heightObservationsthe number of tillers in an area of 30 x 30 em around one plant1 =vegetative, 9=fully emerged inflorescencel=none, 9=heavy1 =none, 9=presentthe number of inflorescences was determined every 4 days till itremained constant - the regression coefficient between time andnumber of inflorescences was a measure for theincreasemeasured on the longest culm at full head emergenceDate1980 198J19/3 21/312/51/63/63/6 3/6Reproductive stage-number of inflorescences-number of spikeletsper culm-% vegetative tillers-% generative tillers-% floret utilizationin 1980-number of germinatingseeds perinflorescencein 1981determined on 10 culms (1980) and 5 culms (1981) respectivelythe number of tillers that had not produced an inflorescence was expressedas a percentage of the total number of harvested tillersthe percentage tillers, present on 19/3/1980 or 21/3/1981 that producedinflorescencesthe weight of filled florets, as determined with a seed blower, was expressed asa percentage of the weight of all florets15 inflorescences were laid out for germination (7 months after harvesting) andthe number of germinating seeds was countedher, seed yield per plant and per inflorescence had the highest.The percentage generative tillers was in some cases higherthan 100, which meant that more tillers than the ones countedin March produced inflorescences. This was partly caused byinaccuracies at counting and by the fact that later developedtillers became generative as well.Table 3. Means, coefficients of variation and ranges of the measured characteristics.The determination of floret utilization and number of germinatingseeds per culm showed diverging results. The variationin floret utilization as determined by the weights of thefilled and non-filled florets was much smaller than the numberof germinating seeds per culm, which was a measure offloret utilization as well.1980 1981Characteristic Mean CV% Range Mean CV% RangeNumber of tillers 189 42 40-379 184 33 60-345Growth stage 4.2 43 1-7Lodging 2.3 92 1-9Mildew 5.5 51 1-9Increase 8.4 46 2.3-16.3 10.0 47 2.5-22.9Plant height (em) 60 17 40-90 74 16 46-98Nb. of inflorescences 131 38 40-262 177 42 52-364Nb. of spikelets/infl. 170 22 105-283 139 25 76-220% Vegetative tillers 40 36 13-74 38 45 4-80% Generative tillers 75 37 31-159 105 13 84-170% Floret utilization 86 9 64-94Nb. germ. seeds/infl. 56 72 7-2121000-grain weight (mg) 470 17 290-730 479 21 230-710<strong>Seed</strong> yield/plant (g) 8.8 45 1.8-20.0 6.7 49 1.0-16.2<strong>Seed</strong> yield/infl. (mg) 74 45 18-158 42 54 7-102