Child Maltreatment 2006 - Administration for Children and Families
Child Maltreatment 2006 - Administration for Children and Families
Child Maltreatment 2006 - Administration for Children and Families

You also want an ePaper? Increase the reach of your titles
YUMPU automatically turns print PDFs into web optimized ePapers that Google loves.
For further in<strong>for</strong>mation, contact the NCANDS Federal Project Offcer at the following address:Dr. John A. GaudiosiMathematical Statistician<strong>Child</strong>ren’s Bureau<strong>Administration</strong> on <strong>Child</strong>ren, Youth <strong>and</strong> <strong>Families</strong>1250 Maryl<strong>and</strong> Avenue, SW8 th FloorWashington, DC 20024202–205–8625john.gaudiosi@acf.hhs.govThis publication is available on the Internet at http://www.acf.hhs.gov/programs/cb/stats_research/index.htm#can.Restricted use files of the NCANDS data are archived at the National Data Archive on <strong>Child</strong> Abuse <strong>and</strong>Neglect (NDACAN) at Cornell University. Researchers who are interested in using these data <strong>for</strong> statisticalanalyses can contact NDACAN by phone at 607–255–7799, by e-mail at ndacan@cornell.edu, or on theInternet at www.ndacan.cornell.edu.Material contained in this publication is in the public domain <strong>and</strong> may be reproduced, fully or partially,without permission of the Federal Government. The courtesy of attribution, crediting the source of thematerial, is requested. The recommended citation follows:U.S. Department of Health <strong>and</strong> Human Services, <strong>Administration</strong> on <strong>Child</strong>ren, Youth <strong>and</strong> <strong>Families</strong>.<strong>Child</strong> <strong>Maltreatment</strong> <strong>2006</strong> (Washington, DC: U.S. Government Printing Offce, 2008).
ii<strong>Child</strong> <strong>Maltreatment</strong> <strong>2006</strong>
DEPARTMENT OF HEALTH & HUMAN SERVICESADMINISTRATION FOR CHILDREN AND FAMILIES<strong>Administration</strong> on <strong>Child</strong>ren, Youth <strong>and</strong> <strong>Families</strong>1250 Maryl<strong>and</strong> Avenue, SWWashington, D.C. 20024Letter from the Associate Commissioner:I am pleased to present <strong>Child</strong> <strong>Maltreatment</strong> <strong>2006</strong>. This 17th annual report of data collected viathe National <strong>Child</strong> Abuse <strong>and</strong> Neglect Data System (NCANDS) is <strong>for</strong> Federal fiscal year <strong>2006</strong>.It reflects our commitment to provide the most complete national in<strong>for</strong>mation about childmaltreatment known to the States’ child protective services (CPS) agencies. Key findings in thisreport include the following.■ The rate <strong>and</strong> number of children who were victims of child abuse or neglect is lower <strong>for</strong> FFY<strong>2006</strong> than it was five years ago. During 2002, children were abused or neglected at a rate of12.3 per thous<strong>and</strong> children in the population resulting in an estimated 910,000 victims; <strong>for</strong><strong>2006</strong>, the rate was 12.1, resulting in an estimated 905,000 victims.■ The rate <strong>and</strong> number of all children who received an investigation or assessment increasedsince 2002. For 2002, the rate was 43.8 children per thous<strong>and</strong> in the population, resulting inan estimated 3,240,000 children who received an investigation or assessment; <strong>for</strong> <strong>2006</strong>, therate was 47.8 resulting in an estimated 3,573,000 children.■ Nationally, 64.2 percent of child victims experienced neglect, 16.0 percent were physically abused, 8.8percent were sexually abused, <strong>and</strong> 6.6 percent were emotionally or psychologically maltreated. Ratesof victimization by maltreatment type have fluctuated only slightly during the past several years.■ For <strong>2006</strong>, a nationally estimated 1,530 children died of abuse or neglect at a rate of 2.04children per 100,000 in the national population.Included in this report are additional national- <strong>and</strong> State-level findings about perpetrators ofmaltreatment, CPS workload, <strong>and</strong> preventive <strong>and</strong> postinvestigation services.I hope that you find this report to be a useful reference. The document is posted on the Website of the <strong>Administration</strong> <strong>for</strong> <strong>Child</strong>ren <strong>and</strong> <strong>Families</strong> at http://www.acf.hhs.gov/programs/cb/stats_research/index.htm#can. Due to the availability of the <strong>Child</strong> <strong>Maltreatment</strong> reports on theInternet <strong>and</strong> the yearly increased usage of the Internet <strong>for</strong> accessing in<strong>for</strong>mation contained in thesereports, the <strong>2006</strong> report will be the last year that the <strong>Child</strong> <strong>Maltreatment</strong> report will be available inprint <strong>for</strong>mat. For additional copies of the report <strong>and</strong> other in<strong>for</strong>mation about child maltreatment,contact the <strong>Child</strong> Welfare In<strong>for</strong>mation Gateway at 1–800–394–3366 or http://www.childwelfare.gov/.Sincerely,Christine M. CalpinAssociate Commissioner<strong>Child</strong>ren’s Bureau<strong>Administration</strong> on <strong>Child</strong>ren, Youth <strong>and</strong> <strong>Families</strong>iii
AcknowledgementsThe <strong>Administration</strong> on <strong>Child</strong>ren, Youth <strong>and</strong> <strong>Families</strong> (ACYF) strives to ensure the well-beingof our children through many programs <strong>and</strong> activities. One such activity is the National <strong>Child</strong>Abuse <strong>and</strong> Neglect Data System (NCANDS) of the <strong>Child</strong>ren’s Bureau.National <strong>and</strong> State statistics about child maltreatment are derived from the data collected bychild protective services agencies through NCANDS. The data are analyzed, disseminated, <strong>and</strong>produced in an annual report. <strong>Child</strong> <strong>Maltreatment</strong> <strong>2006</strong> marks the 17th issuance of this report.I hope that it continues to serve as an important resource <strong>for</strong> policymakers, child welfarepractitioners, researchers, <strong>and</strong> other concerned citizens.This year’s national statistics were based upon case-level data from 51 States, including theDistrict of Columbia <strong>and</strong> the Commonwealth of Puerto Rico <strong>and</strong> aggregate data from one State.Due to the dedication of State agencies, we approach our goal of receiving case-level data fromall States. We continue to provide States with technical support to improve data quality. Eachyear we also conduct a technical assistance meeting <strong>for</strong> the States, at which they partner with usin discussing issues related to improving data quality.On behalf of ACYF, I wish to thank the many people who made this publication possible. The<strong>Child</strong>ren’s Bureau has been <strong>for</strong>tunate to partner with in<strong>for</strong>med <strong>and</strong> committed State personnelwho work hard to provide comprehensive data, which reflect the work of their agencies. Inaddition, child protective services administrators <strong>and</strong> in<strong>for</strong>mation systems managers—servingas representatives to the State Advisory Group—continue to be an important source of advice<strong>and</strong> support <strong>for</strong> this ef<strong>for</strong>t. I gratefully acknowledge the priorities that were set by State <strong>and</strong> localagencies to submit these data to the <strong>Child</strong>ren’s Bureau, <strong>and</strong> thank the caseworkers <strong>and</strong> supervisorswho contribute to <strong>and</strong> use the States’ in<strong>for</strong>mation system. The time <strong>and</strong> ef<strong>for</strong>t dedicated bythese <strong>and</strong> other individuals <strong>for</strong>m the basis <strong>for</strong> our successful Federal-State partnership.Joan E. OhlCommissioner<strong>Administration</strong> on <strong>Child</strong>ren, Youth <strong>and</strong> <strong>Families</strong>v
vi <strong>Child</strong> <strong>Maltreatment</strong> <strong>2006</strong>
chapter 4: Fatalities 65Number of <strong>Child</strong> Fatalities65Age <strong>and</strong> Sex of <strong>Child</strong> Fatalities66Race <strong>and</strong> Ethnicity of <strong>Child</strong> Fatalities66Perpetrator Relationships of <strong>Child</strong> Fatalities66<strong>Maltreatment</strong> Types of <strong>Child</strong> Fatalities67Prior CPS Contact of <strong>Child</strong> Fatalities67Tables <strong>and</strong> Notes67chapter 5: PerpetratorsCharacteristics of PerpetratorsTables <strong>and</strong> Noteschapter 6: ServicesPreventive ServicesPostinvestigation ServicesFactors Influencing the Receipt of ServicesTables <strong>and</strong> Noteschapter 7: Additional Research Related to <strong>Child</strong> <strong>Maltreatment</strong>Reports on Key Indicators, Outcomes, <strong>and</strong> National StatisticsStudies of the Characteristics of <strong>Child</strong>ren in the <strong>Child</strong> Welfare SystemCapacity-Building InitiativesSuggestions <strong>for</strong> Future ResearchNCANDS <strong>Child</strong> File Trans<strong>for</strong>med into a Relational Databaseappendix a: Required CAPTA Data Itemsappendix b: Glossaryappendix c: Data Submission <strong>and</strong> Data Elementsappendix d: State Commentaryappendix e: Reader Feedback7575768383858687101101103106109110115119129137173viii <strong>Child</strong> <strong>Maltreatment</strong> <strong>2006</strong>
List of Tables <strong>and</strong> FiguresFiguresFig 2–1 Report Sources, <strong>2006</strong> 7Fig 2–2 Investigation Dispositions, <strong>2006</strong> 8Fig 2–3 Dispositions by Professional <strong>and</strong> Nonprofessional Report Sources, <strong>2006</strong> 9Fig 3–1 <strong>Child</strong> Disposition <strong>and</strong> Victimization Rates, 2002–<strong>2006</strong> 26Fig 3–2 Map of Victimization Rates, <strong>2006</strong> 26Fig 3–3 Victimization Rates by Age Group, <strong>2006</strong> 28Fig 3–4 Race <strong>and</strong> Ethnicity of Victims, <strong>2006</strong> 28Fig 3–5 Victims by Perpetrator Relationship, <strong>2006</strong> 30Fig 4–1 Age of <strong>Child</strong> Fatalities, <strong>2006</strong> 66Fig 4–2 Perpetrator Relationships of <strong>Child</strong> Fatalities, <strong>2006</strong> 66Fig 4–3 <strong>Maltreatment</strong> Types of <strong>Child</strong> Fatalities, <strong>2006</strong> 67Fig 5–1 Age <strong>and</strong> Sex of Perpetrators, <strong>2006</strong> 75Fig 5–2 Perpetrators by Relationship to Victims, <strong>2006</strong> 76TablesTable 2–1 Screened-In <strong>and</strong> Screened-Out Referrals, <strong>2006</strong> 11Table 2–2 Report Sources, <strong>2006</strong> 12Table 2–3 Investigation Dispositions, <strong>2006</strong> 16Table 2–4 Report Investigation Trends, 2002–<strong>2006</strong> 18Table 2–5 Disposition by Report Source, <strong>2006</strong> 21Table 2–6 PART Measure: Response Time in Hours, <strong>2006</strong> 23Table 2–7 <strong>Child</strong> Protective Services Work<strong>for</strong>ce, <strong>2006</strong> 24Table 3–1 Dispositions of <strong>Child</strong>ren Who Were Subjects of a CPS Investigation, <strong>2006</strong> 34Table 3–2 <strong>Child</strong> Disposition <strong>and</strong> Victimization Rates, 2002–<strong>2006</strong> 36Table 3–3 Disposition <strong>and</strong> Rate of Victims, <strong>2006</strong> 37Table 3–4 Victimization Rates, 2002–<strong>2006</strong> 38Table 3–5 PART Measure: First-Time Victims, <strong>2006</strong> 41Table 3–6 <strong>Maltreatment</strong> Types of Victims, <strong>2006</strong> 42Table 3–7 <strong>Maltreatment</strong> Types of Victims by Report Source, <strong>2006</strong> 44Table 3–8 Sex of Victims, <strong>2006</strong> 45Table 3–9 Age Group of Victims, <strong>2006</strong> 47Table 3–10 Victims by Age Group <strong>and</strong> <strong>Maltreatment</strong> Type, <strong>2006</strong> 50Table 3–11 Race <strong>and</strong> Ethnicity of Victims, <strong>2006</strong> 51Table 3–12 Race of Victims by <strong>Maltreatment</strong> Type, <strong>2006</strong> 55Table 3–13 Living Arrangement of Victims, <strong>2006</strong> 56Table 3–14 Victims with a Reported Disability, <strong>2006</strong> 57Table 3–15 Factors Associated with Victimization, <strong>2006</strong> 59Table 3–16 Absence of <strong>Maltreatment</strong> Recurrence, 2004–<strong>2006</strong> 60Table 3–17 Factors Associated with <strong>Maltreatment</strong> Recurrence, <strong>2006</strong> 61Table 3–18 Victims by Perpetrator Relationship, <strong>2006</strong> 62Table 3–19 Victims by <strong>Maltreatment</strong> Types <strong>and</strong> Perpetrator Relationship, <strong>2006</strong> 63Table 3–20 Absence of <strong>Maltreatment</strong> in Foster Care, 2004–<strong>2006</strong> 64ix
Table 4–1 <strong>Child</strong> Fatalities, 2005–<strong>2006</strong> 69Table 4–2 <strong>Child</strong> Fatality Rates per 100,000 <strong>Child</strong>ren, 2002–<strong>2006</strong> 71Table 4–3 Age <strong>and</strong> Sex of <strong>Child</strong> Fatalities, <strong>2006</strong> 71Table 4–4 Race <strong>and</strong> Ethnicity of <strong>Child</strong> Fatalities, <strong>2006</strong> 72Table 4–5 Perpetrator Relationships to <strong>Child</strong> Fatalities, <strong>2006</strong> 72Table 4–6 <strong>Maltreatment</strong> Types of <strong>Child</strong> Fatalities, <strong>2006</strong> 72Table 4–7 Prior CPS Contact of <strong>Child</strong> Fatalities, <strong>2006</strong> 73Table 5–1 Age <strong>and</strong> Sex of Perpetrators, <strong>2006</strong> 77Table 5–2 Race <strong>and</strong> Ethnicity of Perpetrators, <strong>2006</strong> 77Table 5–3 Perpetrators by Relationship to Victims, <strong>2006</strong> 78Table 5–4 Type of Parental Perpetrators, <strong>2006</strong> 80Table 5–5 Perpetrators by Type of <strong>Maltreatment</strong>, <strong>2006</strong> 81Table 6–1 <strong>Child</strong>ren Who Received Preventive Services, <strong>2006</strong> 89Table 6–2 Funding Sources, <strong>2006</strong> 90Table 6–3 <strong>Child</strong>ren Who Received Postinvestigation Services, <strong>2006</strong> 92Table 6–4 <strong>Child</strong>ren Who Were Removed From Home, <strong>2006</strong> 94Table 6–5 <strong>Maltreatment</strong> Types of Victims Who Were Removed From Home, <strong>2006</strong> 95Table 6–6 Victims with Court Action <strong>and</strong> Court-Appointed Representatives, <strong>2006</strong> 97Table 6–7 Victims Who Received Family Preservation or Family Reunification Services Within Previous 5 Years, <strong>2006</strong>98Table 6–8 Factors Related to Receipt of Postinvestigation Services <strong>and</strong> Foster Care, <strong>2006</strong>99Table A–1 Required CAPTA Data Items, by State Response, <strong>2006</strong> 116Table C–1 State Data Submissions, <strong>2006</strong> 130Table C–2 <strong>Child</strong> File Data Element List 131Table C–3 Agency File Data Element 135x<strong>Child</strong> <strong>Maltreatment</strong> <strong>2006</strong>
SummaryContentsxi
xii <strong>Child</strong> <strong>Maltreatment</strong> <strong>2006</strong>
SummaryAll 50 States, the District of Columbia, <strong>and</strong> theU.S. Territories have m<strong>and</strong>atory child abuse<strong>and</strong> neglect reporting laws that require certainprofessionals <strong>and</strong> institutions to report suspectedmaltreatment to a child protective services (CPS)agency. Examples of these m<strong>and</strong>atory reportersinclude health care providers <strong>and</strong> facilities,mental health care providers, teachers <strong>and</strong> otherschool staff, social workers, police officers,foster care providers, <strong>and</strong> daycare providers. Theinitial report of suspected child abuse or neglectis called a referral. Approximately one-third ofreferrals are screened out each year <strong>and</strong> do notreceive further attention from CPS. The remainingreferrals are “screened in” <strong>and</strong> an investigationor assessment is conducted by the CPS agencyto determine the likelihood that maltreatment hasoccurred or that the child is at risk of maltreatment.After conducting interviews with familymembers, the alleged victim, <strong>and</strong> other peoplefamiliar with the family, the CPS agency makes adetermination or finding concerning whether thechild is a victim of abuse or neglect or is at riskof abuse or neglect. This determination oftenis called a disposition. Each State establishesspecific dispositions <strong>and</strong> terminology.Each State has its own definitions of child abuse<strong>and</strong> neglect based on minimum st<strong>and</strong>ards set byFederal law. Federal legislation provides a foundation<strong>for</strong> States by identifying a minimum set of actsor behaviors that define child abuse <strong>and</strong> neglect.The Federal <strong>Child</strong> Abuse Prevention <strong>and</strong> TreatmentAct (CAPTA), (42 U.S.C.A. §5106g), as amended bythe Keeping <strong>Child</strong>ren <strong>and</strong> <strong>Families</strong> Safe Act of 2003,defines child abuse <strong>and</strong> neglect as:■ Any recent act or failure to act on the part of aparent or caretaker which results in death, seriousphysical or emotional harm, sexual abuseor exploitation; or■ An act or failure to act which presents animminent risk of serious harm.Within the minimum st<strong>and</strong>ards set by CAPTA,each State is responsible <strong>for</strong> providing its owndefinitions of child abuse <strong>and</strong> neglect. MostStates recognize four major types of maltreatment:neglect, physical abuse, sexual abuse, <strong>and</strong>emotional abuse. Although any of the <strong>for</strong>ms ofchild maltreatment may be found separately, theyalso can occur in combination.What is the National <strong>Child</strong>Abuse <strong>and</strong> Neglect DataSystem (NCANDS)?NCANDS is a federally sponsored ef<strong>for</strong>t thatcollects <strong>and</strong> analyzes annual data on child abuse<strong>and</strong> neglect. The 1988 CAPTA directed the U.S.Department of Health <strong>and</strong> Human Services toestablish a national data collection <strong>and</strong> analysisprogram. The <strong>Child</strong>ren’s Bureau in the <strong>Administration</strong>on <strong>Child</strong>ren, Youth <strong>and</strong> <strong>Families</strong>, <strong>Administration</strong><strong>for</strong> <strong>Child</strong>ren <strong>and</strong> <strong>Families</strong>, U.S. Departmentof Health <strong>and</strong> Human Services, collects <strong>and</strong>analyzes the data.The data are submitted voluntarily by the States,the District of Columbia, <strong>and</strong> the Commonwealthof Puerto Rico. The first report from NCANDS wasbased on data <strong>for</strong> 1990; the report <strong>for</strong> <strong>2006</strong> datais the 17th issuance of this annual report.SUMMARY Contentsxiii
How are the data used?Data are used <strong>for</strong> the annual report, <strong>Child</strong><strong>Maltreatment</strong>, which is released each spring.In addition, data are used in several ef<strong>for</strong>ts bythe <strong>Child</strong>ren’s Bureau to measure the impact<strong>and</strong> effectiveness of CPS. Data from NCANDSare used in the <strong>Child</strong> <strong>and</strong> Family ServicesReviews of the States, in the <strong>Child</strong> WelfareOutcomes: Annual Report to Congress, <strong>and</strong> inthe Program Assessment Rating Tool.What data are collected?NCANDS collects case-level data on allchildren who received an investigation orassessment by a CPS agency. States thatare unable to provide case-level data submitaggregated counts of key indicators.Case-level data include in<strong>for</strong>mation on thecharacteristics of referrals of abuse or neglectthat are made to CPS agencies, the childrenreferred, the types of maltreatment that arealleged, the dispositions (or findings) of theinvestigations, the risk factors of the child <strong>and</strong>the caregivers, the services that are provided,<strong>and</strong> the perpetrators.Where are the data available?Restricted usage files of State case-level dataare available <strong>for</strong> researchers from the NationalData Archive on <strong>Child</strong> Abuse <strong>and</strong> Neglect atwww.ndacan.cornell.edu. In addition, aggregatedcounts of key indicators by State areavailable <strong>for</strong> 1990–<strong>2006</strong>.estimated 3.6 million children received aninvestigation or assessment.■ Approximately 60 percent (61.7%) ofreferrals were screened in <strong>for</strong> investigationor assessment by CPS agencies.■ Approximately 30 percent of the investigationsor assessments determined at leastone child who was found to be a victim ofabuse or neglect with the following reportdispositions: 25.2 percent substantiated,3.0 percent indicated, <strong>and</strong> 0.4 percentalternative response victim.■ More than 70 percent of the investigationsor assessments determined that the childwas not a victim of maltreatment withthe following dispositions: 60.4 percentunsubstantiated, 5.9 percent alternativeresponse nonvictim, 3.2 percent “other,”1.7 percent closed with no finding, <strong>and</strong> 0.1percent intentionally false.Who reported childmaltreatment?For <strong>2006</strong>, more than one-half of all reports(56.3%) of alleged child abuse or neglect weremade by professionals. The term professionalmeans that the person had contact with thealleged child maltreatment victim as part ofthe report source’s job. This term includesteachers, police officers, lawyers, <strong>and</strong> socialservices staff. The remaining reports weremade by nonprofessionals, including friends,neighbors, sports coaches, <strong>and</strong> relatives.The <strong>Child</strong> <strong>Maltreatment</strong> reports are availableon the Internet at http://www.acf.hhs.gov/programs/cb/stats_research/index.htm#can.How many children werereported <strong>and</strong> received aninvestigation or assessment<strong>for</strong> abuse <strong>and</strong> neglect?During Federal fiscal year <strong>2006</strong>, an estimated3.3 million referrals, involving the allegedmaltreatment of approximately 6.0 millionchildren, were made to CPS agencies. An■ The three largest percentages of reportsources were from such professionals asteachers (16.5%), lawyers or police officers(15.8%), <strong>and</strong> social services staff (10.0%).Who were the child victims?During <strong>2006</strong>, an estimated 905,000 childrenwere determined to be victims of abuse orneglect. Among the children confirmed asvictims by CPS agencies in <strong>2006</strong>:xiv <strong>Child</strong> <strong>Maltreatment</strong> <strong>2006</strong>
■ <strong>Child</strong>ren in the age group of birth to 1 yearhad the highest rate of victimization at24.4 per 1,000 children of the same agegroup in the national population;■ More than one-half of the child victimswere girls (51.5%) <strong>and</strong> 48.2 percent wereboys; <strong>and</strong>■ Approximately one-half of all victims wereWhite (48.8%); one-quarter (22.8%) wereAfrican-American; <strong>and</strong> 18.4 percent wereHispanic.What were the most commontypes of maltreatment?As in prior years, neglect was the mostcommon <strong>for</strong>m of child maltreatment. CPSinvestigations determined that:■ More than 60 percent (64.1%) of victimssuffered neglect;■ More than 15 percent (16.0%) of thevictims suffered physical abuse;■ Less than 10 percent (8.8%) of the victimssuffered sexual abuse; <strong>and</strong>■ Less than 10 percent (6.6%) of the victimssuffered from emotional maltreatment.How many children diedfrom abuse or neglect?<strong>Child</strong> fatalities are the most tragic consequenceof maltreatment. Yet, each yearchildren die from abuse <strong>and</strong> neglect.During <strong>2006</strong>:■ An estimated 1,530 children died due tochild abuse or neglect;■ The overall rate of child fatalities was 2.04deaths per 100,000 children;■ More than 40 percent (41.1%) of childfatalities were attributed to neglect; physicalabuse also was a major contributor tochild fatalities;■ More than three-quarters (78.0%) of thechildren who died due to child abuse <strong>and</strong>neglect were younger than 4 years old;■ Infant boys (younger than 1 year) had thehighest rate of fatalities, at 18.5 deathsper 100,000 boys of the same age in thenational population; <strong>and</strong>■ Infant girls had a rate of 14.7 deaths per100,000 girls of the same age.Who abused <strong>and</strong>neglected children?In <strong>2006</strong>, nearly 80 percent (79.9%) of perpetratorsof child maltreatment were parents,<strong>and</strong> another 6.7 percent were other relativesof the victim. Women comprised a largerpercentage of all perpetrators than men, 57.9percent compared to 42.1 percent. More than75 percent (77.5%) of all perpetrators wereyounger than age 40.■ Of the perpetrators who maltreatedchildren, less than 10 percent (7.0%) committedsexual abuse, while 60.4 percentcommitted neglect.■ Of the perpetrators who were parents,more than 90 percent (91.5%) were thebiological parent of the victim.Who received services?During an investigation, CPS agencies provideservices to children <strong>and</strong> their families, both inthe home <strong>and</strong> in foster care.■ Of the children who received postinvestigationservices, nearly 60 percent (58.9%)were victims <strong>and</strong> 30.3 percent werenonvictms.■ Of the children who were placed in fostercare, more than 20 percent (21.5%) werevictims <strong>and</strong> 4.4 percent were nonvictims.SUMMARY Contentsxv
xvi <strong>Child</strong> <strong>Maltreatment</strong> <strong>2006</strong>
IntroductionCHAPTER 1<strong>Child</strong> abuse <strong>and</strong> neglect is one of the Nation’s most serious concerns. The <strong>Child</strong>ren’s Bureau,<strong>Administration</strong> on <strong>Child</strong>ren, Youth, <strong>and</strong> <strong>Families</strong> in the <strong>Administration</strong> <strong>for</strong> <strong>Child</strong>ren <strong>and</strong><strong>Families</strong> in the U.S. Department of Health <strong>and</strong> Human Services, addresses this important issuein many ways. One example is to collect data on the children who are served by child protectiveservices (CPS) agencies.This <strong>Child</strong> <strong>Maltreatment</strong> <strong>2006</strong> report, now in its 17th edition, presents national data about childabuse <strong>and</strong> neglect known to CPS agencies in the United States during Federal fiscal year (FFY)<strong>2006</strong>. The data were collected <strong>and</strong> analyzed through the National <strong>Child</strong> Abuse <strong>and</strong> Neglect DataSystem (NCANDS) supported by the <strong>Child</strong>ren’s Bureau. This chapter discusses the backgroundof NCANDS <strong>and</strong> describes the annual data collection process.Background of NCANDSThe <strong>Child</strong> Abuse Prevention <strong>and</strong> Treatment Act (CAPTA) was amended in 1988 to direct theSecretary of the Department of Health <strong>and</strong> Human Services (HHS) to establish a national datacollection <strong>and</strong> analysis program that would make available State child abuse <strong>and</strong> neglect reportingin<strong>for</strong>mation. 1 HHS responded by establishing NCANDS as a voluntary national reportingsystem.During 1992, HHS produced its first NCANDS report based on data from 1990. The <strong>Child</strong><strong>Maltreatment</strong> report series has evolved from that initial report. During the early years, Statesprovided aggregated data on key indicators of CPS. Starting with the 1993 data year, Statesvoluntarily began to submit case-level data. For a number of years, States provided both datasets, but starting with data year 2000, the case-level data set became the primary source of data<strong>for</strong> the annual report. The aggregated data file, the Summary Data Component (SDC), is phasingout as States are able to provide case-level data. For FFY <strong>2006</strong>, 51 States reported case-level data(<strong>Child</strong> Files). 2During 1996, CAPTA was amended to require all States that receive funds from the Basic StateGrant program to work with the Secretary of the Department of Health <strong>and</strong> Human Services toprovide specific data, to the extent practicable, about children who had been maltreated. Thesedata elements were incorporated into NCANDS; the required CAPTA data items are discussedin appendix A. An NCANDS glossary of terms is provided as appendix B.1 42 U.S.C. 5101 et seq.; 42 U.S.C. 5116 et seq., Public Law 100–294 passed April 25, 1988.2 In this report, “States” includes the District of Columbia <strong>and</strong> the Commonwealth of Puerto Rico. Maryl<strong>and</strong> was notable to provide <strong>2006</strong> data in time <strong>for</strong> this report.CHAPTER 1: Introduction 1
A State Advisory Group, comprising State CPS program administrators <strong>and</strong> in<strong>for</strong>mation systemsmanagers, assists with the identification <strong>and</strong> resolution of issues related to CPS data. Thisgroup suggests strategies <strong>for</strong> improving the quality of data submitted by the States <strong>and</strong> reviewsproposed modifications to NCANDS. The <strong>Child</strong>ren’s Bureau convenes the State Advisory Groupannually. The most recent list of State Advisory Group members are provided below:Michael Matthews, AlaskaNicolas Espadas, ArizonaDebbie Williams, Cali<strong>for</strong>niaLois Branic, District of ColumbiaKeith Perlman, FloridaVirginia Dick, GeorgiaKendall Darling, KansasWalter G. Fahr, LouisianaRosalind Walter, MassachusettsFrank L. Fornataro, NebraskaJane Whitney, New HampshirePaul Nance, New YorkTom Pomonis, North DakotaBill Hindman, OklahomaMaria Duryea, OregonEvelyza Crespo Rivera, Puerto RicoKim Wieczorek, South DakotaCynthia Ellingson, WashingtonIn addition to an annual meeting of the State Advisory Group, a technical assistance meeting<strong>for</strong> all States is held each year. This technical assistance meeting serves as a <strong>for</strong>um <strong>for</strong> providingguidance to the States <strong>for</strong> their annual data submissions <strong>and</strong> discussing data utilization <strong>and</strong>training needs.Data collected by NCANDS are a critical source of in<strong>for</strong>mation <strong>for</strong> many publications,reports, <strong>and</strong> activities of the Federal Government <strong>and</strong> other groups. An annual report on childwelfare outcomes includes context <strong>and</strong> outcome data on safety, based on State submissions toNCANDS. 3NCANDS data have been incorporated into the <strong>Child</strong> <strong>and</strong> Family Services Reviews (CFSR),which ensures con<strong>for</strong>mity with State plan requirements in titles IV–B <strong>and</strong> IV–E of the SocialSecurity Act. NCANDS data are the basis <strong>for</strong> two of the CFSR national data indicators:■ The absence of the recurrence of maltreatment; <strong>and</strong>■ The absence of maltreatment in foster care.The NCANDS data are used to help assess the per<strong>for</strong>mance of several <strong>Child</strong>ren’s Bureau programsthrough the Program Assessment Rating Tool (PART) process. The PART is a systematicmethod of assessing the per<strong>for</strong>mance of program activities across the Federal Government that“uses a questionnaire to help assess the management <strong>and</strong> per<strong>for</strong>mance of programs. It is usedto evaluate a program’s purpose, design, planning, management, results, <strong>and</strong> accountabilityto determine its overall effectiveness.” 4 The following measures are used to assess one or more<strong>Child</strong>ren’s Bureau programs including the CAPTA Basic State Grant <strong>and</strong> the Community-Based<strong>Child</strong> Abuse Prevention (CBCAP) program.3 U.S. Department of Health <strong>and</strong> Human Services, <strong>Administration</strong> on <strong>Child</strong>ren, Youth <strong>and</strong> <strong>Families</strong>, <strong>Child</strong> WelfareOutcomes 2003: Annual Report (Washington, DC: U.S. Government Printing Offce, <strong>2006</strong>).4 Offce of Management <strong>and</strong> Budget retrieved from http//www.whitehouse.gov/omb/expectmore/part.html.2<strong>Child</strong> <strong>Maltreatment</strong> <strong>2006</strong>
■ Decrease the rate of first-time victims per 1,000 children. This measure is based on analysisof the NCANDS <strong>Child</strong> File <strong>and</strong> the prior victim data element. The focus is on the primaryprevention of child abuse <strong>and</strong> neglect (CBCAP).■ Improve States’ average response time between maltreatment report <strong>and</strong> investigation, basedon the median of States’ reported average response time in hours from screened-in reports tothe initiation of the investigation as reported in the NCANDS Agency File. The objective is toimprove the effciency of child protective services <strong>and</strong> to reduce the risk of maltreatment topotential victims (CAPTA).■ Decrease the percentage of children with substantiated reports of maltreatment who have arepeated substantiated report of maltreatment within 6 months. This measure is based onanalysis of the annual NCANDS <strong>Child</strong> File. The goal is to ensure children’s safety by reducingthe recurrence of maltreatment (CAPTA).Annual Data Collection ProcessStates, which submit case-level data, construct a child-specific record <strong>for</strong> each report of allegedchild abuse or neglect that received a disposition as a result of an investigation or an assessmentduring the reporting period. The reporting period <strong>for</strong> <strong>Child</strong> <strong>Maltreatment</strong> <strong>2006</strong> was October 1,2005 through September 30, <strong>2006</strong>.Upon receipt of data from each State, a technical validation review was conducted to assessthe internal consistency of the data <strong>and</strong> to identify probable causes <strong>for</strong> missing data. In manyinstances, the review concluded that corrections were necessary <strong>and</strong> the State was requested toresubmit its data. Once a State’s case-level data were finalized, aggregate counts were computed<strong>and</strong> shared with the State. In addition, the aggregate-level data provided in the Agency File weresubjected to various logic <strong>and</strong> consistency checks. (See appendix C, Data Submissions <strong>and</strong> DataElements, <strong>for</strong> additional in<strong>for</strong>mation regarding data submissions.)The population of the States that submitted the <strong>Child</strong> File accounts <strong>for</strong> approximately 74 millionchildren or 99 percent of the Nation’s child population younger than 18 years (table C–1). 5Trend data in this report are based upon the most recent population estimates <strong>and</strong> dataresubmissions from the States, including resubmissions <strong>for</strong> prior years. To make trends morecomparable across years, the population data <strong>for</strong> Puerto Rico were added into all years <strong>and</strong>estimates were used <strong>for</strong> Puerto Rico data prior to 2005, which was its first reporting year. Datawere accepted through August 2007. 65 U.S. Census Bureau file PRC_EST<strong>2006</strong>_AGESEX_RES: Estimates of the Resident Population by Single-Year of Age<strong>and</strong> Sex <strong>for</strong> Puerto Rico (http://www.census.gov/popest/puerto_rico/files/PRC_EST<strong>2006</strong>_AGESEX_RES.csv [released5/17/2007] ), <strong>and</strong> U.S. Census Bureau file SC_EST<strong>2006</strong>_Alldata6: State Characteristics Population Estimates with 6Race Groups (http://www.census.gov/popest/states/asrh/files/SC_EST<strong>2006</strong>_Alldata6.csv [released 5/17/2007]). Here <strong>and</strong>throughout this report, the term “child population” refers to all people in the U.S. population younger than 18 years.6 Four States resubmitted FFY 2005 data—Arizona, Arkansas, Nevada, <strong>and</strong> South Dakota. Trend data reported in<strong>Child</strong> <strong>Maltreatment</strong> <strong>2006</strong> reflect those resubmissions. Trends also reflect the addition of two States reporting <strong>Child</strong>File data <strong>for</strong> the first time.CHAPTER 1: Introduction 3
Structure of the ReportThis report contains the additional chapters listed below. Throughout the report, tables withsupporting data are located at the end of each chapter:■ Chapter 2, Reports—referrals <strong>and</strong> reports of child maltreatment■ Chapter 3, <strong>Child</strong>ren—characteristics of alleged victims <strong>and</strong> nonvictims■ Chapter 4, Fatalities—fatalities that occurred as a result of maltreatment■ Chapter 5, Perpetrators—perpetrators of maltreatment■ Chapter 6, Services—services to prevent maltreatment <strong>and</strong> to assist victims <strong>and</strong> nonvictims■ Chapter 7, Additional Research Related to <strong>Child</strong> <strong>Maltreatment</strong>—research activities that useNCANDS dataCommentary <strong>for</strong> State data <strong>and</strong> contact in<strong>for</strong>mation <strong>for</strong> State representatives are presented inappendix D. The commentary section of this report provides valuable insights into policies <strong>and</strong>conditions that might affect State data. Additional in<strong>for</strong>mation about specific State policies orpractices can be obtained from the State contact listed in the commentary section. A readerfeedback <strong>for</strong>m is included to solicit advice <strong>for</strong> future reports (appendix E).4<strong>Child</strong> <strong>Maltreatment</strong> <strong>2006</strong>
ReportsCHAPTER 2<strong>Child</strong> protective services (CPS) agencies have established two stages <strong>for</strong> responding to childabuse <strong>and</strong> neglect allegations. The first is the receipt of a referral from a professional or anotherperson in the community. A referral is the initial notification to CPS alleging abuse or neglectof one or more children. Agency hotline or intake units screen out some referrals as not beingappropriate <strong>for</strong> further investigation or assessment. The second stage is the investigation orassessment of the screened-in referral, which is called a report.When an allegation reaches the second stage <strong>and</strong> is considered a report, the agency eitherinitiates an investigation or pursues an alternative response. The purpose of an investigationis to determine if the child was maltreated—or is at risk of maltreatment—<strong>and</strong> to establish theappropriate intervention. Alternative responses emphasize an assessment of the family’s needs<strong>and</strong> the prevention of future maltreatment, rather than making a <strong>for</strong>mal determination ofmaltreatment. 1 Regardless of which type of response the agency uses <strong>for</strong> a specific report, it mustdecide if further action is necessary to protect the child. During Federal fiscal year (FFY) <strong>2006</strong>:■ Approximately 3.3 million allegations of child abuse <strong>and</strong> neglect including 6.0 millionchildren were made to CPS agencies.■ About 62 percent (61.7%) of those allegations reached the report stage <strong>and</strong> either wereinvestigated or received an alternative response.■ Nearly 30 percent (28.6%) of the investigations that reached the report stage determined thatat least one child was a victim of child abuse or neglect.This chapter presents statistics regarding referrals, reports, <strong>and</strong> investigations or assessments.National estimates <strong>for</strong> FFY <strong>2006</strong> are based on the child populations <strong>for</strong> the 50 States, the Districtof Columbia, <strong>and</strong> Puerto Rico.Screening of ReferralsThe process of determining whether a referral meets a State’s st<strong>and</strong>ard <strong>for</strong> an investigation orassessment is known as screening. Screening in a referral means that an allegation of child abuseor neglect met the State’s st<strong>and</strong>ard <strong>for</strong> investigation or assessment <strong>and</strong> the referral reaches thesecond stage <strong>and</strong> is called a report. Screening out a referral means that the allegation did notmeet the State’s st<strong>and</strong>ard <strong>for</strong> an investigation or assessment. Reasons <strong>for</strong> screening out a referralmay include the following: The referral did not concern child abuse or neglect; it did not contain1Shusterman, G. R., Fluke, J.D., Hollinshead, D.M., & Yuan, Y.T. (2005). Alternative responses to child maltreatment: Findings from NCANDS. (Protecting <strong>Child</strong>ren Vol. 20, No. 2 & 3). American Humane Association. CHAPTER 2: Reports 5
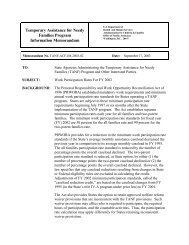
enough in<strong>for</strong>mation to enable an investigation or assessment to occur; the children in thereferral were the responsibility of another agency or jurisdiction, e.g., a military installation or atribe; or the alleged victim was older than 18 years.During FFY <strong>2006</strong>, an estimated 3.3 million referrals, including approximately 6.0 millionchildren, were made to CPS agencies. The national rate was 43.7 referrals per 1,000 children <strong>for</strong>FFY <strong>2006</strong> compared with 43.9 referrals per 1,000 children <strong>for</strong> FFY 2005. 2, 3During FFY <strong>2006</strong>, CPS agencies screened in 61.7 percent of referrals <strong>and</strong> screened out 38.3percent. These results were similar to FFY 2005 data, which indicated 62.1 percent were screenedin <strong>and</strong> 37.9 percent were screened out.Report SourcesNCANDS collects case-level in<strong>for</strong>mation <strong>for</strong> all reports that received a disposition or findingwithin the year. The in<strong>for</strong>mation includes the report source, the number of children in theinvestigation, <strong>and</strong> the disposition of the report.Professionals submitted more than one-half (56.3%) of the reports (figure 2–1). The term professionalindicates that the person encountered the alleged victim as part of the report source’soccupation. State laws require most professionals to notify CPS agencies of suspected maltreatment.The categories of professionals include teachers, legal staff or police offcers, social servicesstaff, medical staff, mental health workers, child daycare workers, <strong>and</strong> foster care providers. Thethree largest percentages of <strong>2006</strong> reports were from professionals—teachers (16.5%), lawyers orpolice offcers (15.8%) <strong>and</strong> social services staff (10.0%). 4Nonprofessional sources submitted the remaining 43.7 percent of reports. These includedparents, relatives, friends <strong>and</strong> neighbors, alleged victims, alleged perpetrators, anonymouscallers, <strong>and</strong> “other” sources. The National <strong>Child</strong> Abuse <strong>and</strong> Neglect Data System (NCANDS)uses the term “other” sources <strong>for</strong> those categories that States are not able to crosswalk to anyof the NCANDS terms. “Other” sources may include clergy members, sports coaches, campcounselors, byst<strong>and</strong>ers, volunteers, <strong>and</strong> foster siblings. The three largest groups of nonprofessionalreporters were anonymous (8.2%), “other” (8.0%) <strong>and</strong> other relatives (7.8%).Investigation or Assessment ResultsCPS agencies assign a finding—also called a disposition—to a report after the circumstances areinvestigated <strong>and</strong> a determination is made as to whether the maltreatment occurred or the childis at risk of maltreatment. For FFY <strong>2006</strong>, 1,907, 264 investigations received a disposition. Each2 Supporting data are provided in table 2–1, which is located at the end of this chapter. States provide aggregated data <strong>for</strong>the number of referrals. Based on data from 42 States, the national rate of referrals is 43.7 referrals per 1,000 children.A referral can include more than one child. Multiplying this rate by the national child population of 74,754,213 <strong>and</strong>dividing by 1,000 results in an estimated 3,266,759 referrals <strong>for</strong> FFY <strong>2006</strong>. The estimate was then rounded to 3,300,000.Unless otherwise specified, all rates refer to children younger than 18 years in the national population.3 The number of children included in all referrals was calculated by multiplying the average number of children includedin a referral (1.84) by the number of estimated referrals (3,266,759). This results in an estimated 6,010,836 children,which was rounded to the nearest 100,000. The average number of children included in a referral based on data from51 States was calculated by dividing the number of children reported (3,511,590) by number of screened-in referrals(1,907,264).4 See table 2–2.6<strong>Child</strong> <strong>Maltreatment</strong> <strong>2006</strong>
Figure 2–1 Report Sources, <strong>2006</strong>SOURCE ■ Professional Sources ■ Nonprofessional SourcesEducational Personnel16.5Legal, Law En<strong>for</strong>cement,Criminal Justice PersonnelSocial Services Personnel10.015.8Medical Personnel8.4Mental Health Personnel4.1<strong>Child</strong> Daycare Provider(s)Foster Care Providers0.60.9Anonymous Source(s)OtherOther Relative(s)Unknown or Missing8.28.07.87.8Parent(s)6.0Friend(s) or Neighbor(s)5.3Alleged Victim(s)0.6Alleged Perpetrator(s)0.1Based on data from table 2–2.0% 5% 10% 15% 20%PERCENTAGEState establishes dispositions by policy <strong>and</strong> law. 5 The major NCANDS disposition categories aredescribed below.■ Alternative Response Nonvictim: A conclusion that the child was not identified as a victimwhen a response other than an investigation was provided.■ Alternative Response Victim: A conclusion that the child was identified as a victim when aresponse other than an investigation was provided.■ Indicated: An investigation disposition that concludes that maltreatment could not besubstantiated under State law or policy, but there was reason to suspect that the child mayhave been maltreated or was at risk of maltreatment. This is applicable only to States thatdistinguish between substantiated <strong>and</strong> indicated dispositions.■ Substantiated: An investigation disposition that concludes that the allegation of maltreatmentor risk of maltreatment was supported or founded by State law or State policy.■ Unsubstantiated: An investigation disposition that determines that there was not suffcientevidence under State law to conclude or suspect that the child was maltreated or at risk ofbeing maltreated.Two alternative response categories are provided in NCANDS. The category that is mostcommonly used by States is alternative response nonvictim. Some States also use the alternativeresponse victim category. During FFY <strong>2006</strong>, 12 States used the alternative response nonvictimcategory <strong>and</strong> 2 States used the alternative response victim category.5 During the preparation of the NCANDS data file, each State establishes a crosswalk between its disposition terms <strong>and</strong>the categories used by NCANDS.CHAPTER 2: Reports 7
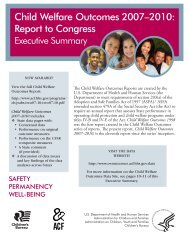
Figure 2–2 Investigation Dispositions, <strong>2006</strong>IntentionallyFalse0.1%Closed WithNo Finding1.7%Unsubstantiated60.4%Based on data from table 2–3.Other3.2%Unknownor Missing0.1%Substantiated25.2%Indicated3.0%AlternativeResponse Victim0.4%AlternativeResponse Nonvictim5.9%.1For nearly 30 percent of investigations, at leastone child was found to be a victim of maltreatmentwith one of the following dispositions—substantiated (25.2%), indicated (3.0%), oralternative .1response victim (0.4%) (figure 2–2).The remaining investigations led to a findingthat children were not victims of maltreatment<strong>and</strong> the report received one of the followingdispositions—unsubstantiated (60.4%), alternativeresponse nonvictim (5.9%), “other” (3.2%),<strong>and</strong> closed with no finding (1.7%) or intentionallyfalse (0.1%). 6 When the 2002 investigationrates were compared to the FFY <strong>2006</strong> rates <strong>for</strong>each State, it was noted that by FFY <strong>2006</strong>, themajority of States had increased their investigationrates. 7 Two States were unable to submit thedata needed <strong>for</strong> this analysis.Report Dispositions by Report SourceReport dispositions are based on the facts of the report as found by the CPS worker. The type ofreport source may be related to the disposition of a report because of the reporter’s knowledge<strong>and</strong> credibility (figure 2–3). Case-level data submitted to NCANDS were used to examine thishypothesis. 8 Based on more than 1.8 million reports, key findings are listed below.Approximately two-thirds of substantiated or indicated reports were made by professionalsources. Approximately 30 percent of substantiated <strong>and</strong> indicated reports were made by legalstaff <strong>and</strong> police offcers.Nonprofessional report sources accounted <strong>for</strong> more than one-half of several categories of reportdisposition, indicating that children were not found to be victims of maltreatment. Thoseincluded alternative response nonvictim (58.8%), intentionally false (76.1%), or closed with nofinding (54.5%).Response Time from Report to InvestigationMost States set requirements <strong>for</strong> beginning an investigation into a report of child abuse orneglect. While some States have a single timeframe <strong>for</strong> responding to reports, many Statesestablish priorities based on the in<strong>for</strong>mation received from the report source. Of the States thatestablish priorities, many specify a high-priority response as within 1 hour or within 24 hours.Lower priority responses range from 24 hours to 14 days. 96 See table 2–3. “Other” dispositions include those categories that States were not able to crosswalk to NCANDS dispositions.7 See table 2–4.8 See table 2–5.9 U.S. Department of Health <strong>and</strong> Human Services. <strong>Administration</strong> <strong>for</strong> <strong>Child</strong>ren <strong>and</strong> <strong>Families</strong>/<strong>Child</strong>ren’s Bureau <strong>and</strong> Offce of the Assistant Secretary <strong>for</strong> Planning <strong>and</strong> Evaluation. National Study of <strong>Child</strong> Protective Services Systems<strong>and</strong> Re<strong>for</strong>m Ef<strong>for</strong>ts: Review of State CPS Policy. (Washington, DC: U.S. Government Printing Offce, 2005). Thisdocument is also available at http://aspe.hhs.gov/hsp/cps-status03.8 <strong>Child</strong> <strong>Maltreatment</strong> <strong>2006</strong>
Figure 2–3 Dispositions by Professional <strong>and</strong> Nonprofessional Report Sources, <strong>2006</strong>PERCENTAGE■ Professionals ■ Nonprofessionals90%80%70%60%50%40%30%20%69.130.965.234.853.546.541.258.852.947.123.976.145.554.557.959.442.1 40.6NonprofeProfessio10%0%SubstantiatedIndicatedAlternativeResponseVictimAlternativeResponseNonvictimUnsubstantiatedIntentionallyFalseClosed WithNo FindingOtherUnknownDISPOSITIONSBased on data from table 2–5.Because CPS agencies receive reports of varying degrees of urgency, average response timesreflect the types of reports that are received, as well as the ability of workers to meet the timest<strong>and</strong>ards. The median response time from report to investigation was 66 hours or approximately2–3 days. The average response time <strong>for</strong> these States was 86 hours or approximately 4days. 10 This is comparable to a median response time of 67 hours <strong>and</strong> an average response timeof 89 hours <strong>for</strong> FFY 2005.CPS Work<strong>for</strong>ce <strong>and</strong> WorkloadGiven the large number <strong>and</strong> complexity of investigations <strong>and</strong> assessments that are conductedeach year, there is an ongoing interest in the nature of the work<strong>for</strong>ce that per<strong>for</strong>ms CPS functions.In most agencies, the screening <strong>and</strong> investigation are conducted by different groups ofworkers. In many rural <strong>and</strong> smaller agencies, one worker may per<strong>for</strong>m both those functions,<strong>and</strong> other functions not mentioned here.States that reported significant numbers of specialized workers <strong>for</strong> intake, screening, investigation,<strong>and</strong> assessment were used to estimate the average number of cases that were h<strong>and</strong>led byCPS workers. 11 The average number of completed investigations per investigation worker was 62per year. (This compares with 67.5 in FFY 2005.) It is important to note that these calculationsdid not consider other activities of these workers <strong>and</strong> that some workers conducted more thanone function. Also, each investigation could include more than one child. A more accuratecalculation of workload would require a systematic estimation of work <strong>for</strong> a specific timeframe. 1210 See table 2–6. This table uses data from the Agency File.11 See table 2–7. The number of screening <strong>and</strong> intake workers (2,237) <strong>and</strong> the number of investigation workers (16,757) werereported by 33 States.12 A workload study in Cali<strong>for</strong>nia estimated that an average monthly caseload <strong>for</strong> workers who exclusively conductedCPS Emergency Response investigations <strong>and</strong> no other services was 16.15 investigations per worker per month orapproximately 194 per year. Each investigation could include more than one child. American Humane Association,2000, SB 2030 <strong>Child</strong> Welfare Services Workload Study Report (Sacramento: Cali<strong>for</strong>nia Department of SocialServices).CHAPTER 2: Reports 9
Tables <strong>and</strong> NotesThe following pages contain the tables referenced in Chapter 2. Unless otherwise explained,a blank indicates that the State did not submit usable data. Specific in<strong>for</strong>mation about Statesubmissions can be found in appendix D. Additional in<strong>for</strong>mation regarding methodologies thatwere used to create the tables is provided below.Table 2–1■ For those States that submitted the <strong>Child</strong> File, the screened-in number is the sum of thereports by disposition. For Summary Data Component (SDC) States, the number is takendirectly from the State’s report <strong>for</strong>m.■ The national referral rate, 43.7 referrals per 1,000 children in the population, was calculatedfrom the total number of referrals <strong>and</strong> the child population in the 42 States reporting bothscreened-in <strong>and</strong> screened-out referrals. Screened-out referral data were from the Agency File.Table 2–6■ Data were reported by States in the Agency File.■ The PART target is a 5 percent decrease in the average response time across all reportingStates each year. The baseline is from 2003, which had a median of 67 hours.■ States use different criteria to indicate the start of an investigation. Some States use the datethe report was approved <strong>for</strong> investigation, while others use the date of attempted contactwith the victim. According to the <strong>Child</strong>ren’s Bureau, States are encouraged to use the date ofsuccessful contact with the victim.Table 2–7■ Only States that were able to report work<strong>for</strong>ce data by screening <strong>and</strong> intake workers <strong>and</strong>investigation workers <strong>and</strong> that provided data <strong>for</strong> screened-in referrals were included incalculations <strong>for</strong> screened-in referrals per investigation worker.■ The average number of screened-in investigations per investigation worker is based on dividingthe total number of investigations by the total number of investigation <strong>and</strong> assessmentworkers <strong>for</strong> the 33 States that submitted these data.10 <strong>Child</strong> <strong>Maltreatment</strong> <strong>2006</strong>
Table 2–1 Screened-In <strong>and</strong> Screened-Out Referrals, <strong>2006</strong>STATECHILDPOPULATIONSCREENED-INREFERRALSSCREENED-OUTREFERRALSTOTAL REFERRALSNUMBER % NUMBER % NUMBER RATEAlabama 1,114,301 18,651 61.0 11,923 39.0 30,574 27.4Alaska 181,434 5,755 57.3 4,283 42.7 10,038 55.3Arizona 1,628,198 33,743 98.9 359 1.1 34,102 20.9Arkansas 691,186 25,524 66.0 13,163 34.0 38,687 56.0Cali<strong>for</strong>nia 9,532,614 225,911 67.1 110,684 32.9 336,595 35.3Colorado 1,169,301 30,940 48.1 33,437 51.9 64,377 55.1Connecticut 818,286 28,500 64.3 15,798 35.7 44,298 54.1Delaware 203,366 5,781 80.1 1,434 19.9 7,215 35.5District of Columbia 114,881 5,077 90.0 567 10.0 5,644 49.1Florida 4,021,555 151,822 59.4 103,957 40.6 255,779 63.6Georgia 2,455,020 60,277 80.1 14,938 19.9 75,215 30.6HawaiiIdaho 394,280 6,662 43.5 8,639 56.5 15,301 38.8IllinoisIndiana 1,577,629 44,051 65.5 23,239 34.5 67,290 42.7Iowa 710,194 25,029 59.0 17,428 41.0 42,457 59.8Kansas 695,837 15,164 49.9 15,206 50.1 30,370 43.6Kentucky 999,531 48,649 76.0 15,404 24.0 64,053 64.1LouisianaMaine 280,994 5,949 32.3 12,485 67.7 18,434 65.6Maryl<strong>and</strong>Massachusetts 1,448,884 38,918 59.7 26,274 40.3 65,192 45.0MichiganMinnesota 1,257,264 19,846 34.9 36,956 65.1 56,802 45.2Mississippi 759,405 16,888 71.5 6,733 28.5 23,621 31.1Missouri 1,416,592 47,491 51.0 45,563 49.0 93,054 65.7Montana 217,848 8,737 69.2 3,883 30.8 12,620 57.9Nebraska 445,033 13,109 53.3 11,507 46.7 24,616 55.3Nevada 634,520 14,982 73.7 5,339 26.3 20,321 32.0New Hampshire 297,625 6,640 41.5 9,359 58.5 15,999 53.8New JerseyNew Mexico 508,930 16,565 52.7 14,888 47.3 31,453 61.8New YorkNorth CarolinaNorth Dakota 144,934 3,791 50.2 3,763 49.8 7,554 52.1OhioOklahoma 894,034 36,673 57.5 27,092 42.5 63,765 71.3Oregon 856,259 25,598 42.1 35,140 57.9 60,738 70.9PennsylvaniaPuerto Rico 1,018,651 13,797 48.0 14,964 52.0 28,761 28.2Rhode Isl<strong>and</strong> 237,451 8,441 66.3 4,298 33.7 12,739 53.6South Carolina 1,039,653 16,712 67.2 8,143 32.8 24,855 23.9South Dakota 194,681 3,908 27.4 10,352 72.6 14,260 73.2Tennessee 1,442,593 61,886 67.5 29,734 32.5 91,620 63.5Texas 6,493,965 166,728 82.9 34,382 17.1 201,110 31.0Utah 791,198 20,206 65.3 10,734 34.7 30,940 39.1Vermont 133,389 2,315 18.9 9,916 81.1 12,231 91.7Virginia 1,806,847 29,141 51.7 27,219 48.3 56,360 31.2Washington 1,526,267 35,698 46.8 40,578 53.2 76,276 50.0West Virginia 389,071 23,210 46.6 26,575 53.4 49,785 128.0Wisconsin 1,312,530 29,029 57.2 21,751 42.8 50,780 38.7Wyoming 121,794 2,437 46.2 2,842 53.8 5,279 43.3Total 51,978,025 1,400,231 870,929 2,271,160Percent 61.7 38.3Weighted Rate 43.7Number Reporting 42 42 42 42 42 42 42CHAPTER 2: Reports11
Table 2–2 Report Sources, <strong>2006</strong> (continues on page 14)STATEEDUCATIONALPERSONNELLEGAL, LAWENFORCEMENT,CRIMINAL JUSTICEPERSONNELSOCIAL SERVICESPERSONNELMEDICAL PERSONNELNUMBER % NUMBER % NUMBER % NUMBER %Alabama 2,839 15.2 3,972 21.3 1,972 10.6 1,679 9.0AlaskaArizona 7,156 21.2 5,876 17.4 2,167 6.4 4,173 12.4Arkansas 3,552 13.9 2,664 10.4 2,019 7.9 1,859 7.3Cali<strong>for</strong>nia 40,875 18.1 33,739 14.9 14,692 6.5 15,376 6.8Colorado 5,782 18.7 7,059 22.8 2,050 6.6 3,162 10.2Connecticut 6,637 23.3 6,204 21.8 2,126 7.5 2,947 10.3Delaware 1,093 18.9 1,615 27.9 246 4.3 519 9.0District of Columbia 911 17.9 790 15.6 1,327 26.1 241 4.7Florida 21,240 14.0 37,904 25.0 14,860 9.8 11,685 7.7Georgia 15,001 24.9 10,192 16.9 5,016 8.3 5,580 9.3Hawaii 340 14.9 531 23.2 253 11.1 502 22.0Idaho 1,177 17.7 1,406 21.1 242 3.6 664 10.0Illinois 12,972 19.5 13,029 19.6 8,661 13.0 8,595 12.9Indiana 8,118 18.4 8,491 19.3 2,814 6.4 4,817 10.9Iowa 3,449 13.8 4,111 16.4 3,832 15.3 1,634 6.5Kansas 3,394 22.4 1,575 10.4 2,283 15.1 1,049 6.9Kentucky 3,675 7.6 3,777 7.8 1,496 3.1 1,327 2.7Louisiana 4,237 16.6 3,453 13.5 2,180 8.5 2,741 10.7Maine 942 15.8 810 13.6 755 12.7 572 9.6Maryl<strong>and</strong>Massachusetts 4,139 10.6 7,802 20.0 2,094 5.4 3,809 9.8Michigan 11,547 16.5 10,144 14.5 8,728 12.5 8,040 11.5Minnesota 4,404 22.2 5,232 26.4 2,198 11.1 1,728 8.7Mississippi 3,090 18.3 2,292 13.6 488 2.9 1,925 11.4Missouri 6,993 14.7 6,135 12.9 5,812 12.2 3,345 7.0Montana 1,055 12.1 1,515 17.3 1,520 17.4 511 5.8Nebraska 1,715 13.1 2,730 20.8 1,216 9.3 1,156 8.8Nevada 3,191 21.3 3,320 22.2 1,222 8.2 1,512 10.1New Hampshire 1,229 18.5 1,189 17.9 482 7.3 773 11.6New Jersey 7,207 25.6 4,614 16.4 1,784 6.3 3,858 13.7New Mexico 2,982 18.0 2,617 15.8 933 5.6 1,317 8.0New York 28,310 18.8 17,374 11.5 28,774 19.1 9,781 6.5North Carolina 2,297 3.4 2,940 4.4 2,630 3.9 1,766 2.6North Dakota 148 3.9 237 6.3 93 2.5 68 1.8Ohio 9,733 13.3 13,340 18.2 12,570 17.2 3,561 4.9Oklahoma 4,051 11.0 4,494 12.3 6,205 16.9 3,073 8.4Oregon 710 2.8 2,886 11.3 1,177 4.6 991 3.9Pennsylvania 5,775 25.0 1,691 7.3 2,783 12.1 3,152 13.7Puerto Rico 2,090 15.1 1,732 12.6 528 3.8 978 7.1Rhode Isl<strong>and</strong> 1,901 22.5 1,188 14.1 1,074 12.7 1,127 13.4South Carolina 3,390 20.3 2,879 17.2 1,685 10.1 2,159 12.9South Dakota 712 18.2 999 25.6 110 2.8 278 7.1Tennessee 9,054 14.6 9,225 14.9 9,956 16.1 5,222 8.4Texas 30,117 18.1 23,287 14.0 8,007 4.8 20,595 12.4Utah 2,052 10.2 5,897 29.2 2,254 11.2 1,083 5.4Vermont 519 22.4 396 17.1 206 8.9 214 9.2Virginia 6,671 22.9 5,049 17.3 1,708 5.9 2,234 7.7Washington 6,295 17.6 4,451 12.5 6,696 18.8 3,071 8.6West Virginia 3,096 13.3 1,478 6.4 3,197 13.8 1,194 5.1Wisconsin 4,786 16.5 5,303 18.3 4,653 16.0 1,716 5.9Wyoming 459 18.8 518 21.3 206 8.5 132 5.4Total 313,108 300,152 189,980 159,491Percent 16.5 15.8 10.0 8.4Number Reporting 50 50 50 50 50 50 50 5012 <strong>Child</strong> <strong>Maltreatment</strong> <strong>2006</strong>
STATEMENTAL HEALTHPERSONNELCHILD DAYCAREPROVIDER(S)FOSTER CAREPROVIDERSANONYMOUSSOURCE(S)NUMBER % NUMBER % NUMBER % NUMBER %Alabama 613 3.3 165 0.9 59 0.3 1,270 6.8AlaskaArizona 1,483 4.4 493 1.5 3,067 9.1Arkansas 1,948 7.6 323 1.3 3,398 13.3Cali<strong>for</strong>nia 22,479 10.0 1,021 0.5 312 0.1 23,856 10.6Colorado 1,919 6.2 427 1.4 561 1.8 1,105 3.6Connecticut 1,939 6.8 369 1.3 261 0.9 3,499 12.3Delaware 169 2.9 80 1.4 14 0.2 484 8.4District of Columbia 189 3.7 47 0.9 56 1.1 433 8.5Florida 4,443 2.9 1,353 0.9 10,480 6.9Georgia 3,719 6.2 536 0.9 4,207 7.0Hawaii 38 1.7 3 0.1 9 0.4 70 3.1Idaho 51 0.8 107 1.6 33 0.5 216 3.2Illinois 967 1.5 197 0.3 594 0.9 7,025 10.6Indiana 1,780 4.0 470 1.1 374 0.8 4,340 9.9Iowa 738 2.9 368 1.5 384 1.5Kansas 131 0.9 168 1.1 436 2.9 2,133 14.1Kentucky 959 2.0 186 0.4 5,780 11.9Louisiana 629 2.5 116 0.5 70 0.3 1,822 7.1Maine 551 9.3 74 1.2 11 0.2 470 7.9Maryl<strong>and</strong>Massachusetts 332 0.9 120 0.3 3,671 9.4Michigan 792 1.1 366 0.5 7,101 10.1Minnesota 726 3.7 219 1.1 383 1.9 558 2.8Mississippi 572 3.4 113 0.7 87 0.5 2,587 15.3Missouri 2,711 5.7 557 1.2 157 0.3Montana 318 3.6 99 1.1 72 0.8 337 3.9Nebraska 644 4.9 226 1.7 97 0.7 607 4.6Nevada 403 2.7 180 1.2 22 0.1 1,672 11.2New Hampshire 383 5.8 79 1.2 34 0.5New Jersey 618 2.2 2,403 8.5New Mexico 522 3.2 50 0.3 40 0.2 4,501 27.2New York 5,150 3.4 394 0.3 2,073 1.4 20,084 13.3North Carolina 196 0.3 1,307 1.9North Dakota 12 0.3 12 0.3 4 0.1 11 0.3Ohio 2,709 3.7 790 1.1 441 0.6 7,443 10.2Oklahoma 2,008 5.5 751 2.0 171 0.5 817 2.2Oregon 44 0.2 66 0.3 61 0.2 185 0.7Pennsylvania 1,335 5.8 431 1.9 1,454 6.3 1,163 5.0Puerto Rico 31 0.2 22 0.2 4 0.0 4,655 33.7Rhode Isl<strong>and</strong> 193 2.3 159 1.9 889 10.5South Carolina 386 2.3 129 0.8 100 0.6 1,743 10.4South Dakota 170 4.4 75 1.9 17 0.4 341 8.7Tennessee 2,055 3.3 841 1.4 420 0.7Texas 5,036 3.0 1,784 1.1 195 0.1 9,286 5.6Utah 643 3.2 212 1.0 197 1.0Vermont 219 9.5 81 3.5 28 1.2 88 3.8Virginia 1,660 5.7 367 1.3 36 0.1 3,601 12.4Washington 2,114 5.9 1,051 2.9 314 0.9 759 2.1West Virginia 114 0.5 128 0.6 117 0.5 5,410 23.3Wisconsin 1,570 5.4 391 1.3 65 0.2 1,072 3.7Wyoming 135 5.5 50 2.1 156 6.4Total 77,400 16,418 10,737 156,102Percent 4.1 0.9 0.6 8.2Number Reporting 47 47 47 47 43 43 45 45CHAPTER 2: Reports13
Table 2–2 Report Sources, <strong>2006</strong> (continued from page 13)STATEOTHER OTHER RELATIVE(S) PARENT(S)FRIEND(S) ORNEIGHBOR(S)NUMBER % NUMBER % NUMBER % NUMBER %Alabama 1,068 5.7 2,046 11.0 1,692 9.1 1,022 5.5AlaskaArizona 1,794 5.3 2,724 8.1 2,342 6.9 2,124 6.3Arkansas 2,899 11.4 2,778 10.9 2,155 8.4 1,760 6.9Cali<strong>for</strong>nia 33,492 14.8 14,442 6.4 6,212 2.7Colorado 2,655 8.6 2,753 8.9 1,599 5.2 1,647 5.3Connecticut 1,157 4.1 1,033 3.6 1,568 5.5 298 1.0Delaware 506 8.8 386 6.7 431 7.5 159 2.8District of Columbia 207 4.1 309 6.1 303 6.0 224 4.4Florida 11,481 7.6 12,963 8.5 12,846 8.5 8,913 5.9Georgia 1,437 2.4 5,296 8.8 4,458 7.4 3,722 6.2Hawaii 66 2.9 142 6.2 59 2.6 78 3.4Idaho 740 11.1 489 7.3 552 8.3 842 12.6Illinois 2,159 3.2 4,253 6.4 4,766 7.2 2,543 3.8Indiana 1,999 4.5 3,337 7.6 4,416 10.0 2,739 6.2Iowa 6,261 25.0Kansas 767 5.1 976 6.4 1,480 9.8 720 4.7Kentucky 7,309 15.0 3,782 7.8 4,011 8.2 7,723 15.9Louisiana 2,211 8.7 3,462 13.6 2,418 9.5 2,031 8.0Maine 429 7.2 610 10.3 346 5.8 342 5.7Maryl<strong>and</strong>Massachusetts 2,869 7.4 812 2.1 902 2.3Michigan 6,142 8.8 5,898 8.4 6,260 8.9 4,220 6.0Minnesota 1,028 5.2 1,047 5.3 1,164 5.9 1,030 5.2Mississippi 558 3.3 2,168 12.8 1,691 10.0 1,115 6.6Missouri 1,190 2.5Montana 1,192 13.6 720 8.2 688 7.9 654 7.5Nebraska 546 4.2 1,162 8.9 60 .5 1,346 10.3Nevada 381 2.5 1,115 7.4 1,066 7.1 817 5.5New Hampshire 735 11.1 479 7.2 443 6.7 787 11.9New Jersey 2,854 10.1 1,360 4.8 2,396 8.5 706 2.5New Mexico 1,424 8.6 1,111 6.7 787 4.8 173 1.0New York 14,454 9.6 8,096 5.4 10,779 7.1 5,527 3.7North Carolina 2,011 3.0 898 1.3 1,414 2.1North Dakota 37 1.0 55 1.5 39 1.0 30 0.8Ohio 6,405 8.8 10,997 15.0 4,716 6.4Oklahoma 4,833 13.2 5,343 14.6 2,373 6.5 2,039 5.6Oregon 1,075 4.2 389 1.5 155 .6 257 1.0Pennsylvania 1,340 5.8 936 4.1 1,909 8.3 604 2.6Puerto Rico 519 3.8 881 6.4 1,336 9.7 649 4.7Rhode Isl<strong>and</strong> 182 2.2 502 5.9 603 7.1 477 5.7South Carolina 570 3.4 1,685 10.1 1,051 6.3 814 4.9South Dakota 623 15.9 298 7.6 191 4.9 85 2.2Tennessee 798 1.3 6,935 11.2 6,061 9.8 9,616 15.5Texas 15,922 9.5 19,002 11.4 17,532 10.5 11,768 7.1Utah 938 4.6 2,935 14.5 1,148 5.7 1,383 6.8Vermont 100 4.3 140 6.0 200 8.6 61 2.6Virginia 1,745 6.0 2,379 8.2 2,123 7.3 1,163 4.0Washington 1,668 4.7 3,041 8.5 2,673 7.5 3,300 9.2West Virginia 2,183 9.4 2,276 9.8 2,472 10.7 1,249 5.4Wisconsin 1,814 6.2 1,838 6.3 2,044 7.0 1,231 4.2Wyoming 128 5.3 192 7.9 256 10.5 186 7.6Total 152,890 147,584 114,742 100,516Percent 8.0 7.8 6.0 5.3Number Reporting 49 49 48 48 46 46 47 4714 <strong>Child</strong> <strong>Maltreatment</strong> <strong>2006</strong>
STATEUNKNOWN ORMISSINGALLEGED VICTIM(S)ALLEGEDPERPETRATOR(S)TOTAL REPORTSNUMBER % NUMBER % NUMBER % NUMBER %Alabama 6 0.0 230 1.2 18 0.1 18,651 100.0AlaskaArizona 66 0.2 278 0.8 33,743 100.0Arkansas 163 0.6 6 0.0 25,524 100.0Cali<strong>for</strong>nia 18,624 8.2 791 0.4 225,911 100.0Colorado 219 0.7 2 0.0 30,940 100.0Connecticut 312 1.1 132 0.5 18 0.1 28,500 100.0Delaware 42 0.7 37 0.6 5,781 100.0District of Columbia 33 0.6 7 0.1 5,077 100.0Florida 2,127 1.4 1,527 1.0 151,822 100.0Georgia 891 1.5 178 0.3 44 0.1 60,277 100.0Hawaii 191 8.4 3 0.1 2,285 100.0Idaho 83 1.2 60 0.9 6,662 100.0Illinois 413 0.6 231 0.3 90 0.1 66,495 100.0Indiana 263 0.6 93 0.2 44,051 100.0Iowa 4,207 16.8 45 0.2 25,029 100.0Kansas 5 0.0 47 0.3 15,164 100.0Kentucky 8,244 16.9 380 0.8 48,649 100.0Louisiana 138 0.5 28 0.1 25,536 100.0Maine 6 0.1 31 0.5 5,949 100.0Maryl<strong>and</strong>Massachusetts 12,065 31.0 98 0.3 205 0.5 38,918 100.0Michigan 509 0.7 289 0.4 70,036 100.0Minnesota 114 0.6 15 0.1 19,846 100.0Mississippi 15 0.1 187 1.1 16,888 100.0Missouri 20,591 43.4 47,491 100.0Montana 50 0.6 6 0.1 8,737 100.0Nebraska 579 4.4 1,016 7.8 9 0.1 13,109 100.0Nevada 77 0.5 4 0.0 14,982 100.0New Hampshire 13 0.2 14 0.2 6,640 100.0New Jersey 334 1.2 28,134 100.0New Mexico 9 0.1 38 0.2 61 0.4 16,565 100.0New York 150,796 100.0North Carolina 51,977 77.0 88 0.1 67,524 100.0North Dakota 3,045 80.3 3,791 100.0Ohio 451 0.6 73,156 100.0Oklahoma 253 0.7 225 0.6 37 0.1 36,673 100.0Oregon 17,589 68.7 13 0.1 25,598 100.0Pennsylvania 468 2.0 30 0.1 23,071 100.0Puerto Rico 76 0.6 287 2.1 9 0.1 13,797 100.0Rhode Isl<strong>and</strong> 81 1.0 65 0.8 8,441 100.0South Carolina 80 0.5 41 0.2 16,712 100.0South Dakota 7 0.2 2 0.1 3,908 100.0Tennessee 1,361 2.2 244 0.4 98 0.2 61,886 100.0Texas 3,694 2.2 503 0.3 166,728 100.0Utah 1,306 6.5 136 0.7 22 0.1 20,206 100.0Vermont 42 1.8 14 0.6 7 0.3 2,315 100.0Virginia 212 0.7 153 0.5 40 0.1 29,141 100.0Washington 257 0.7 8 0.0 35,698 100.0West Virginia 108 0.5 164 0.7 24 0.1 23,210 100.0Wisconsin 2,374 8.2 154 0.5 18 0.1 29,029 100.0Wyoming 17 0.7 2 0.1 2,437 100.0Total 148,997 10,845 2,547 1,901,509Percent 7.8 0.6 0.1 100.0Number Reporting 33 33 46 46 30 30 50 50CHAPTER 2: Reports15
Table 2–3 Investigation Dispositions, <strong>2006</strong>ALTERNATIVE ALTERNATIVERESPONSE RESPONSESTATE SUBSTANTIATED INDICATED VICTIM NONVICTIM UNSUBSTANTIATEDAlabama 6,650 10,935Alaska 2,142 3,250Arizona 3,018 101 30,624Arkansas 6,664 17,730Cali<strong>for</strong>nia 51,617 174,283Colorado 7,268 22,535Connecticut 7,175 21,325Delaware 1,280 3,914District of Columbia 1,717 3,069Florida 33,622 45,256 72,556Georgia 24,138 36,139Hawaii 1,145 1,140Idaho 1,056 5,606Illinois 15,644 50,385Indiana 14,789 28,410Iowa 9,410 15,619Kansas 1,864 13,300Kentucky 10,248 1,884 13,744 20,397Louisiana 7,543 276 16,264Maine 2,231 3,718Maryl<strong>and</strong>Massachusetts 22,111 16,807Michigan 16,104 53,932Minnesota 4,929 10,184 4,052Mississippi 4,279 12,609Missouri 5,155 27,295 13,669Montana 1,012 78 6,638Nebraska 3,620 9,208Nevada 3,067 225 11,690New Hampshire 622 5,576New Jersey 7,775 20,286 73New Mexico 3,792 12,773New York 48,583 102,213North Carolina 10,046 5,481 25,566 26,431North Dakota 746 3,045Ohio 16,989 11,090 43,403Oklahoma 7,480 6,297 19,782Oregon 8,009 11,002Pennsylvania 4,177 18,828Puerto Rico 7,611 5,763Rhode Isl<strong>and</strong> 2,761 5,556South Carolina 6,200 10,512South Dakota 915 2,692Tennessee 12,050 809 624 43,925Texas 42,142 93,471Utah 8,065 173 11,171Vermont 700 1,593Virginia 4,639 3,867Washington 4,905 7,323 13,499West Virginia 5,271 15,879Wisconsin 6,872 20,924Wyoming 484 1,354 599Total 480,332 57,334 7,365 113,347 1,152,381Percent 25.2 3.0 0.4 5.9 60.4Number Reporting 51 5 2 12 5116 <strong>Child</strong> <strong>Maltreatment</strong> <strong>2006</strong>
STATEINTENTIONALLYFALSECLOSED WITHNO FINDINGOTHERUNKNOWNOR MISSINGTOTALDISPOSITIONSAlabama 1,066 18,651Alaska 363 5,755Arizona 33,743Arkansas 1,129 1 25,524Cali<strong>for</strong>nia 11 225,911Colorado 1,137 30,940Connecticut 28,500Delaware 88 473 26 5,781District of Columbia 291 5,077Florida 139 249 151,822Georgia 60,277Hawaii 2,285Idaho 6,662Illinois 466 66,495Indiana 852 44,051Iowa 25,029Kansas 15,164Kentucky 1,551 825 48,649Louisiana 1,333 120 25,536Maine 5,949Maryl<strong>and</strong>Massachusetts 38,918Michigan 70,036Minnesota 25 656 19,846Mississippi 16,888Missouri 1,370 2 47,491Montana 765 244 8,737Nebraska 281 13,109Nevada 14,982New Hampshire 442 6,640New Jersey 28,134New Mexico 16,565New York 150,796North Carolina 67,524North Dakota 3,791Ohio 1,674 73,156Oklahoma 3,113 1 36,673Oregon 6,587 25,598Pennsylvania 66 23,071Puerto Rico 74 267 79 3 13,797Rhode Isl<strong>and</strong> 124 8,441South Carolina 16,712South Dakota 301 3,908Tennessee 4,348 130 61,886Texas 7,771 23,344 166,728Utah 17 780 20,206Vermont 19 3 2,315Virginia 89 20,546 29,141Washington 486 9,485 35,698West Virginia 2,033 27 23,210Wisconsin 1,232 1 29,029Wyoming 2,437Total 917 31,852 61,456 2,280 1,907,264Percent 0.1 1.7 3.2 0.1 100.0Number Reporting 8 24 14 7 51CHAPTER 2: Reports17
Table 2–4 Report Investigation Trends, 2002–<strong>2006</strong> (continues on page 20)2002 2003STATECHILDPOPULATIONTOTALINVESTIGATIONSINVESTIGATIONRATECHILDPOPULATIONTOTALINVESTIGATIONSINVESTIGATIONRATEAlabama 1,113,289 20,544 18.5 1,108,511 17,820 16.1Alaska 188,013 10,002 53.2 186,907 10,575 56.6Arizona 1,446,214 33,151 22.9 1,481,584 33,627 22.7Arkansas 677,364 18,697 27.6 676,912 19,680 29.1Cali<strong>for</strong>nia 9,411,596 260,924 27.7 9,476,210 244,694 25.8Colorado 1,136,499 27,889 24.5 1,141,412 29,362 25.7Connecticut 843,549 34,513 40.9 843,135 32,802 38.9Delaware 197,087 5,163 26.2 198,662 5,469 27.5District of Columbia 116,797 5,049 43.2 116,430 4,660 40.0Florida 3,775,071 142,547 37.8 3,824,062 156,848 41.0Georgia 2,271,043 69,108 30.4 2,310,562 71,501 30.9Hawaii 295,184 3,619 12.3 298,392 3,894 13.0Idaho 373,221 6,475 17.3 375,396 6,264 16.7Illinois 3,244,191 58,704 18.1 3,236,597 59,280 18.3Indiana 1,572,198 33,336 21.2 1,569,753 34,287 21.8Iowa 720,151 23,215 32.2 714,436 24,172 33.8Kansas 706,412 17,504 24.8 703,669 15,840 22.5Kentucky 991,995 41,218 41.6 992,383 45,348 45.7Louisiana 1,191,166 23,493 19.7 1,181,619 25,480 21.6Maine 295,375 4,474 15.1 292,440 5,143 17.6Maryl<strong>and</strong>Massachusetts 1,500,585 38,445 25.6 1,490,523 39,686 26.6Michigan 2,573,013 72,999 28.4 2,552,161 74,390 29.1Minnesota 1,280,544 17,770 13.9 1,271,464 17,587 13.8Mississippi 765,512 11,670 15.2 761,991 15,998 21.0Missouri 1,421,155 53,116 37.4 1,415,504 55,580 39.3Montana 223,209 10,336 46.3 221,073 9,023 40.8Nebraska 446,020 7,463 16.7 445,283 7,160 16.1Nevada 554,124 13,195 23.8 571,319 13,191 23.1New Hampshire 310,459 7,509 24.2 308,171 6,878 22.3New Jersey 2,107,273 39,148 18.6 2,113,185 42,762 20.2New Mexico 504,285 13,995 27.8 504,293 15,278 30.3New York 4,649,243 155,678 33.5 4,628,087 149,847 32.4North Carolina 2,030,623 63,747 31.4 2,055,521 59,583 29.0North Dakota 152,723 4,109 26.9 150,044 3,899 26.0Ohio 2,852,908 68,236 23.9 2,829,458 68,399 24.2Oklahoma 886,107 39,592 44.7 885,621 36,641 41.4Oregon 850,304 17,763 20.9 849,551 20,552 24.2Pennsylvania 2,878,052 24,330 8.5 2,858,851 23,601 8.3Puerto RicoRhode Isl<strong>and</strong> 248,334 7,211 29.0 247,632 7,012 28.3South Carolina 1,016,427 18,579 18.3 1,019,266 18,434 18.1South Dakota 198,015 8,411 42.5 196,300 5,534 28.2Tennessee 1,406,170 28,348 20.2 1,410,172 29,790 21.1Texas 6,081,582 129,956 21.4 6,162,780 133,827 21.7Utah 732,163 18,965 25.9 736,661 20,009 27.2Vermont 142,939 3,194 22.3 140,452 2,936 20.9Virginia 1,767,291 20,619 11.7 1,783,369 15,911 8.9Washington 1,519,294 18,423 12.1 1,517,018 30,222 19.9West Virginia 393,227 15,052 38.3 391,377 19,556 50.0Wisconsin 1,352,569 42,087 31.1 1,340,100 41,377 30.9Wyoming 124,851 2,403 19.2 123,151 2,381 19.3Total 71,535,416 1,811,974 71,709,450 1,833,790Rate 25.3 25.6Number Reporting 50 50 50 50 50 5018 <strong>Child</strong> <strong>Maltreatment</strong> <strong>2006</strong>
2004 2005STATECHILDPOPULATIONTOTALINVESTIGATIONSINVESTIGATIONRATECHILDPOPULATIONTOTALINVESTIGATIONSINVESTIGATIONRATEAlabama 1,106,522 19,118 17.3 1,107,079 18,318 16.5Alaska 182,990 4,273 23.4Arizona 1,522,131 35,623 23.4 1,574,856 37,088 23.6Arkansas 679,297 20,076 29.6 684,044 23,120 33.8Cali<strong>for</strong>nia 9,516,270 234,035 24.6 9,532,676 228,012 23.9Colorado 1,145,691 29,540 25.8 1,153,869 26,950 23.4Connecticut 838,707 32,097 38.3 830,770 30,030 36.1Delaware 200,003 5,276 26.4 202,195 5,799 28.7District of Columbia 116,631 4,977 42.7 116,098 4,958 42.7Florida 3,893,303 145,393 37.3 3,968,247 148,004 37.3Georgia 2,353,893 85,817 36.5 2,400,364 74,165 30.9Hawaii 297,856 3,608 12.1 298,637 2,733 9.2Idaho 379,401 6,502 17.1 386,653 6,499 16.8Illinois 3,233,171 64,784 20.0 3,225,149 66,305 20.6Indiana 1,569,727 35,817 22.8 1,573,346 37,860 24.1Iowa 711,234 24,366 34.3 709,859 24,536 34.6Kansas 699,975 15,729 22.5 696,417 14,146 20.3Kentucky 993,209 46,951 47.3 995,888 47,960 48.2Louisiana 1,174,289 23,843 20.3 1,167,629 26,901 23.0Maine 289,112 5,358 18.5 285,170 5,396 18.9Maryl<strong>and</strong>Massachusetts 1,476,886 38,940 26.4 1,463,169 38,669 26.4Michigan 2,533,054 74,333 29.3 2,509,307 65,174 26.0Minnesota 1,265,837 17,471 13.8 1,260,953 18,843 14.9Mississippi 761,628 15,801 20.7 762,072 15,745 20.7Missouri 1,413,662 54,216 38.4 1,414,887 55,217 39.0Montana 219,775 7,450 33.9 218,731 8,181 37.4Nebraska 445,141 10,962 24.6 445,087 15,501 34.8Nevada 593,717 13,424 22.6 613,756 14,532 23.7New Hampshire 304,909 6,400 21.0 301,727 6,583 21.8New Jersey 2,114,289 44,127 20.9 2,105,574 34,806 16.5New Mexico 504,848 16,445 32.6 506,377 20,225 39.9New York 4,600,581 148,244 32.2 4,565,760 140,214 30.7North Carolina 2,078,868 66,172 31.8 2,112,577 66,698 31.6North Dakota 148,229 3,912 26.4 146,437 3,961 27.0Ohio 2,810,418 70,280 25.0 2,790,677 71,762 25.7Oklahoma 883,691 36,070 40.8 886,369 36,952 41.7Oregon 846,869 23,529 27.8 849,598 25,063 29.5Pennsylvania 2,840,739 23,862 8.4 2,821,095 23,114 8.2Puerto Rico 1,031,914 31,673 30.7Rhode Isl<strong>and</strong> 245,808 6,707 27.3 241,839 7,101 29.4South Carolina 1,023,278 17,186 16.8 1,030,036 17,088 16.6South Dakota 195,335 4,620 23.7 194,619 4,445 22.8Tennessee 1,416,415 48,622 34.3 1,428,285 59,998 42.0Texas 6,245,791 140,038 22.4 6,337,618 161,895 25.5Utah 755,550 21,132 28.0 775,353 21,052 27.2Vermont 138,247 2,690 19.5 135,814 2,504 18.4Virginia 1,791,792 28,105 15.7 1,803,450 27,937 15.5Washington 1,516,468 32,314 21.3 1,519,924 34,293 22.6West Virginia 390,144 18,508 47.4 389,162 22,400 57.6Wisconsin 1,330,485 40,205 30.2 1,320,899 29,660 22.5Wyoming 122,399 2,018 16.5 121,519 2,020 16.6Total 71,735,275 1,872,693 73,196,521 1,916,359Rate 26.1 26.2Number Reporting 49 49 49 51 51 51CHAPTER 2: Reports19
Table 2–4 Report Investigation Trends, 2002–<strong>2006</strong> (continued from page 19)<strong>2006</strong>STATECHILDPOPULATIONTOTALINVESTIGATIONSINVESTIGATIONRATEAlabama 1,114,301 18,651 16.7Alaska 181,434 5,755 31.7Arizona 1,628,198 33,743 20.7Arkansas 691,186 25,524 36.9Cali<strong>for</strong>nia 9,532,614 225,911 23.7Colorado 1,169,301 30,940 26.5Connecticut 818,286 28,500 34.8Delaware 203,366 5,781 28.4District of Columbia 114,881 5,077 44.2Florida 4,021,555 151,822 37.8Georgia 2,455,020 60,277 24.6Hawaii 298,081 2,285 7.7Idaho 394,280 6,662 16.9Illinois 3,215,244 66,495 20.7Indiana 1,577,629 44,051 27.9Iowa 710,194 25,029 35.2Kansas 695,837 15,164 21.8Kentucky 999,531 48,649 48.7Louisiana 1,090,001 25,536 23.4Maine 280,994 5,949 21.2Maryl<strong>and</strong>Massachusetts 1,448,884 38,918 26.9Michigan 2,478,356 70,036 28.3Minnesota 1,257,264 19,846 15.8Mississippi 759,405 16,888 22.2Missouri 1,416,592 47,491 33.5Montana 217,848 8,737 40.1Nebraska 445,033 13,109 29.5Nevada 634,520 14,982 23.6New Hampshire 297,625 6,640 22.3New Jersey 2,089,338 28,134 13.5New Mexico 508,930 16,565 32.5New York 4,514,342 150,796 33.4North Carolina 2,155,387 67,524 31.3North Dakota 144,934 3,791 26.2Ohio 2,770,035 73,156 26.4Oklahoma 894,034 36,673 41.0Oregon 856,259 25,598 29.9Pennsylvania 2,804,873 23,071 8.2Puerto Rico 1,018,651 13,797 13.5Rhode Isl<strong>and</strong> 237,451 8,441 35.5South Carolina 1,039,653 16,712 16.1South Dakota 194,681 3,908 20.1Tennessee 1,442,593 61,886 42.9Texas 6,493,965 166,728 25.7Utah 791,198 20,206 25.5Vermont 133,389 2,315 17.4Virginia 1,806,847 29,141 16.1Washington 1,526,267 35,698 23.4West Virginia 389,071 23,210 59.7Wisconsin 1,312,530 29,029 22.1Wyoming 121,794 2,437 20.0Total 73,393,682 1,907,264Rate 26.0Number Reporting 51 51 5120 <strong>Child</strong> <strong>Maltreatment</strong> <strong>2006</strong>
Table 2–5 Disposition by Report Source, <strong>2006</strong> (continues on page 22)ALTERNATIVE ALTERNATIVERESPONSE RESPONSESUBSTANTIATED INDICATED VICTIMS NONVICTIM UNSUBSTANTIATEDREPORT SOURCE NUMBER % NUMBER % NUMBER % NUMBER % NUMBER %PROFESSIONALSEducational Personnel 62,674 13.4 7,232 12.6 897 12.2 17,576 15.5 209,017 18.4Legal, Law En<strong>for</strong>cement,Criminal JusticePersonnel 128,744 27.4 17,276 30.1 1,250 17.0 10,987 9.7 126,211 11.1Social Services Personnel 58,131 12.4 6,523 11.4 976 13.3 7,459 6.6 107,853 9.5Medical Personnel 54,500 11.6 3,930 6.9 720 9.8 6,156 5.4 85,657 7.6Mental Health Personnel 15,290 3.3 1,950 3.4 51 0.7 2,953 2.6 53,368 4.7<strong>Child</strong> Daycare Providers 2,967 0.6 385 0.7 43 0.6 696 0.6 11,234 1.0Foster Care Providers 2,225 0.5 106 0.2 4 0.1 826 0.7 7,251 0.6Total Professionals 324,531 69.1 37,402 65.2 3,941 53.5 46,653 41.2 600,591 52.9NONPROFESSIONALSAnonymous Reporters 23,337 5.0 3,402 5.9 660 9.0 4,078 3.6 116,950 10.3Other Reporters 33,516 7.1 4,030 7.0 254 3.4 6,942 6.1 99,456 8.8Other Relatives 31,613 6.7 5,190 9.1 946 12.8 4,408 3.9 95,550 8.4Parents 20,048 4.3 3,554 6.2 399 5.4 5,338 4.7 77,823 6.9Friends or Neighbors 16,453 3.5 2,739 4.8 787 10.7 4,742 4.2 68,629 6.0Unknown Reporters 17,176 3.7 10 0.0 338 4.6 40,428 35.7 66,897 5.9Alleged Victims 1,997 0.4 562 1.0 40 0.5 522 0.5 7,186 0.6Alleged Perpetrators 700 0.1 445 0.8 20 0.0 1,329 0.1Total Nonprofessionals 144,840 30.9 19,932 34.8 3,424 46.5 66,478 58.8 533,820 47.1Total 469,371 57,334 7,365 113,131 1,134,411Percent 100.0 100.0 100.0 100.0 100.0Number Reporting 48 48 5 5 2 2 12 12 48 48CHAPTER 2: Reports 21
Table 2–5 Disposition by Report Source, <strong>2006</strong> (continued from page 21)INTENTIONALLYFALSECLOSED WITHNO FINDING OTHER UNKNOWN TOTALREPORT SOURCE NUMBER % NUMBER % NUMBER % NUMBER % NUMBERPROFESSIONALSEducational Personnel 48 5.2 3,054 9.7 11,515 21.0 237 10.4 312,250Legal, Law En<strong>for</strong>cement,Criminal JusticePersonnel 79 8.6 4,251 13.5 7,651 13.9 583 25.6 297,032Social Services Personnel 38 4.1 3,590 11.4 3,897 7.1 245 10.7 188,712Medical Personnel 26 2.8 2,117 6.7 5,162 9.4 164 7.2 158,432Mental Health Personnel 21 2.3 978 3.1 2,650 4.8 83 3.6 77,344<strong>Child</strong> Daycare Providers 4 0.4 209 0.7 785 1.4 17 0.7 16,340Foster Care Providers 3 0.3 107 0.3 124 0.2 26 1.1 10,672Total Professionals 219 23.9 14,306 45.5 31,784 57.9 1,355 59.4 1,060,782NONPROFESSIONALSAnonymous Reporters 240 26.2 2,674 8.5 4,319 7.9 246 10.8 155,906Other Reporters 66 7.2 3,384 10.8 3,947 7.2 183 8.0 151,778Other Relatives 112 12.2 3,733 11.9 5,424 9.9 164 7.2 147,140Parents 168 18.3 2,187 6.9 4,888 8.9 144 6.3 114,549Friends or Neighbors 86 9.4 3,320 10.5 3,325 6.1 148 6.5 100,229Unknown Reporters 12 1.3 1,658 5.3 870 1.6 1 0.0 127,390Alleged Victims 9 1.0 200 0.6 282 0.5 34 1.5 10,832Alleged Perpetrators 5 0.5 13 0.0 30 0.1 5 0.2 2,547Total Nonprofessionals 698 76.1 17,169 54.5 23,085 42.1 925 40.6 810,371Total 917 31,475 54,869 2,280 1,871,153Percent 100.0 100.0 100.0 100.0Number Reporting 8 8 23 23 13 13 7 722 <strong>Child</strong> <strong>Maltreatment</strong> <strong>2006</strong>
Table 2–6 PART Measure: Response Time in Hours, <strong>2006</strong>STATERESPONSETIME AVERAGEAlabamaAlaska 199Arizona 47Arkansas 208Cali<strong>for</strong>niaColoradoConnecticut 40Delaware 154District of Columbia 33Florida 10GeorgiaHawaii 132Idaho 57Illinois 12IndianaIowa 43Kansas 74Kentucky 31LouisianaMaine 120Maryl<strong>and</strong>MassachusettsMichiganMinnesota 60Mississippi 166Missouri 58MontanaNebraska 312Nevada 42New Hampshire 58New Jersey 48New MexicoNew YorkNorth CarolinaNorth Dakota 32Ohio 4Oklahoma 141Oregon 116PennsylvaniaPuerto Rico 146Rhode Isl<strong>and</strong> 21South Carolina 84South Dakota 182Tennessee 71Texas 34Utah 102Vermont 72VirginiaWashington 77West VirginiaWisconsin 104Wyoming 15Total 3,105Average 86Median 66Number Reporting 36CHAPTER 2: Reports23
Table 2–7 <strong>Child</strong> Protective Services Work<strong>for</strong>ce, <strong>2006</strong>STATESCREENINGAND INTAKEWORKERSINVESTIGATIONWORKERSSCREENING,INTAKE,INVESTIGATIONWORKERSSCREENED-INREFERRALSSCREENED-INREFERRALS PERINVESTIGATIONWORKERAlabama 82 590 672 18,651 32Alaska 31 65 96 5,755 89Arizona 68 729 797 33,743 46Arkansas 31 517 548 25,524 49Cali<strong>for</strong>nia 4,609ColoradoConnecticutDelaware 6 83 89 5,781 70District of Columbia 50 83 133 5,077 61Florida 157 1,731 1,888 151,822 88GeorgiaHawaii 14 75 89 2,285 30Idaho 335Illinois 118 971 1,089 66,495 68Indiana 450Iowa 219Kansas 67 290 357 15,164 52Kentucky 1,628Louisiana 9 239 248 25,536 107Maine 28 129 157 5,949 46Maryl<strong>and</strong>Massachusetts 77 249 326 38,918 156MichiganMinnesota 128 263 391 19,846 75Mississippi 4 391 395 16,888 43Missouri 51 386 437 47,491 123MontanaNebraska 23 89 112 13,109 147Nevada 29 142 171 14,982 106New Hampshire 11 64 75 6,640 104New Jersey 95 728 823 28,134 39New Mexico 43 172 215 16,565 96New YorkNorth Carolina 159 854 1,013 67,524 79North Dakota 105OhioOklahoma 41 403 444 36,673 91Oregon 383Pennsylvania 3,054Puerto Rico 30 159 189 13,797 87Rhode Isl<strong>and</strong> 30 40 70 8,441 211South CarolinaSouth Dakota 51 56 107 3,908 70Tennessee 66 616 682 61,886 100Texas 359 5,015 5,374 166,728 33Utah 22 106 128 20,206 191Vermont 26 36 62 2,315 64Virginia 63 833 896 29,141 35Washington 122 389 511 35,698 92West Virginia 403Wisconsin 146 264 410 29,029 110Wyoming 123Total 2,237 16,757 30,303 1,039,701Weighted Average 62.0Average 84.5Number Reporting 33 33 43 33 3324 <strong>Child</strong> <strong>Maltreatment</strong> <strong>2006</strong>
<strong>Child</strong>ren 1CHAPTER 3Each State has its own definitions of child abuse <strong>and</strong> neglect based on st<strong>and</strong>ards set by Federallaw. Federal legislation provides a foundation <strong>for</strong> States by identifying a minimum set of acts orbehaviors that defines child abuse <strong>and</strong> neglect. The Federal <strong>Child</strong> Abuse Prevention <strong>and</strong> TreatmentAct (CAPTA), (42 U.S.C.A. §5106g), as amended by the Keeping <strong>Child</strong>ren <strong>and</strong> <strong>Families</strong> SafeAct of 2003, defines child abuse <strong>and</strong> neglect as:■ Any recent act or failure to act on the part of a parent or caretaker which results in death,serious physical or emotional harm, sexual abuse or exploitation; or■ An act or failure to act which presents an imminent risk of serious harm.<strong>Child</strong> protective services (CPS) agencies respond to the needs of children who are alleged tohave been maltreated to ensure that they are safe. National estimates <strong>for</strong> FFY <strong>2006</strong> are based onchild populations <strong>for</strong> the 50 States, the District of Columbia, <strong>and</strong> the Commonwealth of PuertoRico. During Federal fiscal year (FFY) <strong>2006</strong>:■ An estimated 905,000 children were victims of maltreatment;■ The rate of victimization was 12.1 per 1,000 children in the population; <strong>and</strong>■ Nearly 3.6 million children received a CPS investigation or assessment.This chapter discusses the 5-year trend of children who received an investigation or assessment<strong>and</strong> the 5-year trend of victimization rates. The remainder of the chapter provides more in-depthin<strong>for</strong>mation about the characteristics of children who were abused or neglected.<strong>Child</strong>ren Who Were Subjects of an InvestigationBased on a rate of 47.8 per 1,000 children, an estimated 3.6 million children received an investigationby CPS agencies during FFY <strong>2006</strong>. 2 The rate of all children who received an investigationor assessment increased from 43.8 per 1,000 children <strong>for</strong> 2002 to 47.8 per 1,000 children <strong>for</strong>FFY <strong>2006</strong>. 3 The national estimates are based upon counting a child each time he or she was thesubject of a CPS investigation (figure 3–1).1 This chapter is primarily about child victims, but includes some in<strong>for</strong>mation about nonvictims <strong>and</strong>, there<strong>for</strong>e, is titled“<strong>Child</strong>ren.”2 Supporting data are provided in table 3–1, which is located at the end of this chapter. The child disposition rate wascomputed by dividing the total count of children who were the subjects of an investigation (3,511,590) by the child population<strong>for</strong> the 51 States that reported these data (73,393,682) <strong>and</strong> multiplying by 1,000. A national estimate of 3,573,000(rounded to 3.6 million) children who were the subjects of an investigation was calculated by multiplying the childinvestigation rate (47.8) by the national child population <strong>for</strong> all 52 States (74,754,213) <strong>and</strong> dividing by 1,000.3 See table 3–2.CHAPTER 3: <strong>Child</strong>ren 25
Figure 3–1 <strong>Child</strong> Disposition <strong>and</strong> Victimization Rates, 2002–<strong>2006</strong>RATE50.0■ Disposition Rate ■ Victimization Rate40.043.846.248.148.247.830.020.012.312.212.012.112.110.02002Based on data from table 3–2.2003YEAR20042005<strong>2006</strong><strong>Child</strong> VictimsOf the children who received an investigation, approximately one-quarter (25.2%) were determinedto have been abused or neglected. Based on a victim rate of 12.1 per 1,000 children, anestimated 905,000 children were found to be victims in the 52 States. 4 The victimization rates byindividual State are illustrated in figure 3–2.Figure 3–2 Map of Victimization Rates, <strong>2006</strong>Investigation RateVictim RateVICTIMS PER 1,000 CHILDREN ■ 0.0 to 5.0 ■ 5.1 to 10.0 ■ 10.1 to 15.0 ■ 15.1 to 20.0 ■ 20.1 <strong>and</strong> greater ■ data not availableMDVADCPUERTO RICOBased on data from table 3–3.4 See table 3–3. The victimization rate was computed by dividing the number of total victims (885,245) by the child population<strong>for</strong> the 51 States that reported these data (73,393,682) <strong>and</strong> multiplying by 1,000. A national estimate of 905,000child victims was calculated by multiplying the victimization rate by the national population (74,754,213), dividing by1,000, <strong>and</strong> rounding to the nearest 1,000.26 <strong>Child</strong> <strong>Maltreatment</strong> <strong>2006</strong>
The rate of victimization decreased from 12.3 per 1,000 during 2002, to 12.1 per 1,000 childrenduring FFY <strong>2006</strong>, which is a 1.6 percent decrease. State-specific, 5-year trends illustrate that 28States decreased their rate from 2002 to <strong>2006</strong>, while 22 States increased their rate. Two Stateswere not able to provide data <strong>for</strong> this analysis. 5First-Time VictimsNearly three-quarters of victims (74.7%) had no history of prior victimization. 6 In<strong>for</strong>mationregarding first-time victims is a Program Assessment Rating Tool (PART) measure. TheCommunity-Based <strong>Child</strong> Abuse Prevention Program reports this PART measure to the Offce ofManagement <strong>and</strong> Budget (OMB) each year as an average of all States. Individual State data arenot reported to OMB.Types of <strong>Maltreatment</strong>During FFY <strong>2006</strong>, 64.1 percent of victims experienced neglect, 16.0 percent were physicallyabused, 8.8 percent were sexually abused, 6.6 percent were psychologically maltreated, <strong>and</strong> 2.2percent were medically neglected. 7 In addition, 15.1 percent of victims experienced such “other”types of maltreatment as “ab<strong>and</strong>onment,” “threats of harm to the child,” or “congenital drugaddiction.” States may code any condition that does not fall into one of the main categories—physical abuse, neglect, medical neglect, sexual abuse, <strong>and</strong> psychological or emotionalmaltreatment—as “other.” These maltreatment type percentages total more than 100 percentbecause children who were victims of more than one type of maltreatment were counted <strong>for</strong>each maltreatment.The data <strong>for</strong> victims of specific types of maltreatment were analyzed in terms of the reportsources. Of victims of physical abuse, 24.2 percent were reported by teachers, 23.1 percent werereported by police offcers or lawyers, <strong>and</strong> 12.1 percent were reported by medical staff. 8 Overall,74.9 percent were reported by professionals <strong>and</strong> 25.1 percent were reported by nonprofessionals.The patterns of reporting of neglect <strong>and</strong> sexual abuse victims were similar—police offcers orlawyers accounted <strong>for</strong> the largest report source percentage of neglect victims (27.1%) <strong>and</strong> thelargest percentage of sexual abuse victims (28.1%).Sex <strong>and</strong> Age of VictimsFor FFY <strong>2006</strong>, 48.2 percent of child victims were boys, <strong>and</strong> 51.5 percent of the victims were girls. 9The youngest children had the highest rate of victimization. The rate of child victimization <strong>for</strong>the age group of birth to 1 year was 24.4 per 1,000 children of the same age group. The victimizationrate <strong>for</strong> children in the age group of 1–3 years was 14.2 per 1,000 children in the sameage group. The victimization rate <strong>for</strong> children in the age group of 4–7 years was 13.5 per 1,000children in the same age group. 10 Overall, the rate of victimization was inversely related to theage group of the child (figure 3–3).5 See table 3–4.6 See table 3–5.7 See table 3–6.8 See table 3–7.9 See table 3–8.10 See table 3–9.CHAPTER 3: <strong>Child</strong>ren 27
Figure 3–3 Victimization Ratesby Age Group, <strong>2006</strong>AGE GROUPAge < 1Age 1–3Age 4–714.213.524.4Nearly three-quarters of child victims (72.2%)ages birth to 1 year <strong>and</strong> age group of 1–3 (72.9%)were neglected compared with 55.0 percent ofvictims ages 16 years <strong>and</strong> older. For victimsin the age group of 4–7 years 15.3 percent werephysically abused <strong>and</strong> 8.2 percent were sexuallyabused, compared with 20.1 percent <strong>and</strong> 16.5percent, respectively, <strong>for</strong> victims in the agegroup of 1 2–15 years old. 11Figure 3–4 Race <strong>and</strong> Ethnicityof Victims, <strong>2006</strong>RACEAge 8–11Age 12–15Age 16–17Based on data from table 3–9.6.310.810.20.0 5.0 10.0 15.0 20.0 25.0 30.0RATE PER 1,000 CHILDRENRace <strong>and</strong> Ethnicity of VictimsAfrican-American children, American Indianor Alaska Native children, <strong>and</strong> children of multipleraces had the highest rates of victimizationat 19.8, 15.9, <strong>and</strong> 15.4 per 1,000 children of thesame race or ethnicity, respectively (figure 3–4).White children <strong>and</strong> Hispanic children had ratesof approximately 10.7 <strong>and</strong> 10.8 per 1,000 childrenof the same race or ethnicity, respectively. Asianchildren had the lowest rate of 2.5 per 1,000children of the same race or ethnicity. 12African-AmericanAmerican Indian orAlaska NativeMultiple RacePacific Isl<strong>and</strong>erHispanicWhite10.810.714.315.915.419.8One-half of all victims were White (48.8);almost one-quarter (22.8) were African-American; <strong>and</strong> 18.4 percent were Hispanic. Forall racial categories except Native Hawaiian<strong>and</strong> Pacific Isl<strong>and</strong>er, the largest percentage ofvictims suffered from neglect. 13Asian2.50.0 5.0 10.0 15.0 20.0 25.0Living Arrangement of VictimsRATEData are incomplete <strong>for</strong> the living arrangementBased on data from table 3–11.of victims. Slightly more than one-half of theStates (28) reported on the living arrangementof victims during the alleged abuse or neglect.Among these 28 States, nearly 40.0 percent (37.3%) of the victims had unknown or missing dataon living arrangement <strong>and</strong> were excluded from the analysis. Approximately 27 percent (26.7%)of victims were living with a single mother. Nearly 20 percent (19.7%) of victims were living withmarried parents, while approximately 22 percent of victims (21.6%) were living with both parentsbut the marital status was unknown. It is hoped that the reporting of this data element willimprove in the coming years.11 See table 3–10. <strong>Child</strong>ren may have been the victims of more than one type of maltreatment. 12 See table 3–11. 13 See table 3–12. 28 <strong>Child</strong> <strong>Maltreatment</strong> <strong>2006</strong>
Reported Disability of Victims<strong>Child</strong>ren who were reported with any of the following risk factors were considered as having adisability: mental retardation, emotional disturbance, visual or hearing impairment, learningdisability, physical disability, behavioral problems, or another medical problem. In general,children with such risk factors are undercounted, as not every child receives a clinical diagnosticassessment from CPS agency staff. Nearly 8 percent (7.7%) of victims had a reported disability.Three percent of victims had behavior problems <strong>and</strong> 1.9 percent of victims were emotionallydisturbed. A victim could have been reported with more than one type of disability. 14Factors Influencing the Determination Thata <strong>Child</strong> is a Victim of <strong>Maltreatment</strong>The determination as to whether or not a child is considered a victim of maltreatment is madeduring a CPS investigation. A multivariate analysis was conducted to examine whether some childcharacteristics or circumstances place children at a greater risk <strong>for</strong> being identified as victimsduring the investigation process. The odds ratio analyses indicate the likelihood that an allegationof maltreatment is confirmed by the CPS agency. Highlights of the findings are listed below. 15■ <strong>Child</strong>ren with allegations of multiple types of maltreatment were nearly four times morelikely to be considered a victim of maltreatment than were children with allegations ofphysical abuse. <strong>Child</strong>ren with allegations of sexual abuse were nearly twice as likely to beconsidered victims, <strong>and</strong> children with allegations of neglect <strong>and</strong> other abuse types werealso significantly more likely to be considered victims than children with allegations ofphysical abuse.■ <strong>Child</strong>ren who were reported as disabled were 54 percent more likely to be considered a victimof maltreatment than children who were not reported as disabled.■ The likelihood of being considered a victim declined, compared with infants, as the age of thechildren increased.■ <strong>Child</strong>ren who were reported by educational personnel were more than twice as likely to be considereda victim of maltreatment as children reported by social <strong>and</strong> mental health personnel.RecurrenceFor many victims who have experienced repeat maltreatment, the ef<strong>for</strong>ts of the CPS systemhave not been successful in preventing subsequent victimization. Through the <strong>Child</strong> <strong>and</strong> FamilyServices Reviews (CFSR), the <strong>Child</strong>ren’s Bureau has established the current national st<strong>and</strong>ard<strong>for</strong> the absence of maltreatment recurrence as 94.6 percent, defined as:“Absence of <strong>Maltreatment</strong> Recurrence. Of all children who were victims of substantiated or indicatedabuse or neglect during the first 6 months of the reporting year, what percent did not experienceanother incident of substantiated or indicated abuse or neglect within a 6-month period?” 1614 See table 3–14.15 See table 3–15.16 The Data Measures, Data Composites, <strong>and</strong> National St<strong>and</strong>ards to be Used in the <strong>Child</strong> <strong>and</strong> Family Services Reviews,71 Fed. Reg. 109, 32973 (June 7, <strong>2006</strong>).CHAPTER 3: <strong>Child</strong>ren 29
The number of States in compliance with this st<strong>and</strong>ard has increased from 17 States <strong>for</strong> FFY2004 to 23 States <strong>for</strong> FFY <strong>2006</strong>. 17 During FFY <strong>2006</strong>, five States were unable to use the <strong>Child</strong> Fileto compute this measure. The national average percent—the average percentage of all States thatis reported to the Offce of Management <strong>and</strong> Budget—increased from 91.9 during FFY 2004 to92.2 <strong>for</strong> FFY <strong>2006</strong>.Thirty-six States provided suffcient data to support an analysis of the factors that influence thelikelihood of recurrence. 18 In this analysis, recurrence was defined as a second substantiated orindicated maltreatment occurring within a 6-month period (183 days). The major results of theanalysis are summarized below.■ <strong>Child</strong>ren who had been prior victims of maltreatment were 96 percent more likely to experiencea recurrence than those who were not prior victims.■ <strong>Child</strong> victims who were reported with a disability were 52 percent more likely to experiencerecurrence than children without a disability.■ The oldest victims (16–21 years of age) were the least likely to experience a recurrence, <strong>and</strong>were 51 percent less likely than were infants (younger than age 1).Victims by Relationship to PerpetratorsNearly 83 percent (82.4%) of victims were abused by a parent acting alone or with anotherperson. Approximately, 40 percent (39.9%) of child victims were maltreated by their mothersacting alone; another 17.6 percent were maltreated by their fathers acting alone; <strong>and</strong> 17.8 percentwere abused by both parents. 19 Victims abused by nonparental perpetrators accounted <strong>for</strong> 10.0percent (figure 3–5). A nonparental perpetrator is defined as a caregiver who is not a parent <strong>and</strong>can include foster parent, child daycare staff,Figure 3–5 Victims by PerpetratorRelationship, <strong>2006</strong>unmarried partner of parent, legal guardian,<strong>and</strong> residential facility staff.NonparentalPerpetrator(s)10.0%Father <strong>and</strong>Other1.0%Mother <strong>and</strong>Other6.1%Unknown orMissing7.6%Mother Only39.9%The data <strong>for</strong> victims of specific maltreatmenttypes were analyzed in terms of perpetratorrelationship to the victim. Of the victims whoexperienced neglect, 86.7 percent were neglectedby a parent. Of the victims who were sexuallyabused, 26.2 percent were abused by a parent<strong>and</strong> 29.1 percent were abused by a relative otherthan a parent. 20Mother <strong>and</strong> Father17.8%Based on data from table 3–16.Father Only17.6%17 See table 3–16.18 See table 3–17.19 See table 3–18.20 See table 3–19.30 <strong>Child</strong> <strong>Maltreatment</strong> <strong>2006</strong>
<strong>Maltreatment</strong> in Foster CareThrough the CFSR, the <strong>Child</strong>ren’s Bureau established a national st<strong>and</strong>ard <strong>for</strong> the absence ofmaltreatment in foster care as 99.68 percent, defined as:“Absence of <strong>Maltreatment</strong> in Foster Care. Of all children in foster care during the reporting period,what percent were not victims of a substantiated or indicated maltreatment by foster parents orfacility staff members?” 21The number of States in compliance has increased from 16 States that met this st<strong>and</strong>ard <strong>for</strong> FFY2004 to 19 States <strong>for</strong> FFY <strong>2006</strong>. 22 During FFY <strong>2006</strong>, 5 States were unable to provide the dataneeded to compute this measure using the <strong>Child</strong> File. The national average percent decreasedfrom 99.53 during FFY 2004 to 99.49 during FFY <strong>2006</strong>.Tables <strong>and</strong> NotesThe following pages contain the tables referenced in Chapter 3. Unless otherwise explained,a blank indicates that the State did not submit usable data. Specific in<strong>for</strong>mation about Statesubmissions can be found in appendix D. Additional in<strong>for</strong>mation regarding methodologies thatwere used to create the tables is provided below.Table 3–1■ The child disposition rate was computed by dividing the total count of children who were thesubjects of an investigation (3,511,590) by the child population <strong>for</strong> the 51 States that reportedthese data (73,393,682) <strong>and</strong> multiplying by 1,000.■ Maryl<strong>and</strong> did not submit NCANDS data in FFY <strong>2006</strong>.■ Many States investigate all children in the family. Siblings who were not the subject of anallegation <strong>and</strong> were not found as victims of maltreatment are categorized as no allegedmaltreatment.Table 3–2■ The disposition rate <strong>and</strong> the victim rate were computed by dividing the respective actual totalcounts of children by the population in reporting States <strong>and</strong> multiplying by 1,000.■ The numbers of total estimated children who were subjects of an investigation <strong>and</strong> totalestimated victims are rounded to the nearest 1,000. If fewer than 52 States reported datain a given year, the total is an estimate based on multiplying the rate by the national childpopulation <strong>for</strong> that year.Table 3–3■ The rate of victims <strong>for</strong> each State was based on their number of victims divided by the State’schild population, multiplied by 1,000.Table 3–5■ Only children with substantiated, indicated, or alternative response victim dispositions or amaltreatment death are included in this table.21 See footnote 16.22 See table 3–20.CHAPTER 3: <strong>Child</strong>ren 31
Table 3–6■ A child may have been the victim of more than one type of maltreatment, <strong>and</strong> there<strong>for</strong>e, thetotal percent may equal more than 100.0.Table 3–8■ Rates were based on the number of boy or girl victims divided by the boy or girl population,respectively, <strong>and</strong> multiplied by 1,000.Table 3–9■ As this table does not contain data of children with unknown or missing age, the sum in thetotal column is not the total number of reported victims, but a sum of the data from the tableby State.Table 3–10■ A child may have been the victim of more than one type of maltreatment, <strong>and</strong> there<strong>for</strong>e, thetotal percent may equal more than 100.0.Table 3–11■ Counts associated with specific racial groups, (e.g.,White) do not include Hispanic children.■ <strong>Child</strong>ren of unknown race are not included in this analysis.■ Rates were computed by dividing the victim count by the population count <strong>and</strong> multiplyingby 1,000.Table 3–12■ The category of multiple maltreatment types includes children who were the victims of anytwo or more types of maltreatment.Table 3–13■ States that categorize more than 90 percent of data as unknown or missing were not includedin this analysis.Table 3–14■ Each victim is counted only once <strong>for</strong> each applicable disability category regardless of howmany reports the child had. The column total victims with one or more disabilities countseach child only once regardless of how many disabilities were reported.Table 3–15■ Logistic regression models associate the contribution of the categories within a factor to theoutcome of interest (in this case victimization). Odds ratios indicate the likelihood, relative toa selected reference group, of the outcome occurring. Odds ratios greater than 1.00 indicatean increased likelihood of occurrence (e.g., victims of prior abuse or neglect are 43 percentmore likely to be victims of maltreatment than children with no history of prior abuseor neglect). Odds ratios less than 1.00 indicate a decreased likelihood of occurrence (e.g.,children who are age 16 or older are 57 percent less likely to be victims than children who areyounger than 1 year). The reference group is determined by the data analyst <strong>and</strong> always has avalue of 1.00.■ The category of neglect includes medical neglect.■ Asterisks indicate statistical significance.32 <strong>Child</strong> <strong>Maltreatment</strong> <strong>2006</strong>
Table 3–16■ Reports within 24 hours of the initial report are not counted as recurrence. However, recurrencerates may be influenced by reports alleging the same maltreatment from additionalsources if the State in<strong>for</strong>mation system counts these as separate reports.■ The national average percent was taken from the national <strong>Child</strong> <strong>and</strong> Family Services Reviews<strong>and</strong> is not a calculation from the data in the table.Table 3–17■ Proportional hazard models associate the contribution of the categories within a factor tothe distribution of elapsed time to the event of interest (in this case recurrence). Risk ratiosindicate the likelihood, relative to the reference group, of the outcome occurring. Risk ratiosgreater than 1.00 indicate an increased likelihood of occurrence (e.g., victims of prior abuseor neglect are 96 percent more likely to be victims of maltreatment than children with nohistory of prior abuse or neglect). Risk ratios less than 1.00 indicate a decreased likelihoodof recurrence (e.g., victims who are age 16 or older are 51 percent less likely than childrenyounger than 1 year to suffer recurrence). The reference group is determined by the dataanalyst <strong>and</strong> always has a value of 1.00.■ The category of neglect includes medical neglect.■ Asterisks indicate statistical significance.Table 3–18■ The categories “mother <strong>and</strong> other” <strong>and</strong> “father <strong>and</strong> other” include victims with one perpetratoridentified as a mother or father <strong>and</strong> a second perpetrator identified as a nonparent.■ The category of “other” can include more than one person.■ The category of nonparental perpetrator is defined as a perpetrator who was not identifiedas a parent <strong>and</strong> includes other relative, foster parent, <strong>and</strong> residential facility staff, foster carestaff, <strong>and</strong> legal guardian.■ States are included in this analysis only if they can link more than 74 percent of substantiatedvictims to perpetrators, report perpetrator relationship <strong>for</strong> more than 74 percent of perpetrators,<strong>and</strong> report data <strong>for</strong> multiple perpetrators per report.Table 3–19■ States are included in this analysis only if they can link more than 74 percent of substantiatedvictims to perpetrators <strong>and</strong> report perpetrator relationship <strong>for</strong> more than 74 percent ofperpetrators.Table 3–20■ States that did not provide perpetrator relationship data <strong>for</strong> at least 79 percent of perpetratorswere excluded from this analysis.CHAPTER 3: <strong>Child</strong>ren 33
Table 3–1 Dispositions of <strong>Child</strong>ren Who Were Subjectsof a CPS Investigation, <strong>2006</strong>ALTERNATIVE ALTERNATIVECHILD RESPONSE RESPONSESTATE POPULATION SUBSTANTIATED INDICATED VICTIM NONVICTIM UNSUBSTANTIATEDAlabama 1,114,301 9,378 16,523Alaska 181,434 3,481 5,414Arizona 1,628,198 4,332 137 45,997Arkansas 691,186 9,180 26,258Cali<strong>for</strong>nia 9,532,614 89,500 277,645Colorado 1,169,301 10,862 36,092Connecticut 818,286 10,174 32,112Delaware 203,366 1,933 9,528District of Columbia 114,881 2,759 4,690Florida 4,021,555 56,737 77,830 134,053Georgia 2,455,020 39,802 56,292Hawaii 298,081 2,045 2,215Idaho 394,280 1,651 8,273Illinois 3,215,244 27,756 80,665Indiana 1,577,629 20,925 44,552Iowa 710,194 14,589 24,178Kansas 695,837 2,630 20,058Kentucky 999,531 16,787 3,046 22,098 31,743Louisiana 1,090,001 12,472 642 26,359Maine 280,994 3,548 5,986Maryl<strong>and</strong>Massachusetts 1,448,884 36,151 27,580Michigan 2,478,356 27,148 146,149Minnesota 1,257,264 7,623 14,836 6,095Mississippi 759,405 6,272 20,034Missouri 1,416,592 7,108 41,039 19,995Montana 217,848 1,666 109 10,864Nebraska 445,033 6,160 16,436Nevada 634,520 5,345 354 20,020New Hampshire 297,625 822 7,954New Jersey 2,089,338 11,680 35,370 122New Mexico 508,930 5,926 20,545New York 4,514,342 80,077 170,178North Carolina 2,155,387 17,682 10,740 51,524 51,004North Dakota 144,934 1,438 5,284Ohio 2,770,035 25,835 15,614 71,144Oklahoma 894,034 13,414 10,917 35,076Oregon 856,259 12,927 17,713Pennsylvania 2,804,873 4,177 18,828Puerto Rico 1,018,651 15,066 12,452Rhode Isl<strong>and</strong> 237,451 4,400 8,428South Carolina 1,039,653 10,795 16,657South Dakota 194,681 1,529 5,009Tennessee 1,442,593 18,171 1,011 1,046 70,676Texas 6,493,965 69,065 171,566Utah 791,198 13,043 325 17,614Vermont 133,389 861 1,957Virginia 1,806,847 6,828 5,613Washington 1,526,267 7,294 10,624 21,189West Virginia 389,071 8,345 26,834Wisconsin 1,312,530 8,583 30,861Wyoming 121,794 786 3,192 841Total 73,393,682 776,758 94,701 13,786 191,967 1,943,351Percent 22.1 2.7 0.4 5.5 55.3RateNumber Reporting 51 51 5 2 12 5134 <strong>Child</strong> <strong>Maltreatment</strong> <strong>2006</strong>
STATEINTENTIONALLYFALSECLOSEDWITH NOFINDINGNO ALLEGEDMALTREATMENTOTHERUNKNOWNOR MISSINGTOTAL CHILDRENWHO WERESUBJECTS OF ANINVESTIGATIONCHILDDISPOSITIONRATEAlabama 1,439 27,340 24.5Alaska 605 9,500 52.4Arizona 25,989 76,455 47.0Arkansas 1,753 15,015 52,206 75.5Cali<strong>for</strong>nia 59,966 11 427,122 44.8Colorado 383 1,273 48,610 41.6Connecticut 42,286 51.7Delaware 148 948 1,245 62 13,864 68.2District of Columbia 450 4,415 1 12,315 107.2Florida 270 71,350 432 340,672 84.7Georgia 46,174 142,268 57.9Hawaii 1 4,261 14.3Idaho 9,924 25.2Illinois 828 36,384 145,633 45.3Indiana 708 1,326 67,511 42.8Iowa 38,767 54.6Kansas 22,688 32.6Kentucky 2,445 916 77,035 77.1Louisiana 2,150 166 6 41,795 38.3Maine 254 9,788 34.8Maryl<strong>and</strong>Massachusetts 16,124 79,855 55.1Michigan 237 13,220 186,754 75.4Minnesota 38 927 2 29,521 23.5Mississippi 26,306 34.6Missouri 2,078 2 48 70,270 49.6Montana 1,218 65 249 14,171 65.0Nebraska 581 7,297 26 30,500 68.5Nevada 4,756 30,475 48.0New Hampshire 429 4 190 9,399 31.6New Jersey 47,172 22.6New Mexico 26,471 52.0New York 3,181 253,436 56.1North Carolina 16 130,966 60.8North Dakota 6,722 46.4Ohio 2,842 694 116,129 41.9Oklahoma 5,554 1 64,962 72.7Oregon 10,605 41,245 48.2Pennsylvania 66 23,071 8.2Puerto Rico 166 334 3,735 93 3 31,849 31.3Rhode Isl<strong>and</strong> 168 12,996 54.7South Carolina 10,468 2 37,922 36.5South Dakota 597 7,135 36.6Tennessee 7,080 166 13 98,163 68.0Texas 13,025 26,631 626 280,913 43.3Utah 33 1,165 1 32,181 40.7Vermont 20 3 2,841 21.3Virginia 145 14,283 30,699 1,258 58,826 32.6Washington 774 13,695 53,576 35.1West Virginia 3,410 13,032 53 51,674 132.8Wisconsin 1,781 5 41,230 31.4Wyoming 4,819 39.6Total 1,648 51,756 335,065 83,351 19,207 3,511,590Percent 0.0 1.5 9.5 2.4 0.5 100.0Rate 47.8Number Reporting 8 24 22 13 22 51 51CHAPTER 3: <strong>Child</strong>ren 35
Table 3–2 <strong>Child</strong> Disposition <strong>and</strong> Victimization Rates, 2002–<strong>2006</strong>NATIONAL DISPOSITION VICTIMSREPORTINGYEARCHILDPOPULATIONDISPOSITIONRATETOTAL ESTIMATEDCHILDREN SUBJECTS STATESOF AN INVESTIGATION REPORTINGVICTIMRATETOTALESTIMATEDVICTIMSSTATESREPORTING2002 73,979,203 43.8 3,240,000 50 12.3 910,000 512003 74,144,319 46.2 3,425,000 50 12.2 905,000 512004 74,339,840 48.1 3,576,000 49 12.0 892,000 502005 74,566,154 48.2 3,594,000 51 12.1 900,000 52<strong>2006</strong> 74,754,213 47.8 3,573,000 51 12.1 905,000 5136 <strong>Child</strong> <strong>Maltreatment</strong> <strong>2006</strong>
Table 3–3 Disposition <strong>and</strong> Rate of Victims, <strong>2006</strong>STATECHILDPOPULATION SUBSTANTIATED INDICATEDALTERNATIVERESPONSEVICTIMTOTALVICTIMSTOTALVICTIMRATEAlabama 1,114,301 9,378 9,378 8.4Alaska 181,434 3,481 3,481 19.2Arizona 1,628,198 4,332 137 4,469 2.7Arkansas 691,186 9,180 9,180 13.3Cali<strong>for</strong>nia 9,532,614 89,500 89,500 9.4Colorado 1,169,301 10,862 10,862 9.3Connecticut 818,286 10,174 10,174 12.4Delaware 203,366 1,933 1,933 9.5District of Columbia 114,881 2,759 2,759 24.0Florida 4,021,555 56,737 77,830 134,567 33.5Georgia 2,455,020 39,802 39,802 16.2Hawaii 298,081 2,045 2,045 6.9Idaho 394,280 1,651 1,651 4.2Illinois 3,215,244 27,756 27,756 8.6Indiana 1,577,629 20,925 20,925 13.3Iowa 710,194 14,589 14,589 20.5Kansas 695,837 2,630 2,630 3.8Kentucky 999,531 16,787 3,046 19,833 19.8Louisiana 1,090,001 12,472 12,472 11.4Maine 280,994 3,548 3,548 12.6Maryl<strong>and</strong>Massachusetts 1,448,884 36,151 36,151 25.0Michigan 2,478,356 27,148 27,148 11.0Minnesota 1,257,264 7,623 7,623 6.1Mississippi 759,405 6,272 6,272 8.3Missouri 1,416,592 7,108 7,108 5.0Montana 217,848 1,666 109 1,775 8.1Nebraska 445,033 6,160 6,160 13.8Nevada 634,520 5,345 5,345 8.4New Hampshire 297,625 822 822 2.8New Jersey 2,089,338 11,680 11,680 5.6New Mexico 508,930 5,926 5,926 11.6New York 4,514,342 80,077 80,077 17.7North Carolina 2,155,387 17,682 10,740 28,422 13.2North Dakota 144,934 1,438 1,438 9.9Ohio 2,770,035 25,835 15,614 41,449 15.0Oklahoma 894,034 13,414 13,414 15.0Oregon 856,259 12,927 12,927 15.1Pennsylvania 2,804,873 4,177 4,177 1.5Puerto Rico 1,018,651 15,066 15,066 14.8Rhode Isl<strong>and</strong> 237,451 4,400 4,400 18.5South Carolina 1,039,653 10,795 10,795 10.4South Dakota 194,681 1,529 1,529 7.9Tennessee 1,442,593 18,171 1,011 19,182 13.3Texas 6,493,965 69,065 69,065 10.6Utah 791,198 13,043 13,043 16.5Vermont 133,389 861 861 6.5Virginia 1,806,847 6,828 6,828 3.8Washington 1,526,267 7,294 7,294 4.8West Virginia 389,071 8,345 8,345 21.4Wisconsin 1,312,530 8,583 8,583 6.5Wyoming 121,794 786 786 6.5Total 73,393,682 776,758 94,701 13,786 885,245Rate 12.1Number Reporting 51 51 5 2 51 51CHAPTER 3: <strong>Child</strong>ren 37
Table 3–4 Victimization Rates, 2002–<strong>2006</strong> (continues on page 40)2002 2003STATECHILDPOPULATION VICTIMS RATECHILDPOPULATION VICTIMS RATEAlabama 1,113,289 9,903 8.9 1,108,511 9,290 8.4Alaska 188,013 7,950 42.3 186,907 7,996 42.8Arizona 1,446,214 5,114 3.5 1,481,584 4,838 3.3Arkansas 677,364 7,302 10.8 676,912 7,232 10.7Cali<strong>for</strong>nia 9,411,596 132,181 14.0 9,476,210 106,198 11.2Colorado 1,136,499 7,570 6.7 1,141,412 8,137 7.1Connecticut 843,549 12,818 15.2 843,135 12,256 14.5Delaware 197,087 1,304 6.6 198,662 1,236 6.2District of Columbia 116,797 3,032 26.0 116,430 2,518 21.6Florida 3,775,071 122,131 32.4 3,824,062 138,499 36.2Georgia 2,271,043 41,206 18.1 2,310,562 43,923 19.0Hawaii 295,184 3,744 12.7 298,392 4,046 13.6Idaho 373,221 1,947 5.2 375,396 1,527 4.1Illinois 3,244,191 28,160 8.7 3,236,597 28,344 8.8Indiana 1,572,198 20,416 13.0 1,569,753 21,205 13.5Iowa 720,151 12,202 16.9 714,436 13,303 18.6Kansas 706,412 6,425 9.1 703,669 5,682 8.1Kentucky 991,995 16,945 17.1 992,383 18,178 18.3Louisiana 1,191,166 10,971 9.2 1,181,619 11,432 9.7Maine 295,375 3,746 12.7 292,440 4,719 16.1Maryl<strong>and</strong> 1,370,412 15,843 11.6 1,375,688 16,688 12.1Massachusetts 1,500,585 34,995 23.3 1,490,523 36,500 24.5Michigan 2,573,013 28,830 11.2 2,552,161 28,690 11.2Minnesota 1,280,544 9,982 7.8 1,271,464 9,230 7.3Mississippi 765,512 4,003 5.2 761,991 5,940 7.8Missouri 1,421,155 9,810 6.9 1,415,504 10,183 7.2Montana 223,209 1,995 8.9 221,073 1,951 8.8Nebraska 446,020 3,909 8.8 445,283 3,875 8.7Nevada 554,124 5,008 9.0 571,319 4,578 8.0New Hampshire 310,459 962 3.1 308,171 1,043 3.4New Jersey 2,107,273 8,103 3.8 2,113,185 8,123 3.8New Mexico 504,285 6,273 12.4 504,293 6,238 12.4New York 4,649,243 79,049 17.0 4,628,087 75,784 16.4North Carolina 2,030,623 35,523 17.5 2,055,521 32,847 16.0North Dakota 152,723 1,493 9.8 150,044 1,494 10.0Ohio 2,852,908 50,141 17.6 2,829,458 47,444 16.8Oklahoma 886,107 13,721 15.5 885,621 12,529 14.1Oregon 850,304 9,228 10.9 849,551 10,368 12.2Pennsylvania 2,878,052 5,057 1.8 2,858,851 4,571 1.6Puerto RicoRhode Isl<strong>and</strong> 248,334 3,247 13.1 247,632 3,290 13.3South Carolina 1,016,427 10,738 10.6 1,019,266 11,143 10.9South Dakota 198,015 3,961 20.0 196,300 4,346 22.1Tennessee 1,406,170 8,494 6.0 1,410,172 9,421 6.7Texas 6,081,582 48,808 8.0 6,162,780 50,522 8.2Utah 732,163 10,282 14.0 736,661 12,366 16.8Vermont 142,939 1,447 10.1 140,452 1,233 8.8Virginia 1,767,291 7,571 4.3 1,783,369 6,485 3.6Washington 1,519,294 4,673 3.1 1,517,018 6,020 4.0West Virginia 393,227 6,635 16.9 391,377 8,875 22.7Wisconsin 1,352,569 11,628 8.6 1,340,100 10,174 7.6Wyoming 124,851 692 5.5 123,151 786 6.4Total 72,905,828 897,168 73,085,138 893,296Rate 12.3 12.2Number Reporting 51 51 51 51 51 5138 <strong>Child</strong> <strong>Maltreatment</strong> <strong>2006</strong>
2004 2005STATECHILDPOPULATION VICTIMS RATECHILDPOPULATION VICTIMS RATEAlabama 1,106,522 9,414 8.5 1,107,079 9,029 8.2Alaska 182,990 2,693 14.7Arizona 1,522,131 7,344 4.8 1,574,856 6,119 3.9Arkansas 679,297 7,276 10.7 684,044 8,382 12.3Cali<strong>for</strong>nia 9,516,270 98,201 10.3 9,532,676 95,314 10.0Colorado 1,145,691 9,578 8.4 1,153,869 9,406 8.2Connecticut 838,707 13,285 15.8 830,770 11,419 13.7Delaware 200,003 1,581 7.9 202,195 1,960 9.7District of Columbia 116,631 2,378 20.4 116,098 2,840 24.5Florida 3,893,303 129,914 33.4 3,968,247 130,633 32.9Georgia 2,353,893 52,851 22.5 2,400,364 47,158 19.6Hawaii 297,856 3,629 12.2 298,637 2,762 9.2Idaho 379,401 1,856 4.9 386,653 1,912 4.9Illinois 3,233,171 29,150 9.0 3,225,149 29,325 9.1Indiana 1,569,727 18,869 12.0 1,573,346 19,062 12.1Iowa 711,234 13,804 19.4 709,859 14,016 19.7Kansas 699,975 4,895 7.0 696,417 2,775 4.0Kentucky 993,209 19,186 19.3 995,888 19,474 19.6Louisiana 1,174,289 10,862 9.2 1,167,629 12,366 10.6Maine 289,112 4,235 14.6 285,170 3,349 11.7Maryl<strong>and</strong> 1,374,600 15,180 11.0 1,369,633 14,603 10.7Massachusetts 1,476,886 36,201 24.5 1,463,169 35,887 24.5Michigan 2,533,054 28,035 11.1 2,509,307 24,603 9.8Minnesota 1,265,837 8,183 6.5 1,260,953 8,499 6.7Mississippi 761,628 5,674 7.4 762,072 6,154 8.1Missouri 1,413,662 9,616 6.8 1,414,887 8,945 6.3Montana 219,775 1,753 8.0 218,731 2,095 9.6Nebraska 445,141 4,785 10.7 445,087 6,630 14.9Nevada 593,717 4,462 7.5 613,756 5,230 8.5New Hampshire 304,909 948 3.1 301,727 941 3.1New Jersey 2,114,289 8,159 3.9 2,105,574 9,812 4.7New Mexico 504,848 6,333 12.5 506,377 7,285 14.4New York 4,600,581 74,483 16.2 4,565,760 70,878 15.5North Carolina 2,078,868 33,849 16.3 2,112,577 33,250 15.7North Dakota 148,229 1,668 11.3 146,437 1,547 10.6Ohio 2,810,418 43,093 15.3 2,790,677 42,483 15.2Oklahoma 883,691 12,483 14.1 886,369 13,941 15.7Oregon 846,869 11,759 13.9 849,598 12,414 14.6Pennsylvania 2,840,739 4,647 1.6 2,821,095 4,353 1.5Puerto Rico 1,031,914 15,807 15.3Rhode Isl<strong>and</strong> 245,808 3,068 12.5 241,839 3,366 13.9South Carolina 1,023,278 9,950 9.7 1,030,036 10,759 10.4South Dakota 195,335 1,917 9.8 194,619 1,617 8.3Tennessee 1,416,415 14,840 10.5 1,428,285 18,376 12.9Texas 6,245,791 50,891 8.1 6,337,618 61,994 9.8Utah 755,550 13,559 17.9 775,353 13,152 17.0Vermont 138,247 1,138 8.2 135,814 1,080 8.0Virginia 1,791,792 6,959 3.9 1,803,450 6,469 3.6Washington 1,516,468 6,730 4.4 1,519,924 7,932 5.2West Virginia 390,144 8,446 21.6 389,162 9,511 24.4Wisconsin 1,330,485 9,325 7.0 1,320,899 9,686 7.3Wyoming 122,399 678 5.5 121,519 853 7.0Total 73,109,875 877,120 74,566,154 900,146Rate 12.0 12.1Number Reporting 50 50 50 52 52 52CHAPTER 3: <strong>Child</strong>ren 39
Table 3–4 Victimization Rates, 2002–<strong>2006</strong> (continued from page 39)<strong>2006</strong>STATECHILDPOPULATION VICTIMS RATEAlabama 1,114,301 9,378 8.4Alaska 181,434 3,481 19.2Arizona 1,628,198 4,469 2.7Arkansas 691,186 9,180 13.3Cali<strong>for</strong>nia 9,532,614 89,500 9.4Colorado 1,169,301 10,862 9.3Connecticut 818,286 10,174 12.4Delaware 203,366 1,933 9.5District of Columbia 114,881 2,759 24.0Florida 4,021,555 134,567 33.5Georgia 2,455,020 39,802 16.2Hawaii 298,081 2,045 6.9Idaho 394,280 1,651 4.2Illinois 3,215,244 27,756 8.6Indiana 1,577,629 20,925 13.3Iowa 710,194 14,589 20.5Kansas 695,837 2,630 3.8Kentucky 999,531 19,833 19.8Louisiana 1,090,001 12,472 11.4Maine 280,994 3,548 12.6Maryl<strong>and</strong>Massachusetts 1,448,884 36,151 25.0Michigan 2,478,356 27,148 11.0Minnesota 1,257,264 7,623 6.1Mississippi 759,405 6,272 8.3Missouri 1,416,592 7,108 5.0Montana 217,848 1,775 8.1Nebraska 445,033 6,160 13.8Nevada 634,520 5,345 8.4New Hampshire 297,625 822 2.8New Jersey 2,089,338 11,680 5.6New Mexico 508,930 5,926 11.6New York 4,514,342 80,077 17.7North Carolina 2,155,387 28,422 13.2North Dakota 144,934 1,438 9.9Ohio 2,770,035 41,449 15.0Oklahoma 894,034 13,414 15.0Oregon 856,259 12,927 15.1Pennsylvania 2,804,873 4,177 1.5Puerto Rico 1,018,651 15,066 14.8Rhode Isl<strong>and</strong> 237,451 4,400 18.5South Carolina 1,039,653 10,795 10.4South Dakota 194,681 1,529 7.9Tennessee 1,442,593 19,182 13.3Texas 6,493,965 69,065 10.6Utah 791,198 13,043 16.5Vermont 133,389 861 6.5Virginia 1,806,847 6,828 3.8Washington 1,526,267 7,294 4.8West Virginia 389,071 8,345 21.4Wisconsin 1,312,530 8,583 6.5Wyoming 121,794 786 6.5Total 73,393,682 885,245Rate 12.1Number Reporting 51 51 5140 <strong>Child</strong> <strong>Maltreatment</strong> <strong>2006</strong>
Table 3–5 PART Measure: First-Time Victims, <strong>2006</strong>FIRST-TIME VICTIMSSTATEVICTIMSNUMBERPERCENTAlabama 9,107 6,990 76.8Alaska 3,122 2,690 86.2Arizona 4,341 3,684 84.9Arkansas 8,657 7,141 82.5Cali<strong>for</strong>nia 82,210 71,217 86.6Colorado 10,345 8,668 83.8Connecticut 9,375 7,639 81.5Delaware 1,892 1,569 82.9District of Columbia 2,571 2,010 78.2FloridaGeorgiaHawaii 2,006 1,798 89.6Idaho 1,584 1,262 79.7Illinois 25,561 19,340 75.7Indiana 19,168 16,473 85.9Iowa 12,913 9,071 70.2Kansas 2,545 2,142 84.2Kentucky 18,010 12,497 69.4Louisiana 11,636 8,725 75.0Maine 3,319 1,716 51.7Maryl<strong>and</strong>Massachusetts 32,113 18,374 57.2MichiganMinnesota 7,198 5,866 81.5Mississippi 5,883 5,355 91.0Missouri 6,380 5,215 81.7Montana 1,674 1,317 78.7Nebraska 5,441 4,340 79.8Nevada 4,990 3,360 67.3New Hampshire 795 245 30.8New Jersey 10,839 6,253 57.7New Mexico 5,401 4,139 76.6New York 68,174 45,703 67.0North Carolina 25,692 16,029 62.4North Dakota 1,379 1,048 76.0Ohio 37,759 26,724 70.8Oklahoma 12,266 9,524 77.6Oregon 12,035 8,927 74.2Pennsylvania 4,016 3,666 91.3Puerto Rico 14,622 6,479 44.3Rhode Isl<strong>and</strong> 3,813 2,532 66.4South Carolina 10,490 8,221 78.4South Dakota 1,449 1,099 75.8Tennessee 17,405 12,593 72.4Texas 65,733 55,112 83.8Utah 12,186 8,227 67.5Vermont 806 655 81.3VirginiaWashington 6,561 5,214 79.5West Virginia 7,213 4,471 62.0Wisconsin 7,934 6,689 84.3Wyoming 750 661 88.1Total 619,359 462,670Percent 74.7Number Reporting 47 47 47CHAPTER 3: <strong>Child</strong>ren 41
Table 3–6 <strong>Maltreatment</strong> Types of Victims, <strong>2006</strong>STATEVICTIMSNEGLECT PHYSICAL ABUSE MEDICAL NEGLECT SExUAL ABUSENUMBER % NUMBER % NUMBER % NUMBER %Alabama 9,378 3,911 41.7 3,666 39.1 2,448 26.1Alaska 3,481 2,007 57.7 496 14.2 152 4.4 158 4.5Arizona 4,469 3,156 70.6 1,063 23.8 319 7.1Arkansas 9,180 5,194 56.6 1,729 18.8 526 5.7 2,400 26.1Cali<strong>for</strong>nia 89,500 64,206 71.7 11,076 12.4 6,584 7.4Colorado 10,862 7,585 69.8 1,715 15.8 168 1.5 1,024 9.4Connecticut 10,174 9,285 91.3 633 6.2 389 3.8 452 4.4Delaware 1,933 842 43.6 372 19.2 49 2.5 165 8.5District of Columbia 2,759 1,595 57.8 405 14.7 165 6.0 152 5.5Florida 134,567 43,542 32.4 15,182 11.3 2,195 1.6 4,621 3.4Georgia 39,802 28,365 71.3 4,124 10.4 1,998 5.0 1,642 4.1Hawaii 2,045 323 15.8 233 11.4 27 1.3 93 4.5Idaho 1,651 1,249 75.7 264 16.0 11 0.7 78 4.7Illinois 27,756 18,876 68.0 6,857 24.7 746 2.7 4,974 17.9Indiana 20,925 15,247 72.9 2,609 12.5 519 2.5 4,346 20.8Iowa 14,589 11,581 79.4 1,888 12.9 146 1.0 789 5.4Kansas 2,630 586 22.3 524 19.9 69 2.6 670 25.5Kentucky 19,833 17,299 87.2 2,186 11.0 801 4.0Louisiana 12,472 9,845 78.9 3,179 25.5 903 7.2Maine 3,548 2,428 68.4 631 17.8 376 10.6Maryl<strong>and</strong>Massachusetts 36,151 33,096 91.5 4,677 12.9 981 2.7Michigan 27,148 20,637 76.0 4,728 17.4 463 1.7 1,227 4.5Minnesota 7,623 5,779 75.8 1,194 15.7 112 1.5 920 12.1Mississippi 6,272 3,725 59.4 1,249 19.9 196 3.1 934 14.9Missouri 7,108 3,674 51.7 2,220 31.2 2,039 28.7Montana 1,775 1,248 70.3 214 12.1 30 1.7 149 8.4Nebraska 6,160 5,239 85.0 799 13.0 5 0.1 607 9.9Nevada 5,345 4,535 84.8 954 17.8 113 2.1 198 3.7New Hampshire 822 565 68.7 138 16.8 23 2.8 161 19.6New Jersey 11,680 6,759 57.9 3,392 29.0 717 6.1 1,026 8.8New Mexico 5,926 4,404 74.3 791 13.3 144 2.4 269 4.5New York 80,077 73,269 91.5 8,484 10.6 3,519 4.4 2,710 3.4North Carolina 28,422 14,814 52.1 1,817 6.4 373 1.3 1,378 4.8North Dakota 1,438 913 63.5 158 11.0 24 1.7 77 5.4Ohio 41,449 22,507 54.3 9,214 22.2 8 0.0 7,283 17.6Oklahoma 13,414 11,146 83.1 2,407 17.9 465 3.5 885 6.6Oregon 12,927 4,770 36.9 983 7.6 260 2.0 1,230 9.5Pennsylvania 4,177 146 3.5 1,420 34.0 102 2.4 2,525 60.5Puerto Rico 15,066 8,539 56.7 3,529 23.4 1,553 10.3 584 3.9Rhode Isl<strong>and</strong> 4,400 3,771 85.7 552 12.5 64 1.5 249 5.7South Carolina 10,795 7,790 72.2 3,270 30.3 420 3.9 772 7.2South Dakota 1,529 1,349 88.2 187 12.2 65 4.3Tennessee 19,182 10,187 53.1 6,549 34.1 416 2.2 3,914 20.4Texas 69,065 51,073 73.9 15,409 22.3 2,649 3.8 7,406 10.7Utah 13,043 2,754 21.1 1,949 14.9 43 0.3 2,322 17.8Vermont 861 42 4.9 442 51.3 20 2.3 372 43.2Virginia 6,828 4,204 61.6 1,904 27.9 170 2.5 950 13.9Washington 7,294 5,971 81.9 1,264 17.3 441 6.0West Virginia 8,345 4,635 55.5 2,047 24.5 124 1.5 382 4.6Wisconsin 8,583 2,567 29.9 1,218 14.2 3,007 35.0Wyoming 786 557 70.9 50 6.4 7 0.9 62 7.9Total 885,245 567,787 142,041 19,180 78,120Percent 64.1 16.0 2.2 8.8Number Reporting 51 51 51 51 51 40 40 51 5142 <strong>Child</strong> <strong>Maltreatment</strong> <strong>2006</strong>
STATEPSYCHOLOGICALMALTREATMENTOTHERUNKNOWN ORMISSINGTOTALMALTREATMENTSNUMBER % NUMBER % NUMBER % NUMBER %Alabama 80 0.9 10,105 107.8Alaska 1,157 33.2 3,970 114.0Arizona 34 0.8 4,572 102.3Arkansas 109 1.2 6 0.1 9,964 108.5Cali<strong>for</strong>nia 15,774 17.6 150 0.2 97,790 109.3Colorado 487 4.5 443 4.1 11,422 105.2Connecticut 309 3.0 11,068 108.8Delaware 529 27.4 160 8.3 2,117 109.5District of Columbia 52 1.9 898 32.5 3,267 118.4Florida 2,416 1.8 91,884 68.3 159,840 118.8Georgia 8,727 21.9 183 0.5 45,039 113.2Hawaii 26 1.3 1,860 91.0 2,562 125.3Idaho 2 0.1 120 7.3 1,724 104.4Illinois 56 0.2 31,509 113.5Indiana 22,721 108.6Iowa 97 0.7 1,524 10.4 16,025 109.8Kansas 453 17.2 623 23.7 39 1.5 2,964 112.7Kentucky 115 0.6 20,401 102.9Louisiana 320 2.6 29 0.2 14,276 114.5Maine 1,379 38.9 4,814 135.7Maryl<strong>and</strong>Massachusetts 70 0.2 6 0.0 38,830 107.4Michigan 561 2.1 707 2.6 28,323 104.3Minnesota 55 0.7 8,060 105.7Mississippi 582 9.3 22 0.4 6,708 107.0Missouri 478 6.7 8,411 118.3Montana 352 19.8 4 0.2 1,997 112.5Nebraska 387 6.3 7,037 114.2Nevada 451 8.4 6,251 117.0New Hampshire 15 1.8 902 109.7New Jersey 96 0.8 14 0.1 12,004 102.8New Mexico 1,100 18.6 6,708 113.2New York 576 0.7 20,470 25.6 109,028 136.2North Carolina 87 0.3 229 0.8 9,724 34.2 28,422 100.0North Dakota 779 54.2 1,951 135.7Ohio 4,136 10.0 43,148 104.1Oklahoma 3,073 22.9 1 0.0 17,977 134.0Oregon 317 2.5 7,666 59.3 15,226 117.8Pennsylvania 56 1.3 4,249 101.7Puerto Rico 4,076 27.1 1,846 12.3 20,127 133.6Rhode Isl<strong>and</strong> 3 0.1 42 1.0 4,681 106.4South Carolina 137 1.3 18 0.2 12,407 114.9South Dakota 46 3.0 1,647 107.7Tennessee 73 0.4 21,139 110.2Texas 1,021 1.5 77,558 112.3Utah 5,664 43.4 2,629 20.2 15,361 117.8Vermont 8 0.9 884 102.7Virginia 75 1.1 1 0.0 7,304 107.0Washington 7,676 105.2West Virginia 2,046 24.5 668 8.0 9,902 118.7Wisconsin 41 0.5 2,176 25.4 9,009 105.0Wyoming 94 12.0 57 7.3 827 105.2Total 58,577 133,978 10,221 1,009,904Percent 6.6 15.1 1.2 114.1Number Reporting 49 49 26 26 5 5 51 51CHAPTER 3: <strong>Child</strong>ren 43
Table 3–7 <strong>Maltreatment</strong> Types of Victims by Report Source, <strong>2006</strong>REPORT SOURCENEGLECT PHYSICAL ABUSE MEDICAL NEGLECT SExUAL ABUSENUMBER % NUMBER % NUMBER % NUMBER %PROFESSIONALSEducational Personnel 61,099 10.8 34,240 24.2 3,217 16.9 8,991 11.5Legal, Law En<strong>for</strong>cement,Criminal JusticePersonnel 153,363 27.1 32,711 23.1 1,546 8.1 21,882 28.1Social Services Personnel 71,115 12.6 14,940 10.6 2,745 14.4 11,525 14.8Medical Personnel 52,217 9.2 17,063 12.1 5,558 29.2 7,330 9.4Mental Health Personnel 13,370 2.4 4,589 3.2 656 3.4 5,618 7.2<strong>Child</strong> Daycare Providers 2,821 0.5 1,822 1.3 110 0.6 294 0.4Foster Care Providers 1,979 0.3 622 0.4 83 0.4 804 1.0Total Professionals 355,964 62.9 105,987 74.9 13,915 73.1 56,444 72.4NONPROFESSIONALSAnonymous Reporters 39,927 7.1 4,659 3.3 1,035 5.4 1,639 2.1Other Reporters 46,353 8.2 7,224 5.1 1,071 5.6 5,464 7.0Other Relatives 46,841 8.3 8,145 5.8 1,385 7.3 4,254 5.5Parents 21,592 3.8 6,792 4.8 767 4.0 5,561 7.1Friends or Neighbors 29,081 5.1 3,593 2.5 634 3.3 1,673 2.1Unknown Reporters 23,317 4.1 3,873 2.7 141 0.7 2,064 2.6Alleged Victims 1,608 0.3 1,003 0.7 42 0.2 684 0.9Alleged Perpetrators 1,043 0.2 251 0.2 38 0.2 158 0.2Total Nonprofessionals 209,762 37.1 35,540 25.1 5,113 26.9 21,497 27.6Total 565,726 141,527 19,028 77,941Total Percent 100.0 100.0 100.0 100.0Number Reporting 50 50 50 50 39 39 50 50REPORT SOURCEPSYCHOLOGICALMALTREATMENTOTHER ABUSEUNKNOWNMALTREATMENTTOTALNUMBER % NUMBER % NUMBER % NUMBERPROFESSIONALSEducational Personnel 7,764 13.5 8,994 6.7 1,805 17.7 126,110Legal, Law En<strong>for</strong>cement,Criminal JusticePersonnel 18,720 32.6 50,645 37.8 1,981 19.4 280,848Social Services Personnel 5,072 8.8 17,395 13.0 1,720 16.8 124,512Medical Personnel 2,132 3.7 8,139 6.1 1,039 10.2 93,478Mental Health Personnel 3,468 6.0 2,376 1.8 22 0.2 30,099<strong>Child</strong> Daycare Providers 200 0.3 424 0.3 86 0.8 5,757Foster Care Providers 148 0.3 384 0.3 17 0.2 4,037Total Professionals 37,504 65.3 88,357 65.9 6,670 65.3 664,841NONPROFESSIONALSAnonymous Reporters 3,866 6.7 10,411 7.8 819 8.0 62,356Other Reporters 4,718 8.2 9,433 7.0 27 0.3 74,290Other Relatives 5,017 8.7 10,532 7.9 1,155 11.3 77,329Parents 2,609 4.5 7,599 5.7 588 5.8 45,508Friends or Neighbors 1,600 2.8 5,539 4.1 906 8.9 43,026Unknown Reporters 1,567 2.7 758 0.6 31,720Alleged Victims 440 0.8 604 0.5 56 0.5 4,437Alleged Perpetrators 92 0.2 743 0.6 2,325Total Nonprofessionals 19,909 34.7 45,619 34.1 3,551 34.7 340,991Total 57,413 133,976 10,221 1,005,832Total Percent 100.0 100.0 100.0Number Reporting 48 48 26 26 5 544 <strong>Child</strong> <strong>Maltreatment</strong> <strong>2006</strong>
Table 3–8 Sex of Victims, <strong>2006</strong> (continues on page 46)STATEBOYSPOPULATION NUMBER RATE PERCENTAlabama 569,693 3,868 6.8 41.2Alaska 93,616 1,654 17.7 47.5Arizona 833,054 2,114 2.5 47.3Arkansas 353,375 3,990 11.3 43.5Cali<strong>for</strong>nia 4,881,203 42,760 8.8 47.8Colorado 599,328 5,384 9.0 49.6Connecticut 418,647 4,944 11.8 48.6Delaware 103,967 931 9.0 48.2District of Columbia 57,989 1,383 23.8 50.1Florida 2,059,269 66,923 32.5 49.7Georgia 1,253,307 19,863 15.8 49.9Hawaii 154,398 978 6.3 47.8Idaho 202,396 820 4.1 49.7Illinois 1,644,077 13,522 8.2 48.7Indiana 808,588 9,536 11.8 45.6Iowa 364,353 7,280 20.0 49.9Kansas 356,861 1,139 3.2 43.3Kentucky 512,879 9,795 19.1 49.4Louisiana 557,078 6,123 11.0 49.1Maine 144,333 1,761 12.2 49.6Maryl<strong>and</strong>Massachusetts 740,637 17,534 23.7 48.5Michigan 1,269,277 13,360 10.5 49.2Minnesota 643,382 3,601 5.6 47.2Mississippi 387,296 2,817 7.3 44.9Missouri 724,624 3,033 4.2 42.7Montana 111,707 844 7.6 47.5Nebraska 227,697 2,998 13.2 48.7Nevada 324,811 2,698 8.3 50.5New Hampshire 152,152 381 2.5 46.4New Jersey 1,068,295 5,610 5.3 48.0New Mexico 259,161 2,946 11.4 49.7New York 2,309,646 39,488 17.1 49.3North Carolina 1,105,822 14,335 13.0 50.4North Dakota 74,357 748 10.1 52.0Ohio 1,415,611 19,419 13.7 46.9Oklahoma 458,280 6,570 14.3 49.0Oregon 438,459 6,173 14.1 47.8Pennsylvania 1,435,343 1,475 1.0 35.3Puerto Rico 520,558 7,140 13.7 47.4Rhode Isl<strong>and</strong> 121,649 2,142 17.6 48.7South Carolina 532,135 5,251 9.9 48.6South Dakota 99,992 701 7.0 45.8Tennessee 738,005 8,819 11.9 46.0Texas 3,318,089 33,033 10.0 47.8Utah 406,285 6,099 15.0 46.8Vermont 68,396 351 5.1 40.8Virginia 923,740 3,272 3.5 47.9Washington 783,021 3,551 4.5 48.7West Virginia 199,354 4,047 20.3 48.5Wisconsin 671,960 3,436 5.1 40.0Wyoming 62,559 387 6.2 49.2Total 37,560,711 427,027Rate 11.4Percent 48.2Number Reporting 51 51 51 51CHAPTER 3: <strong>Child</strong>ren 45
Table 3–8 Sex of Victims, <strong>2006</strong> (continued from page 45)STATEGIRLSUNKNOWN OR MISSINGPOPULATION NUMBER RATE % NUMBER %Alabama 544,608 5,486 10.1 58.5 24 0.3Alaska 87,818 1,775 20.2 51.0 52 1.5Arizona 795,144 2,349 3.0 52.6 6 0.1Arkansas 337,811 5,185 15.3 56.5 5 0.1Cali<strong>for</strong>nia 4,651,411 46,657 10.0 52.1 83 0.1Colorado 569,973 5,478 9.6 50.4 0 0.0Connecticut 399,639 5,204 13.0 51.1 26 0.3Delaware 99,399 1,000 10.1 51.7 2 0.1District of Columbia 56,892 1,374 24.2 49.8 2 0.1Florida 1,962,286 67,512 34.4 50.2 132 0.1Georgia 1,201,713 19,939 16.6 50.1 0 0.0Hawaii 143,683 1,060 7.4 51.8 7 0.3Idaho 191,884 831 4.3 50.3 0 0.0Illinois 1,571,167 14,035 8.9 50.6 199 0.7Indiana 769,041 11,338 14.7 54.2 51 0.2Iowa 345,841 7,307 21.1 50.1 2 0.0Kansas 338,976 1,491 4.4 56.7 0 0.0Kentucky 486,652 9,917 20.4 50.0 121 0.6Louisiana 532,923 6,349 11.9 50.9 0 0.0Maine 136,661 1,779 13.0 50.1 8 0.2Maryl<strong>and</strong>Massachusetts 708,247 17,850 25.2 49.4 767 2.1Michigan 1,209,079 13,788 11.4 50.8 0 0.0Minnesota 613,882 4,022 6.6 52.8 0 0.0Mississippi 372,109 3,451 9.3 55.0 4 0.1Missouri 691,968 4,075 5.9 57.3 0 0.0Montana 106,141 867 8.2 48.8 64 3.6Nebraska 217,336 3,160 14.5 51.3 2 0.0Nevada 309,709 2,635 8.5 49.3 12 0.2New Hampshire 145,473 441 3.0 53.6 0 0.0New Jersey 1,021,043 6,031 5.9 51.6 39 0.3New Mexico 249,769 2,912 11.7 49.1 68 1.1New York 2,204,696 40,330 18.3 50.4 259 0.3North Carolina 1,049,565 14,087 13.4 49.6 0 0.0North Dakota 70,577 688 9.7 47.8 2 0.1Ohio 1,354,424 21,980 16.2 53.0 50 0.1Oklahoma 435,754 6,842 15.7 51.0 2 0.0Oregon 417,800 6,754 16.2 52.2 0 0.0Pennsylvania 1,369,530 2,702 2.0 64.7 0 0.0Puerto Rico 498,093 7,685 15.4 51.0 241 1.6Rhode Isl<strong>and</strong> 115,802 2,253 19.5 51.2 5 0.1South Carolina 507,518 5,403 10.6 50.1 141 1.3South Dakota 94,689 813 8.6 53.2 15 1.0Tennessee 704,588 10,354 14.7 54.0 9 0.0Texas 3,175,876 35,879 11.3 51.9 153 0.2Utah 384,913 6,879 17.9 52.7 65 0.5Vermont 64,993 510 7.8 59.2 0 0.0Virginia 883,107 3,555 4.0 52.1 1 0.0Washington 743,246 3,741 5.0 51.3 2 0.0West Virginia 189,717 4,266 22.5 51.1 32 0.4Wisconsin 640,570 5,093 8.0 59.3 54 0.6Wyoming 59,235 398 6.7 50.6 1 0.1Total 35,832,971 455,510 2,708Rate 12.7Percent 51.5 0.3Number Reporting 51 51 51 51 51 5146 <strong>Child</strong> <strong>Maltreatment</strong> <strong>2006</strong>
Table 3–9 Age Group of Victims, <strong>2006</strong> (continues on page 48)STATEAGE < 1 AGE 1–3POPULATION VICTIMS RATE % POPULATION VICTIMS RATE %Alabama 60,926 986 16.2 11.1 178,683 1,616 9.0 18.2Alaska 10,120 398 39.3 11.6 29,940 658 22.0 19.2Arizona 98,407 527 5.4 11.8 288,966 1,053 3.6 23.6Arkansas 39,844 815 20.5 9.0 115,044 1,450 12.6 16.0Cali<strong>for</strong>nia 555,240 10,933 19.7 12.2 1,601,758 15,665 9.8 17.5Colorado 68,852 1,270 18.4 11.7 205,055 2,351 11.5 21.7Connecticut 36,077 1,189 33.0 11.7 124,402 1,903 15.3 18.8Delaware 11,335 210 18.5 10.9 34,284 374 10.9 19.4District of Columbia 7,671 326 42.5 11.8 20,829 326 15.7 11.8Florida 233,381 14,089 60.4 10.5 669,910 28,490 42.5 21.2Georgia 141,488 4,522 32.0 11.4 421,388 7,741 18.4 19.4Hawaii 17,529 397 22.6 19.5 52,840 359 6.8 17.7Idaho 23,031 263 11.4 15.9 68,229 338 5.0 20.5Illinois 176,773 3,915 22.1 14.1 534,411 6,060 11.3 21.8Indiana 86,304 2,418 28.0 11.6 260,004 3,826 14.7 18.3Iowa 39,179 1,674 42.7 11.5 115,368 3,552 30.8 24.3Kansas 39,459 175 4.4 6.7 116,428 499 4.3 19.1Kentucky 55,997 2,346 41.9 11.8 165,724 4,261 25.7 21.5Louisiana 62,336 1,366 21.9 11.2 179,507 2,545 14.2 20.8Maine 13,880 475 34.2 13.4 42,505 746 17.6 21.0Maryl<strong>and</strong>Massachusetts 77,183 3,587 46.5 10.0 232,739 6,538 28.1 18.1Michigan 123,873 4,077 32.9 15.0 385,127 4,851 12.6 17.9Minnesota 69,394 880 12.7 11.6 209,520 1,571 7.5 20.6Mississippi 43,394 621 14.3 9.9 125,196 1,056 8.4 16.9Missouri 78,424 482 6.1 6.8 232,487 1,307 5.6 18.4Montana 11,644 230 19.8 13.4 34,914 398 11.4 23.2Nebraska 26,097 688 26.4 11.2 77,045 1,426 18.5 23.3Nevada 37,901 964 25.4 18.0 109,948 1,177 10.7 22.0New Hampshire 13,987 103 7.4 12.6 44,423 134 3.0 16.4New Jersey 107,869 1,380 12.8 11.8 339,428 1,978 5.8 17.0New Mexico 28,978 731 25.2 12.8 85,085 997 11.7 17.5New York 244,832 6,867 28.0 8.6 734,257 12,824 17.5 16.0North Carolina 125,599 3,058 24.3 10.8 364,385 5,868 16.1 20.7North Dakota 8,261 121 14.6 8.4 23,745 278 11.7 19.3Ohio 146,341 4,184 28.6 10.1 442,336 7,938 17.9 19.3Oklahoma 52,417 2,079 39.7 15.5 152,040 3,122 20.5 23.3Oregon 45,608 1,797 39.4 13.9 138,950 2,883 20.7 22.3Pennsylvania 143,912 237 1.6 5.7 436,884 409 0.9 9.9Puerto Rico 49,929 945 18.9 6.5 149,555 2,280 15.2 15.6Rhode Isl<strong>and</strong> 12,241 528 43.1 12.0 37,590 877 23.3 20.0South Carolina 57,330 1,474 25.7 13.9 169,647 2,048 12.1 19.4South Dakota 11,464 238 20.8 15.6 33,023 382 11.6 25.1Tennessee 80,383 2,515 31.3 13.1 239,145 3,623 15.1 18.9Texas 394,904 9,524 24.1 13.8 1,153,713 16,193 14.0 23.5Utah 48,886 1,129 23.1 8.7 151,194 2,718 18.0 20.9Vermont 6,353 53 8.3 6.2 19,952 129 6.5 15.0Virginia 103,270 699 6.8 10.4 306,071 1,373 4.5 20.5Washington 80,683 1,101 13.6 15.3 246,653 1,548 6.3 21.5West Virginia 20,897 763 36.5 9.5 63,156 1,609 25.5 19.9Wisconsin 69,308 705 10.2 8.3 210,508 1,380 6.6 16.2Wyoming 6,797 88 12.9 11.2 20,314 212 10.4 27.0Total 4,105,988 100,142 12,194,305 172,940Rate 24.4 14.2Percent 11.4 19.6Number Reporting 51 51 51 51 51 51 51 51CHAPTER 3: <strong>Child</strong>ren 47
Table 3–9 Age Group of Victims, <strong>2006</strong> (continued from page 47)STATEAGE 4–7 AGE 8–11POPULATION VICTIMS RATE % POPULATION VICTIMS RATE %Alabama 242,259 1,889 7.8 21.3 242,078 1,607 6.6 18.1Alaska 38,124 878 23.0 25.7 38,302 710 18.5 20.7Arizona 362,386 1,128 3.1 25.2 347,246 785 2.3 17.6Arkansas 150,037 2,209 14.7 24.4 149,717 1,715 11.5 18.9Cali<strong>for</strong>nia 2,033,201 19,868 9.8 22.2 2,065,423 18,246 8.8 20.4Colorado 260,347 2,778 10.7 25.6 246,663 2,006 8.1 18.5Connecticut 173,414 2,440 14.1 24.1 184,608 1,956 10.6 19.3Delaware 43,793 518 11.8 26.8 43,444 374 8.6 19.4District of Columbia 24,432 606 24.8 22.0 23,477 583 24.8 21.2Florida 859,101 32,611 38.0 24.2 855,640 25,582 29.9 19.0Georgia 545,359 10,005 18.3 25.1 521,052 7,831 15.0 19.7Hawaii 63,775 388 6.1 19.1 62,318 347 5.6 17.1Idaho 85,866 395 4.6 23.9 83,659 295 3.5 17.9Illinois 700,053 6,947 9.9 25.0 701,338 5,348 7.6 19.3Indiana 343,131 4,887 14.2 23.4 343,039 3,881 11.3 18.6Iowa 151,031 3,808 25.2 26.1 153,366 2,628 17.1 18.0Kansas 151,931 694 4.6 26.5 149,870 551 3.7 21.1Kentucky 217,017 5,073 23.4 25.6 216,156 3,643 16.9 18.4Louisiana 237,599 3,038 12.8 24.8 232,933 2,355 10.1 19.2Maine 56,864 836 14.7 23.6 60,659 719 11.9 20.3Maryl<strong>and</strong>Massachusetts 310,353 8,442 27.2 23.4 315,937 7,425 23.5 20.6Michigan 525,820 6,008 11.4 22.1 545,967 5,142 9.4 18.9Minnesota 266,474 1,903 7.1 25.0 270,061 1,501 5.6 19.7Mississippi 164,876 1,579 9.6 25.2 162,613 1,271 7.8 20.3Missouri 302,251 1,637 5.4 23.1 304,748 1,421 4.7 20.0Montana 45,331 413 9.1 24.1 46,395 305 6.6 17.8Nebraska 96,006 1,595 16.6 26.1 94,059 1,117 11.9 18.3Nevada 139,565 1,282 9.2 24.0 137,617 941 6.8 17.6New Hampshire 60,725 166 2.7 20.3 66,097 159 2.4 19.4New Jersey 445,621 2,823 6.3 24.2 461,819 2,333 5.1 20.0New Mexico 110,401 1,455 13.2 25.5 108,259 1,184 10.9 20.8New York 957,601 17,911 18.7 22.4 979,526 16,590 16.9 20.7North Carolina 478,737 7,044 14.7 24.8 457,849 5,541 12.1 19.5North Dakota 29,906 349 11.7 24.3 31,237 293 9.4 20.4Ohio 593,582 10,310 17.4 25.0 605,315 7,734 12.8 18.8Oklahoma 195,903 3,363 17.2 25.1 190,662 2,335 12.2 17.4Oregon 185,203 3,379 18.2 26.1 187,320 2,420 12.9 18.7Pennsylvania 581,789 871 1.5 21.0 608,613 867 1.4 20.9Puerto Rico 220,338 3,868 17.6 26.4 236,767 3,380 14.3 23.1Rhode Isl<strong>and</strong> 49,146 1,041 21.2 23.7 52,157 867 16.6 19.8South Carolina 225,213 2,548 11.3 24.1 221,184 1,961 8.9 18.5South Dakota 41,182 360 8.7 23.7 41,022 266 6.5 17.5Tennessee 314,050 4,599 14.6 24.0 310,818 3,717 12.0 19.4Texas 1,450,876 18,278 12.6 26.5 1,376,402 12,445 9.0 18.0Utah 184,101 3,278 17.8 25.1 165,215 2,535 15.3 19.4Vermont 26,649 213 8.0 24.8 28,944 166 5.7 19.3Virginia 391,428 1,593 4.1 23.8 384,880 1,233 3.2 18.4Washington 326,739 1,786 5.5 24.8 332,501 1,371 4.1 19.0West Virginia 82,720 2,038 24.6 25.3 83,816 1,594 19.0 19.8Wisconsin 276,786 1,854 6.7 21.8 283,109 1,537 5.4 18.1Wyoming 25,579 212 8.3 27.0 25,603 131 5.1 16.7Total 15,844,671 213,194 15,837,500 170,944Rate 13.5 10.8Percent 24.2 19.4Number Reporting 51 51 51 51 51 51 51 5148 <strong>Child</strong> <strong>Maltreatment</strong> <strong>2006</strong>
STATEAGE 12–15 AGE 16–17POPULATION VICTIMS RATE % POPULATION VICTIMS RATE %TOTALVICTIMSAlabama 256,726 2,249 8.8 25.4 132,844 515 3.9 5.8 8,862Alaska 42,234 645 15.3 18.8 22,527 133 5.9 3.9 3,422Arizona 353,389 744 2.1 16.6 177,355 232 1.3 5.2 4,469Arkansas 155,080 2,153 13.9 23.8 80,870 711 8.8 7.9 9,053Cali<strong>for</strong>nia 2,187,243 18,087 8.3 20.2 1,087,628 6,618 6.1 7.4 89,417Colorado 257,135 1,896 7.4 17.5 130,929 538 4.1 5.0 10,839Connecticut 197,421 2,121 10.7 20.9 101,540 531 5.2 5.2 10,140Delaware 46,554 335 7.2 17.3 23,627 121 5.1 6.3 1,932District of Columbia 25,880 706 27.3 25.6 12,747 209 16.4 7.6 2,756Florida 919,557 24,783 27.0 18.4 480,884 8,995 18.7 6.7 134,550Georgia 544,614 7,586 13.9 19.1 279,219 2,117 7.6 5.3 39,802Hawaii 67,614 388 5.7 19.1 33,934 152 4.5 7.5 2,031Idaho 87,543 256 2.9 15.5 45,795 104 2.3 6.3 1,651Illinois 730,280 4,288 5.9 15.5 370,800 1,191 3.2 4.3 27,749Indiana 360,833 4,672 12.9 22.4 184,245 1,219 6.6 5.8 20,903Iowa 164,402 2,196 13.4 15.1 86,093 730 8.5 5.0 14,588Kansas 156,029 544 3.5 20.8 82,049 154 1.9 5.9 2,617Kentucky 227,374 3,432 15.1 17.3 117,069 1,073 9.2 5.4 19,828Louisiana 248,350 2,346 9.4 19.2 128,759 592 4.6 4.8 12,242Maine 69,263 619 8.9 17.5 37,777 151 4.0 4.3 3,546Maryl<strong>and</strong>Massachusetts 335,908 7,556 22.5 21.0 175,119 2,494 14.2 6.9 36,042Michigan 591,095 5,433 9.2 20.0 304,646 1,637 5.4 6.0 27,148Minnesota 288,824 1,365 4.7 17.9 152,160 397 2.6 5.2 7,617Mississippi 173,371 1,352 7.8 21.6 89,502 376 4.2 6.0 6,255Missouri 327,548 1,735 5.3 24.5 170,461 513 3.0 7.2 7,095Montana 51,478 288 5.6 16.8 28,002 82 2.9 4.8 1,716Nebraska 99,431 1,000 10.1 16.3 52,231 293 5.6 4.8 6,119Nevada 140,397 764 5.4 14.3 69,247 215 3.1 4.0 5,343New Hampshire 73,256 198 2.7 24.2 38,666 59 1.5 7.2 819New Jersey 484,924 2,295 4.7 19.7 248,496 842 3.4 7.2 11,651New Mexico 115,974 1,047 9.0 18.4 59,962 289 4.8 5.1 5,703New York 1,049,790 19,193 18.3 24.0 545,228 6,608 12.1 8.3 79,993North Carolina 482,012 5,536 11.5 19.5 245,658 1,369 5.6 4.8 28,416North Dakota 33,761 303 9.0 21.1 18,086 94 5.2 6.5 1,438Ohio 647,542 8,313 12.8 20.2 333,333 2,750 8.3 6.7 41,229Oklahoma 199,875 1,945 9.7 14.5 103,183 554 5.4 4.1 13,398Oregon 195,107 1,952 10.0 15.1 103,468 496 4.8 3.8 12,927Pennsylvania 674,097 1,296 1.9 31.3 356,909 459 1.3 11.1 4,139Puerto Rico 243,441 3,229 13.3 22.1 118,882 929 7.8 6.3 14,631Rhode Isl<strong>and</strong> 56,791 789 13.9 18.0 29,368 285 9.7 6.5 4,387South Carolina 238,759 2,050 8.6 19.4 126,155 499 4.0 4.7 10,580South Dakota 44,229 222 5.0 14.6 23,609 53 2.2 3.5 1,521Tennessee 327,847 3,479 10.6 18.2 168,918 1,223 7.2 6.4 19,156Texas 1,411,362 10,149 7.2 14.7 707,561 2,397 3.4 3.5 68,986Utah 159,145 2,480 15.6 19.0 82,229 894 10.9 6.9 13,034Vermont 32,910 210 6.4 24.4 18,249 89 4.9 10.3 860Virginia 409,416 1,319 3.2 19.7 210,549 490 2.3 7.3 6,707Washington 355,232 1,118 3.1 15.5 184,182 292 1.6 4.0 7,216West Virginia 90,929 1,584 17.4 19.6 47,448 478 10.1 5.9 8,066Wisconsin 308,401 2,275 7.4 26.7 163,172 759 4.7 8.9 8,510Wyoming 28,273 114 4.0 14.5 15,059 28 1.9 3.6 785Total 16,768,646 170,635 8,606,429 54,029 881,884Rate 10.2 6.3Percent 19.3 6.1Number Reporting 51 51 51 51 51 51 51 51 51CHAPTER 3: <strong>Child</strong>ren 49
Table 3–10 Victims by Age Group <strong>and</strong> <strong>Maltreatment</strong> Type, <strong>2006</strong>AGE GROUP VICTIMSNEGLECT PHYSICAL ABUSE MEDICAL NEGLECT SExUAL ABUSENUMBER % NUMBER % NUMBER % NUMBER %Age
Table 3–11 Race <strong>and</strong> Ethnicity of Victims, <strong>2006</strong> (continues on page 52)STATEAFRICAN-AMERICAN AMERICAN INDIAN OR ALASKA NATIVEPOPULATION NUMBER RATE % POPULATION NUMBER RATE %Alabama 349,239 1,739 5.0 18.5 4,637 3 0.6 0.0Alaska 6,184 233 37.7 6.7 33,498 1,694 50.6 48.7Arizona 58,036 298 5.1 6.7 88,516 217 2.5 4.9Arkansas 136,498 1,918 14.1 20.9 4,922 12 2.4 0.1Cali<strong>for</strong>nia 610,803 11,599 19.0 13.0 44,367 623 14.0 0.7Colorado 49,308 863 17.5 7.9 8,482 78 9.2 0.7Connecticut 93,569 2,256 24.1 22.2 2,334 12 5.1 0.1Delaware 51,144 778 15.2 40.2 528 2 3.8 0.1District of Columbia 81,321 1,637 20.1 59.3 182 0 0.0 0.0Florida 842,779 40,203 47.7 29.9 11,407 184 16.1 0.1Georgia 832,899 16,397 19.7 41.2 4,930 5 1.0 0.0Hawaii 7,114 25 3.5 1.2 1,173 6 5.1 0.3Idaho 2,059 20 9.7 1.2 5,375 78 14.5 4.7Illinois 574,682 9,207 16.0 33.2 4,805 22 4.6 0.1Indiana 173,168 3,387 19.6 16.2 3,129 19 6.1 0.1Iowa 23,971 1,335 55.7 9.2 2,845 151 53.1 1.0Kansas 48,013 351 7.3 13.3 6,453 33 5.1 1.3Kentucky 90,454 2,768 30.6 14.0 1,783 12 6.7 0.1Louisiana 418,235 5,340 12.8 42.8 7,077 31 4.4 0.2Maine 3,351 48 14.3 1.4 1,920 44 22.9 1.2Maryl<strong>and</strong>Massachusetts 112,171 4,523 40.3 12.5 3,095 37 12.0 0.1Michigan 430,214 9,155 21.3 33.7 13,878 214 15.4 0.8Minnesota 80,048 1,618 20.2 21.2 18,499 561 30.3 7.4Mississippi 337,954 2,907 8.6 46.3 4,108 5 1.2 0.1Missouri 205,219 1,545 7.5 21.7 5,827 26 4.5 0.4Montana 1,018 13 12.8 0.7 21,382 303 14.2 17.1Nebraska 25,122 862 34.3 14.0 5,427 356 65.6 5.8Nevada 53,628 1,070 20.0 20.0 6,661 32 4.8 0.6New Hampshire 3,584 21 5.9 2.6 604 2 3.3 0.2New Jersey 322,544 3,728 11.6 31.9 3,056 11 3.6 0.1New Mexico 9,224 138 15.0 2.3 57,114 462 8.1 7.8New York 798,402 23,045 28.9 28.8 15,027 309 20.6 0.4North Carolina 539,340 8,986 16.7 31.6 28,355 671 23.7 2.4North Dakota 1,549 58 37.4 4.0 12,857 317 24.7 22.0Ohio 411,366 10,998 26.7 26.5 4,987 115 23.1 0.3Oklahoma 82,622 1,558 18.9 11.6 89,104 1,057 11.9 7.9Oregon 17,728 663 37.4 5.1 11,599 643 55.4 5.0PennsylvaniaPuerto RicoRhode Isl<strong>and</strong> 16,415 540 32.9 12.3 1,577 27 17.1 0.6South Carolina 354,023 4,067 11.5 37.7 3,526 17 4.8 0.2South Dakota 2,396 44 18.4 2.9 27,295 785 28.8 51.3Tennessee 305,571 4,863 15.9 25.4 3,368 32 9.5 0.2Texas 794,702 11,198 14.1 16.2 18,378 66 3.6 0.1Utah 6,707 404 60.2 3.1 9,793 317 32.4 2.4Vermont 1,153 18 15.6 2.1 377 0 0.0 0.0Virginia 407,330 2,354 5.8 34.5 3,964 6 1.5 0.1Washington 58,729 607 10.3 8.3 26,090 536 20.5 7.3West Virginia 14,972 282 18.8 3.4 630 3 4.8 0.0Wisconsin 111,108 1,792 16.1 20.9 14,418 223 15.5 2.6Wyoming 1,035 18 17.4 2.3 3,947 12 3.0 1.5Total 9,958,701 197,477 653,306 10,371Weighted Rate 19.8 15.9Weighted Percent 22.8 1.2Number Reporting 49 49 49 49 49 49 49 49CHAPTER 3: <strong>Child</strong>ren 51
Table 3–11 Race <strong>and</strong> Ethnicity of Victims, <strong>2006</strong> (continued from page 51)STATEASIANHISPANICPOPULATION NUMBER RATE % POPULATION NUMBER RATE %Alabama 9,494 10 1.1 0.1 40,038 300 7.5 3.2Alaska 7,497 43 5.7 1.2 14,655 121 8.3 3.5Arizona 31,435 24 0.8 0.5 675,311 1,595 2.4 35.7Arkansas 7,555 18 2.4 0.2 52,816 583 11.0 6.4Cali<strong>for</strong>nia 946,506 2,413 2.5 2.7 4,599,190 44,075 9.6 49.2Colorado 28,669 78 2.7 0.7 324,322 3,967 12.2 36.5Connecticut 28,301 79 2.8 0.8 127,567 2,835 22.2 27.9Delaware 5,450 1 0.2 0.1 20,042 231 11.5 12.0District of Columbia 1,909 8 4.2 0.3 11,072 145 13.1 5.3Florida 86,559 557 6.4 0.4 960,055 18,344 19.1 13.6Georgia 63,079 136 2.2 0.3 248,840 2,654 10.7 6.7Hawaii 84,102 250 3.0 12.2 35,491 51 1.4 2.5Idaho 3,381 1 0.3 0.1 54,435 266 4.9 16.1Illinois 118,200 151 1.3 0.5 657,233 2,994 4.6 10.8Indiana 18,752 31 1.7 0.1 106,624 1,245 11.7 5.9Iowa 11,634 115 9.9 0.8 43,715 822 18.8 5.6Kansas 14,539 4 0.3 0.2 88,829 102 1.1 3.9Kentucky 9,786 20 2.0 0.1 27,982 424 15.2 2.1Louisiana 14,699 37 2.5 0.3 32,676 101 3.1 0.8Maine 3,093 7 2.3 0.2 4,019 33 8.2 0.9Maryl<strong>and</strong>Massachusetts 72,157 601 8.3 1.7 167,338 7,934 47.4 21.9Michigan 59,400 77 1.3 0.3 138,933 863 6.2 3.2Minnesota 58,032 176 3.0 2.3 73,291 726 9.9 9.5Mississippi 5,575 6 1.1 0.1 16,000 101 6.3 1.6Missouri 19,597 12 0.6 0.2 56,171 225 4.0 3.2Montana 1,270 2 1.6 0.1 8,151 82 10.1 4.6Nebraska 7,039 39 5.5 0.6 51,054 600 11.8 9.7Nevada 31,228 58 1.9 1.1 222,749 1,333 6.0 24.9New Hampshire 5,854 6 1.0 0.7 9,709 51 5.3 6.2New Jersey 154,347 106 0.7 0.9 397,241 797 2.0 6.8New Mexico 5,156 2 0.4 0.0 269,425 3,068 11.4 51.8New York 282,205 839 3.0 1.0 913,325 18,036 19.7 22.5North Carolina 42,258 89 2.1 0.3 215,231 2,637 12.3 9.3North Dakota 1,115 3 2.7 0.2 3,554 114 32.1 7.9Ohio 40,887 69 1.7 0.2 90,769 639 7.0 1.5Oklahoma 13,082 22 1.7 0.2 92,891 1,696 18.3 12.6Oregon 30,601 123 4.0 1.0 142,110 1,934 13.6 15.0PennsylvaniaPuerto RicoRhode Isl<strong>and</strong> 6,962 66 9.5 1.5 42,176 924 21.9 21.0South Carolina 11,577 12 1.0 0.1 49,110 362 7.4 3.4South Dakota 1,501 0 0.0 0.0 6,435 96 14.9 6.3Tennessee 19,642 41 2.1 0.2 66,566 707 10.6 3.7Texas 184,856 271 1.5 0.4 2,922,573 29,977 10.3 43.4Utah 12,016 76 6.3 0.6 109,965 2,858 26.0 21.9Vermont 1,601 3 1.9 0.3 1,834 6 3.3 0.7Virginia 82,059 48 0.6 0.7 151,634 513 3.4 7.5Washington 90,402 97 1.1 1.3 222,298 1,215 5.5 16.7West Virginia 2,319 8 3.4 0.1 4,378 102 23.3 1.2Wisconsin 37,034 93 2.5 1.1 93,860 577 6.1 6.7Wyoming 688 4 5.8 0.5 11,729 85 7.2 10.8Total 2,775,100 6,932 14,675,412 159,146Weighted Rate 2.5 10.8Weighted Percent 0.8 18.4Number Reporting 49 49 49 49 49 49 49 4952 <strong>Child</strong> <strong>Maltreatment</strong> <strong>2006</strong>
STATEMULTIPLE RACE PACIFIC ISLANDERPOPULATION NUMBER RATE % POPULATION NUMBER RATE %Alabama 16,474 39 2.4 0.4 268 0 0.0 0.0Alaska 15,003 84 5.6 2.4 1,373 43 31.3 1.2Arizona 37,781 140 3.7 3.1 2,332 12 5.1 0.3Arkansas 13,354 490 36.7 5.3 754 10 13.3 0.1Cali<strong>for</strong>nia 304,902 2,907 9.5 3.2 31,314 292 9.3 0.3Colorado 32,717 296 9.0 2.7 1,126 19 16.9 0.2Connecticut 18,238 484 26.5 4.8 302 6 19.9 0.1Delaware 5,509 26 4.7 1.3 70 0 0.0 0.0District of Columbia 2,239 17 7.6 0.6 40 0 0.0 0.0Florida 78,586 2,101 26.7 1.6 2,057 118 57.4 0.1Georgia 44,854 473 10.5 1.2 1,147 9 7.8 0.0Hawaii 85,930 774 9.0 37.8 31,186 391 12.5 19.1Idaho 8,908 33 3.7 2.0 434 1 2.3 0.1Illinois 750 11 14.7 0.0Indiana 33,799 970 28.7 4.6 437 6 13.7 0.0Iowa 15,168 170 11.2 1.2 293 41 139.9 0.3Kansas 21,168 81 3.8 3.1 354 2 5.6 0.1Kentucky 19,937 554 27.8 2.8 358 11 30.7 0.1Louisiana 15,239 62 4.1 0.5 320 3 9.4 0.0Maine 5,451 59 10.8 1.7 49 3 61.2 0.1Maryl<strong>and</strong>Massachusetts 30,239 1,012 33.5 2.8 544 10 18.4 0.0Michigan 596 0 0.0 0.0Minnesota 38,166 739 19.4 9.7 562 3 5.3 0.0Mississippi 8,798 60 6.8 1.0 113 2 17.7 0.0Missouri 1,157 1 0.9 0.0Montana 6,311 73 11.6 4.1 94 2 21.3 0.1Nebraska 9,932 51 5.1 0.8 185 4 21.6 0.1Nevada 25,388 352 13.9 6.6 2,821 43 15.2 0.8New Hampshire 5,254 9 1.7 1.1 102 1 9.8 0.1New Jersey 610 2 3.3 0.0New Mexico 9,780 134 13.7 2.3 320 8 25.0 0.1New York 85,926 1,882 21.9 2.4 1,957 31 15.8 0.0North Carolina 43,748 750 17.1 2.6 1,058 112 105.9 0.4North Dakota 101 0 0.0 0.0Ohio 69,213 495 7.2 1.2 737 15 20.4 0.0Oklahoma 53,680 2,389 44.5 17.8 730 11 15.1 0.1Oregon 2,451 40 16.3 0.3PennsylvaniaPuerto RicoRhode Isl<strong>and</strong> 5,910 209 35.4 4.8 152 2 13.2 0.0South Carolina 17,958 436 24.3 4.0 349 6 17.2 0.1South Dakota 5,302 82 15.5 5.4 87 1 11.5 0.1Tennessee 589 14 23.8 0.1Texas 96,279 1,855 19.3 2.7 3,799 26 6.8 0.0Utah 18,208 224 12.3 1.7 6,887 218 31.7 1.7Vermont 2,414 4 1.7 0.5 23 0 0.0 0.0Virginia 54,476 287 5.3 4.2 854 7 8.2 0.1Washington 7,641 30 3.9 0.4West Virginia 7,208 359 49.8 4.3 75 2 26.7 0.0Wisconsin 402 8 19.9 0.1Wyoming 2,676 3 1.1 0.4 65 0 0.0 0.0Total 1,372,123 21,165 110,025 1,577Weighted Rate 15.4 14.3Weighted Percent 2.4 0.2Number Reporting 40 40 40 40 49 49 49 49CHAPTER 3: <strong>Child</strong>ren 53
Table 3–11 Race <strong>and</strong> Ethnicity of Victims, <strong>2006</strong> (continued from page 53)STATEWHITETOTALVICTIMSPOPULATION NUMBER RATE % NUMBERAlabama 694,151 3,262 4.7 34.8 9,378Alaska 103,224 1,184 11.5 34.0 3,481Arizona 734,787 2,012 2.7 45.0 4,469Arkansas 475,287 6,096 12.8 66.4 9,180Cali<strong>for</strong>nia 2,995,532 23,599 7.9 26.4 89,500Colorado 724,677 5,469 7.5 50.3 10,862Connecticut 547,975 4,240 7.7 41.7 10,174Delaware 120,623 890 7.4 46.0 1,933District of Columbia 18,118 15 0.8 0.5 2,759Florida 2,040,112 72,316 35.4 53.7 134,567Georgia 1,259,271 19,922 15.8 50.1 39,802Hawaii 53,085 245 4.6 12.0 2,045Idaho 319,688 1,222 3.8 74.0 1,651Illinois 1,798,466 14,847 8.3 53.5 27,756Indiana 1,241,720 15,108 12.2 72.2 20,925Iowa 612,568 9,440 15.4 64.7 14,589Kansas 516,481 2,008 3.9 76.3 2,630Kentucky 849,231 14,351 16.9 72.4 19,833Louisiana 601,755 6,668 11.1 53.5 12,472Maine 263,111 2,301 8.7 64.9 3,548Maryl<strong>and</strong>Massachusetts 1,063,340 16,364 15.4 45.3 36,151Michigan 1,768,446 16,456 9.3 60.6 27,148Minnesota 988,666 3,546 3.6 46.5 7,623Mississippi 386,857 2,756 7.1 43.9 6,272Missouri 1,094,530 5,198 4.7 73.1 7,108Montana 179,622 962 5.4 54.2 1,775Nebraska 346,274 3,770 10.9 61.2 6,160Nevada 292,045 2,353 8.1 44.0 5,345New Hampshire 272,518 679 2.5 82.6 822New Jersey 1,172,495 4,078 3.5 34.9 11,680New Mexico 157,911 1,413 8.9 23.8 5,926New York 2,417,500 28,188 11.7 35.2 80,077North Carolina 1,285,397 14,821 11.5 52.1 28,422North Dakota 122,100 930 7.6 64.7 1,438Ohio 2,152,076 27,251 12.7 65.7 41,449Oklahoma 561,925 6,668 11.9 49.7 13,414Oregon 617,254 7,538 12.2 58.3 12,927PennsylvaniaPuerto RicoRhode Isl<strong>and</strong> 164,259 2,442 14.9 55.5 4,400South Carolina 603,110 5,661 9.4 52.4 10,795South Dakota 151,665 461 3.0 30.2 1,529Tennessee 1,020,433 12,042 11.8 62.8 19,182Texas 2,473,378 23,931 9.7 34.6 69,065Utah 627,622 8,850 14.1 67.9 13,043Vermont 125,987 804 6.4 93.4 861Virginia 1,106,530 3,453 3.1 50.6 6,828Washington 1,039,826 4,550 4.4 62.4 7,294West Virginia 359,489 7,005 19.5 83.9 8,345Wisconsin 1,027,332 4,775 4.6 55.6 8,583Wyoming 101,654 591 5.8 75.2 786Total 39,650,103 422,731 866,002Weighted Rate 10.7Weighted Percent 48.8Number Reporting 49 49 49 49 4954 <strong>Child</strong> <strong>Maltreatment</strong> <strong>2006</strong>
Table 3–12 Race of Victims by <strong>Maltreatment</strong> Type, <strong>2006</strong>RACENEGLECT PHYSICAL ABUSE MEDICAL NEGLECTNUMBER % NUMBER % NUMBER %African-American 94,178 51.9 23,458 12.9 2,585 1.4American IndianAlaska Native 5,685 59.7 612 6.4 83 0.9Asian 3,421 52.3 956 14.6 35 0.5Native Hawaiian orPacific Isl<strong>and</strong>er 481 32.2 170 11.4 9 0.6White 197,395 51.5 37,483 9.8 2,607 0.7Multiple Race 11,074 58.5 1,531 8.1 131 0.7Hispanic 86,523 54.4 15,322 9.6 1,449 0.9Unknown or Missing 24,913 55.3 5,792 12.9 401 0.9Total 423,670 85,324 7,300Percent 52.6 10.6 0.9RACESExUALABUSEPSYCHOLOGICAL,OTHER, OR UNKNOWNMALTREATMENTMULTIPLEMALTREATMENTSTOTALNUMBER % NUMBER % NUMBER % NUMBERAfrican-American 9,966 5.5 28,067 15.5 23,294 12.8 181,548American IndianAlaska Native 388 4.1 1,389 14.6 1,358 14.3 9,515Asian 319 4.9 922 14.1 882 13.5 6,535Native Hawaiian orPacific Isl<strong>and</strong>er 74 5.0 540 36.2 219 14.7 1,493White 30,113 7.9 57,694 15.0 58,058 15.1 383,350Multiple Race 717 3.8 2,411 12.7 3,068 16.2 18,932Hispanic 9,816 6.2 23,119 14.5 22,803 14.3 159,032Unknown or Missing 4,157 9.2 4,469 9.9 5,341 11.8 45,073Total 55,550 118,611 115,023 805,478Percent 6.9 14.7 14.3Based on data from 50 States.CHAPTER 3: <strong>Child</strong>ren 55
Table 3–13 Living Arrangement of Victims, <strong>2006</strong>VICTIM LIVING WITHVICTIMSNUMBER %Married parents 45,443 19.7Married parent <strong>and</strong> stepparent 3,925 1.7Unmarried parents 9,981 4.3Parent <strong>and</strong> cohabitating partner 10,256 4.5Both parents, marital status unknown 49,691 21.6Single parent, mother only 61,455 26.7Single parent, father only 6,534 2.8Single parent, mother & other adult 11,321 4.9Single parent, father & other adult 1,484 0.6Nonparental relative caregiver 9,146 4.0Nonrelative caregiver 16,790 7.3Group home or residential facility 1,681 0.7Other setting 2,510 1.1Total 230,217Percent 100.0Based on data from 28 States.56 <strong>Child</strong> <strong>Maltreatment</strong> <strong>2006</strong>
Table 3–14 Victims with a Reported Disability, <strong>2006</strong> (continues on page 58)STATETOTALVICTIMSMENTALRETARDATIONEMOTIONALLYDISTURBEDVISUALLYOR HEARINGIMPAIREDLEARNINGDISABILITYNUMBER % NUMBER % NUMBER % NUMBER %Alabama 9,378 90 1.0 137 1.5 32 0.3 128 1.4Alaska 3,481 14 0.4 28 0.8 3 0.1 4 0.1Arizona 4,469 13 0.3 65 1.5 169 3.8 122 2.7Arkansas 9,180 86 0.9 96 1.1 85 0.9 379 4.1Cali<strong>for</strong>nia 89,500 348 0.4 1,756 2.0 744 0.8 74 0.1Colorado 10,862 3 0.0 4 0.0 7 0.1 5 0.1Connecticut 10,174 61 0.6 212 2.1 51 0.5 520 5.1Delaware 1,933 29 1.5 207 10.7 8 0.4 81 4.2District of Columbia 2,759 33 1.2Florida 134,567 597 0.4 1,822 1.4 482 0.4GeorgiaHawaii 2,045 14 0.7 62 3.0 17 0.8 2 0.1Idaho 1,651 3 0.2 160 9.7 24 1.5 22 1.3Illinois 27,756 42 0.2 182 0.7 18 0.1 149 0.5Indiana 20,925 301 1.4 993 4.8 61 0.3 358 1.7IowaKansas 2,630 15 0.6 114 4.3 2 0.1 11 0.4Kentucky 19,833 35 0.2 94 0.5 21 0.1 84 0.4LouisianaMaine 3,548 3 0.1 444 12.5 1 0.0 3 0.1Maryl<strong>and</strong>Massachusetts 36,151 35 0.1 205 0.6 42 0.1 236 0.7MichiganMinnesota 7,623 206 2.7 516 6.8 36 0.5 99 1.3Mississippi 6,272 46 0.7 47 0.8 16 0.3 148 2.4Missouri 7,108 19 0.3 323 4.5 9 0.1 111 1.6Montana 1,775 4 0.2 143 8.1 12 0.7 69 3.9Nebraska 6,160 77 1.3 762 12.4 34 0.6 260 4.2Nevada 5,345 101 1.9 160 3.0 3 0.1 5 0.1New Hampshire 822 78 9.5 135 16.4 9 1.1 53 6.5New Jersey 11,680 6 0.1 135 1.2 11 0.1 119 1.0New Mexico 5,926 19 0.3 256 4.3 15 0.3 61 1.0New YorkNorth CarolinaNorth Dakota 1,438 42 2.9 526 36.6Ohio 41,449 34 0.1 421 1.0 35 0.1 588 1.4Oklahoma 13,414 79 0.6 376 2.8 38 0.3 222 1.7Oregon 12,927 19 0.2 43 0.3 27 0.2 141 1.1PennsylvaniaPuerto Rico 15,066 182 1.2 347 2.3 59 0.4 716 4.8Rhode Isl<strong>and</strong> 4,400 26 0.6 252 5.7 23 0.5 74 1.7South Carolina 10,795 83 0.8 154 1.4 47 0.4South Dakota 1,529 10 0.7 30 2.0 8 0.5 61 4.0Tennessee 19,182 31 0.2 121 0.6 21 0.1 69 0.4Texas 69,065 96 0.1 59 0.1 116 0.2 305 0.4Utah 13,043 202 1.6 914 7.0 44 0.3 123 0.9Vermont 861 1 0.1 19 2.2 2 0.2 4 0.5Virginia 6,828 10 0.2 25 0.4 4 0.1Washington 7,294 52 0.7 116 1.6 11 0.2 71 1.0West Virginia 8,345 16 0.2 223 2.7 85 1.0Wisconsin 8,583 51 0.6 168 2.0 18 0.2 94 1.1Wyoming 786 15 1.9 13 1.7 2 0.3 27 3.4Total 678,558 3,194 12,898 2,367 5,683Percent 0.5 1.9 0.3 0.8Number Reporting 44 43 43 44 44 41 41 39 39CHAPTER 3: <strong>Child</strong>ren 57
Table 3–14 Victims with a Reported Disability, <strong>2006</strong> (continued from page 57)STATEPHYSICALLYDISABLEDBEHAVIOR PROBLEMOTHER MEDICALCONDITIONVICTIMS WITHREPORTEDDISABILITYNUMBER % NUMBER % NUMBER % NUMBER %Alabama 33 0.4 486 5.2 220 2.4 915 9.8Alaska 3 0.1 87 2.5 16 0.5 126 3.6Arizona 1 0.0 187 4.2 636 14.2 876 19.6Arkansas 47 0.5 1,058 11.5 496 5.4 1,478 16.1Cali<strong>for</strong>nia 340 0.4 185 0.2 6,812 7.6 10,200 11.4Colorado 13 0.1 114 1.1 42 0.4 174 1.6Connecticut 39 0.4 306 3.0 229 2.3 970 9.5Delaware 8 0.4 71 3.7 196 10.1 380 19.7District of Columbia 198 7.2 228 8.3Florida 647 0.5 622 0.5 2,128 1.6 4,172 3.1GeorgiaHawaii 10 0.5 2,033 99.4 140 6.9 2,033 99.4Idaho 41 2.5 289 17.5 263 15.9 469 28.4Illinois 46 0.2 55 0.2 432 1.6Indiana 226 1.1 2,773 13.3 190 0.9 3,907 18.7IowaKansas 18 0.7 2 0.1 138 5.3Kentucky 29 0.2 245 1.2 104 0.5 400 2.0LouisianaMaine 4 0.1 9 0.3 9 0.3 461 13.0Maryl<strong>and</strong>Massachusetts 39 0.1 64 0.2 583 1.6 877 2.4MichiganMinnesota 73 1.0 1,224 16.1 318 4.2 1,764 23.1Mississippi 3 0.1 324 5.2 562 9.0 714 11.4Missouri 128 1.8 141 2.0 97 1.4 638 9.0Montana 8 0.5 87 4.9 73 4.1 264 14.9Nebraska 65 1.1 609 9.9 354 5.8 1,300 21.1Nevada 100 1.9 128 2.4 5 0.1 333 6.2New Hampshire 17 2.1 43 5.2 134 16.3 288 35.0New Jersey 45 0.4 271 2.3 285 2.4 735 6.3New Mexico 18 0.3 60 1.0 213 3.6 457 7.7New YorkNorth CarolinaNorth Dakota 562 39.1Ohio 25 0.1 1,892 4.6 420 1.0 2,923 7.1Oklahoma 65 0.5 222 1.7 541 4.0 858 6.4Oregon 12 0.1 736 5.7 882 6.8PennsylvaniaPuerto Rico 70 0.5 1,115 7.4 334 2.2 2,168 14.4Rhode Isl<strong>and</strong> 11 0.3 212 4.8 168 3.8 573 13.0South Carolina 56 0.5 1,523 14.1 700 6.5 2,160 20.0South Dakota 12 0.8 161 10.5 93 6.1 287 18.8Tennessee 28 0.2 301 1.6 152 0.8 634 3.3Texas 81 0.1 1,220 1.8 800 1.2 2,677 3.9Utah 107 0.8 1,049 8.0 169 1.3 2,144 16.4Vermont 4 0.5 7 0.8 33 3.8Virginia 3 0.0 105 1.5 28 0.4 127 1.9Washington 16 0.2 70 1.0 274 3.8West Virginia 12 0.1 494 5.9 672 8.1Wisconsin 27 0.3 17 0.2 204 2.4 377 4.4Wyoming 2 0.3 37 4.7 47 6.0 114 14.5Total 2,532 20,500 18,093 52,194Percent 0.4 3.0 2.7 7.7Number Reporting 42 42 38 38 41 41 44 4458 <strong>Child</strong> <strong>Maltreatment</strong> <strong>2006</strong>
Table 3–15 Factors Associated with Victimization, <strong>2006</strong>FACTOR CATEGORIESODDS RATIO ASSOCIATEDWITH VICTIMIZATION(N=2,064,472)PRIOR VICTIMNo 1.00Yes 1.43 ***TYPE OF MALTREATMENTPhysical Abuse 1.00Neglect 1.69 ***Sexual Abuse 1.98 ***Psychological Abuse, Other, Unknown 1.64 ***Multiple Forms of <strong>Maltreatment</strong> 3.72 ***DISABLED CHILDNo 1.00Yes 1.54 ***CHILD AGE
Table 3–16 Absence of <strong>Maltreatment</strong> Recurrence, 2004–<strong>2006</strong>STATEPERCENT2004PERCENT2005PERCENT<strong>2006</strong>Alabama 98.1 98.1Alaska 92.0 92.6Arizona 97.0 96.9 97.4Arkansas 95.5 94.1 95.3Cali<strong>for</strong>nia 91.2 91.6 92.6Colorado 96.0 96.1 95.7Connecticut 91.1 91.6 92.8Delaware 98.0 97.1 98.4District of Columbia 87.4 94.7 93.0Florida 90.8 88.7 89.1Georgia 93.0 95.3Hawaii 95.5 97.3 97.3Idaho 93.9 96.2 96.1Illinois 92.4 92.2 92.7Indiana 93.7 92.7 92.3Iowa 90.0 90.6 90.1Kansas 93.5 94.6 96.8Kentucky 92.2 93.0 93.0Louisiana 93.5 93.4 94.1Maine 91.8 91.6 93.7Maryl<strong>and</strong> 93.0 92.8Massachusetts 89.4 89.4 88.0Michigan 94.5 95.4 94.8Minnesota 94.8 94.4 94.7Mississippi 95.5 94.7 94.3Missouri 91.5 93.4 94.4Montana 93.5 92.8 94.6Nebraska 91.2 90.1 90.8Nevada 94.7 93.4 93.8New Hampshire 95.4 94.0 97.2New Jersey 95.0 95.1 93.9New Mexico 90.0 91.4 91.0New York 86.0 87.3 86.3North Carolina 92.1 93.3 95.6North Dakota 97.0Ohio 92.5 93.2 92.7Oklahoma 91.8 91.4 91.9Oregon 93.5Pennsylvania 97.1 97.2 97.8Puerto Rico 98.0Rhode Isl<strong>and</strong> 92.2 91.1 87.3South Carolina 97.8 97.2 97.4South Dakota 93.1 93.6 95.3Tennessee 96.4 91.9 91.7Texas 96.0 95.9 95.7Utah 92.8 93.4 93.5Vermont 95.5 96.0 94.8Virginia 97.0 97.6 98.0Washington 90.4 89.9 92.0West Virginia 88.9 86.6 88.7Wisconsin 92.6 93.9Wyoming 96.9 95.5 96.1Number Reporting 45 49 51Number Met St<strong>and</strong>ard 17 17 23Percent 37.8 34.7 45.160 <strong>Child</strong> <strong>Maltreatment</strong> <strong>2006</strong>
Table 3–17 Factors Associated with <strong>Maltreatment</strong> Recurrence, <strong>2006</strong>FACTOR CATEGORIESRISK RATIO ASSOCIATEDWITH RECURRENCE(N=233,325)PRIOR VICTIMNo 1.00Yes 1.96 ***DISABILITYNo 1.00Yes 1.52 ***TYPE OF MALTREATMENTPhysical Abuse 1.00Neglect 1.30 ***Sexual Abuse 0.99Psychological <strong>Maltreatment</strong> , Other , Unknown 1.49 ***Multiple <strong>Maltreatment</strong>s 1.24 ***POSTINVESTIGATION SERVICESNone 1.00In-Home Services 1.14 ***Foster Care Services 1.57 ***CHILD AGE
Table 3–18 Victims by Perpetrator Relationship, <strong>2006</strong>PERPETRATORVICTIMSNUMBER %Mother Only 284,326 39.9Father Only 125,353 17.6Mother <strong>and</strong> Father 126,992 17.8Mother <strong>and</strong> Other 43,175 6.1Father <strong>and</strong> Other 7,015 1.0Female Partner of Parent 1,247 0.2Male Partner of Parent 13,146 1.8Female Legal Guardian 1,116 0.2Male Legal Guardian 278 0.0Relative 34,675 4.9Foster Parent (Relative) 320 0.0Foster Parent (Nonrelative) 1,133 0.2Foster Parent (Unknown Relationship) 768 0.1Residential Facility Staff 1,185 0.2Daycare Staff 3,615 0.5Other Professional 903 0.1Friend or Neighbor 2,940 0.4More than One Nonparental Perpetrator 10,133 1.4Unknown or Missing 53,876 7.6Total 712,196Percent 100.0Based on data from 47 States.62 <strong>Child</strong> <strong>Maltreatment</strong> <strong>2006</strong>
Table 3–19 Victims by <strong>Maltreatment</strong> Types <strong>and</strong> Perpetrator Relationship, <strong>2006</strong>MALTREATMENT TYPEPARENT OTHER RELATIVE FOSTER PARENTRESIDENTIALFACILITY STAFFNUMBER % NUMBER % NUMBER % NUMBER %Physical Abuse 72,141 76.8 6,814 7.3 563 0.6 328 0.3Neglect 479,429 86.7 24,782 4.5 2,244 0.4 768 0.1Sexual Abuse 17,235 26.2 19,113 29.1 207 0.3 168 0.3Psychological<strong>Maltreatment</strong>,Other, or Unknown 80,105 80.7 4,712 4.7 323 0.3 164 0.2Multiple <strong>Maltreatment</strong>s 82,674 80.0 5,627 5.4 508 0.5 282 0.3Total 731,584 61,048 3,845 1,710Percent 79.9 6.7 0.4 0.2MALTREATMENT TYPECHILD DAYCAREPROVIDERUNMARRIED PARTNEROF PARENTLEGAL GUARDIANOTHERPROFESSIONALSNUMBER % NUMBER % NUMBER % NUMBER %Physical Abuse 746 0.8 5,772 6.1 262 0.3 334 0.4Neglect 2,864 0.5 14,890 2.7 1,563 0.3 322 0.1Sexual Abuse 1,167 1.8 3,979 6.1 73 0.1 312 0.5Psychological<strong>Maltreatment</strong>,Other, or Unknown 187 0.2 6,257 6.3 137 0.1 61 0.1Multiple <strong>Maltreatment</strong>s 357 0.3 3,827 3.7 286 0.3 98 0.1Total 5,321 34,725 2,321 1,127Percent 0.6 3.8 0.3 0.1MALTREATMENT TYPEFRIENDS ORNEIGHBORSOTHERUNKNOWN ORMISSINGNUMBER % NUMBER % NUMBER %TOTALVICTIMS%Physical Abuse 661 0.7 3,156 3.4 3,199 3.4 93,976 100.0Neglect 635 0.1 10,447 1.9 15,122 2.7 553,066 100.0Sexual Abuse 2,860 4.4 16,001 24.4 4,547 6.9 65,662 100.0Psychological<strong>Maltreatment</strong>,Other, or Unknown 154 0.2 3,499 3.5 3,614 3.6 99,213 100.0Multiple <strong>Maltreatment</strong>s 352 0.3 4,153 4.0 5,223 5.1 103,387 100.0Total 4,662 37,256 31,705 915,304Percent 0.5 4.1 3.5 100.0Based on data from 47 States.CHAPTER 3: <strong>Child</strong>ren 63
Table 3–20 Absence of <strong>Maltreatment</strong> in Foster Care, 2004–<strong>2006</strong>STATEPERCENT2004PERCENT2005PERCENT<strong>2006</strong>Alabama 99.86 99.72Alaska 99.01 99.09Arizona 99.70 99.88 99.79Arkansas 99.80 99.77 99.45Cali<strong>for</strong>nia 99.69 99.56 99.57Colorado 99.31 99.13 99.42Connecticut 99.39Delaware 99.81 99.88 99.95District of Columbia 99.72 99.66 99.79Florida 99.54 99.46 99.45GeorgiaHawaii 99.30 99.20 99.13Idaho 99.69 99.81 99.58Illinois 99.41 99.46 99.47Indiana 99.33 99.30 99.05Iowa 99.63 99.68 99.71Kansas 99.48 99.87 99.89Kentucky 99.62 99.47 99.77Louisiana 99.41 99.41Maine 99.72 99.70 99.97Maryl<strong>and</strong>Massachusetts 98.87 98.73 99.05Michigan 99.69 99.88 99.80Minnesota 99.70 99.58 99.61Mississippi 99.51 99.50 99.23Missouri 99.47 99.64 99.66Montana 99.77 99.64 99.67Nebraska 99.82 99.57 99.52Nevada 99.79 99.81 99.89New HampshireNew Jersey 99.21 99.37 99.39New Mexico 99.66 99.62New York 99.29 98.90 98.72North Carolina 99.01 99.18 99.25North DakotaOhio 99.68 99.57 99.54Oklahoma 98.84 98.82 98.95Oregon 99.34Pennsylvania 99.80 99.81 99.81Puerto Rico 99.82Rhode Isl<strong>and</strong> 98.68 98.41 98.51South Carolina 99.51 99.43 99.82South Dakota 99.89 99.72 100.00Tennessee 99.15 99.27Texas 99.74 99.45 99.68Utah 99.47 99.58 99.72Vermont 99.27 99.86 99.95Virginia 99.61 99.75 99.64Washington 99.64 99.73 99.57West VirginiaWisconsin 99.46 99.71Wyoming 99.82Number Reporting 37 43 47Number Met St<strong>and</strong>ard 16 15 19Percent Met St<strong>and</strong>ard 43.24 34.88 40.4364 <strong>Child</strong> <strong>Maltreatment</strong> <strong>2006</strong>
FatalitiesCHAPTER 4<strong>Child</strong> fatalities are the most tragic consequence of maltreatment. The collection of accurate dataregarding fatalities attributed to child abuse <strong>and</strong> neglect is challenging <strong>and</strong> requires coordinationamong many agencies. According to a recent article, “the ambiguity involved in investigation<strong>and</strong> determining the cause of a child’s death often prevents accurate estimates of deathfrom maltreatment.” 1 The NCANDS case-level data are from public child protective services(CPS) agencies <strong>and</strong>, there<strong>for</strong>e, do not include in<strong>for</strong>mation <strong>for</strong> deaths that are not investigated bya CPS agency. Recognizing that the data from CPS agencies may be underestimated, NCANDSalso recommends to States that they work with their health departments, vital statistics departments,medical examiners offces, <strong>and</strong> their fatality review teams to obtain in<strong>for</strong>mation aboutother deaths <strong>and</strong> report these data in the Agency File. 2 During Federal fiscal year (FFY) <strong>2006</strong>:■ There were an estimated 1,530 child fatality victims;■ Approximately one-fifth (17.6%) of child fatality data were reported from agencies other thanchild welfare; <strong>and</strong>■ More than three-quarters (78.0%) of child fatality victims were younger than 4 years.In this chapter, national estimates of the number <strong>and</strong> rate of child maltreatment deaths per100,000 children are provided. The characteristics of these fatality victims also are discussed.Number of <strong>Child</strong> FatalitiesDuring FFY <strong>2006</strong>, an estimated 1,530 children (compared to 1,460 children <strong>for</strong> FFY 2005) diedfrom abuse or neglect—at a rate of 2.04 deaths per 100,000 children. 3 The national estimate wasbased on data from State child welfare in<strong>for</strong>mation systems, as well as other data sources availableto the States. The rate of 2.04 is an increase from the rate <strong>for</strong> FFY 2005 of 1.96 per 100,000children. 4 This increase can be attributed to better reporting practices <strong>and</strong> is not necessarily anincrease in the number of fatalities.While most fatality data were obtained from State child welfare agencies, many agencies alsoreceived data from additional sources. For FFY <strong>2006</strong>, nearly one-fifth (17.6%) of fatalities were1 Hochstadt, N. “<strong>Child</strong> death review teams: A vital component of child protection.” <strong>Child</strong> Welfare, Vol. LXXXV, No. 4,653–670, <strong>2006</strong>.2 Another issue is the lag in determining cause of death. Some deaths that appear suspicious may not be firmly determinedto be caused by child abuse or neglect <strong>for</strong> several months or even years, if final determination is made throughthe court process. States report to NCANDS deaths that received dispositions in the reporting year, while the cause ofdeath may have been determined by an agency other than CPS.3 Supporting data are provided in table 4–1, which is located at the end of this chapter. An FFY <strong>2006</strong> national estimateof 1,530 fatalities was derived by multiplying the national weighted rate of 2.04 by the national child population(74,754,213) <strong>and</strong> dividing by 100,000. The estimate was then rounded to the nearest 10.4 See table 4–2.CHAPTER 4: Fatalities 65
4–712-17reported through the Agency File, which includes fatalities reported by health departments <strong>and</strong>fatality review boards. The coordination of data collection with other agencies contributes to afuller underst<strong>and</strong>ing of the size of the phenomenon, as well as to better estimation.Figure 4–1 Age of Fatalities, <strong>2006</strong>4–7 years11.9%8–11 years4.8%12–17 years5.4%Based on data from table 4–3.
<strong>Maltreatment</strong> Types of <strong>Child</strong> FatalitiesThe three main categories of maltreatment related to fatalities were neglect (41.1%), combinationsof maltreatments (31.4%), <strong>and</strong> physical abuse (22.4%) (figure 4–3). 9 Medical neglect accounted <strong>for</strong>1.9 percent of fatalities.Figure 4–3 <strong>Maltreatment</strong> Types of <strong>Child</strong> Fatalities, <strong>2006</strong>MALTREATMENT TYPENeglect41.1Multiple <strong>Maltreatment</strong> Types31.4Physical AbusePsychological Abuse,Other, or UnkownMedical Neglect1.92.922.4Sexual Abuse0.30% 10% 20% 30% 40% 50%Based on data in table 4–6.PERCENTAGEPrior CPS Contact of <strong>Child</strong> FatalitiesSome children who died from maltreatment were already known to CPS agencies. <strong>Child</strong>renwhose families had received family preservation services in the past 5 years accounted <strong>for</strong> 13.7percent of child fatalities. Slightly more than 2 percent (2.3%) of the child fatalities had been infoster care <strong>and</strong> were reunited with their families in the past 5 years. 10Tables <strong>and</strong> NotesThe following pages contain the tables referenced in Chapter 4. Unless otherwise explained,a blank indicates that the State did not submit usable data. Specific in<strong>for</strong>mation about Statesubmissions can be found in appendix D. Additional in<strong>for</strong>mation regarding methodologies thatwere used to create the tables are provided below.Table 4–2■ This table reflects data resubmissions from States <strong>and</strong>, there<strong>for</strong>e, may display differentnumbers from prior <strong>Child</strong> <strong>Maltreatment</strong> reports.■ Fatality rates were computed by dividing the number of child fatalities by the population ofreporting States <strong>and</strong> multiplying by 100,000.■ Estimated child fatalities were computed by multiplying the fatality rate by the national childpopulation <strong>and</strong> dividing by 100,000. The estimate was then rounded to the nearest 10.9 See table 4–610 See table 4–7.CHAPTER 4: Fatalities 67
Table 4–3■ These are fatalities reported only in the <strong>Child</strong> Files <strong>and</strong> are, there<strong>for</strong>e, a subset of total fatalities.■ If a State did not include the age <strong>and</strong> sex of a child fatality victim, that fatality was not included in this analysis. Table 4–4■ The category multiple race includes a combination of two or more race categories.Table 4–5■ Race categories are mutually exclusive.■ The categories “mother <strong>and</strong> other” <strong>and</strong> “father <strong>and</strong> other” include victims with one perpetratoridentified as a mother or father <strong>and</strong> a second perpetrator identified as a nonparent.Table 4–6■ The category multiple maltreatment types includes a combination of any two or more typesof maltreatment. The category of “other or unknown” abuse includes psychological abuse.Table 4–7■ The percentage of child fatalities among children receiving family preservation servicesduring the past 5 years was computed by dividing the number of children who died in <strong>2006</strong>while receiving family preservation services by the total number of fatalities in the Statesreporting fatalities among children receiving family preservation services.■ The percentage of child fatalities among children receiving family reunification servicesduring the past 5 years was computed by dividing the number of children who died in <strong>2006</strong>while receiving family reunification services by the total number of fatalities in the Statesreporting fatalities among children receiving family reunification services.68 <strong>Child</strong> <strong>Maltreatment</strong> <strong>2006</strong>
Table 4–1 <strong>Child</strong> Fatalities, 2005–<strong>2006</strong> (continues on page 70)2005STATECHILDPOPULATIONCHILD FILEOR SDCFATALITIESAGENCYFILEFATALITIESTOTALCHILDFATALITIESFATALITIESPER 100,000CHILDRENAlabama 1,107,079 22 2 24 2.17Alaska 182,990 3 3 1.64Arizona 1,574,856 22 22 1.40Arkansas 684,044 16 16 2.34Cali<strong>for</strong>nia 9,532,676 140 140 1.47Colorado 1,153,869 20 20 1.73Connecticut 830,770 9 9 1.08Delaware 202,195 0 0 0 0.00District of Columbia 116,098 2 0 2 1.72Florida 3,968,247 117 0 117 2.95Georgia 2,400,364 76 76 3.17Hawaii 298,637 2 0 2 0.67Idaho 386,653 0 0 0.00Illinois 3,225,149 68 0 68 2.11Indiana 1,573,346 28 1 29 1.84Iowa 709,859 9 0 9 1.27Kansas 696,417 6 0 6 0.86Kentucky 995,888 29 0 29 2.91Louisiana 1,167,629 21 21 1.80Maine 285,170 0 1 1 0.35Maryl<strong>and</strong> 1,369,633 28 28 2.04Massachusetts 1,463,169 8 8 0.55Michigan 2,509,307 48 48 1.91Minnesota 1,260,953 15 0 15 1.19Mississippi 762,072 14 0 14 1.84Missouri 1,414,887 42 42 2.97Montana 218,731 2 0 2 0.91Nebraska 445,087 4 2 6 1.35Nevada 613,756 4 13 17 2.77New Hampshire 301,727 2 2 0.66New Jersey 2,105,574 30 30 1.42New Mexico 506,377 7 5 12 2.37New York 4,565,760 75 75 1.64North CarolinaNorth Dakota 146,437 0 0 0.00Ohio 2,790,677 83 0 83 2.97Oklahoma 886,369 41 41 4.63Oregon 849,598 18 18 2.12Pennsylvania 2,821,095 40 0 40 1.42Puerto Rico 1,031,914 4 4 0.39Rhode Isl<strong>and</strong> 241,839 5 0 5 2.07South Carolina 1,030,036 18 5 23 2.23South Dakota 194,619 5 5 2.57Tennessee 1,428,285 34 0 34 2.38Texas 6,337,618 197 0 197 3.11Utah 775,353 10 10 1.29Vermont 135,814 0 0 0 0.00Virginia 1,803,450 26 26 1.44Washington 1,519,924 9 9 0.59West Virginia 389,162 7 9 16 4.11Wisconsin 1,320,899 13 13 0.98Wyoming 121,519 2 2 1.65Total 72,453,577 1,117 302 1,419Weighted Rate 1.96Number Reporting 51 43 33 51 51CHAPTER 4: Fatalities 69
Table 4–1 <strong>Child</strong> Fatalities, 2005–<strong>2006</strong> (continued from page 69)<strong>2006</strong>STATECHILDPOPULATIONCHILD FILEOR SDCFATALITIESAGENCYFILEFATALITIESTOTALCHILDFATALITIESFATALITIESPER 100,000CHILDRENAlabama 1,114,301 24 0 24 2.15Alaska 181,434 0 2 2 1.10Arizona 1,628,198 16 16 0.98Arkansas 691,186 19 19 2.75Cali<strong>for</strong>nia 9,532,614 140 140 1.47Colorado 1,169,301 24 24 2.05Connecticut 818,286 3 3 0.37Delaware 203,366 0 1 1 0.49District of Columbia 114,881 2 0 2 1.74Florida 4,021,555 140 0 140 3.48Georgia 2,455,020 63 63 2.57Hawaii 298,081 4 4 1.34Idaho 394,280 1 1 0.25Illinois 3,215,244 58 0 58 1.80Indiana 1,577,629 31 11 42 2.66Iowa 710,194 6 0 6 0.84Kansas 695,837 5 0 5 0.72Kentucky 999,531 36 0 36 3.60Louisiana 1,090,001 37 37 3.39Maine 280,994 0 1 1 0.36Maryl<strong>and</strong>MassachusettsMichiganMinnesota 1,257,264 14 0 14 1.11Mississippi 759,405 4 0 4 0.53Missouri 1,416,592 43 43 3.04Montana 217,848 1 0 1 0.46Nebraska 445,033 3 12 15 3.37Nevada 634,520 11 3 14 2.21New Hampshire 297,625 1 2 3 1.01New Jersey 2,089,338 31 1 32 1.53New Mexico 508,930 7 7 14 2.75New York 4,514,342 73 73 1.62North CarolinaNorth Dakota 144,934 1 1 2 1.38Ohio 2,770,035 74 0 74 2.67Oklahoma 894,034 26 26 2.91Oregon 856,259 17 17 1.99Pennsylvania 2,804,873 33 0 33 1.18Puerto Rico 1,018,651 5 5 0.49Rhode Isl<strong>and</strong> 237,451 0 0 0 0.00South Carolina 1,039,653 10 9 19 1.83South Dakota 194,681 1 1 0.51Tennessee 1,442,593 22 22 1.53Texas 6,493,965 257 257 3.96Utah 791,198 13 0 13 1.64Vermont 133,389 0 0 0 0.00Virginia 1,806,847 20 20 1.11Washington 1,526,267 21 21 1.38West Virginia 389,071 6 9 15 3.86Wisconsin 1,312,530 13 13 0.99Wyoming 121,794 1 1 0.82Total 67,311,055 1,134 242 1,376Weighted Rate 2.04Number Reporting 48 44 31 48 4870 <strong>Child</strong> <strong>Maltreatment</strong> <strong>2006</strong>
Table 4–2 <strong>Child</strong> Fatality Rates per 100,000 <strong>Child</strong>ren, 2002–<strong>2006</strong>REPORTINGYEARSTATESREPORTINGPOPULATION OFREPORTING STATESREPORTEDFATALITIESRATE PER100,000CHILDRENNATIONAL CHILDPOPULATION(52 STATES)ESTIMATEDCHILDFATALITIES2002 51 72,905,828 1,453 1.99 73,979,203 1,4702003 50 71,029,617 1,372 1.93 74,144,319 1,4302004 49 71,031,007 1,441 2.03 74,339,840 1,5102005 51 72,453,577 1,419 1.96 74,566,154 1,460<strong>2006</strong> 48 67,311,055 1,376 2.04 74,754,213 1,530Table 4–3 Age <strong>and</strong> Sex of <strong>Child</strong> Fatalities, <strong>2006</strong>BOYSGIRLSAGEPOPULATIONNUMBERRATE PER100,000 POPULATION NUMBERRATE PER100,000
Table 4–4 Race <strong>and</strong> Ethnicity of<strong>Child</strong> Fatalities, <strong>2006</strong>Table 4–5 Perpetrator Relationshipsto <strong>Child</strong> Fatalities, <strong>2006</strong>vCHILD FATALITIESCHILD FATALITIESRACENUMBER %RELATIONSHIP TO CHILDNUMBER %White 473 43.0African-American 324 29.4Hispanic 187 17.0Unable to Determine or Missing 81 7.4Other or Multiple Race 14 1.3Asian 12 1.1American Indian orAlaska Native 9 0.8Pacific Isl<strong>and</strong>er 1 0.1Total 1,101Percent 100.1Based on data from 38 States.Table 4–6 <strong>Maltreatment</strong> Types of<strong>Child</strong> Fatalities, <strong>2006</strong>MALTREATMENT TYPECHILD FATALITIESNUMBER %Neglect 466 41.1Multiple <strong>Maltreatment</strong> Types 356 31.4Physical Abuse 254 22.4Other, or Unknown 33 2.9Medical Neglect 22 1.9Sexual Abuse 3 0.3Mother 288 27.4Mother <strong>and</strong> Other 121 11.5Father 138 13.1Father <strong>and</strong> Other 16 1.5Mother <strong>and</strong> Father 235 22.4Female Relative 31 3.0Male Relative 17 1.6Female Foster Parent (Relative) 0 0.0Male Foster Parent (Relative) 0 0.0Female Partner of Parent 0 0.0Male Partner of Parent 30 2.9Female Legal Guardian 1 0.1Male Legal Guardian 0 0.0Foster Parent (Nonrelative) 5 0.5Foster ParentUnknown Relationship 4 0.4Staff Group Home 4 0.4Daycare Staff 32 3.0Other Professional 0 0.0Friend or Neighbor 2 0.2More than OneNonparental Perpetrator 26 2.5Unknown or Missing 100 9.5Total 1,050Percent 100.0Based on data from 36 States.Total 1,134Percent 100.0Based on data from 39 States.72 <strong>Child</strong> <strong>Maltreatment</strong> <strong>2006</strong>
Table 4–7 Prior CPS Contact of <strong>Child</strong> Fatalities, <strong>2006</strong>STATETOTALCHILDFATALITIESFATALITY VICTIMS WHOSEFAMILIES RECEIVEDPRESERVATION SERVICESIN THEPAST 5 YEARSTOTALCHILDFATALITIESFATALITY VICTIMSWHO HAD BEENREUNITED WITHTHEIR FAMILIESIN THE PAST5 YEARSAlabama 24 5 24 1Alaska 2 0 2 0ArizonaArkansas 19 5 19 0Cali<strong>for</strong>niaColoradoConnecticutDelaware 1 0 1 0District of Columbia 2 0 2 0Florida 140 52 140 4GeorgiaHawaii 4 0Idaho 1 0 1 0Illinois 58 0 58 0IndianaIowa 6 0 6 0Kansas 5 1 5 0Kentucky 36 0 36 0Louisiana 37 4 37 1Maine 1 0 1 0Maryl<strong>and</strong>MassachusettsMichiganMinnesota 14 0 14 0Mississippi 4 0 4 2Missouri 43 2 43 1Montana 1 0 1 0Nebraska 15 5 15 3Nevada 14 0 14 0New Hampshire 3 0 3 0New Jersey 32 12 32 1New Mexico 14 1 14 0New YorkNorth CarolinaNorth DakotaOhio 74 16 74 2Oklahoma 26 4 26 0Oregon 17 2 17 0PennsylvaniaPuerto Rico 5 0Rhode Isl<strong>and</strong> 0 0 0 0South CarolinaSouth Dakota 1 1 1 0TennesseeTexas 257 9 257 4Utah 13 0 13 0Vermont 0 0 0 0VirginiaWashington 21 2 21 1West Virginia 15 2 15 0Wisconsin 13 1Wyoming 1 0 1 0Total 897 123 919 21Percent 13.7 2.3Number Reporting 33 33 36 36CHAPTER 4: Fatalities 73
74 <strong>Child</strong> <strong>Maltreatment</strong> <strong>2006</strong>
PerpetratorsCHAPTER 5The National <strong>Child</strong> Abuse <strong>and</strong> Neglect Data System (NCANDS) defines a perpetrator as aperson who is considered responsible <strong>for</strong> the maltreatment of a child. Thus, this chapter providesdata about only those perpetrators of child abuse victims <strong>and</strong> does not include data aboutalleged perpetrators.Given the definition of child abuse <strong>and</strong> neglect, which largely pertains to caregivers, not topersons unknown to a child, most perpetrators of child maltreatment are parents. Also includedare relatives, foster parents, <strong>and</strong> residential facility staff. During Federal fiscal year (FFY) <strong>2006</strong>:■ Nearly 80 percent (79.9%) of perpetrators were parents of the victim;■ Approximately 60 percent (60.4%) of perpetrators were found to have neglected children; <strong>and</strong>■ Approximately 58 percent (57.9%) of perpetrators were women, <strong>and</strong> 42 percent (42.1%) ofperpetrators were men.For the analyses in this chapter, a perpetrator may be counted multiple times if he or she hasmaltreated more than one child. 1 This chapter presents data about the demographic characteristicsof perpetrators, the relationship of perpetrators to their victims, <strong>and</strong> the types of maltreatmentthey committed.Figure 5–1 Age <strong>and</strong> Sex of Perpetrators,<strong>2006</strong>Characteristics of PerpetratorsFor FFY <strong>2006</strong>, 57.9 percent of the perpetratorswere women <strong>and</strong> 42.1 percent were men. 2PERCENTAGE IN AGE CATEGORY ■ 4950%41.340%36.2 36.728.930%21.320%13.910% 6.27.44.04.00%MenWomenSEXBased on data from table 5–1. N=50 States.Women typically were younger than men. Themedian age of women was 31 years <strong>and</strong> 34 years<strong>for</strong> men. Of the women who were perpetrators,more than 40 percent (45.3%) were younger than30 years of age, compared>49with one-third of themen (35.1%) (figure 5–1).40-4930-39The racial distribution of perpetrators was20-29similar to the race of their victims. During FFY
Nearly 80 percent (79.9%) of perpetrators were parents. 4 Other relatives accounted <strong>for</strong> anadditional 6.7 percent. Unmarried partners of parents accounted <strong>for</strong> 3.8 percent (figure 5–2).Of the parents who were perpetrators, more than 90 percent (91.5%) were biological parents,4.2 percent were stepparents, <strong>and</strong> 0.7 percent were adoptive parents. 5Figure 5–2 Perpetrators by Relationshipto Victims, <strong>2006</strong>BCD E G H I JFKMore than one-half (60.4%) of all perpetratorswere found to have neglected children. 6 Slightlymore than 10 percent (10.3%) of perpetratorsphysically abused children, <strong>and</strong> 7.0 percentsexually abused children. More than 11 percent(11.5%) of all perpetrators were associated withmore than one type of maltreatment.A Parent 79.9%B Other Relative 6.7%C Foster Parent 0.4%D Residential Facility Staff 0.2%E <strong>Child</strong> Daycare Provider 0.6%F Unmarried Partner of Parent 3.8%AParent 79.9%Based on data from table 5–3. N=47 States.G Legal Guardian 0.3%H Other Professionals 0.1%I Friends or Neighbors 0.5%J Other 4.1%K Unknown or Missing 3.5%Tables <strong>and</strong> NotesThe following pages contain the data tablesreferenced in Chapter 5. Unless otherwiseexplained, a blank indicates that the Statedid not submit usable data. Specific in<strong>for</strong>mationabout State submissions can be found inappendix D. Additional in<strong>for</strong>mation regardingmethodologies that were used to create thetables is provided below.Table 5–1■ Percentages are based on only those perpetrators <strong>for</strong> whom the age <strong>and</strong> sex were provided.Table 5–3■ States that did not provide data or report perpetrator relationship <strong>for</strong> at least 79 percent ofperpetrators were excluded from this analysis.■ The category of “other” includes scout leader, sports coach, <strong>and</strong> clergy member.Table 5–4■ States that did not provide data or report perpetrator relationship <strong>for</strong> at least 79 percent ofperpetrators were excluded from this analysis.■ States that did not provide data on type of parent, including those States where the parentaltype was more than 90 percent unknown, were excluded from this analysis.Table 5–5■ The category of neglect includes medical neglect.■ The category of multiple maltreatment types includes a combination of any two or more types of maltreatment. ■ The category of psychological maltreatment, “other,” or unknown includes only victims witha single type of maltreatment.4 See table 5–3.5 See table 5–4.6 See table 5–5.76 <strong>Child</strong> <strong>Maltreatment</strong> <strong>2006</strong>
Table 5–1 Age <strong>and</strong> Sex of Perpetrators, <strong>2006</strong>AGEMEN WOMEN TOTALNUMBER % NUMBER % NUMBER %< 20 22,980 6.2 20,659 4.0 43,639 4.920–29 107,996 28.9 212,419 41.3 320,415 36.130–39 135,153 36.2 188,489 36.7 323,642 36.540–49 79,358 21.3 71,643 13.9 151,001 17.0> 49 27,627 7.4 20,806 4.0 48,433 5.5Total 373,114 100.0 514,016 100.0 887,130 100.0Weighted Percent 42.1 57.9 100.0Based on data from 50 States.Men median age = 34Women median age = 31Total median age = 32Table 5–2 Race <strong>and</strong> Ethnicity of Perpetrators, <strong>2006</strong>RACEPERPETRATORSNUMBER %White 469,145 53.7African-American 180,633 20.7Hispanic 170,208 19.5Unable to Determine or Missing 24,076 2.8American Indian or Alaska Native 12,315 1.4Asian 8,250 0.9Multiple Race 7,785 0.9Pacific Isl<strong>and</strong>er 2,012 0.2Total 874,424Percent 100.0Based on data from 50 States.CHAPTER 5: Perpetrators 77
Table 5–3 Perpetrators by Relationship to Victims, <strong>2006</strong>NONPARENTAL PERPETRATORSTATEPARENTOTHERRELATIVEFOSTERPARENTRESIDENTIALFACILITYSTAFFCHILDDAYCAREPROVIDERUNMARRIEDPARTNER OFPARENTAlabama 8,069 1,729 29 18 60 596Alaska 3,947 127 42 1 162Arizona 4,822 383 36 31 171Arkansas 7,656 1,063 15 31 65Cali<strong>for</strong>nia 86,400 5,118 445 186 304Colorado 10,610 1,049 90 38 83 24Connecticut 9,918 474 50 24 28 432Delaware 1,768 104 1 1 8 167District of Columbia 2,484 165 6 5 2Florida 52,986 4,594 332 109 632 5,705GeorgiaHawaii 2,700 111 62 5Idaho 1,953 32 15 1 56Illinois 24,771 2,602 133 34 642 2,598Indiana 19,319 2,120 146 111 20 1,303Iowa 14,355 815 29 21 184 847Kansas 2,190 422 12 6Kentucky 18,092 1,230 66 3 81 1,336LouisianaMaine 3,831 133 2 4 331Maryl<strong>and</strong>Massachusetts 40,251 1,907 154 87 139 3,363Michigan 33,668 1,105 71 3 10 1,167Minnesota 7,606 808 45 27 116 660Mississippi 6,102 657 46 5 5 208Missouri 5,737 844 49 45 58 759Montana 1,706 62 4 7 8 89Nebraska 6,497 458 59 32 76 411Nevada 5,643 95 15 1New HampshireNew Jersey 11,054 670 119 38 115 514New Mexico 5,983 392 36 236New York 88,677 5,984 438 397 373 312North Carolina 14,271 780 63 85 91 692North Dakota 1,739 65 136Ohio 35,854 3,906 136 39 238 2,171Oklahoma 18,944 961 331 221 43Oregon 12,417 1,937 122 4 1 869Pennsylvania 2,322 643 27 61 631 524Puerto Rico 14,350 319 54 4 5 15Rhode Isl<strong>and</strong> 4,786 124 58 29 26South Carolina 12,300 833 14 2 47 667South Dakota 1,714 52 7 17 65Tennessee 16,450 3,551 96 71 181 241Texas 74,562 9,167 174 84 647 5,104Utah 11,509 1,556 11 1 92 854Vermont 588 101 1 1 57Virginia 6,014 569 32 20 247 189Washington 8,797 352 128 16 57 501West VirginiaWisconsin 5,302 852 46 18 98 829Wyoming 870 27 5 3 11 17Total 731,584 61,048 3,845 1,710 5,321 34,725Weighted Percent 79.9 6.7 0.4 0.2 0.6 3.8Number Reporting 47 47 45 41 39 4178 <strong>Child</strong> <strong>Maltreatment</strong> <strong>2006</strong>
NONPARENTAL PERPETRATORSTATELEGALGUARDIANOTHERPROFESSIONALSFRIENDS ORNEIGHBORSOTHERUNKNOWNOR MISSINGTOTALPERPETRATORSAlabama 18 1,962 210 12,691Alaska 29 81 7 4,396Arizona 30 10 5,483Arkansas 47 21 1,520 1,012 11,430Cali<strong>for</strong>nia 661 5,116 886 99,116Colorado 15 5 9 718 751 13,392Connecticut 208 17 22 672 4 11,849Delaware 65 142 2,256District of Columbia 17 149 527 3,355Florida 79 272 1,962 3,876 70,547GeorgiaHawaii 48 158 22 3,106Idaho 7 8 2,072Illinois 113 927 126 31,946Indiana 33 3,030 549 26,631Iowa 57 1,573 1,814 19,695Kansas 21 693 3,344Kentucky 1,239 1 22,048LouisianaMaine 4 37 779 5,121Maryl<strong>and</strong>Massachusetts 233 45 974 327 47,480Michigan 1,178 37,202Minnesota 15 185 9 9,471Mississippi 13 4 85 260 50 7,435Missouri 41 768 784 9,085Montana 3 6 28 4 1,917Nebraska 11 314 174 8,032Nevada 14 63 9 1,311 7,151New HampshireNew Jersey 274 411 13,195New Mexico 26 1 6 114 1,071 7,865New York 354 7 1,512 8,363 106,417North Carolina 1,710 17,692North Dakota 10 57 2,007Ohio 74 406 4,485 1,252 48,561Oklahoma 98 1 1,403 345 22,347Oregon 197 826 110 16,483Pennsylvania 29 31 461 4,729Puerto Rico 66 1 27 521 15,362Rhode Isl<strong>and</strong> 549 12 5,584South Carolina 73 12 240 108 14,296South Dakota 6 42 17 1,920Tennessee 70 108 2,381 71 394 23,614Texas 259 302 1,836 305 92,440Utah 43 31 575 695 981 16,348Vermont 2 125 34 53 962Virginia 26 62 269 792 8,220Washington 25 379 10,255West VirginiaWisconsin 15 408 1,364 819 9,751Wyoming 6 62 4 1,005Total 2,321 1,127 4,662 37,256 31,705 915,304Weighted Percent 0.3 0.1 0.5 4.1 3.5 100.0Number Reporting 30 20 19 43 42 47CHAPTER 5: Perpetrators 79
Table 5–4 Type of Parental Perpetrators, <strong>2006</strong>STATEBIOLOGICALPARENTSTEPPARENTADOPTIVEPARENTUNKNOWNPARENTAL TYPETOTALPARENTSAlabama 5,702 85 24 2,258 8,069Alaska 3,619 241 87 3,947Arizona 4,757 35 30 4,822Arkansas 6,980 536 83 57 7,656Cali<strong>for</strong>nia 75,767 3,788 807 6,038 86,400Colorado 9,499 911 131 69 10,610ConnecticutDelaware 1,614 53 11 90 1,768District of Columbia 2,429 26 18 11 2,484Florida 48,576 3,310 402 698 52,986GeorgiaHawaii 2,492 138 70 2,700Idaho 1,851 84 18 1,953IllinoisIndiana 18,241 1,078 19,319Iowa 13,741 560 54 14,355Kansas 1,966 186 38 2,190Kentucky 17,031 951 93 17 18,092LouisianaMaine 3,601 196 34 3,831Maryl<strong>and</strong>Massachusetts 38,321 1,478 400 52 40,251MichiganMinnesota 7,245 287 74 7,606Mississippi 5,667 334 101 6,102Missouri 5,074 564 99 5,737Montana 1,590 91 25 1,706Nebraska 6,068 373 56 6,497Nevada 5,388 164 20 71 5,643New HampshireNew Jersey 10,581 390 83 11,054New Mexico 5,794 163 26 5,983New York 76,057 281 12,339 88,677North Carolina 13,268 871 132 14,271North Dakota 1,611 107 21 1,739Ohio 34,136 238 260 1,220 35,854Oklahoma 17,006 1,448 323 167 18,944OregonPennsylvania 2,007 315 2,322Puerto Rico 13,551 799 14,350Rhode Isl<strong>and</strong> 4,560 174 52 4,786South Carolina 11,585 574 98 43 12,300South Dakota 1,629 75 10 1,714Tennessee 16,303 147 16,450Texas 70,020 4,431 111 74,562Utah 10,368 964 88 89 11,509Vermont 531 37 20 588Virginia 5,527 396 54 37 6,014WashingtonWest VirginiaWisconsin 4,885 319 98 5,302Wyoming 805 63 2 870Total 587,443 27,079 4,205 23,286 642,013Percent 91.5 4.2 0.7 3.6 100.0Number Reporting 42 40 38 17 4280 <strong>Child</strong> <strong>Maltreatment</strong> <strong>2006</strong>
Table 5–5 Perpetrators by Type of <strong>Maltreatment</strong>, <strong>2006</strong>MALTREATMENT TYPENUMBERPERPETRATORSPERCENTNeglect 569,348 60.4Physical Abuse 97,533 10.3Multiple <strong>Maltreatment</strong>s 108,093 11.5Psychological <strong>Maltreatment</strong>, “Other,” or Unknown 101,518 10.8Sexual Abuse 66,365 7.0Total 942,857Percent 100.0Based on data from 50 States.CHAPTER 5: Perpetrators 81
82 <strong>Child</strong> <strong>Maltreatment</strong> <strong>2006</strong>
ServicesCHAPTER 6<strong>Child</strong> protective services (CPS) agencies provide services to prevent future instances of childabuse <strong>and</strong> neglect <strong>and</strong> to remedy conditions that have come to the attention of child welfareagencies. The two categories of CPS services are described below.■ Preventive services are provided to parents whose children are at risk of abuse or neglect. 1These services are designed to increase parent’s <strong>and</strong> other caregiver’s underst<strong>and</strong>ing ofthe developmental stages of childhood <strong>and</strong> to improve their child-rearing competencies.Examples of preventive services include respite care, parenting education, housing assistance,substance abuse treatment, daycare, home visits, individual <strong>and</strong> family counseling, <strong>and</strong> homemaker help.■ Postinvestigation services are offered on a voluntary basis by child welfare agencies orordered by the courts to ensure the safety of children. 2 These services address the safety ofthe child <strong>and</strong> are usually based on an assessment of the family’s strengths, weaknesses, <strong>and</strong>needs. Examples of postinvestigation services include individual counseling, case management,family-based services (services provided to the entire family, such as counseling orfamily support), in-home services, foster care services, <strong>and</strong> court services.During Federal fiscal year (FFY) <strong>2006</strong>:■ An estimated 3.8 million children received preventive services;■ Nearly 60 percent of victims received postinvestigation services; <strong>and</strong>■ An estimated 312,000 children received foster care services as a result of an investigation.This chapter presents in<strong>for</strong>mation about children who received preventive <strong>and</strong> postinvestigationservices. The factors that influence the provision of services also are discussed.Preventive ServicesFor FFY <strong>2006</strong>, 50.7 children per 1,000 children in the population received preventive services.This results in a national estimate of approximately 3.8 million children. 3 During 2005, it wasestimated that 25.7 children per 1,000 children or approximately 2 million children receivedpreventive services.1 States are not limited to reporting only those children who received an investigation by a CPS agency.2 Data about postinvestigation services are collected through the <strong>Child</strong> File or the Summary Data Component (SDC). Statesare asked to report only those children who received services by the CPS agency within 90 days of the disposition date.3 Thirty-nine States reported that 3,199,485 children received preventive services <strong>for</strong> a rate of 50.7 per 1,000 children.Preventive services include services provided to families who were not the subject of a referral to CPS. When this rateis applied to the national population of 74,754,213, it is estimated that 3,790,039 children received preventive services.Supporting data are provided in table 6–1, which is located at the end of this chapter.CHAPTER 6: Services 83
This significant increase from 2005 to <strong>2006</strong> of the number of children who received preventiveservices is due, in part, to improved data collection <strong>and</strong> estimation. During <strong>2006</strong>, State counts ofboth families <strong>and</strong> children who received preventive services were used <strong>for</strong> the national estimate;in prior years only the counts of children were used. 4,5 Some States are able to report the numberof families who received services funded by a specific funding source, but are not able to reportthe number of children.States <strong>and</strong> local communities determine who will receive preventive services, what services willbe offered, <strong>and</strong> how the services will be provided. Preventive services were funded by the followingFederal programs, which are described below, as well as by State-funded programs.■ Section 106 of title I of the <strong>Child</strong> Abuse Prevention <strong>and</strong> Treatment Act (CAPTA), as amended[42 U.S.C. 5106 et seq.]—The <strong>Child</strong> Abuse <strong>and</strong> Neglect State Grant (Basic State Grant) providesfunds to States to improve CPS systems. The grant serves as a catalyst to assist States inscreening <strong>and</strong> investigating child abuse <strong>and</strong> neglect reports, creating <strong>and</strong> improving the useof multidisciplinary teams to enhance investigations, improving risk <strong>and</strong> safety assessmentprotocols, training CPS workers <strong>and</strong> m<strong>and</strong>ated reporters, <strong>and</strong> improving services to infantsdisabled with life-threatening conditions.■ Title II of CAPTA, as amended [42 U.S.C. 5116 et seq.]—The Community-Based Grants <strong>for</strong> thePrevention of <strong>Child</strong> Abuse <strong>and</strong> Neglect assist each State to support community-based ef<strong>for</strong>tsto develop, operate, exp<strong>and</strong>, enhance, <strong>and</strong> network initiatives aimed at preventing childabuse <strong>and</strong> neglect; support networks of coordinated resources <strong>and</strong> activities to strengthen<strong>and</strong> support families; <strong>and</strong> foster appreciation of diverse populations.■ Title IV-B, Subpart 2, Section 430, of the Social Security Act, as amended Promoting Safe<strong>and</strong> Stable <strong>Families</strong> [42.U.S.C. 629 et seq.]—This legislation has the goal of keeping familiestogether by funding such services as preventive intervention so that children do not have tobe removed from their homes, services to develop alternative placements if children cannotremain safely in the home, <strong>and</strong> reunification services to enable children to return to theirhomes, if appropriate.■ Title XX of the Social Security Act, Social Services Block Grant (SSBG), [42 U.S.C. 1397 etseq.]—Under this grant, States may use funds <strong>for</strong> such preventive services as child daycare,child protective services, in<strong>for</strong>mation <strong>and</strong> referral, counseling, <strong>and</strong> foster care, as well asother services that meet the goal of preventing or remedying neglect, abuse, or exploitationof children.Some States were able to estimate the number of child recipients of services by funding source.Nearly 30 percent (27.5%) percent of children received preventive services funded by PromotingSafe <strong>and</strong> Stable <strong>Families</strong> grants, <strong>and</strong> nearly 20 percent (17.9%) were funded by the Social ServicesBlock Grant. 6 The <strong>Child</strong> Abuse <strong>and</strong> Neglect Basic State Grant <strong>and</strong> the Community-Based Grants<strong>for</strong> the Prevention of <strong>Child</strong> Abuse <strong>and</strong> Neglect provided the preventive services <strong>for</strong> 5.8 percent<strong>and</strong> 15.3 percent of children, respectively. More than 30 percent (33.5%) of children receivedservices that were paid with “other” sources, including other Federal <strong>and</strong> State programs.4 The number of families who received preventive services was multiplied by the average number of children per family(1.86) <strong>and</strong> added to the reported number of children to obtain the total number of children who received services ineach State prior to estimating the national number.5 The average number of children per family retrieved October 2007, from http://www.census.gov/population/socdemo/hh-fam/tabST-F1–2000.pdf6 See table 6–2.84 <strong>Child</strong> <strong>Maltreatment</strong> <strong>2006</strong>
Postinvestigation ServicesMore than three-quarters of States have policies requiring workers to provide short-termservices, if needed, during an investigation. A similar percentage of States require workers toassist with the planning of ongoing services. 7 Nearly 60 percent (58.9%) of child victims receivedpostinvestigation services. Of the children who were not found to be victims of maltreatment,30.3 percent of children received such services. These data result in national estimates of 533,000victims <strong>and</strong> 808,000 nonvictims who received services. 8 With a few exceptions, the State data onthe average number of days to the provision of services fall within the timeframe allowed <strong>for</strong> aninvestigation or shortly thereafter. The average time from the start of investigation to provisionof service was 43 days. 9<strong>Child</strong>ren may be removed from their homes during or after an investigation. Some childrenwho are removed on an emergency basis spend a short time in foster care, while others spend alonger time. Approximately one-fifth of victims (21.5%) were placed in foster care as a result ofan investigation compared to 21.7 percent <strong>for</strong> FFY 2005. 10 Although the national percentage ofvictims who were removed from home or received foster care services at the time of the investigationis 21.5 percent, several States reported more than 40 percent of victims received fostercare services. 11In addition, 4.4 percent of nonvictims experienced removal. Nationally, it is estimated that312,000 children were removed from their homes as a result of a child maltreatment investigation.12 Nearly two-thirds (63.6%) of the victims who were removed from their homes sufferedfrom neglect, 8.6 percent from physical abuse, 3.2 percent from sexual abuse, <strong>and</strong> 16.8 percentfrom multiple types of maltreatment. 13Court-appointed representatives were assigned to 12.9 percent of child victims. 14 This number isunderstood within the context of two other statistics—States report the 15.2 percent of victimswere the subject of court proceedings <strong>and</strong> 21.5 percent were placed in foster care as a result ofan investigation. Given the statutory requirement in CAPTA that “in every case involving anabused or neglected child which results in a judicial proceeding, a guardian ad litem…whomay be an attorney or a court appointed special advocate…shall be appointed to represent thechild in such proceedings,” many States are working to improve their reporting of the court7 U.S. Department of Health <strong>and</strong> Human Services. <strong>Administration</strong> <strong>for</strong> <strong>Child</strong>ren <strong>and</strong> <strong>Families</strong>/<strong>Child</strong>ren’s Bureau <strong>and</strong> Offceof the Assistant Secretary <strong>for</strong> Planning <strong>and</strong> Evaluation. [HHS/ACF <strong>and</strong> OASPE] National Study of <strong>Child</strong> Protective ServicesSystems <strong>and</strong> Re<strong>for</strong>m Ef<strong>for</strong>ts: Review of State CPS Policy. (Washington, DC: U.S. Government Printing Offce, 2003).8 A national estimate of 533,000 victims who received postinvestigation services was calculated by multiplying thenational estimate of victims (905,000) by the percent of child victims who received postinvestigation services <strong>for</strong> the 46States that reported victim postinvestigation data (58.9%) <strong>and</strong> dividing by 100. The resulting number was rounded tothe nearest 1,000. A national estimate of 808,000 nonvictims who received postinvestigation services was calculated bymultiplying the national estimate of nonvictims (2,668,000) by the percent of child nonvictims who received postinvestigationservices <strong>for</strong> the 44 States that reported nonvictim postinvestigation data (30.3%) <strong>and</strong> dividing by 100. Theresulting number was rounded to the nearest 1,000.9 See table 6–3.10 See table 6–4.11 These States are Arizona, Cali<strong>for</strong>nia, Hawaii, Idaho, Montana, Nevada, South Dakota, <strong>and</strong> Washington.12 The national estimate of 312,000 children who were removed from their home was calculated by multiplying the nationalestimate of victims (905,000) by 21.5% <strong>and</strong> multiplying the national estimate of nonvictims (2,668,000) by 4.4%,adding the resulting two numbers, dividing by 100, <strong>and</strong> rounding to the nearest 1,000.13 See table 6–5.14 See table 6–6.CHAPTER 6: Services 85
appointed representative data element. Nearly one-third of child victims (31.0%) had receivedfamily preservation services <strong>and</strong> 8.1 percent had received family reunification services withinthe previous 5 years. 15Factors Influencing the Receipt of ServicesA multivariate analysis was used to examine which factors influenced the receipt of services,<strong>and</strong> among children who received services, which factors influenced the removal of victimsfrom their homes. Three analyses were conducted. The first analysis focused on all victims <strong>and</strong>examined factors associated with receipt of any postinvestigation service, either in-home, fostercare, or both. The second <strong>and</strong> third analyses focused on only victims who received any postinvestigationservices; one examined factors associated with receipt of in-home services only <strong>and</strong>the other examined factors associated with any placement in foster care. The results of theseanalyses are the inverse of each other, but they provide two different perspectives on the factorscontributing to the type of services provided.Receipt of Postinvestigation ServicesOnly some children <strong>and</strong> families with reports of maltreatment receive postinvestigation servicesor family reunification services, due to a variety of factors. Including that services are notusually available <strong>for</strong> all families, <strong>and</strong> the waiting lists may be very long. The characteristics of achild’s case may also influence the receipt of services. Case-level data submissions were analyzedto examine which factors influenced whether or not a victim or the victim’s family receivedpostinvestigation services. Highlights of the findings are listed below. 16■ <strong>Child</strong> victims who were reported with a disability were two times more likely to receivepostinvestigation services than children without a disability. 17■ When compared with physical abuse victims, victims of multiple maltreatments were 65percent more likely <strong>and</strong> victims of neglect were 20 percent more likely to receive services.Victims of sexual abuse were 24 percent less likely to receive services.■ African-American child victims were 22 percent more likely <strong>and</strong> Hispanic child victims were16 percent more likely to receive services when compared with White victims.■ <strong>Child</strong> victims who were abused or maltreated by nonparental perpetrators were 60 percentless likely to receive postinvestigation services than child victims who were abused ormaltreated by their mothers alone. <strong>Child</strong> victims who were abused by both parents, or bytheir mothers along with another person, were significantly more likely to receive servicesthan child victims who were maltreated by their mothers alone.Receipt of In-Home ServicesFor this analysis, only victims who received any postinvestigation service were included.Findings related to these child victims who received or whose families received only servicesprovided in the home or the community, <strong>and</strong> not foster care placement, include the following.15 See table 6–7.16 The bulleted findings identify those factors that were more than 1.50 or less than 0.50. See table 6–8.17 In general, children with such conditions are undercounted as not every child receives a clinical diagnostic assessment.86 <strong>Child</strong> <strong>Maltreatment</strong> <strong>2006</strong>
■ <strong>Child</strong> victims with reported disabilities were 39 percent as likely to receive only in-homeservices as child victims without reported disabilities.■ <strong>Child</strong>ren who were sexually abused or had “other abuse” types were more likely to receiveexclusively in home services than children who were physically abused. <strong>Child</strong>ren who wereneglected or who were maltreated in more than one way were significantly less likely toreceive only in-home services.■ When compared with infants, older children were significantly more likely to receive exclusivelyin-home services. <strong>Child</strong>ren age 8 to 11 were twice as likely to receive in home services.■ <strong>Child</strong> victims who were abused or maltreated by their fathers were twice as likely to receiveonly in-home services as child victims who were abused or maltreated by their mothers.■ Victims referred by mental health <strong>and</strong> educational personnel were more than twice as likely toreceive only in-home services as victims who were referred by the social services personnel.Receipt of Foster Care ServicesFor this analysis, only victims who received any postinvestigation service were included. Findingsrelated to these child victims who received services include the following.■ Among children who received any services, prior child victims were 63 percent more likely tobe placed in foster care than children with no prior victimization.■ <strong>Child</strong> victims reported with a disability were two <strong>and</strong> a half times more likely to be placed infoster care than child victims with no reported disability.■ When compared with victims of physical abuse, victims of multiple maltreatments were 79percent more likely to be placed in foster care, <strong>and</strong> victims of neglect were 22 percent morelikely to be placed in foster care.■ When compared with White child victims, African-American child victims were 27 percentmore likely <strong>and</strong> victims of “other” or multiple races were 52 percent more likely to be placedin foster care.■ <strong>Child</strong>ren who were victimized by their fathers were 50 percent less likely to be placed infoster care than children who were victimized by their mothers.■ Victims referred by mental health personnel were 53 percent less likely <strong>and</strong> victims referredby educational personnel were 50 percent less likely to be placed in foster care than victimsreferred by social services personnel.Tables <strong>and</strong> NotesThe following pages contain the tables referenced in Chapter 6. Unless otherwise explained,a blank indicates that the State did not submit usable data. Specific in<strong>for</strong>mation about Statesubmissions can be found in appendix D. Additional in<strong>for</strong>mation regarding methodologies thatwere used during table creation is provided below.Table 6–1■ Beginning with FFY <strong>2006</strong>, the total number of recipients of preventive services is computedby multiplying the number of families receiving services by 1.86 <strong>and</strong> adding this to thenumber of children receiving preventive services.CHAPTER 6: Services 87
Table 6–2■ Beginning with FFY <strong>2006</strong>, the total number of recipients of preventive services by fundingsource is computed by multiplying the number of families receiving services under eachfunding source by 1.86 <strong>and</strong> adding this to the number of children receiving preventiveservices under each funding source.Table 6–3■ The average number of days to services was rounded to whole days.■ States with an average of less than 1 day to the onset of services are represented with a zero.■ Total percentages were calculated by dividing the total number of victims or nonvictims whoreceived postinvestigation services by the total number of victims or nonvictims <strong>and</strong> multiplyingby 100 <strong>for</strong> only those States that reported services data.Table 6–4■ Total percentages were calculated by dividing the total number of victims or nonvictims whowere removed from the home by the total number of victims or nonvictims <strong>and</strong> multiplyingby 100 <strong>for</strong> only those States reporting foster care services.Table 6–5■ The category neglect includes medical neglect.Table 6–6■ Total percentages were calculated by dividing the total number of victims with court actionor petition or victims with court-appointed representatives by the total number of victims <strong>for</strong>only those States that reported data <strong>for</strong> each category <strong>and</strong> multiplying by 100.Table 6–7■ Total percentages were calculated by dividing the total number of victims who receivedfamily preservation services or family reunification services by the total number of victims<strong>for</strong> only those States that reported data <strong>for</strong> each category <strong>and</strong> multiplying by 100.Table 6–8■ The category of in-home services does not include children with foster care services.■ Logistic regression models associate the contribution of the values within a factor to theoutcome of interest (in this case postinvestigation services, in-home services, <strong>and</strong> foster careplacement). Odds ratios indicate the likelihood, relative to the reference group, of the outcomeoccurring. Odds ratios greater than 1.00 indicate an increased likelihood of occurrence (e.g.,victims of prior abuse or neglect were 42 percent more likely than children with no history ofprior abuse or neglect to receive postinvestigation services). Odds ratios less than 1.00 indicatea decreased likelihood of occurrence (e.g., victims who were age 16 or older were 48 percent lesslikely than children younger than 1 year old to receive postinvestigation services).■ The category neglect includes medical neglect.88 <strong>Child</strong> <strong>Maltreatment</strong> <strong>2006</strong>
Table 6–1 <strong>Child</strong>ren Who Received Preventive Services, <strong>2006</strong>STATECHILDPOPULATIONCHILDREN WHORECEIVED PREVENTIVESERVICESRATE PER1,000CHILDRENAlabamaAlaska 181,434 2,842 15.7Arizona 1,628,198 47,290 29.0Arkansas 691,186 66,703 96.5Cali<strong>for</strong>nia 9,532,614 728,977 76.5Colorado 1,169,301 28,416 24.3ConnecticutDelaware 203,366 6,589 32.4District of Columbia 114,881 4,530 39.4Florida 4,021,555 165,105 41.1Georgia 2,455,020 190,338 77.5HawaiiIdaho 394,280 14,260 36.2Illinois 3,215,244 36,975 11.5Indiana 1,577,629 32,124 20.4Iowa 710,194 83,864 118.1Kansas 695,837 28,584 41.1Kentucky 999,531 12,729 12.7Louisiana 1,090,001 84,057 77.1MaineMaryl<strong>and</strong>MassachusettsMichiganMinnesota 1,257,264 94,212 74.9Mississippi 759,405 82,614 108.8Missouri 1,416,592 5,369 3.8Montana 217,848 9,276 42.6Nebraska 445,033 24,459 55.0Nevada 634,520 44,842 70.7New Hampshire 297,625 107,685 361.8New Jersey 2,089,338 247,272 118.3New Mexico 508,930 9,487 18.6New York 4,514,342 213,295 47.2North Carolina 2,155,387 16,565 7.7North DakotaOhio 2,770,035 34,495 12.5Oklahoma 894,034 25,383 28.4OregonPennsylvania 2,804,873 40,750 14.5Puerto Rico 1,018,651 162,635 159.7Rhode Isl<strong>and</strong> 237,451 5,366 22.6South CarolinaSouth Dakota 194,681 4,809 24.7Tennessee 1,442,593 229,032 158.8Texas 6,493,965 80,786 12.4Utah 791,198 39,224 49.6Vermont 133,389 4,420 33.1Virginia 1,806,847 76,120 42.1Washington 1,526,267 108,006 70.8West VirginiaWisconsinWyomingTotal 63,090,539 3,199,485Rate 50.7Number Reporting 39 39 39CHAPTER 6: Services 89
Table 6–2 Funding Sources, <strong>2006</strong>STATETOTALRECIPIENTSOFPREVENTIVESERVICESCHILD ABUSE AND NEGLECTSTATE GRANTNUMBER OFRECIPIENTSPERCENT OFRECIPIENTSCOMMUNITY-BASEDGRANTSFOR THE PREVENTION OFCHILD ABUSE AND NEGLECTNUMBER OFRECIPIENTSPERCENT OFRECIPIENTSAlabamaAlaska 2,842 804 28.3Arizona 47,290 1,000 2.1Arkansas 66,703 2,802 4.2Cali<strong>for</strong>nia 728,977 644 0.1 46,122 6.3Colorado 28,416 19,491 68.6ConnecticutDelaware 6,589District of Columbia 4,530 481 10.6Florida 165,105 9,626 5.8 3,383 2.0Georgia 190,338HawaiiIdaho 14,260 4,331 30.4Illinois 36,975 23,746 64.2 2,760 7.5Indiana 32,124 7,184 22.4Iowa 83,864 8,944 10.7Kansas 28,584 699 2.4 20,651 72.2Kentucky 12,729 7,002 55.0Louisiana 84,057 132 0.2 51,283 61.0MaineMaryl<strong>and</strong>MassachusettsMichiganMinnesota 94,212 1,357 1.4 6,842 7.3Mississippi 82,614 4,797 5.8 314 0.4Missouri 5,369 631 11.8Montana 9,276 4,669 50.3Nebraska 24,459 6,045 24.7Nevada 44,842 6,142 13.7New Hampshire 107,685 206 0.2 9,570 8.9New Jersey 247,272 913 0.4 60,450 24.4New Mexico 9,487 797 8.4New York 213,295 14,691 6.9North Carolina 16,565 1,503 9.1North DakotaOhio 34,495Oklahoma 25,383 12,741 50.2OregonPennsylvania 40,750 33,393 81.9Puerto Rico 162,635 11,391 7.0Rhode Isl<strong>and</strong> 5,366 1,302 24.3 679 12.7South CarolinaSouth Dakota 4,809 4,809 100.0Tennessee 229,032 87,000 38.0 87,032 38.0Texas 80,786Utah 39,224 2,716 6.9Vermont 4,420 2,225 50.3Virginia 76,120 47,700 62.7 765 1.0Washington 108,006 5,761 5.3 50,220 46.5West VirginiaWisconsinWyomingTotal 3,199,485 187,166 490,580Percent 5.8 15.3Number Reporting 39 15 15 33 3390 <strong>Child</strong> <strong>Maltreatment</strong> <strong>2006</strong>
PROMOTING SAFE ANDSTABLE FAMILIESSOCIAL SERVICESBLOCK GRANTOTHERSTATENUMBER OFRECIPIENTSPERCENT OFRECIPIENTSNUMBER OFRECIPIENTSPERCENT OFRECIPIENTSNUMBER OFRECIPIENTSPERCENT OFRECIPIENTSAlabamaAlaska 1,617 56.9 421 14.8Arizona 27,959 59.1 18,331 38.8Arkansas 62,841 94.2 1,060 1.6Cali<strong>for</strong>nia 333,682 45.8 348,529 47.8Colorado 8,925 31.4ConnecticutDelaware 1,592 24.2 398 6.0 4,599 69.8District of Columbia 156 3.4 329 7.3 3,564 78.7Florida 63,089 38.2 7,356 4.5 81,651 49.5Georgia 59,524 31.3 130,814 68.7HawaiiIdaho 8,558 60.0 1,371 9.6Illinois 10,469 28.3Indiana 9,028 28.1 13,256 41.3 2,656 8.3Iowa 74,920 89.3Kansas 7,041 24.6 193 0.7Kentucky 5,321 41.8 406 3.2Louisiana 5,919 7.0 15,520 18.5 11,203 13.3MaineMaryl<strong>and</strong>MassachusettsMichiganMinnesota 14,899 15.8 70,891 75.2 223 0.2Mississippi 3,600 4.4 36,955 44.7 36,948 44.7Missouri 387 7.2 4,351 81.0Montana 4,607 49.7Nebraska 18,414 75.3Nevada 8,973 20.0 11,295 25.2 18,432 41.1New Hampshire 2,595 2.4 1,614 1.5 93,700 87.0New Jersey 5,580 2.3 178,562 72.2 1,767 0.7New Mexico 1,782 18.8 6,908 72.8New York 182,488 85.6 16,116 7.6North Carolina 11,974 72.3 3,088 18.6North DakotaOhio 34,495 100.0Oklahoma 11,584 45.6 1,058 4.2OregonPennsylvania 7,357 18.1Puerto Rico 13,053 8.0 138,191 85.0Rhode Isl<strong>and</strong> 143 2.7 3,242 60.4South CarolinaSouth DakotaTennessee 55,000 24.0Texas 80,786 100.0Utah 1,490 3.8 35,018 89.3Vermont 2,195 49.7Virginia 13,673 18.0 13,982 18.4Washington 35,375 32.8 16,650 15.4West VirginiaWisconsinWyomingTotal 879,167 572,333 1,070,239Percent 27.5 17.9 33.5Number Reporting 32 32 16 16 28 28CHAPTER 6: Services 91
Table 6–3 <strong>Child</strong>ren Who Received Postinvestigation Services, <strong>2006</strong>STATETOTALVICTIMSVICTIMS WHO RECEIVEDPOSTINVESTIGATION SERVICESNUMBERPERCENTTOTALNONVICTIMSAlabamaAlaska 3,481 948 27.2 6,019Arizona 4,469 4,289 96.0 71,986Arkansas 9,180 7,041 76.7 43,026Cali<strong>for</strong>nia 89,500 68,574 76.6 337,622Colorado 10,862 3,880 35.7 37,748Connecticut 10,174 3,342 32.8 32,112Delaware 1,933 974 50.4 11,931District of Columbia 2,759 2,687 97.4 9,556Florida 134,567 67,987 50.5 206,105GeorgiaHawaii 2,045 1,872 91.5 2,216Idaho 1,651 1,344 81.4 8,273Illinois 27,756 5,620 20.2 117,877Indiana 20,925 7,294 34.9Iowa 14,589 14,589 100.0 24,178Kansas 2,630 1,411 53.7 20,058Kentucky 19,833 18,268 92.1 57,202Louisiana 12,472 6,665 53.4 29,323Maine 3,548 1,205 34.0 6,240Maryl<strong>and</strong>Massachusetts 36,151 31,790 87.9 43,704Michigan 27,148 21,912 80.7 159,606Minnesota 7,623 4,951 64.9 21,898Mississippi 6,272 2,767 44.1 20,034Missouri 7,108 6,518 91.7 63,162Montana 1,775 934 52.6 12,396Nebraska 6,160 3,782 61.4 24,340Nevada 5,345 5,181 96.9 25,130New Hampshire 822 822 100.0 8,577New Jersey 11,680 9,659 82.7 35,492New Mexico 5,926 2,495 42.1 20,545New YorkNorth CarolinaNorth DakotaOhio 41,449 12,055 29.1 74,680Oklahoma 13,414 8,537 63.6 51,548Oregon 12,927 6,645 51.4Pennsylvania 4,177 415 9.9 18,894Puerto Rico 15,066 5,483 36.4 16,783Rhode Isl<strong>and</strong> 4,400 2,873 65.3 8,596South Carolina 10,795 10,082 93.4 27,127South Dakota 1,529 742 48.5 5,606Tennessee 19,182 5,463 28.5 78,981Texas 69,065 33,688 48.8 211,848Utah 13,043 12,715 97.5 19,138Vermont 861 404 46.9 1,980Virginia 6,828 4,224 61.9 51,998Washington 7,294 4,159 57.0 46,282West Virginia 8,345 6,530 78.3 43,329Wisconsin 8,583 4,485 52.3 32,647Wyoming 786 499 63.5 4,033Total 726,128 427,800 2,149,826Percent 58.9AverageNumber Reporting 46 46 46 4492 <strong>Child</strong> <strong>Maltreatment</strong> <strong>2006</strong>
STATENONVICTIMS WHO RECEIVEDPOSTINVESTIGATION SERVICESNUMBERPERCENTTOTAL CHILDRENWHO RECEIVEDSERVICESAVERAGENUMBER OFDAYS TOSERVICESAlabamaAlaska 359 6.0 1,307 72Arizona 63,627 88.4 67,916 50Arkansas 6,079 14.1 13,120 32Cali<strong>for</strong>nia 180,763 53.5 249,337 12Colorado 5,032 13.3 8,912 16Connecticut 2,290 7.1 5,632 5Delaware 824 6.9 1,798 40District of Columbia 1,520 15.9 4,207 0Florida 54,834 26.6 122,821GeorgiaHawaii 1,748 78.9 3,620 6Idaho 2,149 26.0 3,493 0Illinois 7,808 6.6 13,428 43Indiana 7,294 15Iowa 24,178 100.0 38,767 30Kansas 4,657 23.2 6,068 31Kentucky 38,303 67.0 56,571 14Louisiana 2,293 7.8 8,958 40Maine 392 6.3 1,597 76Maryl<strong>and</strong>Massachusetts 15,195 34.8 46,985 9Michigan 10,347 6.5 32,259 40Minnesota 5,087 23.2 10,038 34Mississippi 2,789 13.9 5,556 123Missouri 53,408 84.6 59,926 30Montana 1,188 9.6 2,122 36Nebraska 6,055 24.9 9,837 7Nevada 22,469 89.4 27,650 61New Hampshire 8,577 100.0 9,399 85New Jersey 21,641 61.0 31,300 12New Mexico 2,542 12.4 5,037 72New YorkNorth CarolinaNorth DakotaOhio 11,296 15.1 23,351Oklahoma 9,581 18.6 18,118 42Oregon 6,645 36Pennsylvania 624 3.3 1,039Puerto Rico 1,327 7.9 6,810 48Rhode Isl<strong>and</strong> 2,836 33.0 5,709 37South Carolina 8,434 31.1 18,516 22South Dakota 349 6.2 1,091Tennessee 6,150 7.8 11,613 55Texas 12,448 5.9 46,136 59Utah 17,370 90.8 30,085 112Vermont 402 20.3 806 41Virginia 10,523 20.2 14,747 60Washington 9,527 20.6 13,686 105West Virginia 8,957 20.7 15,487 50Wisconsin 5,295 16.2 9,780 61Wyoming 146 3.6 645 77Total 651,419 1,079,219Percent 30.3Average 43Number Reporting 44 44 46 42CHAPTER 6: Services 93
Table 6–4 <strong>Child</strong>ren Who Were Removed From Home, <strong>2006</strong>STATETOTALVICTIMSVICTIMS REMOVEDFROM HOMETOTALNONVICTIMS REMOVEDFROM HOMENUMBER PERCENT NONVICTIMS NUMBER PERCENTAlabamaAlaska 3,481 772 22.2 6,019 254 4.2Arizona 4,469 2,021 45.2 71,986 5,023 7.0Arkansas 9,180 1,690 18.4 43,026 1,486 3.5Cali<strong>for</strong>nia 89,500 37,944 42.4 337,622 38,620 11.4Colorado 10,862 1,989 18.3 37,748 930 2.5Connecticut 10,174 1,306 12.8 32,112 222 0.7Delaware 1,933 365 18.9 11,931 216 1.8District of Columbia 2,759 443 16.1 9,556 262 2.7Florida 134,567 15,711 11.7 206,105 1,681 0.8GeorgiaHawaii 2,045 1,192 58.3 2,216 396 17.9Idaho 1,651 954 57.8 8,273 193 2.3Illinois 27,756 3,838 13.8 117,877 2,250 1.9Indiana 20,925 3,977 19.0 46,586 105 0.2Iowa 14,589 3,307 22.7 24,178 1,691 7.0Kansas 2,630 297 11.3 20,058 856 4.3Kentucky 19,833 4,739 23.9 57,202 2,718 4.8Louisiana 12,472 3,306 26.5 29,323 965 3.3Maine 3,548 754 21.3 6,240 329 5.3Maryl<strong>and</strong>Massachusetts 36,151 5,350 14.8 43,704 2,457 5.6MichiganMinnesota 7,623 2,788 36.6 21,898 1,586 7.2Mississippi 6,272 1,254 20.0 20,034 945 4.7Missouri 7,108 2,036 28.6 63,162 2,159 3.4Montana 1,775 782 44.1 12,396 731 5.9Nebraska 6,160 2,414 39.2 24,340 1,266 5.2Nevada 5,345 2,834 53.0 25,130 1,521 6.1New Hampshire 822 224 27.3 8,577 47 0.5New Jersey 11,680 3,503 30.0 35,492 2,365 6.7New Mexico 5,926 1,191 20.1 20,545 356 1.7New YorkNorth CarolinaNorth DakotaOhio 41,449 6,702 16.2 74,680 3,344 4.5Oklahoma 13,414 2,718 20.3 51,548 180 0.3Oregon 12,927 4,780 37.0Pennsylvania 4,177 415 9.9 18,894 624 3.3Puerto Rico 15,066 169 1.1 16,783 21 0.1Rhode Isl<strong>and</strong> 4,400 1,274 29.0 8,596 377 4.4South Carolina 10,795 2,589 24.0 27,127 1,153 4.3South Dakota 1,529 742 48.5 5,606 349 6.2Tennessee 19,182 3,073 16.0 78,981 2,284 2.9Texas 69,065 11,961 17.3 211,848 1,650 0.8Utah 13,043 1,053 8.1 19,138 45 0.2Vermont 861 162 18.8 1,980 61 3.1Virginia 6,828 1,211 17.7 51,998 858 1.7Washington 7,294 3,139 43.0 46,282 5,410 11.7West Virginia 8,345 788 9.4 43,329 581 1.3Wisconsin 8,583 2,341 27.3 32,647 1,874 5.7Wyoming 786 329 41.9 4,033 63 1.6Total 698,980 150,427 2,036,806 90,504Weighted Percent 21.5 4.4Number Reporting 45 45 45 44 44 4494 <strong>Child</strong> <strong>Maltreatment</strong> <strong>2006</strong>
Table 6–5 <strong>Maltreatment</strong> Types of Victims Who WereRemoved From Home, <strong>2006</strong> (continues on page 96)STATEPHYSICAL ABUSE NEGLECT SExUAL ABUSENUMBER PERCENT NUMBER PERCENT NUMBER PERCENTAlabamaAlaska 34 4.4 523 67.7 17 2.2Arizona 211 10.4 1,698 84.0 41 2.0Arkansas 236 14.0 1,057 62.5 156 9.2Cali<strong>for</strong>nia 2,706 7.1 28,061 74.0 1,079 2.8Colorado 151 7.6 1,547 77.8 46 2.3Connecticut 30 2.3 1,107 84.8 6 0.5Delaware 30 8.2 198 54.2 5 1.4District of Columbia 83 18.7 156 35.2 12 2.7Florida 565 3.6 3,804 24.2 95 0.6GeorgiaHawaii 29 2.4 57 4.8 14 1.2Idaho 59 6.2 754 79.0 11 1.2Illinois 416 10.8 2,518 65.6 194 5.1Indiana 180 4.5 3,211 80.7 71 1.8Iowa 209 6.3 2,273 68.7 103 3.1Kansas 36 12.1 60 20.2 58 19.5Kentucky 305 6.4 4,156 87.7 101 2.1Louisiana 253 7.7 2,377 71.9 62 1.9Maine 11 1.5 330 43.8 14 1.9Maryl<strong>and</strong>Massachusetts 260 4.9 4,392 82.1 95 1.8MichiganMinnesota 298 10.7 2,142 76.8 117 4.2Mississippi 104 8.3 852 67.9 75 6.0Missouri 304 14.9 1,069 52.5 106 5.2Montana 39 5.0 513 65.6 21 2.7Nebraska 128 5.3 1,900 78.7 62 2.6Nevada 135 4.8 2,021 71.3 35 1.2New Hampshire 13 5.8 183 81.7 4 1.8New Jersey 743 21.2 2,470 70.5 93 2.7New Mexico 56 4.7 838 70.4 10 0.8New YorkNorth CarolinaNorth DakotaOhio 1,179 17.6 4,049 60.4 760 11.3Oklahoma 89 3.3 1,618 59.5 6 0.2Oregon 158 3.3 1,427 29.9 151 3.2Pennsylvania 137 33.0 24 5.8 238 57.3Puerto Rico 15 8.9 47 27.8 2 1.2Rhode Isl<strong>and</strong> 95 7.5 1,067 83.8 12 0.9South Carolina 373 14.4 1,611 62.2 78 3.0South Dakota 30 4.0 636 85.7 3 0.4Tennessee 768 25.0 1,544 50.2 211 6.9Texas 1,526 12.8 7,847 65.6 168 1.4Utah 45 4.3 253 24.0 7 0.7Vermont 105 64.8 24 14.8 23 14.2Virginia 141 11.6 878 72.5 34 2.8Washington 244 7.8 2,679 85.3 59 1.9West Virginia 105 13.3 362 45.9 35 4.4Wisconsin 295 12.6 1,091 46.6 261 11.1Wyoming 10 3.0 272 82.7 3 0.9Total 12,939 95,696 4,754Percent 8.6 63.6 3.2Number Reporting 45 45 45 45 45 45CHAPTER 6: Services 95
Table 6–5 <strong>Maltreatment</strong> Types of Victims Who WereRemoved From Home, <strong>2006</strong> (continued from page 95)STATEPSYCHOLOGICALMALTREATMENT, OTHER,OR UNKNOWNMULTIPLEMALTREATMENT TYPESTOTAL VICTIMSREMOVEDFROM HOMENUMBER PERCENT NUMBER PERCENT NUMBER PERCENTAlabamaAlaska 60 7.8 138 17.9 772 100.0Arizona 12 0.6 59 2.9 2,021 100.0Arkansas 13 0.8 228 13.5 1,690 100.0Cali<strong>for</strong>nia 1,782 4.7 4,316 11.4 37,944 100.0Colorado 103 5.2 142 7.1 1,989 100.0Connecticut 1 0.1 162 12.4 1,306 100.0Delaware 67 18.4 65 17.8 365 100.0District of Columbia 71 16.0 121 27.3 443 100.0Florida 4,986 31.7 6,261 39.9 15,711 100.0GeorgiaHawaii 717 60.2 375 31.5 1,192 100.0Idaho 78 8.2 52 5.5 954 100.0Illinois 710 18.5 3,838 100.0Indiana 515 12.9 3,977 100.0Iowa 182 5.5 540 16.3 3,307 100.0Kansas 108 36.4 35 11.8 297 100.0Kentucky 13 0.3 164 3.5 4,739 100.0Louisiana 13 0.4 601 18.2 3,306 100.0Maine 66 8.8 333 44.2 754 100.0Maryl<strong>and</strong>Massachusetts 5 0.1 598 11.2 5,350 100.0MichiganMinnesota 10 0.4 221 7.9 2,788 100.0Mississippi 94 7.5 129 10.3 1,254 100.0Missouri 30 1.5 527 25.9 2,036 100.0Montana 77 9.8 132 16.9 782 100.0Nebraska 11 0.5 313 13.0 2,414 100.0Nevada 38 1.3 605 21.3 2,834 100.0New Hampshire 24 10.7 224 100.0New Jersey 27 0.8 170 4.9 3,503 100.0New Mexico 70 5.9 217 18.2 1,191 100.0New YorkNorth CarolinaNorth DakotaOhio 211 3.1 503 7.5 6,702 100.0Oklahoma 39 1.4 966 35.5 2,718 100.0Oregon 1,797 37.6 1,247 26.1 4,780 100.0Pennsylvania 9 2.2 7 1.7 415 100.0Puerto Rico 40 23.7 65 38.5 169 100.0Rhode Isl<strong>and</strong> 100 7.8 1,274 100.0South Carolina 20 0.8 507 19.6 2,589 100.0South Dakota 6 0.8 67 9.0 742 100.0Tennessee 7 0.2 543 17.7 3,073 100.0Texas 20 0.2 2,400 20.1 11,961 100.0Utah 339 32.2 409 38.8 1,053 100.0Vermont 10 6.2 162 100.0Virginia 11 0.9 147 12.1 1,211 100.0Washington 157 5.0 3,139 100.0West Virginia 95 12.1 191 24.2 788 100.0Wisconsin 472 20.2 222 9.5 2,341 100.0Wyoming 22 6.7 22 6.7 329 100.0Total 11,722 25,316 150,427Percent 7.8 16.8 100.0Number Reporting 39 39 45 45 45 4596 <strong>Child</strong> <strong>Maltreatment</strong> <strong>2006</strong>
Table 6–6 Victims with Court Action <strong>and</strong> Court-AppointedRepresentatives, <strong>2006</strong>STATEVICTIMS WITH COURT ACTIONOR PETITIONVICTIMS WITH COURT-APPOINTEDREPRESENTATIVESTOTAL VICTIMS NUMBER PERCENT TOTAL VICTIMS NUMBER PERCENTAlabamaAlaska 3,481 298 8.6 3,481 589 16.9Arizona 4,469 1,366 30.6 4,469 1,855 41.5Arkansas 9,180 1,937 21.1 9,180 176 1.9Cali<strong>for</strong>nia 89,500 24,708 27.6 89,500 24,116 26.9Colorado 10,862 2,419 22.3Connecticut 10,174 3,284 32.3Delaware 1,933 80 4.1 1,933 18 0.9District of Columbia 2,759 717 26.0 2,759 257 9.3Florida 134,567 524 0.4 134,567 2,419 1.8GeorgiaHawaii 2,045 1,452 71.0 2,045 1,329 65.0Idaho 1,651 1,002 60.7Illinois 27,756 3,629 13.1Indiana 20,925 4,382 20.9 20,925 321 1.5Iowa 14,589 5,277 36.2 14,589 5,557 38.1Kansas 2,630 853 32.4Kentucky 19,833 99 0.5 19,833 4,580 23.1Louisiana 12,472 3,306 26.5Maine 3,548 295 8.3 3,548 670 18.9Maryl<strong>and</strong>Massachusetts 36,151 6,148 17.0 36,151 4,563 12.6MichiganMinnesota 7,623 1,449 19.0 7,623 1,209 15.9Mississippi 6,272 159 2.5 6,272 2,146 34.2Missouri 7,108 2,036 28.6Montana 1,775 857 48.3 1,775 449 25.3Nebraska 6,160 2,732 44.4 6,160 2,686 43.6Nevada 5,345 2,925 54.7 5,345 201 3.8New Hampshire 822 446 54.3 822 18 2.2New JerseyNew Mexico 5,926 1,174 19.8 5,926 1,174 19.8New YorkNorth CarolinaNorth DakotaOhioOklahoma 13,414 1,880 14.0 13,414 1,880 14.0Oregon 12,927 17 0.1PennsylvaniaPuerto Rico 15,066 75 0.5 15,066 11 0.1Rhode Isl<strong>and</strong> 4,400 2,171 49.3 4,400 2,319 52.7South Carolina 10,795 3,641 33.7 10,795 252 2.3South DakotaTennessee 19,182 450 2.3 19,182 450 2.3TexasUtah 13,043 1,053 8.1 13,043 1,053 8.1Vermont 861 252 29.3 861 252 29.3Virginia 6,828 521 7.6 6,828 52 0.8Washington 7,294 1,296 17.8West Virginia 8,345 758 9.1 8,345 101 1.2Wisconsin 8,583 973 11.3Wyoming 786 308 39.2 786 25 3.2Total 571,080 86,949 469,623 60,728Percent 15.2 12.9Number Reporting 40 40 40 30 30 30CHAPTER 6: Services 97
Table 6–7 Victims Who Received Family Preservation or FamilyReunification Services Within Previous 5 Years, <strong>2006</strong>STATEVICTIMS WHO RECEIVED FAMILY PRESERVATIONSERVICES WITHIN THE PREVIOUS 5 YEARSVICTIMS WHO RECEIVED REUNIFICATION SERVICESWITHIN THE PREVIOUS 5 YEARSTOTAL VICTIMS NUMBER PERCENT TOTAL VICTIMS NUMBER PERCENTAlabamaAlaskaArizonaArkansas 9,180 2,153 23.5 9,180 409 4.5Cali<strong>for</strong>niaColoradoConnecticutDelaware 1,933 70 3.6District of Columbia 2,759 461 16.7 2,759 22 0.8Florida 134,567 70,841 52.6 134,567 18,166 13.5GeorgiaHawaii 2,045 112 5.5Idaho 1,651 327 19.8 1,651 142 8.6IllinoisIndiana 20,925 925 4.4Iowa 14,589 58 0.4 14,589 891 6.1Kansas 2,630 811 30.8 2,630 310 11.8KentuckyLouisiana 12,472 1,309 10.5MaineMaryl<strong>and</strong>Massachusetts 36,151 9,208 25.5 36,151 2,159 6.0MichiganMinnesota 7,623 882 11.6 7,623 760 10.0MississippiMissouri 7,108 4,941 69.5 7,108 3,298 46.4MontanaNebraska 6,160 1,989 32.3Nevada 5,345 87 1.6 5,345 263 4.9New Hampshire 822 65 7.9 822 19 2.3New Jersey 11,680 5,473 46.9New MexicoNew YorkNorth CarolinaNorth DakotaOhio 41,449 19,951 48.1 41,449 2,107 5.1Oklahoma 13,414 761 5.7 13,414 759 5.7Oregon 12,927 2,048 15.8 12,927 864 6.7PennsylvaniaPuerto Rico 15,066 321 2.1Rhode Isl<strong>and</strong> 4,400 652 14.8South Carolina 10,795 92 0.9South DakotaTennesseeTexas 69,065 9,773 14.2 69,065 1,504 2.2Utah 13,043 293 2.2 13,043 202 1.5Vermont 861 92 10.7 861 18 2.1VirginiaWashington 7,294 1,080 14.8 7,294 577 7.9West VirginiaWisconsin 8,583 538 6.3Wyoming 786 367 46.7 786 246 31.3Total 432,501 133,895 424,086 34,501Percent 31.0 8.1Number Reporting 23 23 23 25 25 2598 <strong>Child</strong> <strong>Maltreatment</strong> <strong>2006</strong>
Table 6–8 Factors Related to Receipt of PostinvestigationServices <strong>and</strong> Foster Care, <strong>2006</strong>FACTOR CATEGORIESODDS RATIOPREDICTINGSERVICES(N=509,578)ODDS RATIO OFPREDICTING IN-HOMESERVICES(N = 509,578)ODDS RATIOPREDICTING FOSTERCARE PLACEMENT(N=509,578)PRIOR VICTIMNo 1.00 1.00 1.00Yes 1.42 *** 0.90 *** 1.71 ***CHILD DISABILITYNo 1.00 1.00 1.00Yes 2.00 *** 0.63 *** 2.83 ***TYPE OF MALTREATMENTPhysical Abuse Only 1.00 1.00 1.00Neglect Only 1.20 *** 0.98 1.27 ***Sexual Abuse Only 0.76 *** 0.82 *** 0.65 ***“Other” Abuse 0.97 1.35 *** 0.62 ***Multiple <strong>Maltreatment</strong>s 1.65 *** 0.87 *** 2.02 ***CHILD AGE
100 <strong>Child</strong> <strong>Maltreatment</strong> <strong>2006</strong>
Additional ResearchRelated to<strong>Child</strong> <strong>Maltreatment</strong>CHAPTER 7This chapter describes additional research activities related to child maltreatment including thoseusing data from the National <strong>Child</strong> Abuse <strong>and</strong> Neglect Data System (NCANDS). The U.S. Departmentof Health <strong>and</strong> Human Services (HHS), other Federal <strong>and</strong> State agencies, <strong>and</strong> other organizationshave sponsored these studies. Ideas <strong>and</strong> suggestions <strong>for</strong> future research also are included.Reports on Key Indicators, Outcomes, <strong>and</strong> National Statistics<strong>Child</strong> Welfare OutcomesThe <strong>Child</strong> Welfare Outcomes 2003: Annual Report is the sixth annual report in the series, whichis published by the <strong>Child</strong>ren’s Bureau. The report contains in<strong>for</strong>mation by State on key childmaltreatment indicators, including the two measures of reducing recurrence of child abuse <strong>and</strong>neglect, <strong>and</strong> reducing the incidence of child abuse <strong>and</strong> neglect in foster care. These measures, asreported in the 2003 annual report, are as follows:■ “Of the children who were victims of substantiated or indicated child abuse or neglect duringthe first 6 months of the period under review, 6.1 percent or fewer children had anothersubstantiated or indicated report within 6 months.”■ “Of the children in foster care during the period under review, 0.57 percent or fewer were thesubject of substantiated or indicated maltreatment by a foster parent or facility staff member.”These key measures, as well as other contextual data on child victims, were based on data submittedto NCANDS. The report also contains data about foster care, adoption, <strong>and</strong> in<strong>for</strong>mationderived from the Adoption <strong>and</strong> Foster Care Analysis <strong>and</strong> Reporting System (AFCARS) as wellas from the <strong>Child</strong> <strong>and</strong> Family Services Reviews. This report is available on the <strong>Child</strong>ren’s BureauWeb site at http://www.acf.hhs.gov/programs/cb/stats_research/index.htm#cw.For further in<strong>for</strong>mation about <strong>Child</strong> Welfare Outcomes 2003: Annual Report, contact: Sharon Newburg-Rinn, Ph.D. Social Science Research Analyst <strong>Child</strong>ren’s Bureau/ACYF/ACF U.S. Department of Health <strong>and</strong> Human Services Portals Building 1250 Maryl<strong>and</strong> Avenue, Room 8378 Washington, DC 20024 CHAPTER 7: Additional Research 101
202–205–0749snewburg-rinn@acf.hhs.govAmerica’s <strong>Child</strong>ren: Key National Indicators of Well-BeingThis newly restructured annual report is a compendium of indicators drawn from the mostreliable offcial statistics that illustrates both the promises <strong>and</strong> the diffculties young peopleconfront. The report is a product of collaboration among 22 Federal agencies that <strong>for</strong>m theInteragency Forum on <strong>Child</strong> <strong>and</strong> Family Statistics. The 2007 report presents two new sections—Physical Environment <strong>and</strong> Safety <strong>and</strong> Health Care—<strong>and</strong> nine new indicators. One such indicatoris on child maltreatment <strong>and</strong> used data from NCANDS.The Interagency Forum on <strong>Child</strong> <strong>and</strong> Family Statistics publishes a more detailed report duringodd-numbered years <strong>and</strong> alternates with a condensed version, America’s <strong>Child</strong>ren in Brief: KeyNational Indicators of Well-Being, which highlights selected indicators during even-numberedyears. The report can be found online at http://childstats.gov.For further in<strong>for</strong>mation about America’s <strong>Child</strong>ren in Brief: Key National Indicators of Well-Being, contact:Shara GodiwallaForum DirectorCenters <strong>for</strong> Disease Control <strong>and</strong> PreventionNational Center <strong>for</strong> Health Statistics3311 Toledo Rd., Room 6114Hyattsville, Maryl<strong>and</strong> 20782(301) 458–4256buh7@cdc.govStatistical Abstract of the United StatesThe Statistical Abstract, prepared by the U.S. Census Bureau, contains a collection of statisticson social <strong>and</strong> economic conditions in the United States. Selected international data also areincluded. For many years, two tables using NCANDS data have been published. One tablereports the characteristics of child victims by maltreatment, sex, age, <strong>and</strong> race or ethnicity. Thesecond table reports the number of investigations, the number of children who were subjects ofinvestigations, <strong>and</strong> the number of victims by State.The 2007 edition of the Statistical Abstract was published <strong>and</strong> is available on CD-ROM. An online version is available at http://www.census.gov/compendia/statab/.For further in<strong>for</strong>mation about the Statistical Abstract, contact: Richard P. KerseyStatistical AbstractU.S. Census Bureau(301) 763–4428richard.patrick.kersey@census.gov102 <strong>Child</strong> <strong>Maltreatment</strong> <strong>2006</strong>
Studies of the Characteristics of <strong>Child</strong>renin the <strong>Child</strong> Welfare SystemOutcomes <strong>for</strong> <strong>Child</strong>ren With Allegations of Neglect Who Receive AlternativeResponse <strong>and</strong> Traditional Investigations: Findings From NCANDSThis analysis focused on the question of whether children in alternative response systems arekept as safe as children who receive traditional investigations. This study used 2004 <strong>and</strong> 2005NCANDS data to examine patterns of reentry into the child protective services (CPS) systemamong children who receive assessments <strong>and</strong> those who receive traditional investigationsfollowing allegations of neglect. Neglect was chosen as the focus of this study because it is oftenassociated with conditions related to poverty <strong>and</strong> caregiver behavior <strong>and</strong> is, there<strong>for</strong>e, likely tobe more chronic in nature. The relatively high rates of repeat victimization seen in children withallegations of neglect justify neglect as an important focus <strong>for</strong> intervention <strong>and</strong> prevention ofsubsequent maltreatment.Two <strong>for</strong>ms of event history analyses were conducted—trajectory pattern analysis <strong>and</strong> proportionalhazards analysis. The trajectory analysis demonstrated little difference in the rereportingrate of children who received an assessment following allegations of neglect, compared withchildren who received traditional investigations.The proportional hazards analysis revealed that children in the assessment track had a somewhatdecreased risk of rereporting when compared with children receiving investigations. Therisk of rereporting was generally greater <strong>for</strong> assessed children who were placed in foster carethan <strong>for</strong> investigated children who were placed in foster care.For additional in<strong>for</strong>mation on this analysis, contact:Mary Jo Ortiz Walter R. McDonald & Associates, Inc.2720 Gateway Oaks Drive, suite 250Sacramento CA 95833916–239–4020mjortiz@wrma.comNational Survey of <strong>Child</strong> <strong>and</strong> Adolescent Well-BeingThe National Survey of <strong>Child</strong> <strong>and</strong> Adolescent Well-Being (NSCAW) is a nationally representative,longitudinal survey that focuses on the well-being of more than 6,200 children—in twosamples—who have encountered the child welfare system.■ The NSCAW I core sample of 5,501 children in 36 States represents all children who wereinvestigated <strong>for</strong> child maltreatment during the 15-month baseline period, which began inOctober 1999. <strong>Child</strong>ren were included whether or not the case was substantiated or founded<strong>and</strong> whether or not they received child welfare services as a result of the investigation.■ A second NSCAW I sample component of more than 727 children represents all children whohad been in foster care <strong>for</strong> about 1 year.In NSCAW I, direct interviews <strong>and</strong> assessments were conducted with the children, theircaregivers, caseworkers, <strong>and</strong> teachers, at baseline <strong>and</strong> again at 18 months <strong>and</strong> 36 months after aCHAPTER 7: Additional Research 103
CPS investigation. A 12-month postbaseline followup with caregivers <strong>and</strong> caseworkers focused on services received during the year after the investigation. More than 80 percent of the children <strong>and</strong> families interviewed at baseline participated in the 36-month followup interviews. A fourth followup of children was conducted during 2005–2007.A second longitudinal sample is beginning in 2008. The NSCAW II design <strong>and</strong> protocol are very similar to the prior study. Data will be collected from 5,700 children, current caregivers, caseworkers, <strong>and</strong> teachers sampled from the NSCAW I-selected counties using similar measures. Drawing a new sample of children from the same locations will allow researchers to better gauge the effect of changes in policies, practices, <strong>and</strong> external constraints like budget resources. NSCAW II data will also include administrative data like that provided by the States <strong>for</strong> NCANDS <strong>and</strong> AFCARS, to obtain more complete data about rereports, service receipt, <strong>and</strong> placement history.The NSCAW data sets represent an important resource <strong>for</strong> researchers interested in child maltreatment, child welfare, child development, <strong>and</strong> services to high-risk children <strong>and</strong> families. In<strong>for</strong>mation is available on children’s health; development; social, emotional, <strong>and</strong> cognitive functioning; <strong>and</strong> both children’s <strong>and</strong> caregivers’ service needs <strong>and</strong> service utilization. Contextual in<strong>for</strong>mation is provided about the children’s household characteristics, as well as the child welfare service system. NSCAW I data collection is scheduled to be completed in December 2007, <strong>and</strong> the NSCAW II baseline will begin in March 2008. An 18-month followup is scheduled to begin in September 2009. Study reports <strong>and</strong> research briefs <strong>and</strong> more in<strong>for</strong>mation about NSCAW methods <strong>and</strong> measures are available at http://www.acf.hhs.gov/programs/opre/abuse_neglect/nscaw/index.html.The data from NSCAW are available to researchers through licensing agreements with the National Data Archive on <strong>Child</strong> Abuse <strong>and</strong> Neglect (NDACAN) at Cornell University. For more in<strong>for</strong>mation on accessing the NSCAW data sets, please see http://www.ndacan.cornell.edu. For additional in<strong>for</strong>mation about the National Survey of <strong>Child</strong> <strong>and</strong> Adolescent Well-Being, contact:Mary Bruce Webb, Ph.D.Offce of Planning, Research <strong>and</strong> Evaluation/ACFU.S. Department of Health <strong>and</strong> Human Services370 L’Enfant Promenade SWWashington, DC 20447202–205–8628mbwebb@acf.hhs.govLongitudinal Analysis of Repeated <strong>Child</strong> Abuse Reporting <strong>and</strong> Victimization:Multistate Analysis of Associated FactorsMost children who are subjects of maltreatment reports to CPS are involved just once with CPS;however, some children experience repeated investigations <strong>and</strong> victimizations. The presentstudy examines individual, maltreatment, <strong>and</strong> service-related factors associated with maltreatmentrereporting <strong>and</strong> substantiated rereporting in a multi-State context. Case-level NCANDSdata with a sample of 505,621 children were analyzed.104 <strong>Child</strong> <strong>Maltreatment</strong> <strong>2006</strong>
Within 24 months, 22 percent of children were rereported, <strong>and</strong> 7 percent were rereported withsubstantiation. <strong>Child</strong>ren who were younger, white or of mixed race, who had disabilities, <strong>and</strong>whose caregivers abused alcohol, were more likely to be rereported <strong>and</strong> substantiated than specificreference groups. Service provision, including foster care placement, was associated with increasedlikelihood of these subsequent events. These findings suggest that reentry into CPS is a complexinteraction of risks to children <strong>and</strong> systemic factors tied to the intervention they receive.For additional in<strong>for</strong>mation about the Longitudinal Analysis of Repeated <strong>Child</strong> Abuse Reporting<strong>and</strong> Victimization: Multistate Analysis of Associated Factors contact:John D. Fluke, Ph.D.DirectorResearch Center on <strong>Child</strong> ProtectionAmerican Humane Association63 Inverness Drive EastEnglewood, CO 80112(303) 925–9416johnf@americanhumane.orgFourth National Incidence Study (NIS-4)HHS is conducting the Fourth National Incidence Study of <strong>Child</strong> Abuse <strong>and</strong> Neglect (NIS–4).NIS–4 will measure the incidence <strong>and</strong> prevalence of child maltreatment by a wide array ofdemographic characteristics. Like its predecessors, NIS–4 is a Congressionally m<strong>and</strong>ated study.It was m<strong>and</strong>ated by the Keeping <strong>Child</strong>ren <strong>and</strong> <strong>Families</strong> Safe Act of 2003 (P.L. 108–36). NIS–4aims to estimate the current national incidence, severity, <strong>and</strong> demographic distribution ofchild maltreatment based on st<strong>and</strong>ardized research definitions <strong>and</strong> to assess changes since theprevious NIS data were collected. DHHS is conducting NIS–4 through a contract with Westat, anational social science research firm that also conducted all three previous NIS cycles. AssistingWestat with the study planning <strong>and</strong> CPS recruitment <strong>and</strong> data analysis is Walter R. McDonald& Associates, Inc. (WRMA).Earlier research has shown that many more children are abused <strong>and</strong> neglected in a communitythan are observed at any single agency. To develop a comprehensive picture of the extent of childabuse <strong>and</strong> neglect, NIS–4 is pulling together data from a number of agency sources in each studycounty. The NIS estimates begin with data from the local CPS agency concerning the reportsthey received <strong>and</strong> accepted <strong>for</strong> investigation during the study reference period. Building on thisfoundation, the NIS estimates also incorporate data on abused <strong>and</strong> neglected children who wereseen by professionals in a number of other community agencies, including the county publichealth, public housing, juvenile probation departments, <strong>and</strong> the sheriff or State police. Data werealso gathered from scientifically selected samples of other agencies, including voluntary socialservice <strong>and</strong> mental health agencies, municipal police departments, schools, hospitals, daycarecenters, <strong>and</strong> shelters <strong>for</strong> runaway youth <strong>and</strong> battered women. Designated professionals in theselected community agencies served as study “sentinels” by staying on the lookout <strong>for</strong> childrenwho were abused or neglected during the study period <strong>and</strong> by providing descriptive in<strong>for</strong>mationon the cases they encountered.CHAPTER 7: Additional Research 105
Data collection occurred in two phases in a nationally representative sample of 122 counties.These counties were selected using scientific sampling procedures that ensured the necessarymix of geographic regions, urban <strong>and</strong> rural areas, <strong>and</strong> other major community characteristics.More in<strong>for</strong>mation about the study <strong>and</strong> its progress is available at http://www.nis4.org.For additional in<strong>for</strong>mation about the Fourth National Incidence Study, contact:Maria WoolvertonOffce of Planning, Research <strong>and</strong> Evaluation<strong>Administration</strong> <strong>for</strong> <strong>Child</strong>ren <strong>and</strong> <strong>Families</strong>U.S. Department of Health <strong>and</strong> Human Services370 L’Enfant Promenade SWWashington, DC 20447202–205–4039maria.woolverton@acf.hhs.govCapacity-Building InitiativesThe National Resource Center <strong>for</strong> <strong>Child</strong> Welfare Data <strong>and</strong> TechnologyThe National Resource Center <strong>for</strong> <strong>Child</strong> Welfare Data <strong>and</strong> Technology (NRC-CWDT) is aservice of the <strong>Child</strong>ren’s Bureau that provides a broad range of technical assistance to State <strong>and</strong>Tribal child welfare agencies <strong>and</strong> the courts about data <strong>and</strong> systems issues to improve outcomes<strong>for</strong> children <strong>and</strong> families.The Center helps States, Tribes, <strong>and</strong> courts improve the quality of data collected, build thecapacity to use the in<strong>for</strong>mation <strong>for</strong> decisionmaking in daily practice, <strong>and</strong> develop or improvecase management <strong>and</strong> data collection systems, including Statewide Automated <strong>Child</strong> WelfareIn<strong>for</strong>mation Systems (SACWIS). The NRC-CWDT provides technical assistance to States to helpimprove the quality of data reported to the Federal government in the Adoption <strong>and</strong> Foster CareAnalysis <strong>and</strong> Reporting System (AFCARS) <strong>and</strong> the NCANDS. The Center also provides technicalassistance during the <strong>Child</strong> <strong>and</strong> Family Services Reviews process <strong>and</strong> on other Federal, State,<strong>and</strong> local legislative requirements, policies, <strong>and</strong> initiatives. NRC-CWDT coordinates the dataconference sponsored by the <strong>Child</strong>ren’s Bureau, usually held on an annual basis. Additionaldissemination of in<strong>for</strong>mation <strong>and</strong> promising practices can be found at www.nrccwdt.org.For further in<strong>for</strong>mation about the NRC-CWDT, contact: Lynda Arnold DirectorNRC-CWDT2345 Crystal Drive Suite 250 Arlington, VA 22202877–672–4829larnold@cwla.org106 <strong>Child</strong> <strong>Maltreatment</strong> <strong>2006</strong>
The Family Violence <strong>and</strong> Trauma Research ProjectThe Family Violence <strong>and</strong> Trauma Project (FVTP) provides support to the Army Community<strong>and</strong> Family Support Center Headquarters, Department of the Army Family, AdvocacyCommittee; the Family Advocacy Research Subcommitttee; Family Advocacy ProgramManagers; Chiefs of Social Work Services; <strong>and</strong> Army social workers in the <strong>for</strong>m of briefings,papers, staff studies <strong>and</strong> a quarterly newsletter on the scientific <strong>and</strong> medical aspects ofchild <strong>and</strong> spouse abuse.FVTP completed the only two empirical research studies of Family Violence <strong>and</strong> Deployment.These studies documented the importance of predeployment family violence as a risk factor<strong>for</strong> postdeployment family violence <strong>and</strong> the possible role of the “honeymoon phase” of troopsreturning home.The FVTP writes <strong>and</strong> publishes Joining Forces Joining <strong>Families</strong>, a quarterly newsletter that bringsimportant research to the field. This newsletter is widely distributed to U.S. military organizations<strong>and</strong> other government <strong>and</strong> academic institutions with an interest in family advocacyresearch. The newsletter <strong>and</strong> additional in<strong>for</strong>mation on the Center <strong>for</strong> the Study of TraumaticStress can be found at the Center’s Web site http://www.center<strong>for</strong>thestudyoftraumaticstress.org/research.family.shtml.For further in<strong>for</strong>mation about the Family Violence <strong>and</strong> Trauma Research Project, contact: James E. McCarroll, Ph.D. Department of Psychiatry Center <strong>for</strong> the Study of Traumatic Stress University School of Medicine 4301 Jones Bridge Road Bethesda, MD 20814 301–319–8003Community-Based Grants <strong>for</strong> the Prevention of <strong>Child</strong> Abuse <strong>and</strong> Neglect (CBCAP)The CBCAP program provides funding to States <strong>for</strong> the purposes of:■ Supporting community-based ef<strong>for</strong>ts to develop, operate, exp<strong>and</strong>, enhance, <strong>and</strong> where appropriate, to network initiatives aimed at the prevention of child abuse <strong>and</strong> neglect; ■ Supporting networks of coordinated resources <strong>and</strong> activities to better strengthen <strong>and</strong> supportfamilies to reduce the likelihood of child abuse <strong>and</strong> neglect; <strong>and</strong>■ Fostering underst<strong>and</strong>ing, appreciation, <strong>and</strong> knowledge of diverse populations in order to effectively prevent <strong>and</strong> treat child abuse <strong>and</strong> neglect. It is estimated that CBCAP programs serve nearly 200,000 families <strong>and</strong> more than half amillion children every year. This number does not include the hundreds of thous<strong>and</strong>s of Stateresidents who benefit from the child abuse prevention public awareness <strong>and</strong> education activitiescarried out by lead agencies every year.CHAPTER 7: Additional Research 107
CBCAP CONCEPTUAL FRAMEWORKTERMSINPUTSOUTCOMES ACTIVITIES OUTPUTSSHORT-TERM &INTERMEDIATEOUTCOMES LONG-TERMUNDERLYING CONDITIONS:All families have inherentstrengths but they alsoexperience circumstances thatimpact their ability to provide <strong>for</strong>children’s basic physical <strong>and</strong>socioemotional needs. Theserisk factors increase <strong>for</strong> familiesexperiencing geographic orsocial isolation, economicchallenges, limited education oremployment, inexperience withpositive parenting, or physical ormental health issues.TARGET POPULATION:All families, especially those atrisk <strong>for</strong> abuse or neglect.RESOURCES:CAPTA, Title IIFederal CBCAP funding, otherFederal funds <strong>and</strong> State <strong>and</strong>local matching funds to supportprevention ef<strong>for</strong>tsDIRECTProvide support <strong>for</strong> parentsPromote the development ofparenting skillsImprove access to <strong>for</strong>mal/in<strong>for</strong>mal resourcesSupport the needs ofindividuals with disabilitiesCommit to parent leadership<strong>and</strong> engagementINDIRECTSupport networks ofcoordinated resourcesMaximize <strong>and</strong> leveragefunding <strong>for</strong> preventionConduct public awareness<strong>and</strong> educationAdvocate <strong>for</strong> systemic changeConduct ongoing assessment<strong>and</strong> evaluationDIRECTNumbers served through thecontinuum of preventive,family centered, culturallycompetent services (i.e.family resource <strong>and</strong> support,parent education, mutualsupport, home visiting,respite care, in<strong>for</strong>mation <strong>and</strong>referral)Number of parents involvedwith program planning <strong>and</strong>evaluationINDIRECTA public-private network ofprevention <strong>and</strong> family supportprogramsNumber of fundingmechanisms that blendFederal, State, local <strong>and</strong>private fundsNumbers reached throughpublic awareness <strong>and</strong>educationNumber of advocacy activitiesNumber of self-assessment,peer review, evaluation <strong>and</strong>quality assurance ef<strong>for</strong>tsIndividual <strong>and</strong> Family/Relationships LevelsIncrease in the number offamilies’ needs assessed<strong>and</strong> connected to serviceswithin their own communitiesIncrease in protective factorsto prevent abuse or neglectby parents <strong>and</strong> caregiversrelated to:bonding <strong>and</strong> attachmentparental resilienceknowledge of parenting<strong>and</strong> child developmentsocial connectionsconcrete support intimes of needDecrease in risk factorsassociated with reasons <strong>for</strong>serviceCommunity LevelIncrease in the availability ofappropriate evidence-based<strong>and</strong> evidence-in<strong>for</strong>medprogramsIncrease in number ofagencies developing <strong>and</strong>implementing action plans toaddress meaningful parentinvolvementIncrease in coordinationacross prevention, childwelfare <strong>and</strong> other child <strong>and</strong>family service systems (i.e.substance abuse, mentalhealth, education, earlychildhood, disability)Increase <strong>and</strong> expansion ofStatewide networks of familysupport <strong>and</strong> preventionprogramsIncrease in the continuum ofevaluation approaches usedSocietal levelIncrease in private, State <strong>and</strong>Federal funding <strong>for</strong> prevention<strong>and</strong> family supportIncrease in publicunderst<strong>and</strong>ing <strong>and</strong>engagement <strong>for</strong> theprevention of child abuse <strong>and</strong>neglectSAFETY<strong>Child</strong>ren are protected fromabuse <strong>and</strong> neglect.<strong>Child</strong>ren are maintained intheir own homes.Decrease in rate of first timevictims.Decrease in rate of first timeperpetrators.PERMANENCY<strong>Child</strong>ren have permanency<strong>and</strong> stability in their livingsituation.The continuity of familyrelationships <strong>and</strong>connections is preserved <strong>for</strong>children.WELL-BEING<strong>Families</strong> have enhancedcapacity to provide <strong>for</strong> theirchildren’s needs.<strong>Child</strong>ren’s educational,physical <strong>and</strong> mental healthneeds are met.<strong>Child</strong>ren have opportunities<strong>for</strong> healthy social <strong>and</strong>emotional development.Youth make a successful,self-sufficient transition toadulthood.Diversity of families isembraced <strong>and</strong> supported.CONTINUOUS IMPROVEMENTDevelopment of a culture ofcontinuous improvement in thestrengthening of families <strong>and</strong>the prevention of abuse <strong>and</strong>neglect.For further in<strong>for</strong>mation regarding the CBCAP program, contact:Melissa Brodowski, M.S.W./M.P.H.Offce on <strong>Child</strong> Abuse <strong>and</strong> Neglect<strong>Child</strong>ren’s Bureau, ACYF, ACF, HHS1250 Maryl<strong>and</strong> Ave., SW8th Floor #8127Washington, DC 20024202–205–2629melissa.brodowski@acf.hhs.gov108 <strong>Child</strong> <strong>Maltreatment</strong> <strong>2006</strong>
Suggestions <strong>for</strong> Future ResearchResearchers interested in using the NCANDS data can apply to the National Data Archive on<strong>Child</strong> Abuse <strong>and</strong> Neglect <strong>for</strong> access to various data files. A description of the National DataArchive is provided below, as well as some suggestions of topics of potential interest <strong>for</strong> futureresearch. Although far from comprehensive, these topics are of interest to the field.■ What are the effects of disproportionality in the child welfare system? How does it affectinvestigations or assessments, services, <strong>and</strong> outcomes?■ What are the specific issues regarding maltreatment of youths in foster care?■ What risk factors identified through investigations or assessments are associated withchildren who were removed from home <strong>and</strong> placed in foster care?National Data Archive on <strong>Child</strong> Abuse <strong>and</strong> NeglectHoused in the Family Life Development Center at Cornell University, the National Data Archiveon <strong>Child</strong> Abuse <strong>and</strong> Neglect (NDACAN) has been established by the <strong>Child</strong>ren’s Bureau toencourage scholars to use existing child maltreatment data sources in their research. NDACANacquires data sets from various national data collection ef<strong>for</strong>ts <strong>and</strong> from individual researchers,prepares the data <strong>and</strong> documentation <strong>for</strong> secondary analysis, <strong>and</strong> disseminates the data sets toresearchers who have been licensed to use the data.The Archive seeks to operate as more than a repository of data by providing resources <strong>and</strong>technical assistance that contribute to the field. In addition to assisting individual researchersas they work with the data, NDACAN also provides many opportunities <strong>for</strong> scholarly exchange.For example, NDACAN maintains an active electronic mailing list <strong>for</strong> discussing a range ofresearch issues. NDACAN also is well known <strong>for</strong> its annual Summer Research Institute. TheInstitute brings together a group of researchers who are working on projects using Archive data.During the week, participants consult with experts <strong>and</strong> attend colloquia designed to furtherprogress on their projects. Group computing sessions provide ample opportunity <strong>for</strong> participantsto conduct their analyses <strong>and</strong> to work together to resolve questions. Through these <strong>and</strong>other activities, NDACAN serves as a valuable resource to the research community. In<strong>for</strong>mationregarding the Archive, its services, <strong>and</strong> data holdings can be found on the Internet athttp://www.ndacan.cornell.edu.The Archive serves as the offcial repository of NCANDS data, providing access to both theState-level <strong>and</strong> case-level data components. Key NCANDS indicators have been available at theState-level in the Summary Data Component (SDC) <strong>and</strong> the Combined Aggregate File (CAF)data files, which are available to researchers <strong>for</strong> every year since 1990.Beginning with the 2004 data year, the Archive—in collaboration with the <strong>Child</strong>ren’s Bureau,the NCANDS Technical Team, <strong>and</strong> NCANDS State representatives—adopted a new data releaseplan <strong>for</strong> the case-level <strong>Child</strong> File that strikes a balance between protecting the confidentialityof the data <strong>and</strong> preserving the utility of the <strong>Child</strong> File as a research data set. By increasing thecontractual responsibilities of researchers wishing to use the <strong>Child</strong> File data <strong>and</strong> institutingadditional oversight of licensees, the Archive was able to implement a targeted set of confidentialitymodifications to the data, focused primarily on elements involving race <strong>and</strong> Hispanicethnicity, geography, <strong>and</strong> dates. This new approach enables the Archive to release comprehensivecase-level NCANDS data sets. Data from all States that submitted data using the <strong>Child</strong> File areavailable through the Archive starting with data submission year 2004.CHAPTER 7: Additional Research 109
For more in<strong>for</strong>mation about access to NDACAN, researchers may contact: John Eckenrode, Ph.D. DirectorNational Data Archive on <strong>Child</strong> Abuse <strong>and</strong> Neglect Family Life Development Center—Beebe Hall Cornell University Ithaca, NY 14853 607–255–7799jje1@cornell.eduNCANDS <strong>Child</strong> File Trans<strong>for</strong>med into a Relational DatabaseEach year, states submit their NCANDS <strong>Child</strong> File data to the <strong>Child</strong>ren’s Bureau. The resultingfile is a rectangular, or flat, data file consisting of rows <strong>and</strong> columns. There are 146 columns—one <strong>for</strong> each data element. There are as many rows as there are report-child pairs, because eachdifferent child on a CPS report generates a new record in the file, like this:Record NumberReportIdentifier<strong>Child</strong>Identifier Element 1 Element 2 Element 3…1 Report 1 <strong>Child</strong> 1 value value value2 Report 1 <strong>Child</strong> 2 value value value3 Report 2 <strong>Child</strong> 1 value value value4 Report 3 <strong>Child</strong> 1 value value value5 Report 3 <strong>Child</strong> 2 value value valueThe seeming simplicity of this data file structure conceals quite a bit of complexity. The complexity,<strong>and</strong> the resulting diffculty in analyzing data elements, stems from the fact that notall data elements contain in<strong>for</strong>mation about the same entity. The entity defined by a row is aReport-<strong>Child</strong>. Many of the data elements contain in<strong>for</strong>mation about this entity. The element“CdEmotnl,” <strong>for</strong> example captures whether this child was recorded as being clinically emotionallydisturbed at the time of this report. However, many of the data elements are not about thischild on this report, but are about some other entity. The elements “ReportID,” “Report Date,”“Report Source,” <strong>and</strong> so <strong>for</strong>th, are not about the report-child, but about the report itself. Thein<strong>for</strong>mation would simply be repeated <strong>for</strong> each child on the report. To count the number ofreports, one must account <strong>for</strong> multiple report IDs. Similarly, the child’s sex <strong>and</strong> race are permanentcharacteristics about the child, <strong>and</strong> are repeated if the child appears on other reports.Other entities, like maltreatments <strong>and</strong> perpetrators, are h<strong>and</strong>led differently. Since multiplemaltreatments or multiple perpetrators cannot generate new records, the in<strong>for</strong>mation aboutthese entities must be spread out into other data elements within the same record. For example,a record allows in<strong>for</strong>mation, such as maltreatment type <strong>and</strong> maltreatment disposition, to bestored <strong>for</strong> up to four maltreatments on the same record. For each of these maltreatments, therecan be up to three perpetrators. A column is created in the dataset <strong>for</strong> each of these possibilities,whether data is stored there or not.To do seemingly simple analysis tasks, such as counting the number of distinct perpetrators in aState, or computing the average number of maltreatments suffered by children, requires countingacross these multiple elements, while accounting <strong>for</strong> empty cells or repeating data. It can be diff110 <strong>Child</strong> <strong>Maltreatment</strong> <strong>2006</strong>
cult to obtain the appropriate counts. In <strong>Child</strong> <strong>Maltreatment</strong> 2005, <strong>for</strong> example, counts of perpetratorsare overestimated because a perpetrator is counted once <strong>for</strong> each child he or she victimizes.To facilitate analysis of the <strong>Child</strong> File, staff at the National Data Archive on <strong>Child</strong> Abuse <strong>and</strong>Neglect at Cornell University undertook to restructure the data in such a way that each entitywould reside in a separate table, with defined relationships between the tables. Such a structureis known as a relational database. In database terminology, the process of abstracting entities,characteristics of entities, <strong>and</strong> the relationships among the entities is called “normalization.”The process of normalization requires asking, <strong>for</strong> each data element, what entity it is describing.In doing so, the Archive identified eight distinct entities. A separate table was created <strong>for</strong> eachentity, <strong>and</strong> each element was re-assigned to a specific table. The entities <strong>and</strong> the relationshipsbetween them are illustrated below. An arrow should be read as “may appear one or more timesin.” For example, one <strong>Child</strong> appears many times in the Report-<strong>Child</strong> table, <strong>and</strong> one Perpetratormay appear one or more times in the Report-Perp table.Report-<strong>Child</strong><strong>Child</strong><strong>Child</strong>-PerpReportReport-PerpPerpetrator<strong>Maltreatment</strong><strong>Maltreatment</strong>-PerpThe entities <strong>Child</strong>, Report, Perpetrator, <strong>and</strong> <strong>Maltreatment</strong> are “atomic”. There is one record inthe table <strong>for</strong> each distinct entity (within a State). For example, there is one record in the <strong>Child</strong>table <strong>for</strong> each distinct child identifier within each state. The structure of the <strong>Child</strong> table lookslike this:State <strong>Child</strong>ID <strong>Child</strong> Sex <strong>Child</strong> Race 1 <strong>Child</strong> Race 2…AK 1 value value valueAK 2 value value valueAK 3 value value valueCA 1 value value valueCA 2 value value valueOther tables contain in<strong>for</strong>mation about composite entities. Such entities require more than oneidentifier to define a record. For example, the <strong>Child</strong>-Perp table, which stores data elements thatdescribe the relationship between each distinct child-perpetrator pair, looks like this:State <strong>Child</strong>ID PerpID Relationship Parent Role CaretakerAK 1 1 value value valueAK 2 1 value value valueAK 2 2 value value valueCA 1 1 value value valueCA 2 1 value value valueCHAPTER 7: Additional Research 111
This restructured dataset makes it much easier to obtain distinct counts of the atomic entities.To obtain a distinct, unduplicated, count of children who were subjects of a CPS investigation,<strong>for</strong> example, the researcher need only ask how many records there are in the <strong>Child</strong> table. Similarly,the Perpetrator table contains a separate record <strong>for</strong> each distinct perpetrator contained inthe NCANDS data. Not only does the relational database allow <strong>for</strong> simple queries of the data, italso provides sophisticated users with the ability to develop complex queries, framing questionsthat could not realistically be obtained from the flat file structure of the NCANDS <strong>Child</strong> File.For example, it is possible to find how many distinct children have been physically abused bymore than one type of perpetrator or to count how many reports during the year in which aperpetrator has been substantiated <strong>for</strong> maltreatment.Problems arise in creating this version of the NCANDS data. In the relational version, a value<strong>for</strong> a data element appears only once, while in the flat file, the same element may appear multipletimes. As a result, different values <strong>for</strong> the same element may occur. For example, a child’s dateof birth (DOB) appears in the original dataset once <strong>for</strong> each report that the child appears on.It is possible that there would be more than one version of the date, or records where no DOBappears. In moving the data from the flat file to the <strong>Child</strong> table in the relational database, onlyone DOB is acceptable. The one that is selected may not be the correct one, or it might end upwith a missing value where the value is not missing on some other record.Another problem is that counts produced from the relational database may vary from the publishedcounts in the <strong>Child</strong> <strong>Maltreatment</strong> report series, causing possible confusion <strong>and</strong> makingcomparisons with historical published values less meaningful.Due to such considerations, the Archive’s intention is to refrain from making this version of thedatabase available to the research community at this time. Be<strong>for</strong>e releasing the data or publishingin<strong>for</strong>mation that appears to conflict with published reports, there is more work to be done. Archivestaff need to collaborate with the NCANDS Technical Team <strong>and</strong> NCANDS State Representativesto compare the national DBMS with State SACWIS systems, <strong>and</strong> to explore implications <strong>for</strong> futureNCANDS development. Creation of a relational database that accurately reflects the data that havebeen submitted by the States is the ultimate goal, with the hope that a more complete <strong>and</strong> nuancednational portrait of child maltreatment in the United States can be achieved.For more in<strong>for</strong>mation about the NCANDS relational database, researchers may contact:Elliott G. Smith, PhDAssociate DirectorNational Data Archive on <strong>Child</strong> Abuse <strong>and</strong> NeglectCornell UniversityIthaca, NY 14853607–255–8104egs1@cornell.edu112 <strong>Child</strong> <strong>Maltreatment</strong> <strong>2006</strong>
Appendices
114 <strong>Child</strong> <strong>Maltreatment</strong> <strong>2006</strong>
Required CAPTAData ItemsAPPENDIX AIn 1996, the <strong>Child</strong> Abuse Prevention <strong>and</strong> Treatment Act was amended to read “Each State to which agrant is made under this section shall annually work with the Secretary of the Department of Health <strong>and</strong>Human Services to provide, to the maximum extent practicable, a report that includes the following:” 1(1) The number of children who were reported to the State during the year as abused or neglected.(2) Of the number of children described in paragraph (1), the number with respect to whom suchreports were—(A) substantiated;(B) unsubstantiated; or(C) determined to be false.(3) Of the number of children described in paragraph (2)—(A) the number that did not receive services during the year under the State program fundedunder this section or an equivalent State program;(B) the number that received services during the year under the State program funded underthis section or an equivalent State program; <strong>and</strong>(C) the number that were removed from their families during the year by disposition of thecase.(4) The number of families that received preventive services from the State during the year.(5) The number of deaths in the State during the year resulting from child abuse or neglect.(6) Of the number of children described in paragraph (5), the number of such children who were infoster care.(7) The number of child protective services workers responsible <strong>for</strong> the intake <strong>and</strong> screening of reportsfiled in the previous year.(8) The agency response time with respect to each such report with respect to initial investigation ofreports of child abuse or neglect.(9) The response time with respect to the provision of services to families <strong>and</strong> children where an allegationof abuse or neglect has been made.(10) The number of child protective services workers responsible <strong>for</strong> intake, assessment, <strong>and</strong> investigationof child abuse <strong>and</strong> neglect reports relative to the number of reports investigated in the previous year.(11) The number of children reunited with their families or receiving family preservation services that,within five years, result in subsequent substantiated reports of child abuse <strong>and</strong> neglect, including thedeath of the child.(12) The number of children <strong>for</strong> whom individuals were appointed by the court to represent the bestinterests of such children <strong>and</strong> the average number of out of court contacts between such individuals<strong>and</strong> children.1 The most recent reauthoriztion of CAPTA, The Keeping <strong>Child</strong>ren <strong>and</strong> <strong>Families</strong> Safe Act of 2003, Public Law 108–36, (42U.S.C. 5106), retained these provisions.APPENDIX A: Required CAPTA Data Items 115
Table A–1 Required CAPTA Data Items, by State Response, <strong>2006</strong>CHILDREN CHILDREN FAMILIES WHO CPSCHILDREN REPORTED TO REPORTED TO RECEIVED WORKERSREPORTED TO THE STATE, BY THE STATE, BY PREVENTIVE CHILD RESPONSIBLE FORTHE STATE, BY DISPOSITION AND DISPOSITION AND SERVICES FROM CHILD FATALITIES IN SCREENING ANDDISPOSITION SERVICE RECEIPT REMOVAL STATUS THE STATE FATALITIES FOSTER CARE INTAKESTATE (1,2)* (3A,3B) (3C) (4) (5) (6) (7)Alabama ■ ■ ■ ■Alaska ■ ■ ■ ■ ■ ■ ■Arizona ■ ■ ■ ■ ■ ■ ■Arkansas ■ ■ ■ ■ ■ ■ ■Cali<strong>for</strong>nia ■ ■ ■ ■ ■Colorado ■ ■ ■ ■ ■ ■Connecticut ■ ■ ■ ■ ■Delaware ■ ■ ■ ■ ■ ■ ■District of Columbia ■ ■ ■ ■ ■ ■ ■Florida ■ ■ ■ ■ ■ ■ ■Georgia ■ ■ ■Hawaii ■ ■ ■ ■ ■ ■Idaho ■ ■ ■ ■ ■ ■ ■Illinois ■ ■ ■ ■ ■ ■ ■Indiana ■ ■ ■ ■ ■ ■ ■Iowa ■ ■ ■ ■ ■ ■Kansas ■ ■ ■ ■ ■ ■ ■Kentucky ■ ■ ■ ■ ■ ■Louisiana ■ ■ ■ ■ ■ ■ ■Maine ■ ■ ■ ■ ■ ■Maryl<strong>and</strong>Massachusetts ■ ■ ■ ■Michigan ■ ■Minnesota ■ ■ ■ ■ ■ ■ ■Mississippi ■ ■ ■ ■ ■ ■ ■Missouri ■ ■ ■ ■ ■ ■ ■Montana ■ ■ ■ ■ ■ ■ ■Nebraska ■ ■ ■ ■ ■ ■ ■Nevada ■ ■ ■ ■ ■ ■ ■New Hampshire ■ ■ ■ ■ ■ ■ ■New Jersey ■ ■ ■ ■ ■ ■ ■New Mexico ■ ■ ■ ■ ■ ■ ■New York ■ ■ ■ ■North Carolina ■ ■ ■North Dakota ■ ■Ohio ■ ■ ■ ■ ■ ■Oklahoma ■ ■ ■ ■ ■ ■ ■Oregon ■ ■ ■ ■Pennsylvania ■ ■ ■ ■ ■ ■Puerto Rico ■ ■ ■ ■ ■ ■ ■Rhode Isl<strong>and</strong> ■ ■ ■ ■ ■ ■ ■South Carolina ■ ■ ■ ■ ■ ■South Dakota ■ ■ ■ ■ ■ ■ ■Tennessee ■ ■ ■ ■ ■ ■ ■Texas ■ ■ ■ ■ ■ ■ ■Utah ■ ■ ■ ■ ■ ■ ■Vermont ■ ■ ■ ■ ■ ■ ■Virginia ■ ■ ■ ■ ■ ■ ■Washington ■ ■ ■ ■ ■ ■ ■West Virginia ■ ■ ■ ■ ■Wisconsin ■ ■ ■ ■ ■ ■Wyoming ■ ■ ■ ■ ■ ■Number 51 45 45 39 48 45 38* Numbers correspond to required CAPTA items listed in Appendix A.116 <strong>Child</strong> <strong>Maltreatment</strong> <strong>2006</strong>
STATERESPONSE TIMEWITH RESPECT TOINVESTIGATION(8)RESPONSE TIMEWITH RESPECT TOSERVICES(9)CPS WORKERSRESPONSIBLEFOR INTAKE,ASSESSMENTANDINVESTIGATION(10)CHILD VICTIMSWHO RECEIVEDPRESERVATIONSERVICES WITHINTHE LAST 5YEARS(11)CHILD VICTIMSWHO WEREREUNITED WITHTHEIR FAMILIESWITHIN THE LAST5 YEARS(12)CHILD VICTIMSWHO WEREASSIGNED COURTAPPOINTEDREPRESENTATIVES(12)AVERAGENUMBER OFCONTACTSOF COURTAPPOINTEDREPRESENTATIVEWITH CHILD(12)Alabama■Alaska ■ ■ ■ ■Arizona ■ ■ ■ ■Arkansas ■ ■ ■ ■ ■ ■Cali<strong>for</strong>nia ■ ■Colorado■Connecticut ■ ■Delaware ■ ■ ■ ■ ■ ■District of Columbia ■ ■ ■ ■ ■Florida ■ ■ ■ ■ ■GeorgiaHawaii ■ ■ ■ ■ ■Idaho ■ ■ ■ ■Illinois ■ ■ ■Indiana ■ ■ ■Iowa ■ ■ ■ ■ ■Kansas ■ ■ ■ ■ ■ ■Kentucky ■ ■ ■Louisiana ■ ■ ■ ■Maine ■ ■ ■ ■Maryl<strong>and</strong>Massachusetts ■ ■ ■ ■ ■Michigan■Minnesota ■ ■ ■ ■ ■ ■Mississippi ■ ■ ■ ■Missouri ■ ■ ■ ■ ■ ■Montana ■ ■Nebraska ■ ■ ■ ■ ■Nevada ■ ■ ■ ■ ■ ■New Hampshire ■ ■ ■ ■ ■ ■ ■New Jersey ■ ■ ■ ■New Mexico ■ ■ ■ ■New YorkNorth Carolina ■ ■North Dakota■Ohio ■ ■ ■Oklahoma ■ ■ ■ ■ ■ ■Oregon ■ ■ ■ ■PennsylvaniaPuerto Rico ■ ■ ■ ■ ■ ■Rhode Isl<strong>and</strong> ■ ■ ■ ■ ■ ■South Carolina ■ ■ ■ ■South Dakota ■ ■ ■Tennessee ■ ■ ■ ■Texas ■ ■ ■ ■ ■Utah ■ ■ ■ ■ ■ ■Vermont ■ ■ ■ ■ ■ ■Virginia ■ ■ ■Washington ■ ■ ■ ■ ■West Virginia ■ ■Wisconsin ■ ■ ■ ■Wyoming ■ ■ ■ ■ ■Number 36 42 34 24 25 30 7APPENDIX A: Required CAPTA Data Items 117
118 <strong>Child</strong> <strong>Maltreatment</strong> <strong>2006</strong>
GlossaryAPPENDIX BACRONYMSAFCARS: Adoption <strong>and</strong> Foster Care Analysis <strong>and</strong> Reporting SystemCAF: Combined aggregate fileCAPTA: <strong>Child</strong> Abuse Prevention <strong>and</strong> Treatment ActCASA: Court-appointed special advocateCFSR: <strong>Child</strong> <strong>and</strong> Family Services ReviewsCHILD ID: <strong>Child</strong> IdentifierCPS: <strong>Child</strong> protective servicesFFY: Federal fiscal yearFIPS: Federal in<strong>for</strong>mation processing st<strong>and</strong>ardsFTE: Full-time equivalentGAL: Guardian ad litemHIPAA: Health Insurance Portability <strong>and</strong> Accountability ActNCANDS: National <strong>Child</strong> Abuse <strong>and</strong> Neglect Data SystemPART: Program Assessment Rating ToolPERPETRATOR ID: Perpetrator identifierREPORT ID: Report identifier.SACWIS: Statewide automated child welfare in<strong>for</strong>mation systemSSBG: Social Services Block GrantTANF: Temporary Assistance <strong>for</strong> Needy <strong>Families</strong>APPENDIX B: Glossary 119
DEFINITIONSADOPTION AND FOSTER CARE ANALYSIS AND REPORTING SYSTEM (AFCARS): The Federal collection of case-levelin<strong>for</strong>mation on all children in foster care <strong>for</strong> whom State child welfare agencies have responsibility <strong>for</strong> placement, care,or supervision <strong>and</strong> on children who are adopted under the auspices of the State’s public child welfare agency. AFCARSalso includes in<strong>for</strong>mation on foster <strong>and</strong> adoptive parents.ADOPTION SERVICES: Activities provided to assist with bringing about the adoption of a child.ADOPTIVE PARENT: A person with the legal relation of parent to a child not related by birth, with the same mutual rights <strong>and</strong> obligations that exist between children <strong>and</strong> their birth parents. The legal relationship has been finalized.AFCARS: See Adoption <strong>and</strong> Foster Care Analysis <strong>and</strong> Reporting System.AFCARS ID: The record number used in the AFCARS data submission or the value that would be assigned.AGE: Age, calculated in years, at the time of the alleged child maltreatment.AGENCY FILE: One of two data files submitted to NCANDS on a periodic basis. Contains aggregated child abuse data that cannot be derived from the case-level in<strong>for</strong>mation in the <strong>Child</strong> File, such as the provision of preventive services.ALCOHOL ABUSE CAREGIVER: Compulsive use of alcohol that is not of a temporary nature by the person responsible<strong>for</strong> the care <strong>and</strong> supervision of a child.ALCOHOL ABUSE CHILD: Compulsive use of alcohol that is not of a temporary nature by a child. Includes FetalAlcohol Syndrome or exposure to alcohol during pregnancy.ALLEGED PERPETRATOR: An individual who is alleged to have caused or knowingly allowed the maltreatment of a child as stated in an incident of child abuse or neglect.ALLEGED VICTIM: <strong>Child</strong> about whom a report regarding maltreatment has been made to a CPS agency.ALLEGED VICTIM REPORT SOURCE: A child who alleges to have been a victim of child maltreatment <strong>and</strong> who makes a report of the allegation.ALTERNATIVE RESPONSE NONVICTIM: A conclusion that the child was not a victim of maltreatment when a responseother than investigation was provided.ALTERNATIVE RESPONSE VICTIM: A conclusion that the child was identified as a victim when a response other thaninvestigation was provided.AMERICAN INDIAN or ALASKA NATIVE: A person having origins in any of the original peoples of North <strong>and</strong> SouthAmerica (including Central America), <strong>and</strong> who maintains tribal affliation or community attachment.ANONYMOUS OR UNKNOWN REPORT SOURCE: An individual who notifies a CPS agency of suspected childmaltreatment without identifying himself or herself; or the type of report source is unknown.ASIAN: A person having origins in any of the original peoples of the Far East, Southeast Asia, or the Indian subcontinent, including, <strong>for</strong> example, Cambodia, China, India, Japan, Korea, Malaysia, Pakistan, the Philippine Isl<strong>and</strong>s,Thail<strong>and</strong>, <strong>and</strong> Vietnam.ASSESSMENT: A process by which the CPS agency determines whether the child or other persons involved in thereport of alleged maltreatment is in need of services.BEHAVIOR PROBLEM-CHILD: A child’s behavior in the school or community that adversely affects socialization, learning, growth, <strong>and</strong> moral development. May include adjudicated or nonadjudicated behavior problems. Includes running away from home or a placement.BIOLOGICAL PARENT: The birth mother or father of the child.BLACK or AFRICAN-AMERICAN: A person having origins in any of the black racial groups of Africa.BOY: A male child younger than 18 years.CAPTA: See <strong>Child</strong> Abuse Prevention <strong>and</strong> Treatment Act.120 <strong>Child</strong> <strong>Maltreatment</strong> <strong>2006</strong>
CAREGIVER: A person responsible <strong>for</strong> the care <strong>and</strong> supervision of the alleged child victim.CAREGIVER RISK FACTOR: A primary caregiver’s characteristic, disability, problem, or environment, which wouldtend to decrease the ability to provide adequate care <strong>for</strong> the child.CASA: See Court-Appointed Special Advocate.CASE-LEVEL DATA: In<strong>for</strong>mation submitted by the States in the <strong>Child</strong> File containing individual child or reportmaltreatment characteristics.CASE MANAGEMENT SERVICES: Activities <strong>for</strong> the arrangement, coordination, <strong>and</strong> monitoring of services to meet theneeds of children <strong>and</strong> their families.CHILD: A person younger than 18 years of age or considered to be a minor under State law.CHILD ABUSE AND NEGLECT STATE GRANT: Funding to the States <strong>for</strong> programs serving abused <strong>and</strong> neglectedchildren, awarded under the <strong>Child</strong> Abuse Prevention <strong>and</strong> Treatment Act (CAPTA). May be used to assist States inintake <strong>and</strong> assessment; screening <strong>and</strong> investigation of child abuse <strong>and</strong> neglect reports; improving risk <strong>and</strong> safetyassessment protocols; training child protective service workers <strong>and</strong> m<strong>and</strong>ated reporters; <strong>and</strong> improving services todisabled infants with life-threatening conditions.CHILD ABUSE PREVENTION AND TREATMENT ACT [42 U.S.C. 5101 et seq.] (CAPTA): Federal legislation amended<strong>and</strong> reauthorized in 1996 that provides the foundation <strong>for</strong> Federal involvement in child protection <strong>and</strong> child welfareservices. The 1996 Amendments provide <strong>for</strong>, among other things, annual State data reports on child maltreatment tothe Secretary of Health <strong>and</strong> Human Services. The most recent reauthorization of CAPTA, The Keeping <strong>Child</strong>ren <strong>and</strong><strong>Families</strong> Safe Act of 2003 [42 U.S.C. 5106], retained these provisions.CHILD DAYCARE PROVIDER: A person with a temporary caregiver responsibility, but who is not related to the childsuch as a daycare center staff member, a family day care provider, or a baby-sitter. Does not include persons with legalcustody or guardianship of the child.CHILD DEATH REVIEW TEAM: A State or local team of professionals who review all or a sample of cases of childrenwho are alleged to have died due to maltreatment or other causes.CHILD FILE: The data file submitted to NCANDS annually that contains detailed case in<strong>for</strong>mation about children whoare the subjects of an investigation or assessment.CHILD ID: See <strong>Child</strong> Identifier.CHILD IDENTIFIER: A unique identification assigned to each child. This identification is not the State child identificationbut is an encrypted identification assigned by the State <strong>for</strong> the purposes of the NCANDS data collection.CHILD MALTREATMENT: An act or failure to act by a parent, caregiver, or other person as defined under State lawthat results in physical abuse, neglect, medical neglect, sexual abuse, emotional abuse, or an act or failure to act whichpresents an imminent risk of serious harm to a child.CHILD PROTECTIVE SERVICES AGENCY (CPS): An offcial agency of a State having the responsibility <strong>for</strong> child protectiveservices <strong>and</strong> activities.CHILD PROTECTIVE SERVICES (CPS) SUPERVISOR: The manager of the caseworker assigned to a report of childmaltreatment at the time of the report disposition.CHILD PROTECTIVE SERVICES (CPS) WORKER: The person assigned to a report of child maltreatment at the time ofthe report disposition.CHILD RECORD: A case-level record in the <strong>Child</strong> File containing the data associated with one child in one report.CHILD RISK FACTOR: A child’s characteristic, disability, problem, or environment, which would tend to increase therisk of his or her becoming a maltreatment victim.CHILD VICTIM: A child <strong>for</strong> whom an incident of abuse or neglect has been substantiated or indicated by an investigationor assessment. A State may include some children with alternative dispositions as victims.APPENDIX B: Glossary 121
CHILDREN’S BUREAU: Federal agency within the <strong>Administration</strong> on <strong>Child</strong>ren, Youth <strong>and</strong> <strong>Families</strong>, <strong>Administration</strong><strong>for</strong> <strong>Child</strong>ren <strong>and</strong> <strong>Families</strong>, U.S. Department of Health <strong>and</strong> Human Services, which is responsible <strong>for</strong> the collection <strong>and</strong>analysis of NCANDS data.CLOSED WITH NO FINDING: Disposition that does not conclude with a specific finding because the investigationcould not be completed <strong>for</strong> such reasons as: the family moved out of the jurisdiction; the family could not be located;or necessary diagnostic or other reports were not received within required time limits.COMMUNITY-BASED FAMILY RESOURCE AND SUPPORT GRANT: Grant provided under Section 210 of the <strong>Child</strong>Abuse Prevention <strong>and</strong> Treatment Act (CAPTA) that assists States to prevent child abuse <strong>and</strong> neglect <strong>and</strong> promotepositive development of parents <strong>and</strong> children by developing, operating, exp<strong>and</strong>ing, <strong>and</strong> enhancing a network ofcommunity-based, prevention-focused, family resource <strong>and</strong> support programs that coordinate resources among abroad range of human service organizations.CONTACT PERSON, STATE: The State person with the responsibility to provide in<strong>for</strong>mation to the NCANDS.CPS: See <strong>Child</strong> Protective Services.COUNSELING SERVICES: Activities that apply the therapeutic processes to personal, family, situational, or occupationalproblems in order to bring about a positive resolution of the problem or improved individual or familyfunctioning or circumstances.COUNTY OF REPORT: The geopolitical sub-State jurisdiction to which the report of alleged child maltreatment wasassigned <strong>for</strong> CPS response (investigation, assessment, or alternative response).COUNTY OF RESIDENCE: The geopolitical sub-State jurisdiction in which the child was residing at the time of thereport of maltreatment.COURT-APPOINTED REPRESENTATIVE: A person appointed by the court to represent a child in a neglect or abuseproceeding. May be an attorney or a court-appointed special advocate (or both) <strong>and</strong> is often referred to as a guardianad litem (GAL). The representative makes recommendations to the court concerning the best interests of the child.COURT-APPOINTED SPECIAL ADVOCATE: Adult volunteers trained to advocate <strong>for</strong> abused <strong>and</strong> neglected childrenwho are involved in the juvenile court.COURT ACTION: Legal action initiated by a representative of the CPS agency on behalf of the child. This includesauthorization to place the child in foster care, filing <strong>for</strong> temporary custody, dependency, or termination of parentalrights. It does not include criminal proceedings against a perpetrator.DAYCARE SERVICES: Activities provided to a child or children in a setting that meets applicable st<strong>and</strong>ards of State <strong>and</strong>local law, in a center or in a home, <strong>for</strong> a portion of a 24-hour day.DISABILITY: A child is considered to have a disability if one of more of the following risk factors has been identified:mentally retarded child, emotionally disturbed child, visually impaired child, child is learning disabled, child isphysically disabled, child has behavioral problems, or child has some other medical problem. In general, children withsuch conditions are undercounted as not every child receives a clinical diagnostic assessment.DISPOSITION: See Investigation Disposition.DOMESTIC VIOLENCE: Incidents of interspousal physical or emotional abuse perpetrated by one of the spouses orparent figures upon the other spouse or parent figure in the child’s home environment.DRUG ABUSE CAREGIVER: The compulsive use of drugs that is not of a temporary nature the person responsible <strong>for</strong>the care <strong>and</strong> supervision of a child.DRUG ABUSE CHILD: Compulsive use of drugs that is not of a temporary nature by a child. Includes infants exposed todrugs during pregnancy.EDUCATION AND TRAINING SERVICES: Activities provided to improve knowledge of daily living skills <strong>and</strong> toenhance cultural opportunities.EDUCATIONAL PERSONNEL: Employees of a public or private educational institution or program; includes teachers,teacher assistants, administrators, <strong>and</strong> others directly associated with the delivery of educational services.122 <strong>Child</strong> <strong>Maltreatment</strong> <strong>2006</strong>
EMOTIONALLY DISTURBED: A clinically diagnosed condition exhibiting one or more of the following characteristicsover a long period of time <strong>and</strong> to a marked degree: an inability to build or maintain satisfactory interpersonalrelationships; inappropriate types of behavior or feelings under normal circumstances; a general pervasive mood ofunhappiness or depression; or a tendency to develop physical symptoms or fears associated with personal problems.The diagnosis is based on the Diagnostic <strong>and</strong> Statistical Manual of Mental Disorders (the most recent edition of DSM).The term includes schizophrenia <strong>and</strong> autism.EMPLOYMENT SERVICES: Activities provided to assist individuals in securing employment or the acquiring of skillsthat promote opportunities <strong>for</strong> employment.FAMILY: A group of two or more persons related by birth, marriage, adoption, or emotional ties.FAMILY PRESERVATION SERVICES: Activities designed to help families alleviate crises that might lead to out-of-homeplacement of children, maintain the safety of children in their own homes, support families preparing to reunifyor adopt, <strong>and</strong> assist families in obtaining services <strong>and</strong> other supports necessary to address their multiple needs in aculturally sensitive manner.FAMILY SUPPORT SERVICES: Community-based preventive activities designed to alleviate stress <strong>and</strong> promoteparental competencies <strong>and</strong> behaviors that will increase the ability of families to nurture their children successfully,enable families to use other resources <strong>and</strong> opportunities available in the community, <strong>and</strong> create supportive networksto enhance childrearing abilities of parents.FATALITY: Death of a child as a result of abuse or neglect, because either an injury resulting from the abuse or neglectwas the cause of death; or abuse or neglect were contributing factors to the cause of death.FEDERAL FISCAL YEAR: The 12-month period from October 1 through September 30 used by the Federal Government.The fiscal year is designated by the calendar year in which it ends.FEDERAL INFORMATION PROCESSING STANDARDS (FIPS): The federally defined set of county codes <strong>for</strong> all States.FINANCIAL PROBLEM: A risk factor related to the family’s inability to provide suffcient financial resources to meetminimum needs.FIPS: see Federal In<strong>for</strong>mation Processing St<strong>and</strong>ards.FOSTER CARE: Twenty-four-hour substitute care <strong>for</strong> children placed away from their parents or guardians <strong>and</strong> <strong>for</strong>whom the State Agency has placement <strong>and</strong> care responsibility. This includes family foster homes, foster homes ofrelatives, group homes, emergency shelters, residential facilities, childcare institutions, <strong>and</strong> pre-adoptive homes. TheNCANDS category applies regardless of whether the facility is licensed <strong>and</strong> whether payments are made by the State orlocal agency <strong>for</strong> the care of the child, or whether there is Federal matching of any payments made. Foster care may beprovided by those related or not related to the child. All children in care <strong>for</strong> more than 24 hours are counted.FOSTER CARE SERVICES: Activities associated with 24-hour substitute care <strong>for</strong> children placed away from their parentsor guardians <strong>and</strong> <strong>for</strong> whom the State title IV-A/IV-E Agency has responsibility <strong>for</strong> placement, care, or supervision.FOSTER PARENT: Individual who provides a home <strong>for</strong> orphaned, abused, neglected, delinquent or disabled childrenunder the placement, care or supervision of the State. The individual may be a relative or nonrelative <strong>and</strong> need not belicensed by the State agency to be considered a foster parent.FRIEND: A nonrelative acquainted with the child, the parent, or caregiver.FTE: See Full-Time Equivalent.FULL-TIME EQUIVALENT: A computed statistic representing the number of full-time employees if the number of hoursworked by part-time employees had been worked by full-time employees.GIRL: A female child younger than 18 years.GROUP HOME OR RESIDENTIAL CARE: A nonfamilial 24-hour care facility that may be supervised by the StateAgency or governed privately.GUARDIAN AD LITEM: See Court-Appointed Representative.HEALTH-RELATED AND HOME HEALTH SERVICES: Activities provided to attain <strong>and</strong> maintain a favorable conditionof health.APPENDIX B: Glossary 123
HISPANIC ETHNICITY: A person of Cuban, Mexican, Puerto Rican, South or Central American, or other Spanishculture or origin, regardless of race. See Race.HOME-BASED SERVICES: In-home activities provided to individuals or families to assist with household or personalcare that improve or maintain family well-being. Includes homemaker, chore, home maintenance, <strong>and</strong> householdmanagement services.HOUSING SERVICES: Activities designed to assist individuals or families in locating, obtaining, or retainingsuitable housing.INADEQUATE HOUSING: A risk factor related to subst<strong>and</strong>ard, overcrowded, or unsafe housing conditions,including homelessness.INCIDENT DATE: The month, day, <strong>and</strong> year of the most recent known incident of alleged child maltreatment.INDEPENDENT AND TRANSITIONAL LIVING SERVICES: Activities designed to help older youth in foster care orhomeless youth make the transition to independent living.INDICATED OR REASON TO SUSPECT: An investigation disposition that concludes that maltreatment cannot besubstantiated under State law or policy, but there is reason to suspect that the child may have been maltreated or wasat risk of maltreatment. This is applicable only to States that distinguish between substantiated <strong>and</strong> indicated dispositions.INITIAL INVESTIGATION: The CPS initial face-to-face contact with the alleged victim. If face-to-face contact is notpossible with the alleged victim, initial investigation would be when CPS first contacted any party who could providein<strong>for</strong>mation essential to the investigation or assessment.INTAKE: The activities associated with the receipt of a referral—the assessment or screening, the decision to accept,<strong>and</strong> the enrollment of individuals or families into services.INTENTIONALLY FALSE: The unsubstantiated investigation disposition that indicates a conclusion that the person whomade the allegation of maltreatment knew that the allegation was not true.INVESTIGATION: The gathering <strong>and</strong> assessment of objective in<strong>for</strong>mation to determine if a child has been or is at risk ofbeing maltreated. Generally includes face-to-face contact with the victim <strong>and</strong> results in a disposition as to whether ornot the alleged report is substantiated.INVESTIGATION DISPOSITION: A determination made by a social service agency that evidence is or is not suffcientunder State law to conclude that maltreatment occurred.INVESTIGATION DISPOSITION DATE: The point in time at the end of the investigation or assessment when a CPSworker declares a disposition to the child maltreatment report.INVESTIGATION START DATE: The date when CPS initially had face-to-face contact with the alleged victim. If thisface-to-face contact is not possible, the date would be when CPS initially contacted any party who could providein<strong>for</strong>mation essential to the investigation or assessment.JUVENILE COURT PETITION: A legal document requesting that the court take action regarding the child’s status as aresult of the CPS response; usually a petition requesting the child be declared a dependent <strong>and</strong> placed in an out-ofhomesetting.LEARNING DISABILITY: A clinically diagnosed disorder in basic psychological processes involved with underst<strong>and</strong>ingor using language, spoken or written, that may manifest itself in an imperfect ability to listen, think, speak, read,write, spell or use mathematical calculations. The term includes conditions such as perceptual disability, brain injury,minimal brain dysfunction, dyslexia, <strong>and</strong> developmental aphasia.LEGAL GUARDIAN: Adult person who has been given legal custody <strong>and</strong> guardianship of a minor.LEGAL, LAW ENFORCEMENT, OR CRIMINAL JUSTICE PERSONNEL: People employed by a local, State, tribal, orFederal justice agency. This includes law en<strong>for</strong>cement, courts, district attorney’s offce, probation or other communitycorrections agency, <strong>and</strong> correctional facilities.LEGAL SERVICES: Activities provided by a lawyer, or other person(s) under the supervision of a lawyer, to assistindividuals in seeking or obtaining legal help in civil matters such as housing, divorce, child support, guardianship,paternity <strong>and</strong> legal separation.124 <strong>Child</strong> <strong>Maltreatment</strong> <strong>2006</strong>
LIVING ARRANGEMENT: The environment in which a child was residing at the time of the alleged incidentof maltreatment.MALTREATMENT TYPE: A particular <strong>for</strong>m of child maltreatment determined by investigation to be substantiated orindicated under State law. Types include physical abuse, neglect or deprivation of necessities, medical neglect, sexualabuse, psychological or emotional maltreatment, <strong>and</strong> other <strong>for</strong>ms included in State law.MEDICAL NEGLECT: A type of maltreatment caused by failure by the caregiver to provide <strong>for</strong> the appropriate healthcare of the child although financially able to do so, or offered financial or other means to do so.MEDICAL PERSONNEL: People employed by a medical facility or practice. This includes physicians, physician assistants,nurses, emergency medical technicians, dentists, chiropractors, coroners, <strong>and</strong> dental assistants <strong>and</strong> technicians.MENTAL HEALTH PERSONNEL: People employed by a mental health facility or practice, including psychologists,psychiatrists, <strong>and</strong> therapists.MENTAL HEALTH SERVICES: Activities that aim to overcome issues involving emotional disturbance or maladaptivebehavior adversely affecting socialization, learning, or development. Usually provided by public or private mentalhealth agencies <strong>and</strong> includes both residential <strong>and</strong> nonresidential activities.MILITARY FAMILY MEMBER: A legal dependent of a person on active duty in the Armed Services of the United Statessuch as the Army, Navy, Air Force, Marine Corps, or Coast Guard.MILITARY MEMBER: A person on active duty in the Armed Services of the United States such as the Army, Navy, AirForce, Marine Corps, or Coast Guard.NATIONAL CHILD ABUSE AND NEGLECT DATA SYSTEM (NCANDS): A national data collection system of child abuse<strong>and</strong> neglect data from CPS agencies. Contains child-level <strong>and</strong> aggregate data.NCANDS: See National <strong>Child</strong> Abuse <strong>and</strong> Neglect Data System.NEGLECT OR DEPRIVATION OF NECESSITIES: A type of maltreatment that refers to the failure by the caregiver toprovide needed, age-appropriate care although financially able to do so or offered financial or other means to do so.NEIGHBOR: A person living in close geographical proximity to the child or family.NO ALLEGED MALTREATMENT: A maltreatment level where the no alleged child is associated with a victim ornonvictim of child maltreatment or neglect. The no alleged child did not have any allegations of abuse or neglect.NONCAREGIVER: A person who is not responsible <strong>for</strong> the care <strong>and</strong> supervision of the child, including school personnel,friends, <strong>and</strong> neighbors.NONPARENT: Includes other relative, foster parent, residential facility staff, child daycare provider, foster careprovider, unmarried partner of parent, legal guardian, <strong>and</strong> “other.”OTHER: The State coding <strong>for</strong> this field is not one of the codes in the NCANDS record layout.OTHER PROFESSIONAL: A perpetrator who had contact with the child victim as part of his or her job, but the relationshipof the perpetrator to the child is not one of the identified NCANDS codes. For example clergy, sports coach, campcounselor, etc.OTHER RELATIVE: A nonparental family member.OUT-OF-COURT CONTACT: A meeting, which is not part of the actual judicial hearing, between the court-appointedrepresentative <strong>and</strong> the child victim. Such contacts enable the court-appointed representative to obtain a first-h<strong>and</strong>underst<strong>and</strong>ing of the situation <strong>and</strong> needs of the child victim, <strong>and</strong> to make recommendations to the court concerningthe best interests of the child.PACIFIC ISLANDER: A person having origins in any of the original peoples of Hawaii, Guam, Samoa, or otherPacific Isl<strong>and</strong>s.PARENT: The birth mother or father, adoptive mother or father, or stepmother or father of the child victim.PERPETRATOR: The person who has been determined to have caused or knowingly allowed the maltreatment of a child.APPENDIX B: Glossary 125
PERPETRATOR AGE: Age of an individual determined to have caused or knowingly allowed the maltreatment of achild. Age is calculated in years at the time of the report of child maltreatment.PERPETRATOR AS CAREGIVER: Circumstances whereby the person who caused or knowingly allowed child maltreatmentto occur was also responsible <strong>for</strong> care <strong>and</strong> supervision of the victim when the maltreatment occurred.PERPETRATOR ID: See Perpetrator Identifier.PERPETRATOR IDENTIFIER: A unique, encrypted identification assigned to each perpetrator by the State <strong>for</strong> thepurposes of the NCANDS data collection.PERPETRATOR RELATIONSHIP: Primary role of the perpetrator to a child victim.PETITION DATE: The month, day, <strong>and</strong> year that a juvenile court petition was filed.PHYSICAL ABUSE: Type of maltreatment that refers to physical acts that caused or could have caused physical injuryto a child.POSTINVESTIGATION SERVICES: Activities provided or arranged by the child protective services agency, socialservices agency, or the child welfare agency <strong>for</strong> the child or family as a result of needs discovered during the courseof an investigation. Includes such services as family preservation, family support, <strong>and</strong> foster care. Postinvestigationservices are delivered within the first 90 days after the disposition of the report.PREVENTIVE SERVICES: Activities aimed at preventing child abuse <strong>and</strong> neglect. Such activities may be directed atspecific populations identified as being at increased risk of becoming abusive <strong>and</strong> may be designed to increase thestrength <strong>and</strong> stability of families, to increase parents’ confidence <strong>and</strong> competence in their parenting abilities, <strong>and</strong>to af<strong>for</strong>d children a stable <strong>and</strong> supportive environment. They include child abuse <strong>and</strong> neglect preventive servicesprovided through such Federal funds as the <strong>Child</strong> Abuse <strong>and</strong> Neglect Basic State Grant, Community-Based FamilyResource <strong>and</strong> Support Grant, the Promoting Safe <strong>and</strong> Stable <strong>Families</strong> Program (title IV-B, subpart 2), Maternal <strong>and</strong><strong>Child</strong> Health Block Grant, Social Services Block Grant (title XX), <strong>and</strong> State <strong>and</strong> local funds. Such activities do notinclude public awareness campaigns.PRIOR CHILD VICTIM: A child victim with previous substantiated, indicated, or alternative response reports ofmaltreatment.PROGRAM ASSESSMENT RATING TOOL (PART): A systematic method of assessing the per<strong>for</strong>mance of programactivities across the Federal government. The PART assessments help link per<strong>for</strong>mance to budget decisions <strong>and</strong>provide a basis <strong>for</strong> making recommendations to improve results.PROMOTING SAFE AND STABLE FAMILIES PROGRAM: Program that provides grants to the States under Section 430,title IV-B, subpart 2 of the Social Security Act, as amended, to develop <strong>and</strong> exp<strong>and</strong> four types of services—communitybasedfamily support services; innovative child welfare services, including family preservation services; time-limitedreunification services; <strong>and</strong> adoption promotion <strong>and</strong> support services.PSYCHOLOGICAL OR EMOTIONAL MALTREATMENT: Type of maltreatment that refers to acts or omissions, otherthan physical abuse or sexual abuse that caused, or could have caused, conduct, cognitive, affective, or other mentaldisorders <strong>and</strong> includes emotional neglect, psychological abuse, <strong>and</strong> mental injury. Frequently occurs as verbal abuse orexcessive dem<strong>and</strong>s on a child’s per<strong>for</strong>mance.RACE: The primary taxonomic category of which the individual identifies himself or herself as a member, or of whichthe parent identifies the child as a member. See American Indian or Alaska Native, Asian, Black or African-American,Pacific Isl<strong>and</strong>er, White, <strong>and</strong> Unable to Determine. Also, see Hispanic.RECEIPT OF REPORT: The log-in of a referral to the agency alleging child maltreatment.RELATIVE: A person connected to the child by blood, including parents, siblings, <strong>and</strong> gr<strong>and</strong>parents.REFERRAL: Notification to the CPS agency of suspected child maltreatment. This can include one or more children.RELATIVE: A person connected to the child by blood, such as parents, siblings, gr<strong>and</strong>parents, etc.REMOVAL DATE: The month, day, <strong>and</strong> year that the child was removed from the care <strong>and</strong> supervision of his or herparents or parental substitutes, during or as a result of the CPS response. If a child has been removed more than once,the removal date is the first removal resulting from the CPS response.126 <strong>Child</strong> <strong>Maltreatment</strong> <strong>2006</strong>
REMOVED FROM HOME: The removal of the child from his or her normal place of residence to a substitute caresetting by a CPS or social services agency.REPORT: Notification to the CPS agency of alleged child abuse or neglect. This can include one or more children.REPORT-CHILD PAIR: Refers to the concatenation of the Report ID <strong>and</strong> the <strong>Child</strong> ID, which together <strong>for</strong>m a newunique ID which represents a single unique record in the case-level <strong>Child</strong> File.REPORT DATE: The month, day, <strong>and</strong> year that the responsible agency was notified of the suspected child maltreatment.REPORT DISPOSITION: The conclusion reached b y the responsible agency regarding the report of maltreatment pertaining to the child.REPORT ID: See Report Identifier.REPORT IDENTIFIER: A unique identification assigned to each report of child maltreatment <strong>for</strong> the purposes of the NCANDS data collection.REPORT SOURCE: The category or role of the person who notifies a CPS agency of alleged child maltreatment.REPORTING PERIOD: The 12-month period <strong>for</strong> which data are submitted to the NCANDS.RESIDENTIAL FACILITY STAFF: Employees of a public or private group residential facility, including emergency shelters, group homes, <strong>and</strong> institutions.RESPONSE TIME WITH RESPECT TO THE INITIAL INVESTIGATION: The time between the log-in of a call to the State agency alleging child maltreatment <strong>and</strong> the face-to-face contact with the alleged victim, where this is appropriate, or to contact with another person who can provide in<strong>for</strong>mation.RESPONSE TIME WITH RESPECT TO THE PROVISION OF SERVICES: The time from the log-in of a call to the agency alleging child maltreatment to the provision of postinvestigative services, often requiring the opening of a case <strong>for</strong> ongoing services.SACWIS: See statewide automated child welfare in<strong>for</strong>mation system (SACWIS).SCREENED-IN REPORTS: Referrals of child maltreatment that met the State’s st<strong>and</strong>ards <strong>for</strong> acceptance.SCREENED-OUT REFERRAL: Allegations of child maltreatment that did not meet the State’s st<strong>and</strong>ards <strong>for</strong> acceptance.SCREENING: The process of making a decision about whether or not to accept a referral of child maltreatment.SERVICE DATE: The date activities began as a result of needs discovered during the CPS response.SERVICES: See Postinvestigation Services <strong>and</strong> Preventive Services.SEXUAL ABUSE: A type of maltreatment that refers to the involvement of the child in sexual activity to provide sexual gratification or financial benefit to the perpetrator, including contacts <strong>for</strong> sexual purposes, molestation, statutory rape, prostitution, pornography, exposure, incest, or other sexually exploitative activities.SOCIAL SERVICES BLOCK GRANT: Funds provided by title XX of the Social Security Act that are used <strong>for</strong> services tothe States that may include child care, child protection, child <strong>and</strong> foster care services, <strong>and</strong> daycare.SOCIAL SERVICES PERSONNEL: Employees of a public or private social services or social welfare agency, or othersocial worker or counselor who provides similar services.STATE: The primary geopolitical unit from which child maltreatment data are collected. U.S. territories, U.S. militarycomm<strong>and</strong>s, <strong>and</strong> Washington, DC, have the same status as States in the data collection ef<strong>for</strong>t.STATE AGENCY: The agency in a State that is responsible <strong>for</strong> child protection <strong>and</strong> child welfare.STATEWIDE AUTOMATED CHILD WELFARE INFORMATION SYSTEM (SACWIS): Any of a variety of automated systems designed to process child welfare in<strong>for</strong>mation on a statewide basis.STEPPARENT: The husb<strong>and</strong> or wife, by a subsequent marriage, of the child’s mother or father.APPENDIX B: Glossary 127
SUBSTANCE ABUSE SERVICES: Activities designed to deter, reduce, or eliminate substance abuse or chemical dependency.SUBSTANTIATED: A type of investigation disposition that concludes that the allegation of maltreatment or risk of maltreatmentwas supported or founded by State law or State policy. This is the highest level of finding by a State Agency.SUMMARY DATA COMPONENT (SDC): The aggregate data collection <strong>for</strong>m submitted by States that do not submit the<strong>Child</strong> File.UNABLE TO DETERMINE: Any racial or ethnicity category not included in the following: American Indian or AlaskaNative, Asian, Black or African-American, Hispanic, Pacific Isl<strong>and</strong>er, or White.UNKNOWN: The State collects data on this variable, but the data <strong>for</strong> this particular report or child were not capturedor are missing.UNMARRIED PARTNER OF PARENT: Someone who has a relationship with the parent <strong>and</strong> lives in the household withthe parent <strong>and</strong> maltreated child.UNSUBSTANTIATED: A type of investigation disposition that determines that there is not suffcient evidence underState law to conclude or suspect that the child has been maltreated or is at risk of being maltreated.VICTIM: A child having a maltreatment disposition of substantiated, indicated, or alternative response victim.WHITE: A person having origins in any of the original peoples of Europe, the Middle East, or North Africa.WORKER ID: See Worker Identifier.WORKER IDENTIFIER: A unique identification of the worker who is assigned to the child at the time of the report disposition.128 <strong>Child</strong> <strong>Maltreatment</strong> <strong>2006</strong>
Data Submission <strong>and</strong>Data ElementsAPPENDIX C<strong>Child</strong>-level data are collected through an automated file composed of child-specific records. States thatsubmitted child-level data used the <strong>Child</strong> File, which is a revision of the Detailed Case Data Component(DCDC). States that submitted the <strong>Child</strong> File also submitted the Agency File, which collects aggregatedata on such items as preventive services <strong>and</strong> screened-out referrals. The remaining States submitted theirdata using the Summary Data Component (SDC). A list of each State <strong>and</strong> the type of data file submitted isprovided in table C–1.To provide State-level statistics, case-level data were aggregated by key variables <strong>for</strong> those States thatsubmitted the <strong>Child</strong> File. The aggregated numbers from the <strong>Child</strong> File, the Agency file, <strong>and</strong> the SDC werecombined into one data file—the Combined Aggregate File (CAF). Creating this new file enabled the threedata sources to be merged into one file that would provide State-level data <strong>for</strong> all the States. The dataelement lists <strong>for</strong> the <strong>Child</strong> File <strong>and</strong> the Agency File are provided as tables C–2 <strong>and</strong> C–3, respectively.The majority of analyses in this report are based upon the data in the CAF. This data file will be availablefrom the National Data Archive on <strong>Child</strong> Abuse <strong>and</strong> Neglect (NDACAN). Certain analyses are basedon the full child-level data files submitted by the States. These State data files will also be available fromNDACAN.APPENDIX C: Data Submission <strong>and</strong> Data Elements 129
Table C–1 State Data Submissions, <strong>2006</strong>STATE CHILD POPULATION SDC CHILD FILE AGENCY FILEAlabama 1,114,301 ■ ■Alaska 181,434 ■ ■Arizona 1,628,198 ■ ■Arkansas 691,186 ■ ■Cali<strong>for</strong>nia 9,532,614 ■ ■Colorado 1,169,301 ■ ■Connecticut 818,286 ■ ■Delaware 203,366 ■ ■District of Columbia 114,881 ■ ■Florida 4,021,555 ■ ■Georgia 2,455,020 ■ ■Hawaii 298,081 ■ ■Idaho 394,280 ■ ■Illinois 3,215,244 ■ ■Indiana 1,577,629 ■ ■Iowa 710,194 ■ ■Kansas 695,837 ■ ■Kentucky 999,531 ■ ■Louisiana 1,090,001 ■ ■Maine 280,994 ■ ■Maryl<strong>and</strong> 1,360,531Massachusetts 1,448,884 ■ ■Michigan 2,478,356 ■Minnesota 1,257,264 ■ ■Mississippi 759,405 ■ ■Missouri 1,416,592 ■ ■Montana 217,848 ■ ■Nebraska 445,033 ■ ■Nevada 634,520 ■ ■New Hampshire 297,625 ■ ■New Jersey 2,089,338 ■ ■New Mexico 508,930 ■ ■New York 4,514,342 ■ ■North Carolina 2,155,387 ■ ■North Dakota 144,934 ■ ■ ■Ohio 2,770,035 ■ ■Oklahoma 894,034 ■ ■Oregon 856,259 ■ ■ ■Pennsylvania 2,804,873 ■ ■Puerto Rico 237,451 ■ ■Rhode Isl<strong>and</strong> 1,039,653 ■ ■South Carolina 194,681 ■ ■South Dakota 1,442,593 ■ ■Tennessee 6,493,965 ■ ■Texas 791,198 ■ ■Utah 133,389 ■ ■Vermont 1,806,847 ■ ■Virginia 1,526,267 ■ ■Washington 389,071 ■ ■West Virginia 1,312,530 ■ ■Wisconsin 121,794 ■ ■Wyoming 1,018,651 ■ ■Total 74,754,213Number Reporting 52 2 51 50130 <strong>Child</strong> <strong>Maltreatment</strong> <strong>2006</strong>
Table C–2 <strong>Child</strong> File Data Element ListI. REPORT DATAFIELD CHILD DATA ELEMENT LONG NAME (SHORT NAME)1 Submission Year (SUBYR)2 State/Territory (STATERR)3 Report Id (RPTID)4 <strong>Child</strong> Id (CHID)5 County Of Report (RPTCNTY)6 Report Date (RPTDT)7 Investigation Start Date (INVDATE)8 Report Source (RPTSRC)9 Report Disposition (RPTDISP)10 Report Disposition Date (RPTDISDT)11 Notifications (NOTIFS)II. CHILD DATAFIELD CHILD DATA ELEMENT LONG NAME (SHORT NAME)12 <strong>Child</strong> Age At Report (CHAGE)13 <strong>Child</strong> Date Of Birth (CHBDATE)14 <strong>Child</strong> Sex (CHSEx)15 <strong>Child</strong> Race American Indian Or Alaska Native (CHRACAI)16 <strong>Child</strong> Race Asian (CHRACAS)17 <strong>Child</strong> Race Black Or African American (CHRACBL)18 <strong>Child</strong> Race Native Hawaiian Or Other Pacific Isl<strong>and</strong>er (CHRACNH)19 <strong>Child</strong> Race White (CHRACWH)20 <strong>Child</strong> Race Unable To Determine (CHRACUD)21 <strong>Child</strong> Ethnicity (CHETHN)22 County Of Residence (CHCNTY)23 Living Arrangement (CHLVNG)24 Military Family Member (CHMIL)25 Prior Victim (CHPRIOR)III. MALTREATMENT DATAFIELD CHILD DATA ELEMENT LONG NAME (SHORT NAME)26 <strong>Maltreatment</strong>-1 Type (CHMAL1)27 <strong>Maltreatment</strong>-1 Disposition Level (MAL1LEV)28 <strong>Maltreatment</strong>-2 Type (CHMAL2)29 <strong>Maltreatment</strong>-2 Disposition Level (MAL2LEV)30 <strong>Maltreatment</strong>-3 Type (CHMAL3)31 <strong>Maltreatment</strong>-3 Disposition Level (MAL3LEV)32 <strong>Maltreatment</strong>-4 Type (CHMAL4)33 <strong>Maltreatment</strong>-4 Disposition Level (MAL4LEV)34 <strong>Maltreatment</strong> Death (MALDEATH)IV. CHILD RISK FACTOR DATAFIELD CHILD DATA ELEMENT LONG NAME (SHORT NAME)35 Alcohol Abuse-<strong>Child</strong> (CDALC)36 Drug Abuse-<strong>Child</strong> (CDDRUG)37 Mental Retardation-<strong>Child</strong> (CDRTRD)38 Emotionally Disturbed-<strong>Child</strong> (CDEMOTNL)39 Visually Or Hearing Impaired-<strong>Child</strong> (CDVISUAL)40 Learning Disability-<strong>Child</strong> (CDLEARN)41 Physically Disabled-<strong>Child</strong> (CDPHYS)42 Behavior Problem-<strong>Child</strong> (CDBEHAV)43 Other Medical Condition-<strong>Child</strong> (CDMEDICL)continuesAPPENDIX C: Data Submission <strong>and</strong> Data Elements 131
Table C–2 <strong>Child</strong> File Data Element List (continued)V. CAREGIVER RISK FACTOR DATAFIELD CHILD DATA ELEMENT LONG NAME (SHORT NAME)44 Alcohol Abuse-Caregiver(S) (FCALC)45 Drug Abuse-Caregiver(S) (FCDRUG)46 Mental Retardation-Caregiver(S) (FCRTRD)47 Emotionally Disturbed-Caregiver(S) (FCEMOTNL)48 Visually Or Hearing Impaired-Caregiver(S) (FCVISUAL)49 Learning Disability-Caregiver(S) (FCLEARN)50 Physically Disabled-Caregiver(S) (FCPHYS)51 Other Medical Condition-Caregiver(S) (FCMEDICL)52 Domestic Violence (FCVIOL)53 Inadequate Housing (FCHOUSE)54 Financial Problem (FCMONEY)55 Public Assistance ( (FCPUBLIC)VI. SERVICES PROVIDED DATAFIELD CHILD DATA ELEMENT LONG NAME (SHORT NAME)56 Post Investigation Services (POSTSERV)57 Service Date (SERVDATE)58 Family Support Services (FAMSUP)59 Family Preservation Services (FAMPRES)60 Foster Care Services (FOSTERCR)61 Removal Date (RMVDATE)62 Juvenile Court Petition (JUVPET)63 Petition Date (PETDATE)64 Court-Appointed Representative (COCHREP)65 Adoption Services (ADOPT)66 Case Management Services (CASEMANG)67 Counseling Services (COUNSEL)68 Daycare Services-<strong>Child</strong> (DAYCARE)69 Educational And Training Services (EDUCATN)70 Employment Services (EMPLOY)71 Family Planning Services (FAMPLAN)72 Health-Related And Home Health Services (HEALTH)73 Home-Based Services (HOMEBASE)74 Housing Services (HOUSING)75 Independent And Transitional Living Services (TRANSLIV)76 In<strong>for</strong>mation And Referral Services (INFOREF)77 Legal Services (LEGAL)78 Mental Health Services (MENTHLTH)79 Pregnancy And Parenting Services For Young Parents (PREGPAR)80 Respite Care Services (RESPITE)81 Special Services-Disabled (SSDISABL)82 Special Services-Juvenile Delinquent (SSDELINQ)83 Substance Abuse Services (SUBABUSE)84 Transportation Services (TRANSPRT)85 Other Services (OTHERSV)VII. STAFF DATAFIELD CHILD DATA ELEMENT LONG NAME (SHORT NAME)86 Worker Id (WRKRID)87 Supervisor Id (SUPRVID)continues132 <strong>Child</strong> <strong>Maltreatment</strong> <strong>2006</strong>
Table C–2 <strong>Child</strong> File Data Element List (continued)VIII. PERPETRATORS DATAFIELD CHILD DATA ELEMENT LONG NAME (SHORT NAME)88 Perpetrator-1 Id (PER1ID)89 Perpetrator-1 Relationship (PER1REL)90 Perpetrator-1 As A Parent (PER1PRNT)91 Perpetrator-1 As A Caregiver (PER1CR)92 Perpetrator-1 Age At Report (PER1AGE)93 Perpetrator-1 Sex (PER1SEx)94 Perpetrator-1 Race American Indian Or Alaska Native (P1RACAI)95 Perpetrator-1 Race Asian (P1RACAS)96 Perpetrator-1 Race Black Or African American (P1RACBL)97 Perpetrator-1 Race Native Hawaiian Or Other Pacific Isl<strong>and</strong>er (P1RACNH)98 Perpetrator-1 Race White (P1RACWH)99 Perpetrator-1 Race Unable To Determine (P1RACUD)100 Perpetrator-1 Ethnicity (PER1ETHN)101 Perpetrator-1 Military Member (PER1MIL)102 Perpetrator-1 Prior Abuser (PER1PIOR)103 Perpetrator-1 <strong>Maltreatment</strong>-1 (PER1MAL1)104 Perpetrator-1 <strong>Maltreatment</strong>-2 (PER1MAL2)105 Perpetrator-1 <strong>Maltreatment</strong>-3 (PER1MAL3)106 Perpetrator-1 <strong>Maltreatment</strong>-4 (PER1MAL4)107 Perpetrator-2 Id (PER2ID)108 Perpetrator-2 Relationship (PER2REL)109 Perpetrator-2 As A Parent (PER2PRNT)110 Perpetrator-2 As A Caregiver (PER2CR)111 Perpetrator-2 Age At Report (PER2AGE)112 Perpetrator-2 Sex (PER2SEx)113 Perpetrator-2 Race American Indian Or Alaska Native (P2RACAI)114 Perpetrator-2 Race Asian (P2RACAS)115 Perpetrator-2 Race Black Or African American (P2RACBL)116 Perpetrator-2 Race Native Hawaiian Or Other Pacific Isl<strong>and</strong>er (P2RACNH)117 Perpetrator-2 Race White (P2RACWH)118 Perpetrator-2 Race Unable To Determine (P2RACUD)119 Perpetrator-2 Ethnicity (PER2ETHN)120 Perpetrator-2 Military Member (PER2MIL)121 Perpetrator-2 Prior Abuser (PER2PIOR)122 Perpetrator-2 <strong>Maltreatment</strong>-1 (PER2MAL1)123 Perpetrator-2 <strong>Maltreatment</strong>-2 (PER2MAL2)124 Perpetrator-2 <strong>Maltreatment</strong>-3 (PER2MAL3)125 Perpetrator-2 <strong>Maltreatment</strong>-4 (PER2MAL4)126 Perpetrator-3 Id (PER3ID)127 Perpetrator-3 Relationship (PER3REL)128 Perpetrator-3 As A Parent (PER3PRNT)129 Perpetrator-3 As A Caregiver (PER3CR)130 Perpetrator-3 Age At Report (PER3AGE)131 Perpetrator-3 Sex (PER3SEx)132 Perpetrator-3 Race American Indian Or Alaska Native (P3RACAI)133 Perpetrator-3 Race Asian (P3RACAS)134 Perpetrator-3 Race Black Or African American (P3RACBL)135 Perpetrator-3 Race Native Hawaiian Or Other Pacific Isl<strong>and</strong>er (P3RACNH)136 Perpetrator-3 Race White (P3RACWH)137 Perpetrator-3 Race Unable To Determine (P3RACUD)138 Perpetrator-3 Ethnicity (PER3ETHN)139 Perpetrator-3 Military Member (PER3MIL)continuesAPPENDIX C: Data Submission <strong>and</strong> Data Elements 133
Table C–2 <strong>Child</strong> File Data Element List (continued)VIII. PERPETRATORS DATA (continued)FIELD CHILD DATA ELEMENT LONG NAME (SHORT NAME)140 Perpetrator-3 Prior Abuser (PER3PIOR)141 Perpetrator-3 <strong>Maltreatment</strong>-1 (PER3MAL1)142 Perpetrator-3 <strong>Maltreatment</strong>-2 (PER3MAL2)143 Perpetrator-3 <strong>Maltreatment</strong>-3 (PER3MAL3)144 Perpetrator-3 <strong>Maltreatment</strong>-4 (PER3MAL4)IX. ADDITIONAL FIELDSFIELD CHILD DATA ELEMENT LONG NAME (SHORT NAME)145 AFCARS ID (AFCARSID)146 Incident Date (INCIDDT)134 <strong>Child</strong> <strong>Maltreatment</strong> <strong>2006</strong>
Table C–3 Agency File Data Element1. PREVENTIVE SERVICESFIELD AGENCY SUMMARY DATA ELEMENT LONG NAME (SHORT NAME)1.1.A-C <strong>Child</strong>ren Funding Source: <strong>Child</strong> Abuse <strong>and</strong> Neglect State Grant (PSSTGTC)1.1.B-C<strong>Child</strong>ren Funding Source: Community-Based Prevention of <strong>Child</strong> Abuse<strong>and</strong> Neglect Grant(PSCOSPC)1.1.C-C <strong>Child</strong>ren Funding Source: Promoting Safe <strong>and</strong> Stable <strong>Families</strong> Program (PSTLIVBC)1.1.D-C <strong>Child</strong>ren Funding Source: Social Services Block Grant (PSTLxxC)1.1.E-C <strong>Child</strong>ren Funding Source: Other (PSOTHERC)1.1.A-F <strong>Families</strong> Funding Source: <strong>Child</strong> Abuse <strong>and</strong> Neglect State Grant (PSSTGTF)1.1.B-F<strong>Families</strong> Funding Source: Community-Based Prevention of <strong>Child</strong> Abuse<strong>and</strong> Neglect Grant(PSCOSPF)1.1.C-F <strong>Families</strong> Funding Source: Promoting Safe <strong>and</strong> Stable <strong>Families</strong> Program (PSTLIVBF)1.1.D-F <strong>Families</strong> Funding Source: Social Services Block Grant (PSTLxxF)1.1.E-F <strong>Families</strong> Funding Source: Other (PSOTHERF)2. ADDITIONAL INFORMATION ON REFERRALS AND REPORTSFIELD AGENCY SUMMARY DATA ELEMENT LONG NAME (SHORT NAME)2.1.A Number of Referrals Screened Out (SCRNRPT)2.1.B Number of <strong>Child</strong>ren Screened Out (SCRNCHLD)2.2 Response Time with Respect to the Initial Investigation or Assessment (WKARTIME)2.32.4Number of Staff Responsible <strong>for</strong> CPS Functions (Screening, Intake, <strong>and</strong>Investigation/Assessment of Reports) During the YearNumber of Staff Responsible <strong>for</strong> the Screening <strong>and</strong> Intake of ReportsDuring the Year(WKSIIA)(WKSI)3. ADDITIONAL INFORMATION ON CHILD VICTIMS REPORTED IN CHILD FILEFIELD AGENCY SUMMARY DATA ELEMENT LONG NAME (SHORT NAME)3.1<strong>Child</strong> Victims Whose <strong>Families</strong> Received Family Preservation Services in thePrevious Five Years(FPS5Y)3.2 <strong>Child</strong> Victims Who Were Reunited with Their <strong>Families</strong> in the Previous Five Years (FRU5Y)3.33.43.5Average Number of Out-of-Court Contacts Between the Court-AppointedRepresentatives <strong>and</strong> the <strong>Child</strong> Victims They Represent<strong>Child</strong> Victims Who Died as a Result of <strong>Maltreatment</strong> <strong>and</strong> Whose <strong>Families</strong> HadReceived Family Preservation Services in the Previous Five Years (FTLFPSCF)<strong>Child</strong> Victims Who Died as a Result of <strong>Maltreatment</strong> <strong>and</strong> Had Been Reunited withTheir <strong>Families</strong> in the Previous Five Years(COCONT)(FTLCRUCF)4. INFORMATION ON CHILD FATALITIES NOT REPORTED IN CHILD FILEFIELD AGENCY SUMMARY DATA ELEMENT LONG NAME (SHORT NAME)4.1 <strong>Child</strong> <strong>Maltreatment</strong> Fatalities not Reported in the <strong>Child</strong> File (FATALITY)4.2<strong>Child</strong> Victims Who Died as a Result of <strong>Maltreatment</strong> While in Foster Care NotReported in the <strong>Child</strong> File(FATALFC)4.34.4<strong>Child</strong> Victims Who Died as a Result of <strong>Maltreatment</strong> <strong>and</strong> Whose <strong>Families</strong> HadReceived Family Preservation Services in the Previous Five Years Not Reportedin the <strong>Child</strong> File<strong>Child</strong> Victims Who Died as a Result of <strong>Maltreatment</strong> <strong>and</strong> Had Been Reunited withTheir <strong>Families</strong> in the Previous Five Years Not Reported in the <strong>Child</strong> File(FATALFPS)(FATALCRU)APPENDIX C: Data Submission <strong>and</strong> Data Elements 135
136 <strong>Child</strong> <strong>Maltreatment</strong> <strong>2006</strong>
1State CommentaryAPPENDIX DALABAMAKimberly DesmondProgram SupervisorAlabama Department of Human Resources50 Ripley StreetMontgomery, Alabama 36130–4000334–353–7983334–242–0939 Faxkimberly.desmond@dhr.alabama.govData File(s) Submitted<strong>Child</strong> File, Agency FileLevel of Evidence RequiredPreponderanceReportsThe estimate of child protective services (CPS)workers is based on current, filled CPS agencypositions <strong>and</strong> the caseload st<strong>and</strong>ards set <strong>for</strong>CPS functions. The response time of the CPSwork<strong>for</strong>ce is calculated by days after the initial12 hours. In serious harm reports, the responsetime is immediate, but no later than 12 hours.In all other reports, victims must be seenwithin 5 calendar days. If in<strong>for</strong>mation receivedat intake does not rise to the level of childabuse or neglect, the report is screened out. Theexpressed concerns must meet the child abuseor neglect definitions, as defined in policy.PerpetratorsState law does not allow a person younger than14 years to be identified as a perpetrator.ServicesDue to an ongoing conversion of the StatewideAutomated <strong>Child</strong> Welfare In<strong>for</strong>mation System(SACWIS), data are not available <strong>for</strong> childrenwho were removed from the home. The State isnot able to collect data by individual fundingsource <strong>for</strong> children or families due to multiplesources being combined.ALASKAMichael MatthewsResearch Analyst IVOffce of <strong>Child</strong>ren’s Services130 Seward St, Room 4-HJuneau, AK 99801907–465–3208907–465–3397 Faxmichael_matthews@health.state.ak.usData File(s) Submitted<strong>Child</strong> File, Agency FileLevel of Evidence RequiredReasonableReportsThis is the State’s second <strong>Child</strong> File datasubmission. Investigations of reports receivedprior to July 1, 2004, were documented inthe Legacy system <strong>and</strong> were not migratedto the Statewide Automated <strong>Child</strong> WelfareIn<strong>for</strong>mation System (SACWIS). By excludinginvestigations of reports received prior to July2004 that were completed during Federal fiscalyear (FFY) 2005, the number of investigationsreported in FFY 2005 could have been understated.There are 34 percent more investigationsreported <strong>for</strong> FFY <strong>2006</strong>.Screened-out referrals <strong>for</strong> FFY <strong>2006</strong> includethose created in error; with insuffcientin<strong>for</strong>mation <strong>for</strong> assessment; within the lawen<strong>for</strong>cement jurisdiction only; multiplereferrals of the same incident; with no alleged1State terms are displayed within quotation marks. With the exception of the NCANDS term “other,” NCANDS terms are not displayed within quotations.APPENDIX D: State Commentary 137
maltreatment; referred to another State <strong>and</strong> thatare uninvestigated due to being referred to dualtrack, to the military, or to a Tribe.Data <strong>for</strong> response time with respect to the initialinvestigation or assessment were collected usinga stratified sample.<strong>Child</strong>renAs of June 1, 2004, the State’s dispositioncategories changed from “substantiated,”“unconfirmed,” “invalid,” <strong>and</strong> “can’t locate” to“substantiated,” “not substantiated,” <strong>and</strong> “closedwith no finding.” Prior to the change, childrenwith a finding of “unconfirmed” were countedas victims with an NCANDS disposition ofindicated. After the change, only children witha “substantiated” disposition are included in thevictim count.Services data prior to September 2004 are notavailable, so complete data on children receivingfamily preservation services <strong>and</strong> familyreunification services within the past 5 years willnot be available until FFY 2010.FatalitiesAll fatalities are reported in the Agency File.ServicesFFY <strong>2006</strong> is the first year the State is able toprovide services <strong>and</strong> risk factor data.ARIZONANicholas EspadasManagerEvaluation <strong>and</strong> Statistics UnitDivision of <strong>Child</strong>ren, Youth <strong>and</strong> <strong>Families</strong>Arizona Department of Economic Security1789 West JeffersonPhoenix, AZ 85005602–542–3969602–542–1933 Faxnespadas@azdes.govData File(s) Submitted<strong>Child</strong> File, Agency FileLevel of Evidence RequiredProbable CauseReportsScreened-out referrals are those in which thecaretaker(s) reside on an Indian reservationor military base <strong>and</strong> the State does not havejurisdiction. All other referrals are investigated.<strong>Child</strong>renThe State considers a report substantiated afteran investigation, when there is probable cause tosupport a finding of abuse or neglect. (Probablecause is defined as that the facts providea reasonable ground to believe that abuse orneglect occurred).The State continues to experience a high percentageof CPS worker <strong>and</strong> supervisor turnover,resulting in a larger than normal number ofinexperienced CPS staff <strong>for</strong> whom the Stateneeds to provide additional training. Ef<strong>for</strong>tsare underway to substantially increase trainingrelating to substantiation issues. Because thelaws governing substantiating maltreatment <strong>and</strong>removing children are not integrated, childrenplaced in out-of-home care may not have asubstantiated maltreatment allegation.The State law regarding “substance exposednewborns” was changed. Prior to the change inthe law, a substance exposed newborn reportcould be substantiated if the mother <strong>and</strong> childtested positive <strong>for</strong> drugs. The new law added therequirement that a medical doctor must indicatethat there is demonstrable harm to the child.This has caused a decrease in the number ofchild victims when compared to 2004. In addition,the number of reports involving privatepetitions <strong>and</strong> court ordered pick-ups of juvenileshas increased. Both of these categories have alow incidence of substantiation.FatalitiesThe State reports fatalities in the Agency Filewhen the complexity of the child fatality makes atimely finding diffcult. These cases are dependentupon the adjudication of the criminal case <strong>and</strong>cannot be recorded until the case is complete.ServicesThe funding <strong>for</strong> preventive services hasincreased.138 <strong>Child</strong> <strong>Maltreatment</strong> <strong>2006</strong>
ARKANSASDarcy DinningCHRIS Project ManagerOffce of Systems <strong>and</strong> TechnologyArkansas Department of Human Services617 Main Street, Slot N101Little Rock, AR 72204501–682–2684501–682–1376 Faxdarcy.dinning@mail.state.ar.usData File(s) Submitted<strong>Child</strong> File, Agency FileLevel of Evidence RequiredPreponderanceReportsAn investigation is initiated when a worker has aface-to-face interview with the alleged victim(s)without the presence of the offender. If thealleged victim is too young to interview, thenthe worker must observe the alleged victim(s).The start time to an investigation is captured inhours <strong>and</strong> minutes.A referral of child abuse or neglect is screenedoutif it does not meet the definition of abuseor neglect, as defined by the Arkansas <strong>Child</strong><strong>Maltreatment</strong> Act. If a referral comes into thehotline <strong>and</strong> there is an ongoing investigation(pending a finding), the new allegation is addedto the pending investigation <strong>and</strong> the referralsassociated with the new referral are identified<strong>and</strong> screened-out.<strong>Child</strong>renThe State maps the disposition of “true” to theNCANDS category substantiated. A “true”report is defined as when the preponderanceof the evidence supports the allegation of childmaltreatment, as defined by the Arkansas <strong>Child</strong><strong>Maltreatment</strong> Act. This is a higher st<strong>and</strong>ard ofevidence <strong>and</strong> should be understood to meanthat it is more likely than not that the abuse orneglect occurred. The State does not use theNCANDS categories of indicated or alternateresponse victim.Fatalities<strong>Child</strong> deaths are reported <strong>and</strong> accepted throughthe hotline.ServicesPostinvestigation services are consideredservices that begin during an investigation <strong>and</strong>continue past the investigation close date up towithin 90 days of the investigation close date.CALIFORNIADebbie Williams<strong>Child</strong> Welfare Data Analysis BureauCali<strong>for</strong>nia Department of Social Services744 P Street, Mail Station 12–84Sacramento, CA 95814916–653–3850916–653–4880 Faxdeborah.williams@dss.ca.govData File(s) Submitted<strong>Child</strong> File, Agency FileLevel of Evidence RequiredCredibleReportsIn the past, the State defined an “associatedreferral” as a subsequent referral that wasdetermined to report the same incident ofmaltreatment as the primary (or original)referral, <strong>and</strong> counted all reports. Beginning withthe Federal Fiscal Year (FFY) 2004, the Stateobtained Federal approval to not count “associatedreferrals.”The State uses the referral date as the investigationstart date <strong>for</strong> all investigated referrals thatare completed or attempted in person within thereporting period. The State no longer includescounselors <strong>and</strong> therapists as social servicepersonnel, these categories are included in themental health professional category.The State tracks the percentage of cases in whichface-to-face contact with a child occurs, or isattempted, within the regulatory periods inthose situations when a face-to-face contact isdetermined necessary.<strong>Child</strong>ren“Substantial risk” allegations are determined tobe if the caseworker intends to provide voluntaryor preventive services without the requirementthat another sibling in the referral was abused.The social worker is not required to select anyadditional allegations, but is required to select anabuse subcategory to show the type of abuse orAPPENDIX D: State Commentary 139
neglect <strong>for</strong> which the child may be at risk. <strong>Child</strong>living arrangement data are reported only <strong>for</strong>children in foster care.The State reports Hispanic ethnicity as a race.Prior to the FFY 2005 data submission, childrenof Hispanic ethnicity were reported as unable todetermine. Beginning with FFY 2005, the Staterecords more than one race per child.FatalitiesUnder the auspices of the Cali<strong>for</strong>nia State<strong>Child</strong> Death Review Council, the Cali<strong>for</strong>niaDepartment of Health Services (DHS) producesan estimate of the number of child abuse <strong>and</strong>neglect (CAN) fatalities on the basis of an annualReconciliation Audit conducted with county<strong>Child</strong> Death Review Teams (CDRTs). The Audituses four statewide data systems (i.e., DHS VitalStatistics Death Records, Department of JusticeHomicide Files <strong>and</strong> <strong>Child</strong> Abuse Central Index,<strong>and</strong> the Department of Social Services <strong>Child</strong>Welfare Services/Case Management System) <strong>and</strong>the findings from CDRT reviews. Because theAudits <strong>for</strong> 2003–2004 are still in progress, thebest estimate on the number of fatal child abuse<strong>and</strong> neglect deaths available <strong>for</strong> Cali<strong>for</strong>nia is theresults from the 2002 Audit. The estimate <strong>for</strong>2002 is 140 child abuse <strong>and</strong> neglect fatalities.ServicesPreventive services with other funding sourcesincludes services with combined fundingunder <strong>Child</strong> Welfare Services, Promoting Safe<strong>and</strong> Stable <strong>Families</strong>, <strong>Child</strong> Abuse Prevention<strong>and</strong> Treatment Act, Temporary Assistance toNeedy <strong>Families</strong>, <strong>and</strong> local funds. The number offamilies who received services under the <strong>Child</strong>Abuse <strong>and</strong> Neglect State Grant is the numberof families that participated in a r<strong>and</strong>omizedclinical study <strong>and</strong> received case managementservices <strong>and</strong> group intervention.COLORADOSean McCawColorado Department of Human ServicesDivision of <strong>Child</strong> Welfare1575 Sherman StreetDenver, CO 80203303–866–3446303–866–4191 Faxsean.mccaw@state.co.usData File(s) Submitted<strong>Child</strong> File, Agency FileLevel of Evidence RequiredPreponderanceReportsThe investigation start date is the date the childprotection caseworker supervisor recorded intothe tracking system an acceptance of an investigationby child welfare. Report dispositions aredetermined by the child protection caseworker<strong>and</strong> recorded after child protective servicessupervisory approval of the disposition. TheState does not have an algorithm in the extractioncode that determines the report dispositionhierarchy. The code changes are expected to bein effect <strong>for</strong> Federal fiscal year (FFY) 2007 data.The State has approximately a 5 percent increasein disposed allegations due to extraction codechanges that moved the overall file date parameterfrom the supervisor approval date to the date thecaseworker approved the overall disposition.<strong>Child</strong>renThe State does not have a policy regarding alternativeresponse <strong>and</strong> only reports on “founded” or“unsubstantiated” abuse. At this time, the Statedoes not record the value intentionally false.State data contains “youth in conflict” childrenin the assessment dispositions. These recordshave no abuse or neglect allegation <strong>and</strong> arereported with a disposition of unknown ormissing <strong>for</strong> FFY <strong>2006</strong>. These children werepreviously reported with dispositions of “other.”PerpetratorsThe State does not have the capacity in the trackingsystem selection values to discern relativefoster parent from relatives, or to discern relativefoster parents from nonrelative foster parents.ServicesServices may be underreported as not allintervention services are mapped to NCANDS.140 <strong>Child</strong> <strong>Maltreatment</strong> <strong>2006</strong>
CONNECTICUTAllon KalisherProgram SupervisorConnecticut Department of <strong>Child</strong>ren <strong>and</strong> <strong>Families</strong>505 Hudson StreetHart<strong>for</strong>d, CT 06106860–723–7218860–566–7947 Faxallon.kalisher@po.state.ct.usData File(s) Submitted<strong>Child</strong> File, Agency FileLevel of Evidence RequiredReasonable causeGeneralThe Department of <strong>Child</strong>ren <strong>and</strong> <strong>Families</strong> (DCF)is a consolidated children’s services agency withstatutory responsibility <strong>for</strong> child protection,mental health services, substance abuse treatment,<strong>and</strong> juvenile justice. It is a State-managedsystem comprised of 14 area offces. In addition,DCF operates four facilities—a children’spsychiatric hospital, an emergency <strong>and</strong> diagnosticresidential program, a treatment facility <strong>for</strong>children with serious mental health issues, <strong>and</strong> ajuvenile justice facility.ReportsA centralized intake unit—the <strong>Child</strong> Abuse <strong>and</strong>Neglect Hotline—operates 24 hours a day, 7days a week. CPS workers receive the reports ofsuspected abuse <strong>and</strong> neglect <strong>and</strong> <strong>for</strong>ward themto a regional offce <strong>for</strong> investigation. Hotline fieldstaff respond to emergencies when the regionaloffces are closed. Referrals are not accepted <strong>for</strong>investigation if they do not meet the statutorydefinition of abuse or neglect. In<strong>for</strong>mation onscreened-out referrals is from the DCF hotline.Area offce staff investigate reports of abuse <strong>and</strong>neglect. Investigation protocols include contactwith the family, with the children apart fromtheir parents, <strong>and</strong> with all collateral systemsto which the family <strong>and</strong> child are known. Allcases of sexual abuse—as well as serious cases ofabuse, neglect, <strong>and</strong> medical neglect—are referredto the police per departmental policy.FatalitiesDCF collects data on all reported child fatalitiesregardless of whether or not the child or familyreceived DCF services. The Special Review Unitconducts an investigation <strong>for</strong> cases when a childdies <strong>and</strong> either had an active CPS case or had aprior substantiated report. The medical examineris responsible <strong>for</strong> determining the cause ofdeath <strong>and</strong> the criminal nature of the death. DCFmakes the determination concerning abuse <strong>and</strong>neglect.DELAWARETara L. TyreData ManagerDivision of Family ServicesDelaware Department of Services <strong>for</strong> <strong>Child</strong>ren,Youth <strong>and</strong> Their <strong>Families</strong>1825 Faulkl<strong>and</strong> RoadWilmington, DE 19805302–633–2538302–633–2652 Faxtara.tyre@state.de.usData File(s) Submitted<strong>Child</strong> File, Agency FileLevel of Evidence RequiredPreponderanceReportsThe State’s intake unit requires the collection ofsuffcient in<strong>for</strong>mation to access <strong>and</strong> determinethe urgency to investigate the report. The Statehas a dual response system <strong>for</strong> investigatingcases. Urgent cases require contact within 24hours <strong>and</strong> routine cases require contact within10 days. The calculation of average response timeis provided <strong>for</strong> family abuse investigations onlybecause the State cannot determine the initialcontact in institutional abuse investigations.<strong>Child</strong>renThe State uses 48 statutory types of childabuse, neglect, <strong>and</strong> dependency to substantiatean investigation. The State code defines thefollowing terms: “abuse” shall mean any physicalinjury to a child by those responsible <strong>for</strong> thecare, custody, <strong>and</strong> control of the child, throughunjustified <strong>for</strong>ce as defined in §468 of Title 11,including emotional abuse, torture, criminallynegligent treatment, sexual abuse, exploitation,maltreatment, or mistreatment. “neglect” shallmean the failure to provide, by those responsible<strong>for</strong> the care, custody, <strong>and</strong> control of the child,the proper or necessary education as required bylaw; nutrition; or medical, surgical or any othercare necessary <strong>for</strong> the child’s well-being. “depen-APPENDIX D: State Commentary 141
dent child” shall mean a child whose physical,mental, or emotional health <strong>and</strong> well-being isthreatened or impaired because of inadequatecare <strong>and</strong> protection by the child’s custodian, whois unable to provide adequate care <strong>for</strong> the child,whether or not caused by the child’s behavior.Under the Department of Services <strong>for</strong> <strong>Child</strong>ren,Youth <strong>and</strong> Their <strong>Families</strong>, children may beplaced in residential care from the child welfareprogram, the juvenile justice program, or thechild mental health program. In calculatingchild victims reunited with their families in theprevious 5 years, the State did not include theplacements from <strong>Child</strong> Mental Health <strong>and</strong> JuvenileJustice as a previous placement in which thechild was reunited with their family if there wasno placement involvement with the child welfareagency. This is because the Juvenile Justice <strong>and</strong><strong>Child</strong> Mental health placements alone are notthe direct result of the caretaker’s substantiationof abuse, neglect, or dependency.DISTRICT OF COLUMBIALois Branic<strong>Child</strong> <strong>and</strong> Family Services AgencyDistrict of Columbia Department of Human Services702 H Street, NW, Ste. 200Washington, DC 20001202–434–0027 Offce202–434–0099 Faxlois.branic@dc.govData File(s) Submitted<strong>Child</strong> File, Agency FileLevel of Evidence RequiredCredibleReportsThe hotline is a centralized system that receivesall referrals of abuse <strong>and</strong> neglect. All reports arejointly investigated by child protective services<strong>and</strong> by the Metropolitan Police Department.During 2003, the disposition values werechanged to comply with, “The Prevention of<strong>Child</strong> Abuse <strong>and</strong> Neglect Act of 1977” (DC law2–22; DC Offcial Code 4–1301.02). Changes insocial work practices based on the new law <strong>and</strong>other agency initiatives, resulted in the changesin NCANDS maltreatment dispositions <strong>and</strong>report dispositions <strong>for</strong> Federal fiscal year (FFY)2005. This law added a new paragraph (12A) toread as follows: “(12A) “Inconclusive report”means a report…which cannot be proven to beeither substantiated or unjustified which resultsin the use of additional dispositional values.”ServicesThe District of Columbia <strong>Child</strong> <strong>and</strong> Family ServicesAgency (CFSA) contracts with The Healthy<strong>Families</strong> Thriving Communities CollaborativeCouncil (HFTCC) to provide both post <strong>and</strong>preventive services community-based servicesto families referred by CFSA. The number offamilies referred is available but the specifictypes of services are not reported to the agencyFLORIDAKeith A. PerlmanData Reporting AdministratorFamily SafetyFlorida Department of <strong>Child</strong>ren <strong>and</strong> <strong>Families</strong>1317 Winewood BoulevardTallahassee, FL 32399–0700850–922–2195850–487–0688 FaxKeith_Perlman@dcf.state.fl.usData File(s) Submitted<strong>Child</strong> File, Agency FileLevel of Evidence RequiredIndicated–credible evidence (offering reasonablegrounds <strong>for</strong> being believed).Substantiated–preponderance (superiority inweight, most of the evidence supports abuse, orquality <strong>and</strong> importance. At least one piece of evidencein support of abuse is exceptionally strong,such as DNA findings or a pediatrician’s willingnessto testify the injuries were from abuse).ReportsThe criteria to accept a report include a childyounger than 18 years, who has not been notemancipated by marriage or other order ofa competent court, is a victim of known orsuspected child abuse, ab<strong>and</strong>onment, or neglectby a parent, legal custodian, caregiver, or otherperson responsible <strong>for</strong> the child’s welfare, oris in need of supervision <strong>and</strong> care <strong>and</strong> has noparent, legal custodian, or responsible adultrelative immediately known <strong>and</strong> available toprovide supervision <strong>and</strong> care. The child mustbe either a resident of or can be located in theState. Screened-out referrals reflect phone calls142 <strong>Child</strong> <strong>Maltreatment</strong> <strong>2006</strong>
eceived about situations that the caller initiallythought were child abuse or neglect, but did notmeet the statutory criteria.The NCANDS category “other” report sourceincludes attorney, spiritual healer, GAL, guardian,human rights advocacy committee, <strong>and</strong>client relations’ coordinator. Multiple reportingsources per report may be entered into the State’ssystem. If so, the first source entered is used <strong>for</strong>NCANDS <strong>and</strong> the others are discarded. Fostercare provider is not captured as a specific reportsource.Response time in the Agency File is based on151,818 reports. The response commences whenthe assigned <strong>Child</strong> Protective Investigatorattempts the initial face-to-face contact withthe victim. The system calculates the number ofminutes from the received date <strong>and</strong> time to thecommencement date <strong>and</strong> time. The minutes <strong>for</strong>all cases are averaged <strong>and</strong> converted to hours. Aninitial onsite response is conducted immediatelyin situations in which any one of the followingallegations is made: (1) a child’s immediatesafety or well-being is endangered; (2) the familymay flee or the child will be unavailable within24 hours; (3) institutional abuse or neglect isalleged; (4) an employee of the department hasallegedly committed an act of child abuse orneglect directly related to the job duties of theemployee, or when the allegations otherwisewarrant an immediate response as specified instatute or policy; (5) a special condition referral<strong>for</strong> emergency services is received; or (6) thefacts otherwise so warrant. All other initialresponses must be conducted with an attemptedon-site visit with the child victim within 24hours.The staff figures in the Agency File representallocated positions as of 9/30/<strong>2006</strong>. They do nottake into account vacancies, overtime or temporarystaff. Included are 140 hotline counselors,17 Hotline Supervisors, 1,100 State full-timeequivalent (FTE) <strong>Child</strong> Protective Investigators,190 State FTE Investigator Supervisors, 369Sheriff Offce <strong>Child</strong> Protective Investigators,<strong>and</strong> 72 Sheriff Offce Investigator Supervisors.Hotline staff also take calls related to adultprotective services. <strong>Child</strong> calls represent about80 percent of their workload.Workers <strong>and</strong> supervisors are related to the individual’sassignment to a unit. If an individualtransfers or is promoted from one unit or agencyto another during the year, the worker will notretain the same value in the system.<strong>Child</strong>renThe <strong>Child</strong> File includes children alleged to bevictims <strong>and</strong> other children in the household.The Adoption <strong>and</strong> Foster Care Analysis <strong>and</strong>Reporting System (AFCARS) identificationnumber field is populated with the numbercreated <strong>for</strong> the child regardless of whether thatchild was removed or reported to AFCARS.The State maps “threatened harm,” includingdomestic violence situations, as “other” maltreatment.“Threatened harm” is defined as behaviorthat is not accidental <strong>and</strong> is likely to result inharm to the child. However, the State does notbelieve it is appropriate to include these withmaltreatments where harm has already occurreddue to abuse (willful action) or neglect (omissionwhich is a serious disregard of parental responsibilities).PerpetratorsBy policy, perpetrator data are captured only <strong>for</strong>substantiated reports, which have a higher levelof evidence than indicated reports.All licensed foster parents <strong>and</strong> nonfinalizedadoptive parents are translated as nonrelativefoster parents, although some may be related tothe child. Approved relative caregivers (licensenot issued) are translated as relative fosterparents. The value <strong>for</strong> perpetrator relationshipof friends or neighbors is not used. To meetstatutory criteria <strong>for</strong> child abuse or neglect, theadult must be a caregiver. They may be coded as“sitter” <strong>and</strong> translated to child daycare providerif an unrelated friend or neighbor is caring <strong>for</strong>the child.Most data captured <strong>for</strong> child <strong>and</strong> caregiver riskfactors are only available if there is a servicescase either already open at the time the report isreceived, or opened due to the report.FatalitiesFatality counts include any report disposedduring the year, even those victims whose datesof death may have been in a prior year. Onlyverified abuse or neglect deaths are counted. Thefinding was verified when a preponderance ofthe credible evidence resulted in a determinationAPPENDIX D: State Commentary 143
that death was the result of abuse or neglect. Allsuspected child maltreatment fatalities must bereported <strong>for</strong> investigation <strong>and</strong> are included inthe <strong>Child</strong> File.ServicesServices reported in the <strong>Child</strong> File are thoserecommended by the <strong>Child</strong> Protective Investigator(CPI), based on a safety assessment, atthe closure of the investigation. Referrals aremade, but services may or may not actually bereceived. The State does not have an automatedsystem to track actual specific services providedwithin a case.Preventive services in the Agency File include,but are not limited to, after school enrichment<strong>and</strong> recreation, child care <strong>and</strong> therapeuticcare, community facilitation, communitymapping <strong>and</strong> development, counseling <strong>and</strong>mentoring services, crisis <strong>and</strong> interventionservices, delinquency prevention, developmentalscreening <strong>and</strong> evaluation, domestic violenceservices, family resource or visitation center <strong>and</strong>full-service schools, Healthy <strong>Families</strong> America,Healthy Start, home visiting <strong>and</strong> in-home parenteducation, in<strong>for</strong>mation <strong>and</strong> referral, parentingeducation <strong>and</strong> training, prenatal <strong>and</strong> perinatalservices, Project Safety Net, respite care <strong>and</strong>crisis nursery, self-help groups <strong>and</strong> supportgroups, <strong>and</strong> teen parent <strong>and</strong> pregnancy program.Counts of preventive services do not includepublic awareness <strong>and</strong> education.The families of the children included in childcounts are also counted in the family counts;however, the family counts include additionalfamilies whose children were not included in thechild counts. By statute, families may includebiological, adoptive, <strong>and</strong> foster families; relativecaregivers; guardians; <strong>and</strong> extended families. Asingle adult aged 18 years or older <strong>and</strong> living alonemay be counted as one family. If a child does nothave a family (because of ab<strong>and</strong>onment, terminationof parents’ rights, institutional care, or otherfactors), the child is counted as one family.Numbers reported as preventive services includefamilies who received services (carryover <strong>and</strong>new) in the reporting period <strong>and</strong> children inthe families who received services. If a parentreceived services, (e.g., parent education<strong>and</strong> training) all children in the family wereidentified as children served. <strong>Child</strong>ren couldnot be served without the family being served.For example, if a child attended an after schooltutoring program, one child <strong>and</strong> one family wereserved. When one of the children in the familyreceived a direct service but the parent did not,siblings were not counted as receiving a service.However, the family was counted. <strong>Child</strong>ren <strong>and</strong>families may have been counted more than oncebecause of the receipt of multiple services or theuse of multiple funding sources.GEORGIADarlene KishbaughData Manager, Reporting SectionDivision of Family <strong>and</strong> <strong>Child</strong>ren ServicesGeorgia Department of Human Resources2 Peachtree Street NW, Room 19.105Atlanta, GA 30303–3142404–657–5127404–657–3325 Faxdbkishba@dhr.state.ga.usData File(s) Submitted<strong>Child</strong> File, Agency FileLevel of Evidence RequiredPreponderanceReportsFederal fiscal year (FFY) 2005 is the first <strong>Child</strong>File submission by the State. The shift fromthe SDC File to the <strong>Child</strong> File may impact thecomparability of previous years’ data to thepresent year’s data.The components of a CPS report are a childyounger than 18 years, a known or unknownindividual alleged to be a perpetrator, <strong>and</strong> areferral of conditions indicating child maltreatment.Referrals are screened out if they do notcontain the components of a CPS report.Situations in which no allegations of maltreatmentare included in the referral <strong>and</strong> in whichlocal or county protocols do not require aresponse, are screened out. Such situations couldinclude historical incidents, custody issues,poverty issues, educational neglect or truancyissues, situations involving an unborn child, orjuvenile delinquency issues. For many of these,referrals are made to other resources, such asearly intervention or prevention programs.Social services personnel includes Departmentof Human Resources staff. The “other” report144 <strong>Child</strong> <strong>Maltreatment</strong> <strong>2006</strong>
source category includes other nonm<strong>and</strong>atedreporters, religious leaders or staff, <strong>and</strong> TemporaryAssistance <strong>for</strong> Needy <strong>Families</strong> staff.<strong>Child</strong>renPrior to 2004, multiracial victims were includedin the NCANDS category of unknown race. Asof 2004, a child victim may be counted in morethan one racial group <strong>and</strong> is reported separately<strong>for</strong> all categories that apply. Also as of 2004, theState collects data on child victim by Hispanicor Latino Ethnicity, <strong>and</strong> by Native Hawaiian orPacific Isl<strong>and</strong>er race.ServicesThe State maintains data on services throughcounts of cases, not children. Thus, estimateswere provided. Only data <strong>for</strong> removals thatoccurred during an investigation are included.Data on removals that occurred after theinvestigation decision, or within 90 days of thedecision, were unavailable. The <strong>Child</strong> PlacementProject Study (a project of the Georgia SupremeCourt) provided the number of victims whoreceived a court-appointed representative.HAWAIIRicky HigashideActing Research SupervisorManagement Services OffceHawaii Department of Human Services1390 Miller Street, Room 210Honolulu, HI 96813808–586–5117808–586–4810 Faxrhigashide@dhs.hawaii.govData File(s) Submitted<strong>Child</strong> File, Agency FileLevel of Evidence RequiredReasonable, <strong>for</strong>eseeable riskReportsReports to child protective services (CPS) areh<strong>and</strong>led in one of three ways: 1) least severecases are contracted to Family StrengtheningServices (FSS), 2) less severe cases are diverted toVoluntary Case Management (VCM), <strong>and</strong> 3) thesevere cases are sent to investigation. Cases thatwere previously investigated <strong>and</strong> confirmed as“threatened harm” may now be diverted to FSSor VCM, without investigation. This results in adrop in reports included in the NCANDS <strong>Child</strong>File. As a majority of recurrence cases were“threatened harm,” this would also result in areduction in recurrence rate.<strong>Child</strong>renThe NCANDS category “other” maltreatmenttype includes “threatened abuse” or “threatenedneglect.” The State only uses substantiated <strong>and</strong>unsubstantiated dispositions. The substantiatedvictim was with one or more of the allegedmaltreatments confirmed with more than 50percent certainty.PerpetratorsThe State CPS system designates up to twoperpetrators per child.ServicesThe State is not able to report children <strong>and</strong>families receiving preventive services underthe <strong>Child</strong> Abuse <strong>and</strong> Neglect State Grant, theSocial Services Block Grant, <strong>and</strong> “other” fundingsources because funds are mixed. Funds areallocated into a single budget classification <strong>and</strong>multiple sources of State <strong>and</strong> Federal fundingare combined to pay <strong>for</strong> most services. All activecases receive services.IDAHOJeri BalaProgram Systems SpecialistDivision of Family <strong>and</strong> Community Services/FOCUSIdaho Department of Health <strong>and</strong> Welfare450 West State StreetBoise, ID 83720208–332–7227208–332–7351 Faxbalaj@idhw.state.id.usData File(s) Submitted<strong>Child</strong> File, Agency FileLevel of Evidence RequiredPreponderanceReportsThe investigation start date is defined as the date<strong>and</strong> time the child is seen by a child protectiveservices (CPS) staff member. The date <strong>and</strong> time iscompared against the report date <strong>and</strong> time whenCPS was notified about the alleged abuse.APPENDIX D: State Commentary 145
<strong>Child</strong>renAt this time, the State’s Statewide Automated<strong>Child</strong> Welfare In<strong>for</strong>mation System (SACWIS)cannot provide living arrangement in<strong>for</strong>mationto the degree of detail requested.ServicesCourt-appointed representative data are nottracked in the State’s SACWIS. However, childrenusually have a Guardian ad Litem assignedto them if they have court involvement.The State does not distinguish betweencounseling <strong>and</strong> mental health services. TheState does not maintain in<strong>for</strong>mation that woulddifferentiate Family Planning Services fromsimilar services.For the Agency File data, the numbers of children<strong>and</strong> families who received preventive servicesunder the Community-Based Prevention of <strong>Child</strong>Abuse <strong>and</strong> Neglect Grants were provided by amanual count from the <strong>Child</strong>ren’s Trust Fund <strong>for</strong>Community-Based Family Resource <strong>and</strong> SupportGrant Programs. Also <strong>for</strong> Agency File data, thenumbers of children <strong>and</strong> families who receivedservices funded by the Family Preservation <strong>and</strong>Support grant were attached to reports that fellwithin the reporting period.For Agency File data, families served fromCommunity Resources <strong>for</strong> <strong>Families</strong> SchoolPrevention Program, were counted from theCommunity Resource Emergency Assistance(CREA) system.ILLINOISJim Van LeerSupervisor, Offce of In<strong>for</strong>mation ServicesIllinois Department of <strong>Child</strong>ren <strong>and</strong> Family Services1 N. Old State Capitol Plaza, Station SACWISSpringfield, IL 62701217–747–7626217–747–7750 Faxjim.vanleer@illinois.govData File(s) Submitted<strong>Child</strong> File, Agency FileLevel of Evidence RequiredCredibleReportsAll calls to the hotline that meet the criteria ofan abuse or neglect allegation are referred <strong>for</strong> achild protective services investigation.“Other report dispositions” refers to noninvolvedchildren (i.e. children not suspected ofbeing abuse or neglected) who are recorded ona child abuse or neglect report. Because thereare no allegations of abuse or neglect <strong>for</strong> thesechildren, there are no specific dispositions.The response time to investigation is based onthe average between the receipt of a report at thehotline <strong>and</strong> the time an investigator makes thefirst contact. The response time is determinedboth by priority st<strong>and</strong>ard <strong>and</strong> by apparent riskto the alleged victim. All investigations, with theexception of cases involving only lock-out of anadolescent or teenager, must be initiated within24 hours according to State law. Lock-out casesmust be initiated within 48 hours.The NCANDS category “other” report sourceincludes “administration/subject facility,” “staff/subject facility,” “<strong>for</strong>mer employee/subjectfacility,” “not noted,” “attorney,” <strong>and</strong> “othernonm<strong>and</strong>ated source.”<strong>Child</strong>ren<strong>Child</strong>ren who are at risk of physical injury arecounted under physical abuse <strong>and</strong> children whoare at risk of sexual injury are counted undersexual abuse.The NCANDS category “other” living arrangementincludes “institution–DCFS, DOC, DMH,private child care facility, rehab services”;“nursing care facility”; “detention facility/jail”;“hospital/ health facility”; “armed service duty”;“college/university”; “guardian successor”;“independent living”; “runaway”; “subsidizedguardian”; <strong>and</strong> “deceased.”PerpetratorsThe NCANDS category “other” perpetratorrelationship includes “church staff” <strong>and</strong>“nonstaff person.”ServicesDiscrepancies in data from year to year can beattributed to reporting <strong>for</strong>ms changes.146 <strong>Child</strong> <strong>Maltreatment</strong> <strong>2006</strong>
INDIANAAngela GreenDeputy Director of Practice SupportIndiana Department of <strong>Child</strong> Services402 W. Washington Street, Room W392–MS47Indianapolis, IN 46204317–232–4631317–232–4490 Faxangela.green@dcs.in.govData File(s) Submitted<strong>Child</strong> File, Agency FileLevel of Evidence RequiredCredibleReportsPer statute, the State has three separate responsetimes dependent on the type of allegation.The NCANDS category “other” report sourceincludes “military” <strong>and</strong> “other.” Inconsistencieswith report county may be caused by the reportbeing started in one county <strong>and</strong> transferred toanother.<strong>Child</strong>renThe NCANDS category “other” living arrangementincludes “school,” “State institution,”“nursing home,” “hospital,” “other,” “registeredministries,” <strong>and</strong> “all unregistered/unlicensedcenters.” Incident date is not reported.FatalitiesFatalities removed from the <strong>Child</strong> File due to thereport date being older than the previous periodwere included in the Agency File.PerpetratorsThe NCANDS category “other” perpetratorrelationship includes “babysitter,” “resident,”“self,” “other,” <strong>and</strong> “unavailable.”ServicesThe decrease in some preventive services fundsis because monies had to be shifted in differentfunding sources to continue some of theprograms. Some of the providers had to usecounty funds <strong>for</strong> reimbursement.IOWAJoseph FinneganBureau Chief<strong>Child</strong> Welfare In<strong>for</strong>mation SystemsIowa Department of Human ServicesHoover State Offce Building, 5th Floor1305 East WalnutDes Moines, IA 50319515–281–5126515–281–4597 Faxjfinneg@dhs.state.ia.usData File(s) Submitted<strong>Child</strong> File, Agency FileLevel of Evidence RequiredPreponderance of credible evidence (greater than 50%)ReportsThe investigation start date is determined by thefirst face-to-face contact with the alleged victim.Dates <strong>and</strong> days are the smallest units of timemaintained in the State’s system.<strong>Child</strong>renThe number of victims associated with priorchild abuse assessments decreased with Federalfiscal year (FFY) 2005, due to a change inlogic—not to count unknown perpetrators inthe prior abuse check <strong>and</strong> another correction toinclude only founded, substantiated, or indicatedincidents as prior. The removal date logic wasreviewed after a suggestion by the Federal team<strong>and</strong> changed accordingly.ServicesServices include out-of-home placements <strong>and</strong>community care activities as a direct result ofchild abuse assessment.KANSASKendall DarlingProgram AdministratorDivision of <strong>Child</strong>ren <strong>and</strong> Family PolicyKansas Department of Social <strong>and</strong> Rehabilitative ServicesDocking State Offce Building, 5th Floor South,Rm 5515915 SW HarrisonTopeka, Kansas 66612–1570785–291–3665785–368–8159 Faxkjd@srs.ks.govAPPENDIX D: State Commentary 147
Data Files Submitted<strong>Child</strong> File, Agency FileLevel of Evidence RequiredClear <strong>and</strong> convincingReportsDuring July 2004, the Kansas AdministrativeRegulations <strong>for</strong> the definitions of abuse <strong>and</strong>neglect were changed. This change has had animpact on which reports are screened in <strong>and</strong>screened out <strong>for</strong> further assessment. A screenedoutreport is a report to Social RehabilitativeServices (SRS) alleging a child in need of carethat was not accepted <strong>for</strong> investigation orassessment.The investigation start date is defined as thedate of first face-to-face contact with an allegedvictim. Dates <strong>and</strong> days are the smallest units oftime maintained in the State’s system.The NCANDS category “other” report sourceincludes “self,” “private agencies,” “religiousleaders,” “guardian,” “Job Corp,” “l<strong>and</strong>lord,”“Indian tribe or court,” “other person,” “out-of-State agency,” “citizen review board member,”“collateral witness,” “public offcial,” “volunteer,”<strong>and</strong> “Crippled <strong>Child</strong>ren’s services.”<strong>Child</strong>renSubstantiated means the facts or circumstancesprovide clear <strong>and</strong> convincing evidence toconclude abuse or neglect did occur based onthe Kansas Statutes Annotated <strong>and</strong> KansasAdministrative Regulations definition of abuseor neglect. Not all victims have an assignedAFCARS ID.The NCANDS category “other” maltreatmenttype includes “lack of supervision.”ServicesThe State does not capture in<strong>for</strong>mation on courtappointed representatives. However, State lawrequires every child to have a court-appointedattorney.KENTUCKYBobby ReidOffce of TechnologyClient System Server ManagementKentucky Cabinet <strong>for</strong> <strong>Families</strong> <strong>and</strong> <strong>Child</strong>ren151 Elkhorn CourtFrank<strong>for</strong>t, KY 40601502–564–0105 Ex. 10630bobby.reid@ky.govData File(s) Submitted<strong>Child</strong> File, Agency FileLevel of EvidencePreponderancePerpetratorsPerpetrator data were provided in the <strong>Child</strong> File<strong>for</strong> substantiated victims, but not <strong>for</strong> alternativeresponse victims.ServicesService data were reported <strong>for</strong> both victims <strong>and</strong>nonvictims.LOUISIANAWalter G. Fahr<strong>Child</strong> Welfare Specialist VOffce of Community ServicesLouisiana Department of Social ServicesP. O. Box 3318Baton Rouge, LA 70821225–342–6832225–342–9087 Faxwfahr@dss.state.la.usData File(s) Submitted<strong>Child</strong> File, Agency FileLevel of Evidence RequiredReasonableReportsThe investigation start date is the date <strong>and</strong> timeof the initial face-to-face contact with each identifiedvictim <strong>and</strong> the victim’s parent or caretaker.The State is starting to capture the initial date<strong>and</strong> time—including hours <strong>and</strong> minutes—<strong>for</strong>victims <strong>and</strong> caretakers.Referrals are screened in if they meet the threeprimary criteria <strong>for</strong> case acceptance: a childvictim younger than 18 years, an allegation ofchild abuse or neglect as defined by the Louisi148 <strong>Child</strong> <strong>Maltreatment</strong> <strong>2006</strong>
ana <strong>Child</strong>ren’s Code, <strong>and</strong> the alleged perpetratoris the legal caretaker of the alleged victim. TheState does not capture in<strong>for</strong>mation on screenedoutreferrals.The State is currently unable to provide dataon response time to initial investigation in theAgency File.<strong>Child</strong>renThe State term <strong>for</strong> a substantiated case is “valid.”When determining a final finding of “valid”child abuse or neglect, the worker <strong>and</strong> supervisorreview the in<strong>for</strong>mation gathered during theinvestigation carefully, <strong>and</strong> use the followingst<strong>and</strong>ard.The available facts when viewed in light of surroundingcircumstances would cause a reasonableperson to believe that the following exists:■ An act or a physical or mental injury whichseriously endangered a child’s physical,mental or emotional health <strong>and</strong> safety; or■ A refusal or unreasonable failure to providenecessary food, clothing, shelter, care,treatment or counseling which substantiallythreatened or impaired a child’s physical,mental, or emotional health <strong>and</strong> safety; or anewborn identified as affected by the illegaluse of a controlled dangerous substance orwithdrawal symptoms as a result of prenatalillegal drug exposure; <strong>and</strong>■ The direct or indirect cause of the alleged orother injury, harm or extreme risk of harmis a parent; a caretaker as defined in theLouisiana <strong>Child</strong>ren’s Code; an adult occupantof the household in which the child victimnormally resides; or, a person who maintainsan interpersonal dating or engagementrelationship with the parent or caretaker orlegal custodian who does not reside with theparent or caretaker or legal custodian.If the answers to the above are “yes,” then theallegation(s) is valid.The State term <strong>for</strong> unsubstantiated cases is“invalid.” The definition of invalid is as follows:■ Cases with no injury or harm, no extremerisk of harm, insuffcient evidence to meetvalidity st<strong>and</strong>ard, or a noncaretaker perpetrator.If evidence of abuse or neglect by aparent, caretaker, adult household occupant,or person who is dating or engaged to a parentor caretaker suffcient to meet the agencyst<strong>and</strong>ard is not obtained, the allegation shallbe found invalid. Any evidence that a childhas been injured or harmed by persons otherthan the parent or caretaker or adult householdoccupant <strong>and</strong> there was no culpabilityby a parent or caretaker or adult householdoccupant, or person dating or engaged to parentor caretaker shall be determined invalid.Indicated is not a finding that is used.■ It is expected that the worker <strong>and</strong> supervisorwill determine a finding of “invalid” or“valid” whenever possible. For cases in whichthe investigation findings do not meet thest<strong>and</strong>ard <strong>for</strong> “invalid” or “valid” additionalcontacts or investigative activities should beconducted to determine a finding. When afinding cannot be determined following suchef<strong>for</strong>ts, an inconclusive finding is considered.It is appropriate when there is some evidenceto support a finding that abuse or neglectoccurred but there is not enough credibleevidence to meet the st<strong>and</strong>ard <strong>for</strong> a “valid”finding. The inconclusive finding is onlyappropriate <strong>for</strong> cases in which there are particularfacts or dynamics that give the workeror supervisor a reason to suspect child abuseor neglect occurred. Staff are expected to usecaution when using this finding as it not to beused as a “catchall” finding.Article 612 of the Louisiana <strong>Child</strong>ren’s Codeenables the agency to h<strong>and</strong>le incoming referralsof abuse <strong>and</strong> neglect that are identified as lowrisk with an assessment of the family needs <strong>and</strong>referral <strong>for</strong> necessary services. These cases donot have a finding <strong>for</strong> child maltreatment <strong>for</strong> thevictims. There<strong>for</strong>e, all of these cases are countedas alternate response nonvictim cases.The NCANDS category “other” dispositionsincludes:■ “Tracking only” <strong>for</strong> persons who are not asubjects of an investigation but are includedbecause of their relationship with a child.This may include parents who do not residewith a child victim or others who may becontacted because of their knowledge of achild.■ “Transfer to other program” <strong>for</strong> when a caseis transferred to another program or agency,usually because it is not a child protectioninvestigation.■ “Noninvolved person responsible <strong>for</strong> thechild” <strong>for</strong> a parent or guardian, who isAPPENDIX D: State Commentary 149
not the subject of a child abuse or neglectinvestigation.■ The significant decrease in the number ofalternative response nonvictim cases is adirect result of the temporary closure of thetwo offces in the Metropolitan New Orleansarea that were closed due to HurricaneKatrina <strong>and</strong> the significant population displacement.The significant increase in closedwith no finding cases was a result of closing“unable to locate” cases after Katrina <strong>and</strong>the closure of a number of cases prior to thestart of the new Statewide Automated <strong>Child</strong>Welfare In<strong>for</strong>mation System (SACWIS).PerpetratorsThe State is unable to capture the perpetratorrelationship accurately <strong>and</strong> there<strong>for</strong>e reports thecode “other” <strong>for</strong> 99 percent of cases.ServicesThe State provides the following postinvestigationservices foster, adoptive, in-home family,<strong>and</strong> family in need of services. The State providesmore postinvestigation services than it is able toreport to NCANDS. Almost all services providedby other agencies <strong>and</strong> offces are not reported.The implementation of two legislative actsduring Federal fiscal year (FFY) 2005, Act 148(Voluntary Placements Discontinued) <strong>and</strong>Act 338 (Substance Exposed Infants) were theprimary cause <strong>for</strong> the increasing foster careservices increases.MAINERobert PronovostManager, Intake UnitBureau of <strong>Child</strong> <strong>and</strong> Family ServicesMaine Department of Health <strong>and</strong> Human Services11 State House Station221 State StreetAugusta, ME 04333207–624–8642207–287–5065 Faxrobert.n.pronovost@maine.govData File(s) Submitted<strong>Child</strong> File, Agency FileLevel of Evidence RequiredPreponderanceReportsThe State’s Statewide Automated <strong>Child</strong> WelfareIn<strong>for</strong>mation System (SACWIS) is used todocument all reports made to child protectiveservice (CPS). Report dispositions include“inappropriate <strong>for</strong> CPS” (does not meet thecriteria <strong>for</strong> investigation), “appropriate <strong>for</strong> CPSreferred to contract agency,” <strong>and</strong> “appropriatereports assigned <strong>for</strong> assessment.” The State’s<strong>Child</strong> File only includes data on the “reportsassigned <strong>for</strong> assessment.”The report date is defined as the date when theintake unit received the report. The investigationstart date is defined as the date when face-to-facecontact occurs with the alleged victim. Bothof these dates are captured in date, hours, <strong>and</strong>minutes in the SACWIS, but reported as dateonly to NCANDS.The number of children reported to be subjectsof a report but not referred <strong>for</strong> an investigationis an undercount. Only the number of childrenwho were referred to a contract agency <strong>for</strong>followup is known.The number of full-time equivalents (FTEs) wastaken from the Legislative Line List. Screening<strong>and</strong> intake staff includes the full-time staff ofthe Central <strong>Child</strong> Protection Intake Unit <strong>and</strong> aproportion of field staff that per<strong>for</strong>m intake <strong>and</strong>screening functions in the eight district offces.<strong>Child</strong>renA <strong>Child</strong> File record was submitted <strong>for</strong> any childwith the role of alleged victim. Additionalchildren in the family who had a role of “notinvolved” or “undetermined” were not includedin the submission.FatalitiesFatality in<strong>for</strong>mation was provided by the <strong>Child</strong>Death <strong>and</strong> Serious Injury Review Panel <strong>and</strong>reported in the Agency File.PerpetratorsThe State now has an appeals process <strong>for</strong>perpetrators who do not agree with a specificfinding. Practice is changing because of the highoverturn rate during the appeals process.ServicesNine private agencies under contract with theBureau of <strong>Child</strong> <strong>and</strong> Family Services providepreventive <strong>and</strong> postassessment services in all150 <strong>Child</strong> <strong>Maltreatment</strong> <strong>2006</strong>
16 counties. The number of families referred isavailable in the SACWIS, but the specific typesof services provided are not reported. Servicesin<strong>for</strong>mation will show decreasing numbersdue to most service cases being referred out toprivate agencies. The State is making a policychange that restricts State involvement inservices cases to only those with high severityfindings of abuse <strong>and</strong> neglect. State involvementwill also be limited to 6 months or less unlesscourt action is taken.MARYLANDDavid AyerDirector of Research, Evaluation <strong>and</strong>Systems DevelopmentMaryl<strong>and</strong> Department of Human Resources311 West Saratoga StreetBaltimore, MD 21201410–767–8946410–333–6556 Faxdayer@dhr.state.md.usLevel of Evidence RequiredPreponderanceGeneralThe State was not able to submit FFY <strong>2006</strong> datain time <strong>for</strong> publication in <strong>Child</strong> <strong>Maltreatment</strong>.MASSACHUSETTSRosalind WalterDirector of Data ManagementIn<strong>for</strong>mation TechnologyMassachusetts Department of Social Services24 Farnsworth StreetBoston, Massachusetts 02210617–748–2219617–748–2419 Faxros.walter@state.ma.usData File(s) Submitted<strong>Child</strong> File, Agency FileLevel of Evidence RequiredReasonableReportsA referral may be screened out because thereis no reasonable cause to believe that the childwas abused or neglected; the alleged perpetratorwas not a caretaker; the specific situation isoutdated <strong>and</strong> has no bearing on current risk tochildren; the specific condition is known <strong>and</strong>is being addressed by an ongoing service case;the specific condition was investigated <strong>and</strong> aduplicate investigation would be unnecessarilyintrusive to the family; the reported childis 18 years old or older; or the report is notcredible due to a history of unreliability fromthe same individual. The State has a policy<strong>for</strong> completing investigations within 24 hours<strong>for</strong> emergency reports <strong>and</strong> within 10 days <strong>for</strong>nonemergency reports.Currently the role of the reporter is not am<strong>and</strong>atory item when entering a protective intakein FamilyNet (the Statewide Automated <strong>Child</strong>Welfare In<strong>for</strong>mation System). When the FamilyEngagement Model changes are made to Family-Net, reporter role could be made m<strong>and</strong>atory.The number of screening, intake, <strong>and</strong> investigationworkers is based on an estimated number of(full-time equivalents) FTEs, derived by dividingthe number of intakes <strong>and</strong> investigations completedduring the calendar year by the monthlyworkload st<strong>and</strong>ards. The number includes bothState staff <strong>and</strong> staff working <strong>for</strong> the Judge BakerGuidance Center. The Judge Baker GuidanceCenter h<strong>and</strong>les CPS functions during evening<strong>and</strong> weekend hours when State offces are closed.Because assessments are case-managementactivities rather than screening, intake, <strong>and</strong>investigation activities, the number of workerscompleting assessments was not reported.The estimated FTE numbers were taken fromReports of <strong>Child</strong> Abuse/Neglect-Twelve MonthSummary <strong>and</strong> Investigations Completed-TwelveMonth Summary. The State uses these numbers<strong>for</strong> its own management purposes, <strong>and</strong> theypresent a clearer picture than would a countof unique individuals who per<strong>for</strong>med thesefunctions. Many Department of Social Services(DSS) social workers per<strong>for</strong>m screening, intake,<strong>and</strong> investigation functions in addition toongoing casework.<strong>Child</strong>renLiving arrangement data are not collected duringinvestigations with enough specificity to report,except <strong>for</strong> children who are in placement. <strong>Child</strong>alcohol <strong>and</strong> drug abuse are not reported becauseFamilyNet does not distinguish between typesof substance abuse. Data on child health <strong>and</strong>behavior are collected, but it is not m<strong>and</strong>atory toenter the data during an investigation. Data onAPPENDIX D: State Commentary 151
caretaker health <strong>and</strong> behavior conditions are notusually collected. The investigation start date isdefined as the date that the intake is screened in<strong>for</strong> investigation.FatalitiesThe State maintains a database with child fatalityin<strong>for</strong>mation entered by the Case InvestigationUnit. The database records in<strong>for</strong>mation on allchild fatalities apparently due to abuse or neglectregardless of whether or not the family wasknown to the Department of Social Services(DSS) prior to the fatality.ServicesData are collected only <strong>for</strong> those services that areprovided by DSS. DSS can be granted custody ofa child who is never removed from home. Whenthe DSS is granted custody, the child will havean appointed representative, but that data mightnot be recorded in FamilyNet.MICHIGANLaurie JohnsonCPS Systems Specialist<strong>Child</strong>ren’s Protective Services UnitMichigan Family Independence Agency235 South Gr<strong>and</strong> Avenue, Suite 510Lansing, MI 48909517–241–3577517–241–7407 Faxjohnsonl@michigan.govData File(s) Submitted<strong>Child</strong> FileLevel of Evidence RequiredPreponderance of evidenceReportsThe State did not report investigation start date.The NCANDS category “other” report sourceincludes “hospital/clinic,” “FIA-operatedfacility,” “DMH-operated facility,” “other publicagency,” “private agency personnel (not socialworker, physician or nurse).”Unsubstantiated cases do not have maltreatmentcodes <strong>for</strong> any role. The new CPS system willestablish alleged maltreatment at the intake of acomplaint <strong>and</strong> this will be reported in the future.<strong>Child</strong>ren<strong>Maltreatment</strong> in<strong>for</strong>mation is not available <strong>for</strong>nonvictims in reports. The NCANDS category“other” living arrangement includes “otherout-of-home” <strong>and</strong> “multiple placements.”FatalitiesNo fatalities were reported in the <strong>Child</strong> File.PerpetratorsThe NCANDS category “other” perpetratorrelationship includes “other household.”ServicesCurrently services plans are completed in wordtemplates <strong>and</strong> are not apart of a system. The newStatewide Automated <strong>Child</strong> Welfare In<strong>for</strong>mationSystem (SACWIS) will capture this in<strong>for</strong>mation.MINNESOTAJean Swanson BrobergSystems Analysis Supervisor<strong>Child</strong> Safety & Permanency, SSISMinnesota Department of Human Services444 Lafayette Rd NSt Paul, MN 55155–3862651–772–3765651–772–3794 Faxjean.swanson-broberg@state.mn.usData File(s) Submitted<strong>Child</strong> File, Agency FileLevel of Evidence RequiredPreponderanceReportsThe State made significant improvements tothe ease of recording screened-out referralsduring mid-2004. Greater ease of use, training<strong>for</strong> counties, State quality assurance reviews,<strong>and</strong> enhanced local supervision during Federalfiscal year (FFY) 2005 all contributed to morecomplete reporting of screened-out referrals.152 <strong>Child</strong> <strong>Maltreatment</strong> <strong>2006</strong>
The NCANDS category “other” report sourceincludes “clergy,” “Department of HumanServices birth match,” “other m<strong>and</strong>ated,” <strong>and</strong>“other non-m<strong>and</strong>ated.”<strong>Child</strong>renThe NCANDS category “other” living arrangementincludes “independent living” <strong>and</strong> “other.”FatalitiesAll fatalities are reported in the <strong>Child</strong> File.PerpetratorsThe NCANDS category “other” perpetratorrelationship includes “other nonrelative.”MISSISSIPPIShirley JohnsonProgram ManagerDivision of Family <strong>and</strong> <strong>Child</strong>ren’s ServicesMississippi Department of Human Services750 North State StreetJackson, MS 39205601–359–4679601–576–5026 Faxshirleyj@mdhs.state.ms.usData File(s) Submitted<strong>Child</strong> File, Agency FileLevel of Evidence RequiredCredibleReportsThe State made changes to its StatewideAutomated <strong>Child</strong> Welfare In<strong>for</strong>mation System(SACWIS) to begin collecting living arrangementdata. An investigation is initiated with an“alleged victim” or an “attempted contact” narrativeentry. This date becomes the investigationstart date field. Time is calculated in hours fromthe time that a report is received by the agency tothe time of initiation.<strong>Child</strong>renDepartment of Family <strong>and</strong> <strong>Child</strong>ren Servicesclassifies all reports as “evidenced” or “noevidence.”“Evidenced” numbers are mapped tothe NCANDS category substantiated.MISSOURIMeliny StaysaProgram Development Specialist<strong>Child</strong>ren’s Division Central OffceDepartment of Social ServicesPO Box 88Jefferson City, MO 65103–0088Data File(s) Submitted<strong>Child</strong> File, Agency FileLevel of Evidence RequiredPreponderance of evidence as of August 28, 2004.ReportsThe State records the date of the first actualface-to-face contact with an alleged victim asthe start date of the investigation. There<strong>for</strong>e,the response time is based on the time from thelog-in of the call to the time of the first actualface-to-face contact with the victim <strong>for</strong> all report<strong>and</strong> response types, recorded in hours.The State does not retain the maltreatment type<strong>for</strong> reports that are classified as “alternativeresponse nonvictim,” “unsubstantiated,” or“closed with no finding.” <strong>for</strong> children in thesereports, the maltreatment type is coded as“other” <strong>and</strong> the maltreatment disposition isassigned the value of the report disposition.<strong>Child</strong>renThe State counts a child as a victim of abuseor neglect following a substantiated finding ofabuse or neglect based on a preponderance ofevidence st<strong>and</strong>ard or court adjudicated determination.<strong>Child</strong>ren who received an alternativeresponse are not considered to be victims ofabuse or neglect. There<strong>for</strong>e, the State’s rate ofprior victimization is not comparable to Stateswho define victimization in a different manner,<strong>and</strong> may result in a lower rate of victimizationthan such States. For example, the State prefersto measure its rate of prior victimization bycalculating the total number of <strong>2006</strong> substantiatedrecords, <strong>and</strong> dividing it by the total numberof prior substantiated records, not includingunsubstantiated or alternate response records.Medical neglect maltreatments could not bereported due to mapping <strong>and</strong> data issues.FatalitiesAll fatalities are reported in the <strong>Child</strong> File.APPENDIX D: State Commentary 153
PerpetratorsIndividual findings <strong>for</strong> perpetrators are associatedwith individual children. For NCANDS,the value of the report disposition is equal to themost severe determination of any perpetratorassociated with the report.ServicesData were obtained <strong>for</strong> child contacts withcourt-appointed special advocates (CASA) fromthe Missouri CASA Association. Data <strong>for</strong> childcontacts with Guardians ad Litem were not available<strong>for</strong> <strong>2006</strong>. The <strong>Child</strong>ren’s Trust Fund providedsupplemental data regarding preventive services.MONTANALou Walters<strong>Child</strong> <strong>and</strong> Adult Protective ServicesSystem Liaison<strong>Child</strong> <strong>and</strong> Family ServicesMontana Department of Public Health <strong>and</strong>Human Services1400 BroadwayHelena, MT 59601406–444–1674406–444–5956 Faxlwalters@state.mt.usData File(s) Submitted<strong>Child</strong> File, Agency FileLevel of Evidence RequiredPreponderanceReportsThe <strong>Child</strong> <strong>and</strong> Family Centralized Intake Unitscreens each report of child abuse or neglect todetermine if it requires investigation, services,placement, or in<strong>for</strong>mation. Reports requiringimmediate assessment or investigation areimmediately telephoned to the field offce where,by law, they receive an assessment or investigationwithin 24 hours. All other child protectiveservices (CPS) reports that require assessment orinvestigation are sent to the field within 8 hoursof receipt of the call.ServicesData <strong>for</strong> preventive services are collected by Statefiscal year.NEBRASKAFrank FornataroBusiness System AnalystNebraska Department of Health <strong>and</strong> HumanServices, Protection & Safety11712 South 39th St.PO Box 95044Bellevue, NE 68123–5044402–471–6615402–471–9597 Faxfrank.<strong>for</strong>nataro@hhss.ne.govData File(s) Submitted<strong>Child</strong> File, Agency FileLevel of Evidence RequiredA preponderance of evidence is required <strong>for</strong>court-substantiated <strong>and</strong> inconclusive dispositions.Reports:The State continues to see an increase of reportseach year. The State’s annual report shows aslight increase between 2005 <strong>and</strong> <strong>2006</strong> calendaryear reports but the data <strong>for</strong> the NCANDSsubmission indicates a decrease between Federalfiscal year (FFY) 2005 <strong>and</strong> FFY <strong>2006</strong>. Thedifference between the State’s annual report<strong>and</strong> the <strong>Child</strong> <strong>Maltreatment</strong> report is that theannual report accounts <strong>for</strong> all allegations ofmaltreatment, no matter what the finding, while<strong>Child</strong> <strong>Maltreatment</strong> report includes only thoseallegations where a finding date is within thereporting period.The State places emphasis on safety. This practiceis believed to have an impact on more reportsbeing accepted <strong>for</strong> assessments. The new IntakeReport Screening Tool was updated during FFY2004. Intake workers are more familiar withthe tool <strong>and</strong> are accepting reports that they mayhave otherwise screened out in the past.The disposition type “petition to be filed” wasrecently changed to “court pending.” Thisdisposition is mapped to substantiated <strong>for</strong>NCANDS reporting. If the court does not findenough evidence to substantiate the report, thenthe disposition is changed to “inconclusive”(substantiated by the department).“Court pending” is not a final disposition. Thesereports eventually are changed to either “courtsubstantiated” or “inconclusive” <strong>and</strong> very rarely“unsubstantiated.” During FFY 2005, the Statebegan monitoring reports. When a change or154 <strong>Child</strong> <strong>Maltreatment</strong> <strong>2006</strong>
update is made, in most if not all cases the newfinding date is entered. Many times this new datecauses the report to be included in a subsequentNCANDS reporting period. Research in 2005showed that 1,166 reports included in the <strong>Child</strong><strong>Maltreatment</strong> 2005 report were also included inprevious years’ reports. One cause of this wasdirected at the ef<strong>for</strong>t with cleaning up the oldreports that were once “court pending.”The report counts <strong>for</strong> 2005 may have beeninflated more than it actually would have beenbecause of this monitoring <strong>and</strong> clean up ef<strong>for</strong>t.When comparing <strong>2006</strong> to 2005 the decrease inreport counts may be contributed to this ef<strong>for</strong>t aswell. The State continues to emphasize reviews ofthe “court pending” reports <strong>and</strong> to apply a finaldisposition as soon as possible, but dependingupon the timing, reports may continue to reflectin subsequent reporting years.The plan is to no longer include “court pending”dispositions in the NCANDS submission startingin FFY 2007. When applied to FFY <strong>2006</strong> datathere was a 2 percent decrease across the board.<strong>Child</strong>renThe State has been more <strong>and</strong> more diligent inincluding all children in the reports especiallyif they live in the home where the abuse isbeing reported. This kind of reporting causes adisproportionate correlation when comparingreport count with the abuse type count changesfrom one report period to the next.The State has noticed a recurrence rate increasesince FFY 2003. This is attributed to the changein policy <strong>and</strong> procedures to all reports beingrecorded <strong>and</strong> the emphasis on safety. The recurrencemeasurement as well as the abuse in fostercare both uses the report date instead of theincident date. Because all reports are recorded, itis believed that there may be some reports usedto calculate these measurements where the sameincident or allegation is reflected in both reports.This duplication is being counted as a recurrence<strong>and</strong> depending on the report date this maylook like the child was in foster care when theincident actually occurred prior to the child’sremoval from the home.County data <strong>and</strong> maltreatment level <strong>for</strong> thechild is included in the allegation. <strong>Child</strong>renwho are not victims do not have this in<strong>for</strong>mationincluded in their report. These two fieldshave caused a mismatch when comparing twofields where the in<strong>for</strong>mation is pulled in <strong>for</strong>the child, i.e. investigation date <strong>and</strong> reportmaltreatment level.FatalitiesDuring FFY 2005, the State conducted somein-depth analysis of previous reports <strong>and</strong> foundsome duplication in reporting. This is causedby a child being reported in the Agency File<strong>and</strong> appearing in the <strong>Child</strong> File 1 or 2 yearslater. In FFY 2005 this was cleaned up so thatchildren would not be counted more than once.<strong>Child</strong> fatalities <strong>for</strong> “court pending” dispositionreports were not included in the FFY <strong>2006</strong>report, but continue to be monitored to ensurethat they are either included in subsequentyears or added to the Agency File when it isdetermined that they will not be included in thecurrent or subsequent reports.The State continues to work closely with the<strong>Child</strong> Death Review Team to identify fatalitiesthat are not included in the <strong>Child</strong> WelfareSystem but were determined by the <strong>Child</strong> DeathReview Team to have been caused by child abuse<strong>and</strong> neglect.ServicesThe State is analyzing how services are computed.NCANDS only includes services that areimplemented or continue after the dispositiondate. Best practice includes discontinuingservices when the service is no longer requiredor needed. In many instances, this may beprior to the disposition date. In these cases,the number reported in NCANDS does notaccurately reflect if a service was provided butif a service was implemented <strong>and</strong> provided afterthe disposition date.The State considers many NCANDS elementsas a service, including foster care <strong>and</strong> courtappointedrepresentative. This is being reviewed<strong>for</strong> a better <strong>and</strong> more accurate method.APPENDIX D: State Commentary 155
NEVADAKathleen RubensteinAgency/Program In<strong>for</strong>mation Specialist IIIn<strong>for</strong>mation Management ServicesDivision of <strong>Child</strong> <strong>and</strong> Family Services727 Fairview Dr, Suite ECarson City, NV 89701775–687–9019775–687–9025 Faxkrubenstein@dcfs.state.nv.usData File(s) Submitted<strong>Child</strong> File, Agency FileLevel of Evidence RequiredCredible EvidenceGeneralThe State’s CPS ostensibly functions as threeregional service areas: the Rural Region operatesas a State supervised <strong>and</strong> State administereddelivery system, <strong>and</strong> the Northern (WashoeCounty) <strong>and</strong> Southern (Clark County) Regionsoperate as State supervised <strong>and</strong> county administereddelivery systems. All three service areas arenow using a single data system under the State’sStatewide Automated <strong>Child</strong> Welfare In<strong>for</strong>mationSystem (SACWIS)—the Unified NevadaIn<strong>for</strong>mation Technology <strong>for</strong> Youth (U.N.I.T.Y.).ReportsAn alternative response program was implementedseveral years ago, although the datawere not reported until the Federal fiscal year(FFY) <strong>2006</strong> submission. Additional county staffwere hired during <strong>2006</strong> to increase capability<strong>for</strong> referrals that otherwise would have beenscreened out. The State will start reportingincident date beginning in FFY 2007 with fullreporting in FFY 2008.<strong>Child</strong>ren <strong>and</strong> PerpetratorsDuring <strong>2006</strong>, edits were placed in the SACWISto make data entry of all demographic in<strong>for</strong>mation(race, gender, etc.) m<strong>and</strong>atory alongwith removal of default values on ethnicity.Additionally, reports were developed <strong>and</strong>training bulletins distributed to ensure accuracyin reporting. Year-to-year changes are generallydue to increased accuracy in reporting.FatalitiesPrior to FFY 2005, the State reported only thosechild fatalities that were investigated <strong>and</strong> substantiatedby the child welfare agency. Beginningwith the FFY 2005 NCANDS submission, theState worked closely with the Health Divisionas well as <strong>Child</strong> Fatality Review Team to moreaccurately report child fatalities that were due tomaltreatment. In <strong>2006</strong>, a statewide initiative wasimplemented <strong>for</strong> more comprehensive investigationsof child fatalities. The State does not believethere has been an increase in child fatalities butrather more accurate reporting of child fatalities.ServicesMany of the preventive services are delivered bynonprofit agencies that received State grants. Forthe <strong>2006</strong> funding cycle, the State’s goal was tonarrow the scope of service provision in an ef<strong>for</strong>tto target the biggest needs <strong>and</strong> increase the measurableoutcome in targeted service categories.Year-to-year changes are due to this focus <strong>and</strong>will continue to be notable in FFY 2007.NEW HAMPSHIRELorraine EllisProgram Analyst/Reporting CoordinatorBureau of In<strong>for</strong>mation SystemsNew Hampshire Department of Health <strong>and</strong> Human Services129 Pleasant StreetState Offce Park SouthConcord, NH 03301603–271–0837603–271–4729 Faxlorellis@dhhs.state.nh.usData File(s) Submitted<strong>Child</strong> File, Agency FileLevel of Evidence RequiredPreponderanceReportsThe number of screening <strong>and</strong> intake workersincludes 9 intake workers <strong>and</strong> 2 supervisors. Thenumber of investigation <strong>and</strong> assessment workersincludes 73 assessment workers <strong>and</strong> 2 workerswho specialize in investigating allegations ofabuse <strong>and</strong> neglect in out-of-home placements.This is a point-in-time snapshot taken duringSeptember <strong>2006</strong>.The investigation start date is defined as the datethe report is approved <strong>for</strong> assessment. Dates <strong>and</strong>days are the smallest units of time maintained inthe State’s system.156 <strong>Child</strong> <strong>Maltreatment</strong> <strong>2006</strong>
The State uses a tiered system of requiredresponse time, ranging from 24 to 72 hours,depending on level of risk at the time of thereferral. The average <strong>for</strong> all referrals is reportedto NCANDS.FatalitiesData <strong>for</strong> the Agency File were obtained from theDepartment of Justice. One fatality was includedin the <strong>Child</strong> File. The report was judged to befounded, due to other allegations in the report,however, the fatality itself was not found to becaused by abuse or neglect.ServicesThe State combines funding from PromotingSafe <strong>and</strong> Stable <strong>Families</strong> Program <strong>and</strong> the SocialServices Block Grant into a ComprehensiveFamily Support Services Program. The fundsare braided, so the families that receive servicesthrough the Comprehensive Family SupportServices Program are reported in both the PSSFP<strong>and</strong> SSGB areas. Community-Based Preventionof <strong>Child</strong> Abuse <strong>and</strong> Neglect data were providedby the New Hampshire <strong>Child</strong>ren’s Trust Fund.The NCANDS category “other” funding sources<strong>for</strong> preventive services includes New HampshireState Incentive Funds <strong>and</strong> Family ViolencePrevention <strong>and</strong> Services Act Grant.A Court Appointed Special Advocate (CASA) orother Guardian ad Litem (GAL) was appointed<strong>for</strong> approximately 70 percent of abuse orneglect cases during FFY <strong>2006</strong>. CASA of NewHampshire requires a CASA to visit the childrento whom they are appointed at least once permonth. The average number of contacts was 8.5.However, not all children were served by a CASA<strong>for</strong> all 12 months of the year. Some cases did notstart until part way through the year <strong>and</strong> othercases closed during the course of it. The agencydoes not collect data regarding the remaining 30percent of cases in which children are served bynon-CASA GALs.NEW JERSEYDonna PernaManagerIn<strong>for</strong>mation ProcessingOffce of In<strong>for</strong>mation ServicesDivision of Youth <strong>and</strong> Family ServicesNew Jersey Department of Human Services50 East State Street, 5th FloorTrenton, NJ 08625–0717609–292–4759609–292–8196 Faxdonna.perna@dcf.state.nj.usData File(s) Submitted<strong>Child</strong> File, Agency FileLevel of Evidence RequiredPreponderanceReportsThe Division of Youth <strong>and</strong> Family Servicesrequires all referrals to receive either an assessmentor a CPS investigation.As of April 1, 2005, the State offcially changedthe investigation or assessment findings from:■ Substantiated■ Unsubstantiated■ Unfoundedto:■ Substantiated■ UnfoundedThe State did not report FFY <strong>2006</strong> unfoundeddispositions to NCANDS <strong>and</strong> reported unsubstantiateddispositions <strong>for</strong> reports prior toApril 1, 2005. This change significantly reducedthe number of reports that were submitted toNCANDS during FFY <strong>2006</strong> from prior years.The legacy system does not maintain an investigationstart date other than the report date <strong>and</strong>the date the intake is <strong>for</strong>warded to a local offcefrom centralized screening.<strong>Child</strong>renDuring FFY <strong>2006</strong>, the number of victimsincreased about 20 percent. The number ofneglect victims increased 40 percent <strong>and</strong> thenumber of sexual abuse victims increased 19percent. The increase is likely due to a combinationof the addition of “risk” as a CPS allegationtype in July 2004 (these were previously recordedas “at risk,” which did not receive a CPS disposi-APPENDIX D: State Commentary 157
tion) <strong>and</strong> the removal of the “unsubstantiated”disposition in April 2005. The number of CPSreports, in general, increased due to the new CPS“risk” category <strong>and</strong> the number of CPS reportsthat were substantiated increased due to theremoval of the “unsubstantiated” finding.PerpetratorsThe legacy system currently does not assignunique IDs to perpetrators. The ID is uniquewithin the case <strong>and</strong> incident only.NEW MEXICORetta ProphetFACTS/Research & Evaluation ManagerNew Mexico Department of Protective Services<strong>Child</strong>ren, Youth & <strong>Families</strong> DepartmentP.O. Drawer 5160 (Room 252)Santa Fe, NM 87105505–476–1044505–827–8480 Faxretta.prophet@state.nm.usData File(s) Submitted<strong>Child</strong> FileLevel of Evidence RequiredCredibleWith the FFY <strong>2006</strong> NCANDS submission, theState modified mapping <strong>and</strong> coding to incorporatenew or modified Statewide Automated<strong>Child</strong> Welfare In<strong>for</strong>mation System (SACWIS)functionality, <strong>and</strong> to comply with new NCANDSFFY <strong>2006</strong> data submission instructions.ReportsThe SACWIS has been operational since 1997<strong>and</strong> achieved SACWIS Tier 1 Status (SACWISCompliance Achieved) on May 12, <strong>2006</strong>. TheNew Mexico SACWIS system (FACTS) is thedata source <strong>for</strong> all NCANDS child file data.Data submitted <strong>for</strong> FFY 2005 had a disproportionatelyhigh number of submitted reports. Thisresulted from the substantial ef<strong>for</strong>ts that weredirected toward clearing a backlog of pendinginvestigations. This ef<strong>for</strong>t began in November2004, with the largest impact seen during thelast 3 quarters of FFY 2005. This resulted in anapproximately 23 percent increase in reports <strong>for</strong>FFY 2005 (when compared to the resubmittedFFY 2004 data). When comparing FFY <strong>2006</strong> toFFY 2004, the number of reports increased by6 percent.Prior to <strong>2006</strong>, the State did not capture theinvestigation start date. A new user-enteredfield—date/time of initiation was implementedduring May <strong>2006</strong>. This field is a “required field”<strong>and</strong> is used to identify the actual date <strong>and</strong> timethat the investigation begins. This is defined inpolicy as the time when the investigation workerhas face-to-face contact with all alleged victimsin the report. The State is not able to reportincident date at this time.For the FFY <strong>2006</strong> data submission, the Statehas some errors related to invalid investigationstart date. The errors result primarily from 3conditions:■ Multiple reports can be linked to a singleinvestigation, but the investigation only hasone initiation date; thus, multiple reportslinked to a single investigation must use theinvestigation initiation date from the initialreport. The State is exploring an onlinesolution <strong>for</strong> this circumstance.■ Some reports are made to the statewide centralintake (SCI) after the county has initiatedan investigation. In these cases, the reporteris usually law en<strong>for</strong>cement or <strong>Child</strong>ren Youth<strong>and</strong> <strong>Families</strong> Department (CYFD) staff whoare already on the scene when allegations areidentified. Thus, because of quick <strong>and</strong> flexibleresponse by CYFD <strong>and</strong> law en<strong>for</strong>cement, theinvestigation date can actually precede theoffcial report date.■ FACTS occasionally goes into a “readonly” mode during a version upgrade ormaintenance cycle. After the completion ofthese activities, the actual reports are thenentered into FACTS, once the applicationhas come back on line. New functionalitywas implemented on 5/20/2007 to moreaccurately capture the actual date <strong>and</strong> timethe report was received, even during suchapplication outages.The NCANDS category “other” report sourceincludes “clergy,” “self,” “nonrelated,” “publicagency,” <strong>and</strong> “out-of-State Agency.”A screened-out report is a report that has notmet the criteria <strong>for</strong> “acceptance <strong>for</strong> investigation”[8.10.2.7 NMAC – Rp, 8.10.2.7 NMAC, 11/15/05].<strong>Child</strong>renThe State is not able to report the followingNCANDS fields: child-living arrangement,mental retardation-caregiver, visually or hearingimpaired-caregiver <strong>and</strong> learning disability158 <strong>Child</strong> <strong>Maltreatment</strong> <strong>2006</strong>
caregiver. The State does not report alternateresponse victim in<strong>for</strong>mation. All child protectiveservice (CPS) screened-in reports are addressedthrough a CPS investigation.The NCANDS category “other” maltreatmenttype includes “exploitation-extortion,” “exploitation-parasiticrelationship,” <strong>and</strong> “exploitationunexplaineddisappearance of funds.”From CPS Investigations administrative code8.10.3.7 NMAC – Rp, 8.10.3.7 NMAC, 6/15/06“’Substantiation’ in a child abuse <strong>and</strong>/or neglectinvestigation means the victim(s) is under theage of 18, a caretaker/provider has been identifiedas the perpetrator <strong>and</strong>/or identified as failing toprotect, <strong>and</strong> credible evidence exists to supportthe conclusion by the investigation worker thatthe child has been abused <strong>and</strong>/or neglected asdefined by the New Mexico <strong>Child</strong>ren’s Code.Credible evidence upon which to base a findingof substantiation includes:1. Caretaker admission;2. Physical facts/evidence;3. Collateral <strong>and</strong>/or witness statements/ observations;4. <strong>Child</strong> disclosure; <strong>and</strong>/or5. Investigation worker observation.”“’Unsubstantiated’ means that the in<strong>for</strong>mationcollected during the investigation does notsupport a finding that the child was abused <strong>and</strong>/or neglected.”The State modified coding <strong>for</strong> “alcohol abuse(child),” “drug abuse (child),” “alcohol abuse(caregiver),” <strong>and</strong> “drug abuse (caregiver)” toinclude generic substance abuse or polysubstanceabuse categories. This modification hadlittle effect on the data reported <strong>for</strong> child drug oralcohol abuse. However, caregiver alcohol abuseincreased from approximately 14 percent <strong>for</strong> FFY2005 to 61 percent <strong>for</strong> FFY <strong>2006</strong>. Caregiver drugabuse nearly doubled from 39 percent in FFY2005 to 65 percent in FFY <strong>2006</strong>.PerpetratorsThe NCANDS category “other” perpetratorrelationship includes “sibling’s guardian,”“nonrelative,” “foster sibling,” “referenceperson,” “conservator,” “caregiver,” <strong>and</strong> “surrogateparent.”A new field (alleged perpetrator relationship toalleged victim) was implemented May <strong>2006</strong> <strong>and</strong>is a required field. perpetrator relationship <strong>and</strong>perpetrator as parent are now coded from thisfield <strong>for</strong> all investigations completed from May<strong>2006</strong> <strong>for</strong>ward.New Mexico’s previous submissions incorrectlycoded unknown perpetrator age to “75” insteadof “99”, resulting in no unknown perpetrator agesbeing reported. The correction of this error <strong>for</strong>the FFY <strong>2006</strong> submission resulted in a significantincrease in the aggregate perpetrator count.The newest NCANDS guidance: If the child isnot under the care, placement or supervision ofthe child welfare agency, the State should codethe perpetrator relationship as 88 [other] insteadof 03, 04, 05, or 33 [foster parent relationshipcodes] was issued just prior to the State’s FFY<strong>2006</strong> submittal. This modification will be made<strong>for</strong> the FFY 2007 submittal.ServicesFor the FFY <strong>2006</strong> NCANDS submittal, the Statefine-tuned mapping <strong>for</strong> foster care services toinclude clients in care prior to the report dateif foster care services continued beyond theinvestigation completion date. There is a similarmodification to the field of Juvenile CourtPetition. In addition, the State narrowed thedefinition of legal actions that are mapped tojuvenile court petition.The State has seen an overall increase in numberof children entering foster care during theprevious 4 years, with the most dramatic increasebeing noted during FFY 2005. Methamphetamineuse <strong>and</strong> substance abuse in general, have beennoted as significant precipitators of entry into thechild welfare system. Other conditions which mayinfluence the number of children entering fostercare include economic factors <strong>and</strong> st<strong>and</strong>ardizationof the State’s intake screening tools.Economic stressors <strong>for</strong> families result in increasednumbers of children entering the child protectiveservice system. Clarification <strong>and</strong> st<strong>and</strong>ardizationof the screening tools also may be related to theincreased numbers in foster care.APPENDIX D: State Commentary 159
NEW YORKLillian DentonDirectorBureau of Management In<strong>for</strong>mationNew York State Offce of <strong>Child</strong>ren &Family Services52 Washington Street, Rm 313 SouthRensselaer, NY 12144–2796518–474–6947518–474–4208 Faxlillian.denton@dfa.state.ny.usData File(s) Submitted<strong>Child</strong> File, Agency FileLevel of Evidence RequiredCredibleReportsThere is no policy <strong>for</strong> screening out hotline calls.ServicesData elements <strong>for</strong> NCANDS services fields arenot supported completely by the State applicationat this time.NORTH CAROLINAJoann LammChiefFamily Support <strong>Child</strong> Welfare Services SectionDivision of Social ServicesNorth Carolina Department of Health <strong>and</strong>Human Services325 North Salisbury Street Mail Service Center2408Raleigh, NC 27699–2408919–733–9467919–733–6924 Faxjoann.lamm@ncmail.netData File(s) Submitted<strong>Child</strong> File, Agency FileLevel of Evidence RequiredPreponderanceNORTH DAKOTAMariah Tenamoc<strong>Child</strong>ren <strong>and</strong> Family ServicesNorth Dakota Department of Human Services600 East Boulevard, Dept. 325Bismarck, ND 58505701–328–8978701–308–3538 Faxsotenm@nd.govData File(s) Submitted<strong>Child</strong> File, Agency File, SDCLevel of Evidence RequiredSome credible evidenceGeneralThis is the State’s first <strong>Child</strong> File data submission,which includes data <strong>for</strong> victims only.ReportsThe child neglect <strong>and</strong> abuse law was amended in1995 to move from an incident-based investigationmethod to a service method in which assessmentsare made of child safety <strong>and</strong> future risk ofharm. The current emphasis is on what servicesare available to ameliorate any future risk. Thisapproach focuses on identifying <strong>and</strong> buildingon the family’s capacities <strong>and</strong> strengths. Uponcompletion of the assessment of the initial reportof child abuse or neglect, a decision must bemade whether services are required to provide<strong>for</strong> the protection <strong>and</strong> treatment of an abusedor neglected child. Reports in which determinationsare made that services are not required areexpunged from the database <strong>and</strong> are there<strong>for</strong>enot reported to NCANDS.<strong>Child</strong>renThe State uses dispositions of “servicesrequired” or “no services required.” The Statemaps “services required” dispositions to theNCANDS category of investigations or assessmentsin which the allegation of maltreatmentwas substantiated. The “no services required”dispositions are mapped to the NCANDScategory children <strong>for</strong> whom the allegation ofmaltreatment was not substantiated but are notreported in the <strong>Child</strong> File. It is estimated that5,284 children have allegations of maltreatmentthat were not substantiated.ServicesServices data are not reported in the <strong>Child</strong> File.160 <strong>Child</strong> <strong>Maltreatment</strong> <strong>2006</strong>
PerpetratorsThe State reports perpetrator relationships, butis unable to report incidences of child abuseor neglect in institutional settings in the <strong>Child</strong>File. This results in the underreporting of thesafety measure, absence of abuse or neglect infoster care.OHIOJulie WritCPS Program AdministratorBureau of Family ServicesOhio Department of Job <strong>and</strong> Family Services255 East Main Street, 3rd FloorColumbus, OH 43215614–752–1122wirtj01@odjfs.state.oh.usData File(s) Submitted<strong>Child</strong> File, Agency FileLevel of Evidence RequiredCredibleReportsThe NCANDS category “other” report sourceincludes “self (other than victim)” <strong>and</strong> “other.”Data on worker <strong>and</strong> supervisor are not reported.Data are incomplete due to current StatewideAutomated <strong>Child</strong> Welfare In<strong>for</strong>mation System(SACWIS) conversion activities. The median(rather than the mean) response time in hourswas reported in the Agency File.<strong>Child</strong>renThe State is not able to report child livingarrangement data is not available.PerpetratorsThe NCANDS category “other” perpetratorrelationship includes “foster child,” “privateout of home care participant,” “public out ofhome care participant,” “non-related adult,” <strong>and</strong>“non-related child.” Data are incomplete due tocurrent SACWIS conversion activities.ServicesThe reduction in number of children receivingservices funded by the Social Services BlockGrant was due to one county not submittingits report.OKLAHOMABill HindmanProgram AdministratorOklahoma Department of Human ServicesP.O. Box 25352Oklahoma City, OK 73125bill.hindman@okdhs.org405–522–1968405–521–4373 FaxData File(s) Submitted<strong>Child</strong> File, Agency FileLevel of Evidence RequiredCredibleReportsA report is screened-out if it meets the criterialisted below.■ The report received is not appropriate <strong>for</strong>child protective services if:■ The report clearly falls outside the definitionsof abuse <strong>and</strong> neglect;■ The victim is age 18 or older <strong>and</strong> not involuntary placement with the OklahomaDepartment of Human Services;■ The alleged perpetrator is not a personresponsible <strong>for</strong> the child;■ The in<strong>for</strong>mation to locate the family childis insuffcient; <strong>and</strong>■ The family is in need of assistance, butthere is no in<strong>for</strong>mation indicating thatabuse or neglect has occurred.■ The report received is duplicative of a previousreport■ An assessment is conducted when a report ofabuse or neglect does not indicate a serious<strong>and</strong> immediate threat to the child’s healthor safety. The assessment is a process ofdetermining the safety needs of the child<strong>and</strong> engaging the child’s family so thatfamily strengths can be enhanced <strong>and</strong> needsaddressed. <strong>Child</strong>ren who receive an assessmentare coded to the NCANDS categoryalternative response nonvictim.A Priority I investigation response time indicatesthat the child is in imminent danger of seriousphysical injury. These instances are respondedto within 24 hours after receipt of the report.A Priority II response time indicates that thereis no imminent danger of severe injury, butwithout intervention <strong>and</strong> safety measures it islikely the child will not be safe. These instancesAPPENDIX D: State Commentary 161
are responded to within 48 hours to 15 calendardays from the report acceptance date.The decrease in number of hours from reportto investigation during FFY <strong>2006</strong> reflects theelimination of Priority III investigation responsetime, as well as the increase of Priority II reportsbeing responded to within 15 days.<strong>Child</strong>renDuring previous reporting years, prior victimswere identified as alleged victims during thereporting year that had a previous substantiatedmaltreatment during the same reporting year.Starting with the FFY 2005 submission, priorvictims are identified as any alleged victimduring the reporting year who had a previoussubstantiated maltreatment anytime back to1995, the year the SACWIS system was implemented.FatalitiesThe State investigates all reports of child death<strong>and</strong> near death that may be related to abuseor neglect. Fatalities are not reported in theNCANDS file until the investigation <strong>and</strong> Stateoffce reviews are completed, which may takeup to 12 months. Duplicate fatalities may occurwhen a child attending an unlicensed childcarefacility dies <strong>and</strong> the abuse is confirmed tothe childcare facility <strong>and</strong> failure to protect isconfirmed to the parents. The State does notreport child fatalities in residential facilities asthese referrals are investigated by a separate unit<strong>and</strong> are not recorded in the SACWIS.PerpetratorsIn previous years, prior perpetrators wereidentified as perpetrators of substantiatedmaltreatments who had a previous substantiatedmaltreatment that occurred during the reportingyear. Starting with FFY 2005, prior perpetratorsare identified as perpetrators of a substantiatedmaltreatment within the reporting year whowere a perpetrator in a substantiated maltreatmentanytime back to 1995, the year the SACWISsystem was implemented.ServicesFor previous submissions, abuse in out-of-homecare was determined by perpetrator relationship.Reporting then shifted to the “out-of-home”referral designation. Programming nowexamines both fields to determine incidence ofchild abuse or neglect in foster care, which hasresulted in more accurate reporting. CPS programmanagers attribute the “out-of-home” careabuse rate to an overall increase in removals.OREGONMaria DuryeaManager, <strong>Child</strong> Welfare Research <strong>and</strong> ReportingOregon Department of Human Services/<strong>Child</strong>ren, Adults <strong>and</strong> <strong>Families</strong>500 Summer Street NE, E-69Salem, OR 97301503–945–6510503–373–7032 Faxmaria.duryea@state.or.usData File(s) Submitted<strong>Child</strong> File, Agency File, SDCLevel of Evidence RequiredReasonableReportsThis is the State’s first <strong>Child</strong> File data submission.The State does not collect child-level dataon nonvictims.<strong>Child</strong>renThe numbers of children with unsubstantiated<strong>and</strong> “other” dispositions were estimated. Thenumber of children with unsubstantiateddispositions is estimated to be 17,713. The numberof children with “other” dispositions is estimatedto be 10,605. The NCANDS category “other”maltreatment type includes “threat of harm.”The NCANDS category unknown sex includes“unborn.”ServicesThe State’s legacy system does not collect data onpreventive services.PerpetratorsThe State only provides data on perpetratorrelationships <strong>and</strong> demographics. Also, the Stateis not able to assign unique perpetrator IDs.162 <strong>Child</strong> <strong>Maltreatment</strong> <strong>2006</strong>
PENNSYLVANIAMelanie Rether<strong>for</strong>dHuman Services Program SpecialistOffce of <strong>Child</strong>ren, Youth <strong>and</strong> <strong>Families</strong>Pennsylvania Department of Public WelfarePO Box 2675Harrisburg, PA 17105717–214–7386717–346–9663 Faxmrether<strong>for</strong>@state.pa.usData File(s) Submitted<strong>Child</strong> File, Agency FileLevel of Evidence RequiredSubstantial evidence or clear <strong>and</strong> convincing/beyond reasonable doubt.GeneralThe State will receive funding through the <strong>Child</strong>Abuse <strong>and</strong> Neglect State Grant in 2007.Reports<strong>Child</strong> protective services investigations account<strong>for</strong> approximately 30 percent of the total reportsinvestigated or assessed by the child welfaresystem. State policy addresses neglect through ageneral protective services investigation ratherthan a child protective services investigation. Theneglect cases are not classified as child abuse.The definition of abuse includes “(i.) any recentact or failure to act by a perpetrator that causesnon-accidental serious physical injury to a childless than 18 years old; (ii.) an act or failure to actby a perpetrator that causes non-accidental seriousmental injury to or sexual abuse or sexualexploitation of a child less than 18 years old; (iii.)any act or failure to act or series of such acts orfailure to act by a perpetrator which creates animminent risk of serious physical injury to orsexual abuse or sexual exploitation of a child lessthan 18 years old; (iv.) serious physical neglect bya perpetrator constituting prolonged or repeatedlack of supervision or the failure to provide theessentials of life, including adequate medicalcare, which endangers a child’s life or developmentor impairs the child’s functioning.”The State has the following three levels of reportdisposition.■ Founded–A child abuse report with a judicialadjudication based on a finding that a childwho is a subject of the report has beenabused, including the entry of a plea of guiltyor nolo contendre or a finding of guilt to acriminal charge involving the same factualcircumstances involved in the allegation ofchild abuse.■ Indicated–A child abuse report in which it isdetermined that substantial evidence of thealleged abuse exists based on (a) availablemedical evidence, (b) the child protectiveservices investigation, or (c) an admission ofthe acts of abuse by the perpetrator.■ Unfounded–Any report that is not foundedor indicated. For NCANDS purposes,founded <strong>and</strong> indicated reports are substantiated<strong>and</strong> unfounded reports are unsubstantiated.■ Although response time is not reported atthe State level, Pennsylvania <strong>Child</strong> ProtectiveServices Law m<strong>and</strong>ates that upon receipt of areport of suspected child abuse, the investigatingagency shall immediately commencean appropriate investigation <strong>and</strong> see the childimmediately if emergency protective custodyis required or has been taken, or if it cannotbe determined from the report whetheremergency protective custody is needed.Otherwise, the investigating agency shallcommence an appropriate investigation <strong>and</strong>see the child within 24 hours of the receiptof the report. The county agency, which isresponsible <strong>for</strong> the investigation, documentsall contacts with the alleged victim.The State has a county administered childwelfare system in which some counties havecaseworkers who specialize in child protectiveservices investigations or assessments<strong>and</strong> other counties have generic caseworkerswho per<strong>for</strong>m other child welfare functions inaddition to investigations or assessments. Ourreported number of workers is the total numberof caseworkers per<strong>for</strong>ming any direct childwelfare function.<strong>Child</strong>renThe State is not permitted to retain in itsstatewide central register in<strong>for</strong>mation pertainingto the race <strong>and</strong> ethnicity of the subjects of a childabuse report. Imminent risk of physical <strong>and</strong>sexual abuse are included in the physical abuse<strong>and</strong> sexual abuse categories, respectively.PerpetratorsState law requires a perpetrator to be 14 years orolder.APPENDIX D: State Commentary 163
PUERTO RICOEvelyza Crespo RiveraAdministradora Auxiliar de Proteccion SocialPuerto Rico Department of the FamilyEdificio Sevilla Plaza, #58, Hato Rey PR 00917San Juan, PR00910–787–625–4900ecrespo@adfan.gobierno.prData File(s) Submitted<strong>Child</strong> File, Agency FileGeneralFFY <strong>2006</strong> is the first time the State has submitteda <strong>Child</strong> File <strong>and</strong> Agency File.RHODE ISLANDDavid R. AllensonProgrammer/Analyst II Reports <strong>and</strong>Data Analysis ManagerRhode Isl<strong>and</strong> Department of <strong>Child</strong>ren,Youth <strong>and</strong> <strong>Families</strong>101 Friendship Street—MIS Unit 5th Floor,Providence, RI 02903401–528–3864401–528–3922 Faxdavid.allenson@dcyf.ri.govData File(s) Submitted<strong>Child</strong> File, Agency FileLevel of Evidence RequiredPreponderanceReportsReports that contain the following four criteriaare investigated. A report that contains at leastone, but not all four criteria, is considered an“early warning report,” <strong>and</strong> is not investigated.■ The report must involve a child younger than18 years or younger than 21 years if living inDepartment of <strong>Child</strong>ren, Youth <strong>and</strong> <strong>Families</strong>(DCYF) foster or institutional care, or inDCYF custody regardless of placement.■ Harm or substantial risk of harm to the childis present.■ A specific incident or pattern of incidentssuggesting child abuse or neglect can beidentified.■ A person responsible <strong>for</strong> the child’s welfareor living in the same home has allegedlyabused or neglected the child. State statutedefines a person responsible <strong>for</strong> the child’swelfare as the child’s parent, guardian, fosterparent (relative or nonrelative), an employeeof a public or private residential homeor facility, or any staff person providingout-of-home care (out-of home care includesinclude family daycare, group daycare, <strong>and</strong>center-based daycare).■ Even though the Statewide Automated <strong>Child</strong>Welfare In<strong>for</strong>mation System (SACWIS) canlink to more than one report source perreport, only one person can be identified asthe person who actually makes the report.If more than one report is linked to aninvestigation, the first report source from thefirst report is reported to NCANDS in the<strong>Child</strong> File.The 20 percent increase in the number ofinvestigations from Federal fiscal year (FFY)2005 to FFY <strong>2006</strong> is due, in part, to a worseningsocial climate in the State.The number of screening, intake, <strong>and</strong> investigationor assessment workers was based upon apoint-in-time count of full-time equivalents(FTEs) <strong>for</strong> <strong>Child</strong> Protective Investigators <strong>and</strong><strong>Child</strong> Protective Supervisors who accept <strong>and</strong>investigate reports meeting the criteria <strong>for</strong> investigation<strong>and</strong> screening. The number of screening<strong>and</strong> intake workers is based upon a point-in-timecount of all FTEs <strong>for</strong> Social Caseworkers II<strong>and</strong> Social Caseworker Supervisors II who areresponsible <strong>for</strong> screening <strong>and</strong> intake.<strong>Child</strong>renThe NCANDS category “other” maltreatmenttype includes such institutional allegations as“corporal punishment,” “other institutionalabuse,” <strong>and</strong> “other institutional neglect.” During2004, there was a policy change <strong>for</strong> investigationsof foster children. In the past, all the fosterchildren in the home would be added as victimswith a substantiated allegation of neglect even ifthe incident did not pertain to them. The currentpolicy is that only the named victim has anallegation, <strong>and</strong> the facility or home is referred tothe Licensing Unit to look at licensing violationsrather than child abuse or neglect.ServicesThe court-appointed special advocate (CASA)organization provided the average number ofout-of-court contacts. This number representsthe contacts made by CASA volunteers <strong>and</strong> doesnot include Gardians-ad-Litem. Contact wasmade both in-person <strong>and</strong> via phone. The number164 <strong>Child</strong> <strong>Maltreatment</strong> <strong>2006</strong>
of families who received preventive servicesthrough the Community Based Grants <strong>for</strong> thePrevention of <strong>Child</strong> Abuse <strong>and</strong> Neglect includedsecondary or direct services.SOUTH CAROLINAJoanne L. Shekel<strong>Child</strong> Protective Services Program SpecialistOffce of Family Preservation <strong>and</strong> <strong>Child</strong> Welfare ServicesSouth Carolina Department of Social ServicesP.O. Box 1520Columbia, SC 29202–1520803–898–731803–898–7641 Faxjschaekel@dss.state.sc.usData File(s) Submitted<strong>Child</strong> File, Agency FileLevel of Evidence RequiredPreponderanceSOUTH DAKOTAJaime ReiffProgram Specialist<strong>Child</strong> Protection ServicesDepartment of Social Services700 Governors DrivePierre, South Dakota, 57501605–773–3227605–773–6834 Faxjaime.reiff@state.sd.usData Files Submitted<strong>Child</strong> File, Agency FileLevel of Evidence RequiredPreponderanceReportsThere are 107 CPS staff members in the field whocarry out the responsibility of intake, screening,<strong>and</strong> initial family assessments. South Dakota<strong>Child</strong> Protection Services has become morespecialized in intake <strong>and</strong> workers completingthe initial family assessments. Even some ofthe smaller offces are now assigning the initialfamily assessment process to be completed byspecific workers. The larger offces have specificInitial Family Assessment workers, includingIntake Specialists, Screeners, Supervisors, <strong>and</strong>Initial Family Assessment workers.The start date <strong>for</strong> an investigation is the datethe report was provided to an Intake Specialist.Initial contact with the victim is to be madein accordance with the Screening Guideline<strong>and</strong> Response Decision. The response decisionis related to whether the report in<strong>for</strong>mationis “immediate danger” (immediate response),“<strong>for</strong>eseeable danger” (within 3 calendar daysfrom the date of the report), “determined to berisk <strong>and</strong> child is 0–6 years old or cannot protectself” (within 7 calendar days from the date ofthe report), “risk <strong>and</strong> child is 7–18 years old <strong>and</strong>there is indication that the child can self-protect”(within 14 calendar days from the date of thereport) or “immediate or <strong>for</strong>eseeable danger orrisk <strong>and</strong> the perpetrator does not have accessto child.” A report is considered screened outif it does not meet the criteria in the ScreeningGuideline <strong>and</strong> Response Decision Tool asdescribed above. The Screening Guideline <strong>and</strong>Response Decision was implemented statewideJuly 1, 2004. The guideline has improved workers’response time <strong>and</strong> initial contact. The Stateimplemented a policy <strong>for</strong> timeframes related tosubmitting reports to supervisors or screeners.This also helped to improve the timeliness ofagency contact with child. These new policies<strong>and</strong> procedures were implemented in conjunctionwith the State’s Program Improvement Plan.The NCANDS category “other” report sourceincludes “clergy,” “community person,” “coroner,”“shelter employee or volunteer,” “funeraldirector,” “other State agency,” “public offcial,”<strong>and</strong> “tribal offcial.”<strong>Child</strong>renThe data include children who were victims ofsubstantiated reports of child abuse <strong>and</strong> neglectwhere the perpetrator is the parent, guardian, orcustodian.A policy regarding reports received regarding anew incident of maltreatment within 45 days of aprevious assigned report may be screened out as“screen out/initial family assessment pending.”The findings from this report are included onthe disposition findings on the first report as“additional findings.” The policy also includesa report received on the same incident as theprevious assigned report, which can be screenedout <strong>and</strong> it is marked as a duplicate report inthe Statewide <strong>Child</strong> Welfare In<strong>for</strong>mationSystem (SACWIS). This policy affected the totalinvestigations assigned.APPENDIX D: State Commentary 165
To substantiate an allegation, the social workermust decide that it is more likely than not thatchild abuse or neglect occurred—a preponderanceof the evidence. There must also be anapplication of one or more of the subsections ofthe State statute definition of child abuse <strong>and</strong>neglect. The statute definitions are as follows:■ Whose parent, guardian, or custodian hasab<strong>and</strong>oned the child or has subjected thechild to mistreatment or abuse;■ Who lacks proper parental care through theactions or omissions of the parent, guardian,or custodian;■ Whose environment is injurious to hiswelfare;■ Whose parent, guardian, or custodian failsor refuses to provide proper or necessarysubsistence, supervision, education, medicalcare, or any other care necessary <strong>for</strong> hishealth, guidance, or well-being;■ Who is homeless, without proper care, ornot domiciled with his parent, guardian, orcustodian through no fault of his parent,guardian, or custodian;■ Who is threatened with substantial harm;■ Who has sustained emotional harm ormental injury as indicated by an injury tohis intellectual or psychological capacityevidenced by an observable <strong>and</strong> substantialimpairment in his ability to function withinhis normal range of per<strong>for</strong>mance <strong>and</strong>behavior, with due regard to his culture;■ Who is subject to sexual abuse, sexualmolestation, or sexual exploitation by hisparent, guardian, custodian or any otherperson responsible <strong>for</strong> his care;■ Who was subject to prenatal exposure toabusive use of alcohol or any controlled drugor substance not lawfully prescribed by apractitioner as authorized by chapters 22–42<strong>and</strong> 34–20 B; <strong>and</strong>■ Whose parent, guardian, or custodian knowinglyexposes the child to an environmentthat is being used <strong>for</strong> the manufacture, use,or distribution of methamphetamine or anyother unlawfully manufactured controlleddrug or substance.■ The State resubmitted its FFY 2005 <strong>Child</strong> Fileto NCANDS. This resubmission increasedthe number of children with the closed withno finding disposition. Cases are determinedclosed with no finding if staff were unable tomake contact <strong>for</strong> an assigned investigation.FatalitiesA child fatality is defined as a child who dieddue to substantiated child abuse <strong>and</strong> neglect bya parent, guardian, or custodian. The numberof fatalities reported each year includes thosevictims involved in a report disposed during thereport period, even if their date of death mayhave actually been in the previous year.PerpetratorsA perpetrator of child abuse <strong>and</strong> neglect isdefined as a parent, guardian, or custodian. TheState SACWIS designates one perpetrator perchild per allegation.ServicesThe Agency File data include services providedto children <strong>and</strong> families where funds were usedfrom the Community Based Family Resource<strong>and</strong> Support Grant. This primarily includesindividuals who benefited from parentingeducation classes.TENNESSEELance GriffnTennessee Department of <strong>Child</strong>ren’s ServicesCordell Hull Bldg.436 Sixth Ave NorthNashville, TN 37243615–532–7887lance.griffn@state.tn.usData File(s) Submitted<strong>Child</strong> File, Agency FileLevel of Evidence RequiredMaterial Evidence166 <strong>Child</strong> <strong>Maltreatment</strong> <strong>2006</strong>
TEXASDeborah WashingtonSystem AnalystIn<strong>for</strong>mation <strong>and</strong> TechnologyTexas Department of Family <strong>and</strong> Protective Services2323 Ridgepoint Dr.Austin, TX 78754Agency Mail Code: Y960P. O. Box 149030Austin, TX 78714–9030512–929–6762512–339–5816 Faxdeborah.washington@dfps.state.tx.usData File(s) Submitted<strong>Child</strong> File, Agency FileLevel of Evidence RequiredPreponderanceReportsThe State schema regarding disposition hierarchydiffers from the NCANDS dispositionhierarchy. The State has “other” <strong>and</strong> closed withno finding codes as superseding unsubstantiatedat the report level. This hierarchy is based on theprinciple that the two ends of the dispositionspectrum are “founded” <strong>and</strong> “unfounded,” withall else in the middle. NCANDS takes a slightlydifferent view that the two “sure” points are“founded” <strong>and</strong> “unfounded” <strong>and</strong> everything elseis less than either of these two points.The State’s hierarchy <strong>for</strong> disposition is, fromhighest to lowest, “RTB-reason to believe,”“UTD-unable to determine,” “UTC-unableto complete,” <strong>and</strong> “R/O-ruled out.” Mapping<strong>for</strong> NCANDS reporting is: RTB=01, UTD=88,UTC=07, <strong>and</strong> R/O=05. Analysis on samplecases from the report disposition hierarchyreport revealed that this inconsistency occurs<strong>for</strong> investigations where an alleged victim hasmultiple maltreatment allegations <strong>and</strong> onehas a disposition of UTD while the other has amaltreatment disposition of R/O. According tothe State’s hierarchy, the overall disposition <strong>for</strong>these investigations is UTD. Mapping the reportdisposition to unsubstantiated as indicated inNCANDS’s report disposition hierarchy reportwould be inconsistent with the State’s policy.There is no child protective services programor State requirement to capture incident dateso there is no data field in the SACWIS <strong>for</strong> thisin<strong>for</strong>mation.New intake training focused on clear explanationsof confidentiality to the reporters ofsuspected child maltreatment. This resulted inan increase of individuals willing to identifythemselves <strong>and</strong> led to a decrease in the number ofanonymous report sources. Also, a State reviewof the NCANDS data found a 4 percent increaseof unknown from FFY 2005 (15,327) to FFY <strong>2006</strong>(15,982). Another factor <strong>for</strong> the decrease in anonymousreport category is a 42 percent increase inInternet reports from FFY 2005 (53,959) to FFY<strong>2006</strong> (76,756). Individuals making reports via theInternet are not anonymous.<strong>Child</strong>renAn increase of 8.6 percent <strong>for</strong> substantiatedreports corresponds with an 11.5 percent increasein the number of victims from FFY 2005 to FFY<strong>2006</strong>. All races or ethnicities, with the exceptionof American Indian, had increases similar to theincrease in African-American counts.FatalitiesThe increase in nonfacility fatalities may be due, inpart, to CPS having established a closer relationshipwith law en<strong>for</strong>cement. Cases not <strong>for</strong>merlybrought to the attention of CPS, are now beingexamined <strong>for</strong> issues of child abuse or neglectScreeners were added to CPS staff duringFFY <strong>2006</strong> to screen cases prior to referral <strong>for</strong>investigation. This, coupled with an 8.6 percentincrease in substantiated reports together withthe ratio of substantiated reports being up 0.4percent from FFY 2005 to FFY <strong>2006</strong> contributesto the 16.5 percent increase in victims of neglect.Many of the risk factors are determined basedon conditions that must be clinically diagnosedbe<strong>for</strong>e being entered into the State’s in<strong>for</strong>mationsystem as characteristics <strong>for</strong> an individual. Duringthe course of an investigation, it is generallynot known if an individual has been diagnosedwith specific conditions <strong>and</strong> there<strong>for</strong>e, mostoften no characteristics are entered. The Statebelieves the NCANDS data are an accuratedepiction of data based on what is availableduring the investigation.PerpetratorsThe 12.9 percent increase in perpetrators is due,in part, to the increase in substantiated reports.While the number of perpetrators with an “undetermined”race increased from FFY 2005 to FFY<strong>2006</strong>, the ratio remained relatively constant (FFY2005 2.1% to FFY <strong>2006</strong> 2.8%) when compared withthe overall number of perpetrators.APPENDIX D: State Commentary 167
UTAHNavina ForsytheSupervisor Data & Research Unit,SAFE HelpdeskDivision of <strong>Child</strong> <strong>and</strong> Family Services120 North 200 West #225Salt Lake City, UT 84103801–538–4045801–538–3993 Faxn<strong>for</strong>sythe@utah.govData File(s) Submitted<strong>Child</strong> File, Agency FileLevel of Evidence RequiredReasonableReportsDuring 2004, the State initiated an alternativeresponse pilot program <strong>for</strong> minor cases of childwitnesses of domestic violence. This programchange increased the number of alternativeresponse children <strong>and</strong> decreased the number ofemotional maltreatment cases.The investigation start date is defined as the datea child is first seen by CPS. If this is not possible,the State records the date CPS initially contactedany party who could provide in<strong>for</strong>mationessential to the investigation or assessment as theinvestigation start date. The data are captured indate, hours, <strong>and</strong> minutes.A referral is screened out in situations including,but not limited to, any of the following:■ The minimum required in<strong>for</strong>mation <strong>for</strong> accepting a referral is not available;■ As a result of research, the in<strong>for</strong>mation isfound not credible or reliable;■ The specific incidence or allegation has beenpreviously investigated <strong>and</strong> no new in<strong>for</strong>mationis gathered;■ If all the in<strong>for</strong>mation provided by the referentwere found to be true <strong>and</strong> the case findingwould still be unsupported; or■ The specific allegation is under investigation,<strong>and</strong> no new in<strong>for</strong>mation is gathered.■ <strong>Child</strong>renrepresents approximately 30 percent of allsubstantiated cases. This category is mapped toemotional abuse in NCANDS, which accounts<strong>for</strong> the large volume of emotional abuse in theState’s data submission.The State uses the following findings: “Supported”a finding, based on the in<strong>for</strong>mationavailable to the worker at the end of theinvestigation, that there is a reasonable basisto conclude that abuse, neglect, or dependencyoccurred, <strong>and</strong> that the identified perpetratoris responsible. “Unsupported” a finding basedon the in<strong>for</strong>mation available to the workerat the end of the investigation that there wasinsuffcient in<strong>for</strong>mation to conclude that abuse,neglect, or dependency occurred. A finding ofunsupported means that the worker was unableto make a positive determination that the allegationwas actually without merit. “Without Merit”an affrmative finding at the completion of theinvestigation that the alleged abuse, neglect, ordependency did not occur, or that the allegedperpetrator was not responsible. “Unable toLocate” a category indicating that even thoughthe <strong>Child</strong> <strong>and</strong> Family Services <strong>Child</strong> ProtectiveServices worker has followed the steps outlinedin <strong>Child</strong> <strong>and</strong> Family services practice guideline<strong>and</strong> has made reasonable ef<strong>for</strong>ts, the <strong>Child</strong> <strong>and</strong>Family Services <strong>Child</strong> Protective Services workerhas been unable to make face-to-face contactwith the alleged victims to investigate an allegationof abuse, neglect, or dependency <strong>and</strong> tomake a determination of whether the allegationshould be classified as supported, nonsupported,or without merit.FatalitiesAll maltreatment fatalities, which are reported toCPS, are included in the <strong>Child</strong> File.ServicesPostinvestigation services include those servicesprovided by the division or resulting fromconnections <strong>and</strong> referrals to community servicesthat were set up <strong>for</strong> the family.State law defines domestic violence in the presence of a child as abuse. This allegation 168 <strong>Child</strong> <strong>Maltreatment</strong> <strong>2006</strong>
VERMONTRichard DiMatteoSystems Developer IIIIn<strong>for</strong>mation TechnologyDepartment <strong>for</strong> <strong>Child</strong>ren <strong>and</strong> <strong>Families</strong>Vermont Agency of Human Services103 South Main StreetWaterbury, VT 05671–2401802–241–2107rdimatteo@srs.state.vt.usData File(s) Submitted<strong>Child</strong> File, Agency FileLevel of Evidence RequiredReasonableReportsThe Family Services Division of the VermontDepartment <strong>for</strong> <strong>Child</strong>ren <strong>and</strong> <strong>Families</strong> isresponsible <strong>for</strong> investigating allegations of childabuse or neglect by caretakers <strong>and</strong> sexual abuseby any person. The department investigates “riskof physical harm” <strong>and</strong> “risk of sexual abuse.”PerpetratorsThe State collects both relative <strong>and</strong> nonrelativefoster parent in<strong>for</strong>mation as it relates to theplacement of children. For abuse in<strong>for</strong>mation,however, there is an option of foster home orrelative, but not relative foster home. If a relativefoster parent was the perpetrator, the systemwould capture that as “other relative.”ServicesThe number of recipients of “other” preventiveservices is a duplicated count of recipients of atrisk childcare, intensive family-based services,<strong>and</strong> parent education programs.VIRGINIAJohn VaughnSenior Policy AnalystDivision of Family ServicesVirginia Department of Social Services7 North Eighth Street, 4th floorRichmond, VA 23219804–726–7645804–726–7895john.vaughn@dss.virginia.govData File(s) Submitted<strong>Child</strong> File, Agency FileLevel of Evidence RequiredPreponderanceWASHINGTONCynthia EllingsonProgram Manager<strong>Child</strong>ren’s <strong>Administration</strong>Washington Department of Social <strong>and</strong> HealthServicesP.O. Box 4571014th <strong>and</strong> Jefferson Street, OB–2Olympia, WA 98504–5710360–902–7929360–902–7903 Faxelcy300@dshs.wa.govData File(s) Submitted<strong>Child</strong> File, Agency FileLevel of Evidence RequiredPreponderanceReportsA referral could be screened out <strong>for</strong> the followingreasons: the child could not be located, the allegedsubject was not a caretaker, or the allegation ofchild abuse <strong>and</strong> neglect did not meet the State’slegal definition. Of the Federal FFY <strong>2006</strong> referralsthat were screened in, some were assessed asneeding a “high st<strong>and</strong>ard of investigation” (faceto-facecontact with the victim) <strong>and</strong> some wereassessed as “families in need of services.”Dispositions of referrals are reported based onfindings of the alleged victims reported in “highst<strong>and</strong>ard of investigation” referrals. A reportis substantiated if any alleged victim with anychild abuse or neglect was founded; the referralis reported unsubstantiated if all alleged childabuse or neglect was unfounded. The NCANDScategory “other” disposition includes the numberof reports that resulted in inconclusive investigations.Referrals that have been determined to beof low risk are reported as alternative responsenonvictim. During September 2005, there was asystem change that defaults low-risk referrals toalternative response, which caused an increase inthe number of alternative response referrals.<strong>Child</strong>renDispositions of the alleged victims reported in“high st<strong>and</strong>ard of investigation” referrals arebased on findings. An alleged victim is substantiatedif any of the alleged child abuse or neglectwas founded; the alleged victim is reported asunsubstantiated if all alleged child abuse orneglect identified was unfounded. The NCANDScategory “other” dispositions includes the numberof children in inconclusive investigations.APPENDIX D: State Commentary 169
FatalitiesThe State previously counted only those childfatalities where the medical examiner or coronerruled the manner of death was a homicide. During<strong>2006</strong>, the State began counting those childfatalities that were determined to be the result ofabuse or neglect by a medical examiner or coroneror if there was a CPS finding of abuse or neglect.Services<strong>Families</strong> received preventive services from thefollowing sources: Community Networks, CPS<strong>Child</strong> Care, Family Reconciliation Services,Family Preservation, <strong>and</strong> Intensive FamilyPreservation Services. The number of recipientsof the Community-Based Family Resource<strong>and</strong> Support Grant is estimated from severalcommunity programs.The Department opens a case <strong>for</strong> services at thetime a CPS referral is screened-in. The automatedin<strong>for</strong>mation system does not distinguish betweenservices provided <strong>for</strong> the purpose of the investigation<strong>and</strong> services during the investigation, whichare <strong>for</strong> the purpose of supporting the family orreducing the risk present in the family. By policy,investigations are to be completed within 90days of the referral. On average, court-appointedrepresentatives spent 38 hours with a client.WEST VIRGINIAMary HodgeDepartment of Health <strong>and</strong> Human Resources350 Capital StreetCharleston, WV 25301304-558-5856Maryhodge@wvdhhr.orgData File(s) Submitted<strong>Child</strong>file, Agency fileLevel of Evidence RequiredPreponderanceWISCONSINJohn TuohyDirectorOffce of Policy, Evaluation, <strong>and</strong> PlanningWisconsin Department of Health <strong>and</strong> Family Services1 West Wilson Street, Room 550Madison, WI 53703Data File(s) Submitted<strong>Child</strong> File, Agency FileLevel of Evidence RequiredPreponderanceReportsThe State data is child-based where each reportis associated with a single child. The report daterefers to the date when the agency was notified ofthe alleged maltreatment <strong>and</strong> the investigationbegin date refers to the date when the agencymade initial contact with the child or othermember of the family. Screened-out reports arethose reports where the in<strong>for</strong>mation provideddoes not constitute potential maltreatment of achild or risk of maltreatment of a child.The NCANDS category “other” maltreatmenttype includes those instances where the childwas not alleged or found to have been maltreated,but was alleged or found to be at riskof maltreatment.<strong>Child</strong>renA child is considered to be a victim when an allegationis substantiated or when the child is foundto be at risk of maltreatment. The NCANDScategory “other” disposition <strong>for</strong> alleged victimsincludes children who are subjects of reportswith a disposition where the critical sourcesof in<strong>for</strong>mation cannot be found or accessedto determine whether or not maltreatment asalleged occurred.PerpetratorsPerpetrator detail is included <strong>for</strong> allegationswhere the child was substantiated or found to beat risk of maltreatment. The NCANDS category“other” perpetrator relationship includesperpetrators who are not primary or secondarycaregivers to the child, such as another child ora peer to the child victim, school personnel, astranger, or a family friend.170 <strong>Child</strong> <strong>Maltreatment</strong> <strong>2006</strong>
FatalitiesThe count of fatalities includes only thosechildren who died <strong>and</strong> were subjects of reportsof abuse or neglect in which the maltreatmentallegation was substantiated.WYOMINGDebra HibbardCPS ConsultantWyoming Department of Family Services130 Hobbs AveCheyenne, WY 82009(307) 777–5479Fax: (307) 777–3693dhibba@state.wy.usData File(s) Submitted<strong>Child</strong> File, Agency FileLevel of Evidence RequiredCredibleReportsThe State uses first face-to-face contact with analleged child victim to determine incident date.The date the report is made to the offce is usedto determine the actual date. Dates <strong>and</strong> numberof days are the smallest units of time measurekept by the State’s data system. When the dataare entered <strong>and</strong> as the case is made into anincident that becomes the incident start date.An increase in child protection reports is dueto community people becoming more awareof the issues <strong>and</strong> child protection needs <strong>and</strong>because some services providers are currentlyaware that State law prohibits them from beingreprim<strong>and</strong>ed <strong>for</strong> sharing allegations of abuseto the Department. There also was an increaseof medical personnel inquiring about HealthInsurance Portability <strong>and</strong> Accountability Act(HIPAA) violations versus m<strong>and</strong>atory reporting.<strong>Child</strong>renGovernor Dave Freudenthal <strong>and</strong> the First LadyNancy Freudenthal developed <strong>and</strong> promotedseveral initiatives <strong>for</strong> the safety of children<strong>and</strong> families. In the last 2–3 years, they havepromoted the “<strong>Child</strong>ren <strong>and</strong> <strong>Families</strong> Initiative,”which is one of the most significant actionsbeing taken to assure a positive future <strong>for</strong> thefamilies who will live in <strong>and</strong> lead this State inthe coming years. For more than 2 years a groupof citizens, parents, teachers <strong>and</strong> many othershave discussed the needs of families <strong>and</strong> theirchildren.The First Lady has also promoted the “WyomingFirst Lady’s Family Night” event that startedSept. 26, 2005 <strong>and</strong> she has advocated occurringevery Monday night amongst families. Churches,community sites, <strong>and</strong> schools helped bring themessage that eating together as a family createsstrong bonds that can help both parents <strong>and</strong>teens through tough times. Studies have shownthat frequent family dinners are associated witha decreased risk of teenagers smoking, drinking<strong>and</strong> using illegal drugs. Another initiative fromthe First Lady is her “Underage Drinking Initiative”which is a collective responsible to keepchildren safe <strong>and</strong> sober. The particular focus ison the 9–15 age group.The other major initiative across the State ofWyoming is the Methamphetamine Initiative,which includes developing <strong>and</strong> eventuallyimplementing a long-term residential treatmentfacility, establishing <strong>and</strong> supporting intensiveoutpatient drug supervision programs, creating<strong>and</strong> distributing in<strong>for</strong>mation <strong>for</strong> parents <strong>and</strong>addicts about available resources <strong>for</strong> addicts,developing a specialized foster care program <strong>for</strong>mothers in need of treatment <strong>for</strong> methamphetamine<strong>and</strong> other drug addictions..The State has had an increase in child protectionreports <strong>and</strong> investigations because peoplehave become more aware of issues <strong>and</strong> childprotection needs. The FFY <strong>2006</strong> data also showan increase in alternative responses by theDepartment because some of the CPS allegationsdon’t rise to the level of an investigationper State statutes <strong>and</strong> Department of FamilyServices <strong>Child</strong> Protection Rules <strong>and</strong> policies.The Prevention <strong>and</strong> Assessment Track responsesoffer services <strong>for</strong> the family but will not a victimor perpetrator because the allegations do nothave a finding or rise to a level of a finding.APPENDIX D: State Commentary 171
172 <strong>Child</strong> <strong>Maltreatment</strong> <strong>2006</strong>
Reader FeedbackAPPENDIX ELET US KNOW WHAT YOU THINK!This <strong>for</strong>m is provided <strong>for</strong> the reader in case you would like to share your thoughts with usabout <strong>Child</strong> <strong>Maltreatment</strong> <strong>2006</strong>. Your feedback will help us meet your needs more effectivelyin the future.1. On a scale of 1–5 (1 = not effective, 5 = very effective), how would you rate the report<strong>for</strong> the following characteristics?a. Content 1 2 3 4 5b. Format 1 2 3 4 5c. Usefulness 1 2 3 4 52. Please list the five tables that you would consider the most useful.3. What additional child abuse <strong>and</strong> neglect topics would you like to be included in the report?4. How will you use NCANDS data <strong>for</strong> future research?5. If you have used NCANDS data in your research, would you share your results with us?Provide us with your name, address, <strong>and</strong> research topic so that we may contact you.6. Have you accessed previous copies of this report on the <strong>Child</strong>ren’s Bureau Web site?■ Yes ■ NoPlease mail or fax this <strong>for</strong>m so that your opinions can help shape future <strong>Child</strong> <strong>Maltreatment</strong> reports.MailFaxJohn A. Gaudiosi, DBAattn: John A. Gaudiosi, DBAMathematical Statistician re: <strong>Child</strong> <strong>Maltreatment</strong> <strong>2006</strong><strong>Child</strong>ren’s Bureau (202) 401–59171250 Maryl<strong>and</strong> Avenue, SW, 8th FloorWashington, DC 20024E-mailjohn.gaudiosi@acf.hhs.gov✃APPENDIX E: Reader Feedback 173
Dr. John A. GaudiosiMathematical Statistician<strong>Child</strong>ren’s Bureau1250 Maryl<strong>and</strong> Avenue, SW8th FloorWashington, DC 20024PLACE POSTAGE HERE