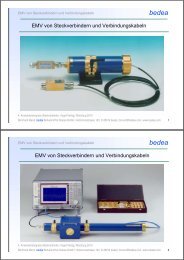
Triaxial Cell - Bedea Berkenhoff & Drebes GmbH
Triaxial Cell - Bedea Berkenhoff & Drebes GmbH
Triaxial Cell - Bedea Berkenhoff & Drebes GmbH

Create successful ePaper yourself
Turn your PDF publications into a flip-book with our unique Google optimized e-Paper software.
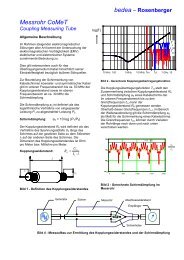
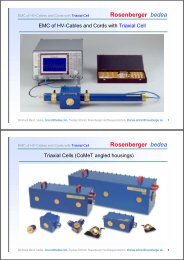
Measuring the EMC of HV-cables and components with the"<strong>Triaxial</strong> <strong>Cell</strong>"Bernhard Mund,bedea <strong>Berkenhoff</strong> & <strong>Drebes</strong> <strong>GmbH</strong>,Herbornerstraße 100,D-35614 Asslar, Germany,bmund@bedea.comThomas Schmid,Rosenberger HF-Technik,Hauptstraße 1D-83413 Fridolfingthomas.schmid@rosenberger.deSummary and IntroductionThe triaxial test method for measuring transfer impedance and shielding effectiveness was originallydesigned for communications cables. Meanwhile, also for power lines and for high-voltage cables (HVcables)for electric vehicles the measurement of the shielding effectiveness is required.The mechanical dimensions of power lines and lines and components for electric vehicles aregenerally larger than typical dimensions of cables and components for telecommunications.To measure the EMC of those larger elements, the <strong>Triaxial</strong> test method has been expanded by the"<strong>Triaxial</strong> <strong>Cell</strong>".In addition to the larger dimensions also impedances of power lines differ from the impedances ofcommunication cables. While communications cables usually have standardized characteristicimpedances of 50 Ohm or 75 Ohm, the impedances of power lines and HV cables for electric vehiclesare in the range of about 10 to 12 ohms. Depending on whether it is measured by short circuit or bymatched conditions, interactions may be applied to the system which can significantly disturb themeasurement. This consideration applies to measurements in the tube as well as in the <strong>Triaxial</strong> cell.The following report describes the capabilities of the <strong>Triaxial</strong> cell. Measurements with the cell arepresented and discussed. The question of whether and when transfer impedance can be measuredwith or without matching is examined and a new test method "unmatch-match-short" for measuring thetransfer impedance is presented.Principle of the triaxial test procedureWith the triaxial test-set up, one can measure both, the transfer impedance at the lower frequencyrange as well as the screening attenuation at higher frequencies.The test set-up consists of a network analyser (or alternatively a discrete signal generator and aselective measuring receiver) and a tube with terminations to the cable screen and the networkanalyser or receiver. The material of the tube shall be well conductive and non-ferromagnetic, forexample brass or aluminium.The cable under test (CUT), which is centred in the middle of the tube, forms together with the tube atriaxial system (fig. 1). The inner system is the CUT itself and the outer system is formed by the screenunder test and the tube.- 1 -
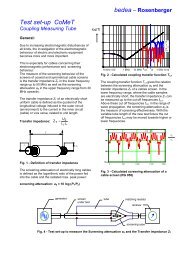
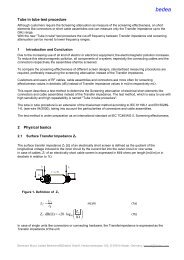
matching resistorreceivertubegeneratorscreening capscreen under testFigure 1a – Principle test set-up to measure transfer impedance and screeningattenuationThe CUT is terminated with its characteristic impedance at the far end (fig. 1).The screen under test is short circuited with the tube at the near end of the generator. Due to thisshort circuit, the influence of capacitive parts is excluded.A generator with the voltage U 1 feeds the inner system. The voltage U 2 is measured with a measuringreceiver with an input impedance equal to the characteristic impedance of the tube (50 Ohm).Z 2Z 1U 2 , P 2 ZTZ 2Z 1U 1 , P 1Z 1Figure 1b – Equivalent circuit of the principle test set-up in figure 1The energy, which couples through the weak screen travels into both directions of the tuberespectively the outer system. At the short circuit at the near end side of the generator, the wave istotally reflected, so that the receiver measures the complete energy that couples through the screen.At the low frequency range, the transfer impedance Z T may be calculated from the voltage ratio U 2 /U 1 :Z ⋅ l ≈ Z ⋅ U T 1U21if Z T
a s⎛= 20 ⎜U⋅ log⎝ U21max⎞ ⎛⎟2⋅+ 10⋅log⎜⎠ ⎝ ZZ s1⎞⎟⎠(3)where Z1 is the characteristic impedance of the device under test and the characteristic impedance ofthe outer system is 150 Ω. The measure of the screeningattenuation is the measured max. value.Coupling transfer functionDepending on the length of the device under test and the frequency, the t screeningg effectiveness isdivided into the transfer impedance and the screening attenuation. The coupling transfer function infigure 2 shows the transfer impedance Z T andd the screening attenuation a S of a cable screen vs.frequency.With the <strong>Triaxial</strong> procedure, the transfer t impedance Z T and the screening attenuation a S can bemeasured in one test set-up.Transfer impedancescreening attenuationf max x-ZTundefinedrangef min-asFigure 2 – Measured Coupling transfer function of a braided screen vs. frequency with the t<strong>Triaxial</strong> cellIn the DCrange respectively at very low frequencies, the transfer impedance of a braided screen isequal to the DC resistance. In therange of about 1 MHz to 10 MHz, the value of the transferimpedance drops down to lower values (at optimized braids) and increases then with about 20dB perdecade towards higher frequencies.The coupling transfer function T n ,f gives the relation between the screening attenuation a S andthetransfer impedance Z T of a cables screen. In the lower frequency range, where thee cable samples areelectrically short, thetransfer impedance Z T can be measured up to the cut off frequencies f cn, f . Above- 3 -
these cut off frequencies f cn,f in the range of wave propagation, the screening attenuation a S is themeasure of screening effectiveness. The cut off frequencies f cn,f may be moved towards higher orlower frequencies by variable length of the cable under test.The upper cut off frequency f max-ZT for measuring the transfer impedance is given by:fmax−ZT≤50⋅10r16ε ⋅ Lc(4)The lower cut off frequency f min-as for measuring the screening attenuation according to EN 50289-1-6is given by:c0fmin−as≥(5)2⋅εr1− εr2⋅ Lcwhere:c 0ε r1ε r2L cvelocity of light in free spacerelative dielectric constant of the inner systemrelative dielectric constant of the outer systemcoupling lengthFigure 2 shows the cut-off frequencies of the transfer impedance Z T and of the screening attenuationa S according to EN 50289-1-6. For a cable of 1 m length and a relative dielectric constant of the innersystem ε r of 2,28 we obtain an undefined range or a “grey zone” in the frequency range from about 30MHz to about 300 MHz, although this frequency range is of specific interest for different services.In principle, the undefined range could be covered by varying the length of the device under test. Butvarying the length of the device under test is not always desired or impossible in case of DUTs withfixed length e.g. in case of cable assemblies.Hence it should be discussed how the coupling transfer function could be the measure for thescreening effectiveness, including transfer impedance and screening attenuation.IEC TC 46/WG 5 revises IEC 62153-4-7, Transfer impedance and of screening attenuation ofconnectors and cable assemblies with the <strong>Triaxial</strong> test procedure. During this revision, it should bediscussed to introduce the coupling transfer function as shown in figure 2. The length of the test set-upcould be fixed to 1 meter. The value of the minimum of the screening attenuation at f min-as could beextended to f max-ZT and is from here the measure of the screening attenuation. With this extension, thescreening effectiveness, consisting of transfer impedance and screening attenuation is explicitlydescribed over the complete frequency range.Furthermore, with the new procedure of IEC 62153-4-3 Ed.2 described below, the cut off frequencyf max-ZT of the transfer impedance can be moved towards higher frequencies and the undefined rangecan be reduced.To compare different devices and for qualification purposes the proposed application of the couplingtransfer function is useful in any case.- 4 -
<strong>Triaxial</strong> <strong>Cell</strong>Larger connectors and cable assemblies do not fit into the commercial available test rigs of the <strong>Triaxial</strong>test procedure which have been designed originally to measure transfer impedance and screeningattenuation on communication cables, connectors and assemblies.In cooperation with bedea and Rosenberger the “<strong>Triaxial</strong> <strong>Cell</strong>” was designed to test larger devices andassemblies, especially for the HV cables and components for electromotive vehicles. The principles ofthe <strong>Triaxial</strong> test procedures can be transferred to rectangular housings. Tubes and rectangularhousings can be operated in combination in one test rig. The screening effectiveness of largerconnectors or devices can be measured in the tube as well as in the <strong>Triaxial</strong> <strong>Cell</strong>. Test results of tubeand cell measurements corresponds well.Figure 3 – Measuring of transfer impedance and screening attenuation of connectors andassemblies with <strong>Triaxial</strong> cell and tube in tube according to IEC 62153-4-7ReceiverDUTTubeGeneratorTest head withscreening capHousingTubein tubeConnectingcableFigure 4 – Principle depiction of the <strong>Triaxial</strong> cell to measure transfer impedance and screeningattenuation at HV-assemblies with tube in tube according to IEC 62153-4-7- 5 -
Care should be takenat the transition from the tube to therectangular housing. Att this transitionreflexions of the transmitted signal may occurr (in the outer circuit), due to the deviation of thecharacteristic impedances. The plane of the short circuit at the near end e (generator side) should bethereforee direct at thewall of the housing of the cavity without any additional tube. . At the receiver side,the transition of the housing to the coaxial 500 Ohm systemshould be also direct at the wall of thehousing.Figure 5 –Different designs of <strong>Triaxial</strong> <strong>Cell</strong>sCut offf frequencies, higher order modesThe housing respectively the triaxial cell is in principle a cavity resonator which shows differentresonance frequencies, depending on its dimensions.For a rectangular cavity resonator, the resonance frequencies can be calculated according to equation(6). For this calculation, one of the parameters M,N,P may be set to zero. z Conductive parts inside thecavity resonator maylead to deviating resonance frequencies or to mute them.f MNPc0=2⎛⎜⎝Ma2⎞⎟⎠⎛ N+ ⎜⎝ b2⎞⎟⎠2⎛P ⎞+ ⎜ ⎟⎝c ⎠(6)where M,N,P number of modes(even, 2 off 3 >0)a,b,c dimensions of cavityc0 velocity of light infree spaceFor the dimensions of the <strong>Triaxial</strong> cells of 136/136/99 mm, 750/250/250 mm and 1000/300/300 mmresonance frequencies are givenin table 1 upp to 3 GHz. Since the device under test is placed insidethe cavity, the resonance frequencies during the test maydeviate fromm the calculated frequencies.Measurements of transfer impedance and screening attenuation of a cable RG 111 with single braidconstruction with tube and with <strong>Triaxial</strong> cell with a length of 1 m shows the same results up to the firstresonance frequencyof about 720 MHz.- 6 -
Table 1 – Resonance frequencies of different <strong>Triaxial</strong> <strong>Cell</strong>s136-er <strong>Cell</strong> 750-er <strong>Cell</strong> 1000-er <strong>Cell</strong>a b c a b c a b c136 136 99 750 250 250 1000 300 300m n p f/GHz m n p f/GHz m n p f/GHz1 1 1 2,17 1 1 1 0,87 1 1 1 0,721 2 0 2,47 1 2 0 1,22 1 2 0 1,010 2 1 2,68 0 2 1 1,34 0 2 1 1,121 2 1 2,89 1 2 1 1,36 1 2 1 1,132 2 0 3,12 2 2 0 1,26 2 2 0 1,040 1 2 3,22 0 1 2 1,34 0 1 2 1,121 1 2 3,41 1 1 2 1,36 1 1 2 1,132 2 1 3,47 2 2 1 1,40 2 2 1 1,160 2 2 3,75 0 2 2 1,70 0 2 2 1,411 2 2 3,91 1 2 2 1,71 1 2 2 1,422 3 0 3,98 2 3 0 1,84 2 3 0 1,53Figure 6 shows measurements of transfer impedance and screening attenuation of a cable RG 11 withsingle braid construction with tube and with <strong>Triaxial</strong> cell of a length of 1 m. Up to the calculated firstresonance frequency of about 720 MHz no deviation of the measured curves can be observed.Figure 6a – Comparison of the measurements with tube and with <strong>Triaxial</strong> cell of a RG 11 cablewith single braid construction, lin. scale- 7 -
Figure 6b – Comparison of the measurements with tube and withh <strong>Triaxial</strong> cell of a RG 111 cablewith single braid construction,, log scaleAbove the first resonance frequency of the cell of about 720 MHz, deviations of the max. values of thecurves within 3 dB can be found. Measurements of samples with complex geometries are underfurther study.Measuring of screening effectiveness of connectors and cable assemblies with thee <strong>Triaxial</strong> cell isunder study at IEC TC 46/WG 5 and will be included as additional test procedure in the revisedversion of IEC 62153-4-7, Transfer impedance and screening attenuation of connectors andassemblies, <strong>Triaxial</strong> method.- 8 -
Influence of load conditions in the inner systemThe choice of the matching loads within a system has considerable influence regarding the coupling ofthe inner to the outer system and vice versa. This is valid for real existing screened electrical systemsas well as for test set-ups to measure the screening effectiveness with the triaxial procedure.At the triaxial system according to figure 1, the inner system consists of the DUT (device under test)with inner conductor, dielectric and screen, load resistor and generator. The second system consistsof the receiver, airspace, test tube, short circuit (as load of the DUT) and the screen of the DUT. Thescreen of the DUT is member of both, the inner and the outer system.The influence of different load impedances of the inner system regarding the test results is discussedbelow.In case of screening problems on cables and assemblies, usually the galvanic coupling of the systemsvia the transfer impedance of the cable screen or the outer conductor of the connector is consideredas dominant effect. The transfer impedance of screens can be determined by:ZTU=I12(7)This simple equation shows the underlying screening problem directly. A current I 1 that flows in theinner system through the screen with the transfer impedance Z T causes a voltage U 2 at the outersystem. This voltage acts as the disturbing source in the outer system.An increasing current through the screen causes increasing emission. If one looks at the currentdistribution of the inner system (the device under test), simple and easy conditions can only be foundin case of matching. In this case, current and voltage are in phase and knotted by the impedance ofthe line by:IU11= (8)Z1Equation (8) is only valid for the special case of matching. In case of changing load conditions a moregeneral description is required. Figure 7 shows the general equivalent circuit.The generator with the internal resistor Z G is connected to the DUT with the length L. The deviceunder test is depicted by the characteristic impedance Z 1 of the line, the dielectric constant ε r , thevelocity of propagation v and propagation constant γ. The device under test is loaded with the load R 1 .Figure 7 – Inner System, matched with source- und load impedanceThe current I(0) at the load is calculated according to [8] as follows:I (0) =UGZR ⋅ [cosh( γL) +Zsinh( γL)] + Z ⋅ [sinh( γL) + cosh( γL)]GG1 1Z1 Z1(9)- 9 -
With the theory of transmission lines, the current can be calculated now as function x of the length ofthe DUT:I(x) = I(0) ⋅cosh( γ x)+U(0) / Z ⋅sinh( γ x)1(10)In case of short circuit respectively in case off open circuitof a DUT with low impedance of Z 1 = 10Ohm (e.g. a HV-cable) with 1 m or 2 m length, the following current distribution along the cable lengthvs. frequency is given (figure 8 and 9).Figure 8 – Local current distribution vs. frequency with short circuit,left side 1m length, right side 2m lengthFigure 9 – Local current distribution vs. frequency with open circuit,left side 1m length, right side 2m lengthAt certain frequencies, a considerable location dependent increase off current occurs. The max. valueof those current peaks related to the matchedd condition (ZZ 1 = Z G ) is given g by:I max (Z 1 ) / I ma ax(Z 1 =Z G ) = Z G / Z 1(11))It is the inverse ratio of the impedances of thee generator and the DUT. For an unmatched cable undertest with a characteristic impedance of Z 1 = 10 Ohm we get local current maxima with a factorr 5.- 10 -
Impact of load conditions to the measurementsThe test results of a real test set-up with a 0,95 m long HV-cable under test with a characteristicimpedance of Z 1 = 10 Ohm for the load conditions: open circuit, matched and short circuit are shownin figure 10.Figure 10 – Comparison of the screening effectiveness of HV-cables with different loadconditionsWhereas measuring with matched DUT (R 1 = 10 Ohm, purple curve) shows a smooth coupling curve(Transmission S 21 ) up to 100 MHz, a first resonance maximum at about 40 MHz can be observed atthe short circuit. Further maxima can be observed at 3 * 40 MHz and 5 * 40 MHz; that means atuneven multiples of the first resonance maximum of the short circuit. At the open circuit, (R 1 = ∞ Ohm,green curve), we find the first resonance at about 80 MHz and a second one at about 160 MHz. A thirdone is indicated at about 240 MHz; that means, resonances occur at even multiples from the firstresonance frequency in case of open circuit.Expressed in wavelength which fit into the length of the cable under test, resonances occur as follows:short circuit:open circuit:uneven multiples of lambda/4even multiples of lambda/2The magnitude of those resonance cambers amounts up to +14dB, which corresponds to the factor 5(in case of voltage measurement). This value is conform to the theoretic investigated max currentcambers at the inner system.- 11 -
Literatur[1] Bernhard Mund, EMV von Steckverbindern und Verbindungskabeln,4. Anwenderkongress Steckverbinder 2010, Vogel Verlag, Würzburg,[2] Bernhard Mund, Thomas Schmid: Messen der Schirmdämpfung von Steckverbindern,Kabeldurchführungen und EMV-Dichtungen,3. Anwenderkongress Steckverbinder 2009, Vogel Verlag, Würzburg[3] Bernhard Mund: Measuring the EMC on RF-connectors and connecting hardware, Tube intube test procedure, IWCS (International wire & cable symposium) 2004, Philadelphia[4] Thomas Hähner und Bernhard Mund: Measurement of the screening effectiveness ofconnectors & cable assemblies: International Wroclaw Symposium on ElectromagneticCompatibility, EMC 2002[5] Thomas Hähner und Bernhard Mund: Background, content and future of the EMCmeasurement standard prEN 50289-1-6, Open / shielded test methods,International Wroclaw Symposium on Electromagnetic Compatibility, EMC 2000[6] Otto Breitenbach, Thomas Hähner und Bernhard Mund: Kabelschirmung imFrequenzbereich von MHz bis GHz, erweiterte Anwendung eines einfachen Meßverfahrens,Frequenz 1-2/1999 S. 18-28.[7] Lauri Halme, Rauno Kytönen, "Background and introduction to EM screening (shielding)behaviours and measurements of coaxial and symmetrical cables, cable assemblies andconnectors", IEE Colloquium on screening effectiveness measurements, Savoy PlaceLondon, 6 May 1998[8] F.M. Tesche et al: EMC Analysis Methods, Wiley, 1997[9] Prof. Dr. Münzner et. al., Untersuchungen und Simulation an <strong>Triaxial</strong>er Zelle, HochschuleUlmStandards:EN 50289-1-6IEC 62153-4-1IEC 62153-4-3IEC 62153-4-4IEC 62153-4-7IEC 62153-4-9Communication cables - Specifications for test methodsPart 1-6: Electrical test methods - Electromagnetic performanceIntroduction to EMC measurements.Surface transfer impedance - <strong>Triaxial</strong> methodShielded screening attenuation, test method for measuring of the screeningattenuation "as" up to and above 3 GHzShielded screening attenuation, test method for measuring the Transferimpedance Z T and the screening attenuation a s of RF-Connectors up to andabove 3 GHz; Tube in Tube methodCoupling attenuation, <strong>Triaxial</strong> method- 13 -