A Method for Determining Asymptotes of Home-Range Area Curves
A Method for Determining Asymptotes of Home-Range Area Curves
A Method for Determining Asymptotes of Home-Range Area Curves
- No tags were found...
You also want an ePaper? Increase the reach of your titles
YUMPU automatically turns print PDFs into web optimized ePapers that Google loves.
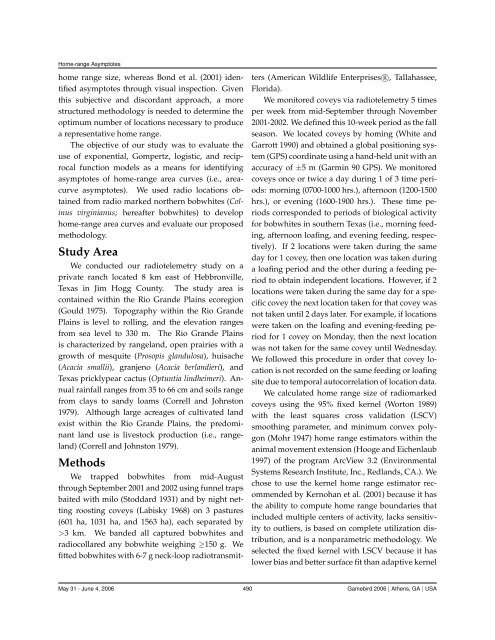
<strong>Home</strong>-range <strong>Asymptotes</strong>home range size, whereas Bond et al. (2001) identifiedasymptotes through visual inspection. Giventhis subjective and discordant approach, a morestructured methodology is needed to determine theoptimum number <strong>of</strong> locations necessary to producea representative home range.The objective <strong>of</strong> our study was to evaluate theuse <strong>of</strong> exponential, Gompertz, logistic, and reciprocalfunction models as a means <strong>for</strong> identifyingasymptotes <strong>of</strong> home-range area curves (i.e., areacurveasymptotes). We used radio locations obtainedfrom radio marked northern bobwhites (Colinusvirginianus; hereafter bobwhites) to develophome-range area curves and evaluate our proposedmethodology.Study <strong>Area</strong>We conducted our radiotelemetry study on aprivate ranch located 8 km east <strong>of</strong> Hebbronville,Texas in Jim Hogg County. The study area iscontained within the Rio Grande Plains ecoregion(Gould 1975). Topography within the Rio GrandePlains is level to rolling, and the elevation rangesfrom sea level to 330 m. The Rio Grande Plainsis characterized by rangeland, open prairies with agrowth <strong>of</strong> mesquite (Prosopis glandulosa), huisache(Acacia smallii), granjeno (Acacia berlandieri), andTexas pricklypear cactus (Optuntia lindheimeri). Annualrainfall ranges from 35 to 66 cm and soils rangefrom clays to sandy loams (Correll and Johnston1979). Although large acreages <strong>of</strong> cultivated landexist within the Rio Grande Plains, the predominantland use is livestock production (i.e., rangeland)(Correll and Johnston 1979).<strong>Method</strong>sWe trapped bobwhites from mid-Augustthrough September 2001 and 2002 using funnel trapsbaited with milo (Stoddard 1931) and by night nettingroosting coveys (Labisky 1968) on 3 pastures(601 ha, 1031 ha, and 1563 ha), each separated by>3 km. We banded all captured bobwhites andradiocollared any bobwhite weighing ≥150 g. Wefitted bobwhites with 6-7 g neck-loop radiotransmitters(American Wildlife Enterprises R○, Tallahassee,Florida).We monitored coveys via radiotelemetry 5 timesper week from mid-September through November2001-2002. We defined this 10-week period as the fallseason. We located coveys by homing (White andGarrott 1990) and obtained a global positioning system(GPS) coordinate using a hand-held unit with anaccuracy <strong>of</strong> ±5 m (Garmin 90 GPS). We monitoredcoveys once or twice a day during 1 <strong>of</strong> 3 time periods:morning (0700-1000 hrs.), afternoon (1200-1500hrs.), or evening (1600-1900 hrs.). These time periodscorresponded to periods <strong>of</strong> biological activity<strong>for</strong> bobwhites in southern Texas (i.e., morning feeding,afternoon loafing, and evening feeding, respectively).If 2 locations were taken during the sameday <strong>for</strong> 1 covey, then one location was taken duringa loafing period and the other during a feeding periodto obtain independent locations. However, if 2locations were taken during the same day <strong>for</strong> a specificcovey the next location taken <strong>for</strong> that covey wasnot taken until 2 days later. For example, if locationswere taken on the loafing and evening-feeding period<strong>for</strong> 1 covey on Monday, then the next locationwas not taken <strong>for</strong> the same covey until Wednesday.We followed this procedure in order that covey locationis not recorded on the same feeding or loafingsite due to temporal autocorrelation <strong>of</strong> location data.We calculated home range size <strong>of</strong> radiomarkedcoveys using the 95% fixed kernel (Worton 1989)with the least squares cross validation (LSCV)smoothing parameter, and minimum convex polygon(Mohr 1947) home range estimators within theanimal movement extension (Hooge and Eichenlaub1997) <strong>of</strong> the program ArcView 3.2 (EnvironmentalSystems Research Institute, Inc., Redlands, CA.). Wechose to use the kernel home range estimator recommendedby Kernohan et al. (2001) because it hasthe ability to compute home range boundaries thatincluded multiple centers <strong>of</strong> activity, lacks sensitivityto outliers, is based on complete utilization distribution,and is a nonparametric methodology. Weselected the fixed kernel with LSCV because it haslower bias and better surface fit than adaptive kernelMay 31 - June 4, 2006 490 Gamebird 2006 | Athens, GA | USA


