Packed Bed flooding.pdf - Youngstown State University's Personal ...
Packed Bed flooding.pdf - Youngstown State University's Personal ...
Packed Bed flooding.pdf - Youngstown State University's Personal ...

Create successful ePaper yourself
Turn your PDF publications into a flip-book with our unique Google optimized e-Paper software.
Previous Page<br />
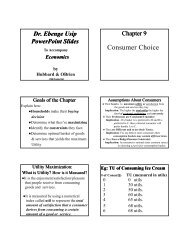
14-58 EQUIPMENT FOR DISTILLATION, GAS ABSORPTION, PHASE DISPERSION, AND PHASE SEPARATION<br />
FIG. 14-54 Efficiency characteristics of packed columns (total-reflux distillation.)<br />
Fp = packing factor, ft−1 ν=kinematic viscosity of liquid, cS<br />
CS = C-factor, Eq. (14-77), based on tower superficial crosssectional<br />
area, ft/s<br />
CP = capacity factor, dimensional [units consisted with Eq.<br />
(14-140) and its symbols]<br />
The abscissa scale term is the same flow parameter used for tray<br />
(dimensionless):<br />
L<br />
�<br />
G<br />
FLG = � � 0.5 ρG<br />
� ρL<br />
(14-141)<br />
For structured packing, Kister and Gill [Chem. Eng. Symp. Ser. 128,<br />
A109 (1992)] noticed a much steeper rise of pressure drop with flow<br />
parameter than that predicted from Fig. 14-55, and presented a modified<br />
chart (Fig. 14-56).<br />
The GPDC charts in Figs. 14-55 and 14-56 do not contain specific<br />
flood curves. Both Strigle and Kister and Gill recommend calculating<br />
the flood point from the flood pressure drop, given by the Kister and<br />
Gill equation<br />
∆P flood = 0.12F p 0.7 (14-142)<br />
Equation (14-142) permits finding the pressure drop curve in Fig. 14-55<br />
or 14-56 at which incipient <strong>flooding</strong> occurs.<br />
For low-capacity random packings, such as the small first-generation<br />
packings and those smaller than 1-in diameter (F p > 60 ft −1 ), calculated<br />
flood pressure drops are well in excess of the upper pressure drop<br />
curve in Fig. 14-55. For these packings only, the original Eckert flood<br />
correlation [Chem. Eng. Prog. 66(3), 39 (1970)] found in pre-1997 editions<br />
of this handbook and other major distillation texts is suitable.<br />
The packing factor F p is empirically determined for each packing<br />
type and size. Values of F p, together with general dimensional data for<br />
individual packings, are given for random packings in Table 14-13 (to<br />
go with Fig. 14-55) and for structured packings in Table 14-14 (to go<br />
with Fig. 14-56).<br />
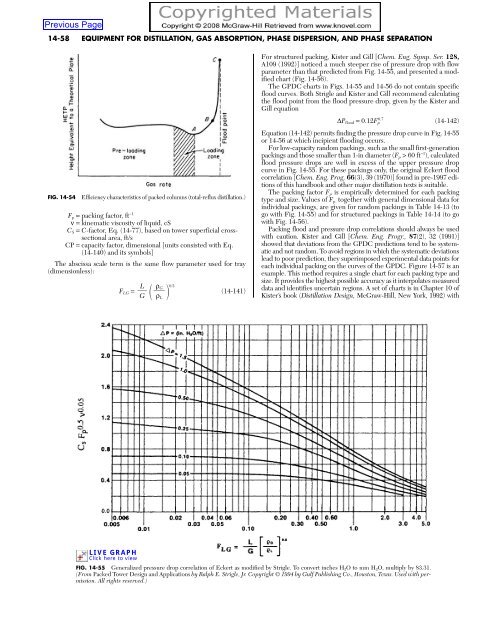
Packing flood and pressure drop correlations should always be used<br />
with caution. Kister and Gill [Chem. Eng. Progr., 87(2), 32 (1991)]<br />
showed that deviations from the GPDC predictions tend to be systematic<br />
and not random. To avoid regions in which the systematic deviations<br />
lead to poor prediction, they superimposed experimental data points for<br />
each individual packing on the curves of the GPDC. Figure 14-57 is an<br />
example. This method requires a single chart for each packing type and<br />
size. It provides the highest possible accuracy as it interpolates measured<br />
data and identifies uncertain regions. A set of charts is in Chapter 10 of<br />
Kister’s book (Distillation Design, McGraw-Hill, New York, 1992) with<br />
LIVE GRAPH<br />
Click here to view<br />
FIG. 14-55 Generalized pressure drop correlation of Eckert as modified by Strigle. To convert inches H2O to mm H2O, multiply by 83.31.<br />
(From <strong>Packed</strong> Tower Design and Applications by Ralph E. Strigle, Jr. Copyright © 1994 by Gulf Publishing Co., Houston, Texas. Used with permission.<br />
All rights reserved.)
LIVE GRAPH<br />
Click here to view<br />
updates in Kister, Lason, and Gill, Paper presented at the AIChE Spring<br />
National Meeting, Houston, Tex., March 19–23, 1995; and in Kister,<br />
Scherffius, Afshar, and Abkar, in Distillation 2007: Topical Conference<br />
Proceedings, 2007 AIChE Spring National Meeting, Houston, Texas.<br />
The latter reference also discusses correct and incorrect applications of<br />
those interpolation charts.<br />
There are many alternative methods for flood and pressure drop<br />
prediction. The Billet and Schultes [IChemE Symp. Ser. 104, pp.<br />
A171 and B255 (1987)] and the Maćkowiak (“Fluiddynamik von<br />
Kolonnen mit Modernen Füllkorpern und Packungen für Gas/Flussigkeitssysteme,”<br />
Otto Salle Verlag, Frankfurt am Main und Verlag<br />
Sauerländer Aarau, Frankfurt am Main, 1991) correlations are versions<br />
of the GPDC that take the liquid holdup into account. The<br />
Eiden and Bechtel correlation [IChemE Symp. Ser. 142, p. 757<br />
(1997)] is a version of the GPDC in which accuracy is improved by<br />
using constants representative of packing shape instead of packing<br />
factors. The Lockett and Billingham correlation (IChemE Symp.<br />
Ser. 152, p. 400, London, 2006) uses a Wallis correlation<br />
EQUIPMENT FOR DISTILLATION AND GAS ABSORPTION: PACKED COLUMNS 14-59<br />
FIG. 14-56 The Kister and Gill GPDC (SP) chart for structured packings only. Abscissa and ordinate same as in Fig.<br />
14-55. (From Kister, H. Z., and D. R. Gill, IChemE Symp. Ser. 128, p. A109, 1992. Reprinted courtesy of IChemE.)<br />
C G 0.5 + mCL 0.5 = CLG (14-143)<br />
where C L = uL[ρL/(ρL −ρG)] 0.5 (14-144)<br />
and was shown to work well for high-surface-area (>400 m 2 /m 3 ) structured<br />
packings. Here CG is the gas C-factor, Eq. (14-77), based on the<br />
tower superficial cross-sectional area, and m and CLG are constants,<br />
available from the cited reference for some packing.<br />
A drawback of most of these correlations (except that of Eiden and<br />
Bechtel) is the unavailability of constants for many, often most, of the<br />
modern popular packings.<br />
The above methods apply to nonfoaming systems. Foaming systems<br />
can be handled either by applying additional derating (system) factors to<br />
the flood correlation (see Table 14-9) or by limiting the calculated pressure<br />
drop to 0.25 in of water per foot of packing (Hausch, “Distillation<br />
Tools for the Practicing Engineer,” Topical Conference Proceedings, p.<br />
119, AIChE Spring Meeting, New Orleans, March 10–14, 2002).<br />
Pressure Drop The GPDC discussed above (Figs. 14-55 and<br />
14-56) and the Kister and Gill interpolation charts provide popular<br />
methods for calculating packing pressure drops. An alternative popular<br />
method that is particularly suitable for lower liquid loads was presented<br />
by Robbins (below).<br />
For gas flow through dry packings, pressure drop may be estimated<br />
by use of an orifice equation. For irrigated packings, pressure drop<br />
increases because of the presence of liquid, which effectively<br />
decreases the available cross section for gas flow (Fig. 14-53). In principle,<br />
there should be a method for correcting the dry pressure drop<br />
for the presence of liquid. This approach was used by Leva [Chem.<br />
Eng. Progr. Symp. Ser. No. 10, 50, 51 (1954)]. A more recent method<br />
by Robbins [Chem. Eng. Progr., p. 87 (May 1991)] utilizes the same<br />
approach and is described here. The total pressure drop is<br />
∆P t =∆P d +∆P L<br />
(14-145)<br />
where ∆P t = total pressure drop, inches H 2O per foot of packing<br />
∆P d = dry pressure drop = C 3G f 2 10 (C4Lf) (14-146)<br />
∆P L = pressure drop due to liquid presence<br />
= 0.4[L f/20,000] 0.1 [C 3G f 2 10 (C4Lf) ] 4 (14-147)<br />
G f = gas loading factor = 986F s(F pd/20) 0.5 (14-148)<br />
L f = liquid loading factor = L(62.4/ρ L)(F pd/20) 0.5 µ L 0.1 (14-149)<br />
The term F pd is a dry packing factor, specific for a given packing type<br />
and size. Values of F pd are given in Tables 14-13 and 14-14. For operating<br />
pressures above atmospheric, and for certain packing sizes, L f and<br />
G f are calculated differently:<br />
Gf = 986F s(F pd/20) 0.5 10 0.3ρ G (14-150)<br />
L f = L(62.4/ρ L)(F pd/20) 0.5 µ L 0.2 F pd > 200 (14-151a)<br />
L f = L(62.4/ρ L)(20/F pd) 0.5 µ L 0.1 F pd < 15 (14-151b)<br />
The Robbins equations require careful attention to dimensions. However,<br />
use of the equations has been simplified through the introduction of Fig.<br />
14-58. The terms L f and G f are evaluated, and the ∆P L is obtained directly<br />
from the chart. Basic nomenclature for the Robbins method follows:<br />
C3 = 7.4(10) −8<br />
C 4 = 2.7(10) −5<br />
F pd = dry packing factor, ft −1<br />
F s = superficial F-factor for gas, U tρ g 0.5 , ft/s(lb/ft 3 ) 0.5<br />
G = gas mass velocity, lb/hr⋅ft 2<br />
G f = gas loading factor, lb/hr⋅ft 2<br />
L = liquid mass velocity, lb/hr⋅ft 2<br />
L f = liquid loading factor, lb/hr⋅ft 2<br />
∆P = pressure drop, inches H2O/ft packing (× 83.3 =<br />
mm H2O/m packing)
14-60<br />
TABLE 14-13 Characteristics of Random Packings<br />
Packing factor, m−1 Size, <strong>Bed</strong><br />
mm, or density,* Area, % Normal Dry<br />
Name no. (#) kg/m3 m2 /m3 voids † Fp ‡ Fpd Vendor<br />
Metals<br />
Pall rings 16 510 360 92 256 262 Various<br />
(also Flexi-rings, 25 325 205 94 183 174<br />
Ballast rings, P-rings) 38 208 130 95 131 91<br />
50 198 105 96 89 79<br />
90 135 66 97 59 46<br />
Metal Intalox (IMTP) 25 224 207 97 134 141 Koch-Glitsch<br />
[also I-rings, AHPP, 40 153 151 97 79 85 [Sulzer, Amistco,<br />
RSMR, MSR] § 50 166 98 98 59 56 Rauschert, Montz] §<br />
70 141 60 98 39 ––<br />
Nutter rings #0.7 177 226 98 — 128 Sulzer<br />
#1 179 168 98 98 89<br />
#1.5 181 124 98 79 66<br />
#2 144 96 98 59 56<br />
#2.5 121 83 98 52 49<br />
#3.0 133 66 98 43 36<br />
Raschig Super-ring #0.5 275 250 98 –– –– Raschig<br />
#0.7 185 175 98 –– ––<br />
#1 220 160 98 82 ––<br />
#1.5 170 115 98 59 ––<br />
#2 155 98 99 49 ––<br />
#3 150 80 98 36 ––<br />
Cascade mini-rings #1 389 250 96 131 102 Koch-Glitsch<br />
(CMR) #1.5 285 190 96 95 —<br />
#2 234 151 97 72 79<br />
#2.5 195 121 97 62 ––<br />
#3 160 103 98 46 43<br />
#4 125 71 98 33 32<br />
#5 108 50 98 26 ¶ ––<br />
Fleximax #300 –– 141 98 85 –– Koch-Glitsch<br />
#400 –– 85 98 56 —<br />
Jaeger Tripacks #1 223 118 96 85 –– Raschig<br />
(Top-Pak) #2 170 75 98 46 —<br />
VSP 25 352 206 98 105 ¶ –– Raschig<br />
50 296 112 96 69 ––<br />
Ralu-rings 25 310 215 98 157 ¶ –– Raschig<br />
38 260 135 97 92 ¶ ––<br />
50 200 105 98 66 ¶ ––<br />
Hiflow 25 298 203 96 –– –– Rauschert<br />
50 175 92 98 52 —<br />
Hy-Pak, K-Pak, #1 262 174 97 148 –– Koch-Glitsch,<br />
AIPR #1.5 180 118 98 95 –– Amistco<br />
#2 161 92 98 85 ––<br />
#3 181 69 98 52 —<br />
Raschig rings 19 1500 245 80 722 –– Various<br />
( 1 ⁄16 in wall) 25 1140 185 86 472 492<br />
50 590 95 92 187 223<br />
75 400 66<br />
Ceramics<br />
95 105 ––<br />
Berl saddles 6 900 900 60 — 2950 Various<br />
13 865 465 62 790 900<br />
25 720 250 68 360 308<br />
38 640 150 71 215 154<br />
50 625 105 72 150 102<br />
Intalox, Flexi-saddles, 6 864 984 65 — 2720 Various<br />
Torus-saddles, Novalox 13 736 623 71 660 613<br />
25 672 256 73 302 308<br />
50 608 118 76 131 121<br />
75 576 92 79 72 66<br />
Raschig rings 6 960 710 62 –– 5250 Various<br />
13 880 370 64 1900 1705<br />
25 670 190 74 587 492<br />
50 660 92 74 213 230<br />
75 590 62 75 121 ––<br />
Pall ring 25 620 220 75 350 — Raschig<br />
38 540 164 78 180 —<br />
50 550 121 78 142 ––<br />
80 520 82 78 85 ¶ —
EQUIPMENT FOR DISTILLATION AND GAS ABSORPTION: PACKED COLUMNS 14-61<br />
TABLE 14-13 Characteristics of Random Packings (Concluded)<br />
Packing factor, m−1 Size, <strong>Bed</strong><br />
mm, or density* Area, % Normal Dry<br />
Name no. (#) kg/m3 m2 /m3 voids Fp † Fpd ‡ Ceramics<br />
Vendor<br />
Hiflow rings 38 409 108 83 121 –– Rauschert<br />
50 405 89 82 95 ––<br />
70 333 52<br />
Plastics<br />
86 49 —<br />
Pall rings 15 95 350 87 320 348 Various<br />
25 71 206 90 180 180<br />
40 70 131 91 131 131<br />
50 60 102 92 85 82<br />
90 43 85 95 56 39<br />
Super Intalox, 25 83 207 90 131 131 Various<br />
Flexi-saddles, 50 60 108 93 92 85<br />
Super-Torus, Novalox 75 48 89 96 59 46<br />
Cascade mini-rings #1A 53 185 97 98 92 Koch-Glitsch<br />
(CMR) #2A 46 115 97 59 ––<br />
#3A 40 74 98 39 33<br />
Raschig Super-ring #0.6 62 205 96 105 ¶ — Raschig<br />
#2 55 100 96 49 —<br />
Ralu-ring 15 80 320 94 230 ¶ — Raschig<br />
25 56 190 94 135 —<br />
38 65 150 95 80 —<br />
50 60 110 95 55 —<br />
90 40 75 96 38 —<br />
125 30 60 97 30 ¶ —<br />
Snowflake — 51 92 97 43 — Koch-Glitsch<br />
Nor-Pac 25 72 180 92 102 — NSW<br />
38 61 144 93 69 —<br />
50 53 102 94 46 —<br />
Tri-Packs #1 67 158 93 53 ¶ — Raschig<br />
(Hacketten) #2 53 125 95 39 ¶ 43<br />
Ralu-Flow #1 55 165 95 67 ¶ — Raschig<br />
#2 54 100 95 38 ¶ —<br />
Hiflow 25 63 192 92 138 — Rauschert<br />
50 59 110 93 66 —<br />
90 34 65 97 30 —<br />
Lanpac 90 67 148 93 46 — Lantec<br />
Impac #3 83 213 91 49 —<br />
Tellerettes 25 112 180 87 — 131 Ceilcote<br />
50 59 125 93 — —<br />
*Values are approximate and may not be consistent. Actual number depends on wall thickness and material.<br />
† Packing factor Fp from Kister, Distillation Design, McGraw-Hill, 1992; Kister, Larson, and Gill, paper presented at the Houston<br />
AIChE meeting, March 19–23, 1995; Strigle, <strong>Packed</strong> Tower Design and Applications, 2d ed., Gulf Publishing Co., Houston, Tex.,<br />
1994; Kister et al., in Distillation 2007. Topical Conference Proceedings, 2007 AIChE Spring National Meeting, Houston, Tex.<br />
‡ Dry packing factor Fpd from Robbins, Chem. Eng. Progr., 87(1), 19 (1990).<br />
§ The bracketed packings are similar to, but not the same as, the Koch-Glitsch IMTP. Some of them have holes that the<br />
IMTP do not have, and others have sizes that are different and are made by different dies.<br />
¶ Packing factor supplied by packing vendor.<br />
Vendors: Koch-Glitsch LLP, Wichita, Kansas; Raschig GmbH, Ludwigshafen/Rhein, Germany; Sulzer Chemtech Ltd., Winterthur,<br />
Switzerland; Rauschert Verfahrenstechnik GmbH, Steinwiesen, Germany; Amistco Separation Products Inc., Alvin,<br />
Texas; Julius Montz GmbH, Hilden, Germany; Ceilcote Co., Berea, Ohio; NSW Corp., Roanoke, Virginia; Lantec Products<br />
Inc., Agoura Hills, California.<br />
ρG = gas density, lb/ft 3<br />
ρL = liquid density, lb/ft 3<br />
µL = liquid viscosity, cP<br />
The Robbins correlation applies near atmospheric pressure and<br />
under vacuum, but is not suitable above 3 bar absolute. For high<br />
(>0.3) flow parameters [Eq. (14-141)], the correlation has only been<br />
tested with air-water data.<br />
For flood and MOC predictions, Robbins recommends his pressure<br />
drop method together with Eqs. (14-142) (flood) and (14-139) (MOC).<br />
The GPDC and Robbins correlations are empirical. Fundamental correlations<br />
are also available. Most of these use the channel model, which<br />
attributes the pressure drop to the resistance to flow in a multitude of<br />
parallel channels. The channels may have bends, expansions, and<br />
contractions. Popular application of this approach are the Rocha et al. correlation<br />
[Rocha, Bravo, and Fair, Ind. Eng. Chem. Res. 32, 641 (1993)] for<br />
structured packing and the Maćkowiak (“Fluiddynamik von Kolonnen<br />
mit Modernen Füllkorpern und Packungen für Gas/Flussigkeitssysteme,”<br />
Otto Salle Verlag, Frankfurt am Main und Verlag<br />
Sauerländer Aarau, Frankfurt am Main, 1991) and Billet (<strong>Packed</strong> Column
14-62 EQUIPMENT FOR DISTILLATION, GAS ABSORPTION, PHASE DISPERSION, AND PHASE SEPARATION<br />
Packing factor, m−1 TABLE 14-14 Characteristics of Structured Packings<br />
Size Area, % Normal Dry<br />
Name or number m 2 /m 3 voids* Fp † Fpd ‡ Vendor<br />
Metals, corrugated sheets<br />
Mellapak 125Y 125 99 33 Sulzer<br />
170Y 170 99 39<br />
2Y 223 99 46<br />
250Y 250 98 66<br />
350Y 350 98 75<br />
500Y 500 98 112<br />
750Y 750 97<br />
125X 125 99 16<br />
170X 170 99 20<br />
2X 223 99 23<br />
250X 250 98 26<br />
500X 500 98 82<br />
Mellapak Plus 202Y 99 Sulzer<br />
252Y 250 98 39<br />
352Y 98<br />
452Y 350 98 69<br />
752Y 500 98 131<br />
Flexipac 700Y 710 96 Koch-<br />
500Y 495 97 Glitsch<br />
1Y 420 98 98 (105)<br />
350Y 350 98<br />
1.6Y 290 98 59<br />
250Y 250 99<br />
2Y 220 99 49 (36)<br />
2.5Y 150 99<br />
3.5Y 80 99 30 (15)<br />
4Y 55 99 23 (10.5)<br />
1X 420 98 52<br />
350X 350 98<br />
1.6X 290 98 33<br />
250X 250 99<br />
2X 220 99 23<br />
2.5X 150 99<br />
3X 110 99 16<br />
3.5X 80 99<br />
4X 55 99<br />
Flexipac 700 710 96 223 Koch-<br />
High-capacity 500Z 495 97 Glitsch<br />
1Y 420 98 82<br />
350Y 350 98<br />
1.6Y 290 99 56<br />
250Y 250 99<br />
2Y 220 99 43<br />
Intalox 1T 310 98 66 Koch-Glitsch<br />
1.5T 250 99<br />
2T 215 99 56<br />
3T 170 99 43<br />
Packing factor, m−1 Size Area, % Normal Dry<br />
Name or number m2 /m3 voids* Fp † Fpd ‡ Vendor<br />
4T 135 99<br />
5T 90 99<br />
5TX 90 99<br />
Super-Pak 250 250 98 55 § Raschig<br />
350 350 98 70 §<br />
Ralu-Pak 250YC 250 98 66 Raschig<br />
Rhombopac 4M 151 Kuhni<br />
6M 230 59<br />
9M 351<br />
Max-Pak 0.5-in 229 98 39 Raschig<br />
Montz-Pak B1-125 125 97 Montz<br />
B1-200 200<br />
B1-250 250 95 66<br />
B1-350 350 93<br />
BSH-250 ¶ 250 95<br />
BSH-500 ¶ 500 91<br />
B1-250M 250 43<br />
B1-350M 350<br />
B1-500M 500<br />
Wire Mesh<br />
Sulzer AX 250 95 Sulzer<br />
BX 492 90 69 (52.5)<br />
CY<br />
BX Plus<br />
700 85<br />
Wire gauze BX 495 93 Koch-Glitsch<br />
Montz-Pak A3-500 500 91 Montz<br />
Goodloe 765 1010 96 Koch-Glitsch<br />
773 1920 95<br />
779 2640 92<br />
Hyperfil 2300 2300 93.6 394/230 §,|| 460 Knit Mesh<br />
1900 1900 94.8 312/180 §,||<br />
1400 1400 96.0 180/131 §,||<br />
Flexeramic 28 260<br />
Ceramic<br />
66 131 Koch-Glitsch<br />
48 160 77 79<br />
88 100 86<br />
Plastic<br />
49<br />
Mellapak 125Y 125 Sulzer<br />
250Y 250 72<br />
125X 125<br />
250X 250<br />
Ralu-Pak 30/160 160 92 Raschig<br />
Multifil plastics P1500 1500 88.5 Knit Mesh<br />
*% voids vary with material thickness and values may not be consistent.<br />
† Packing factors from Kister, Distillation Design, McGraw-Hill, 1992; Kister, Larson, and Gill, paper presented at the Houston AIChE Meeting, March 19–23, 1995;<br />
and Kister et al., in Distillation 2007: Proceedings of Topical Conference, AIChE Spring Meeting, Houston, Tex., April 22–26, 2007.<br />
‡ Dry packing factors from Robbins, Chem. Eng. Prog., p. 87, May 1991.<br />
§ These packing factors supplied by the packing vendor.<br />
¶ These are expanded metal packings.<br />
�� First figure is for hydrocarbon service, second figure for aqueous service.<br />
Vendors: Sulzer Chemtech Ltd., Winterthur, Switzerland; Koch-Glitsch LLP, Wichita, Kansas; Raschig GmbH, Ludwigshafen/Rhein, Germany; Julius Montz<br />
GmbH, Hilden, Germany; Knit Mesh/Enhanced Separation Technologies, Houston, Texas; Kuhni Ltd., Allschwil, Switzerland.<br />
Analysis and Design, Ruhr University, Bochum, Germany, 1989)<br />
methods. Stichlmair et al. (Distillation Principles and Practices, Wiley,<br />
New York, 1998; Gas Sep. Purif. 3, March 1989, p. 19) present alternative<br />
correlations using the particle model, that attributes packing<br />
pressure drop to friction losses due to drag of a particle. This is similar<br />
to the Ergun model for single-phase flow [Chem. Eng. Prog. 48(2), 89<br />
(1952)].<br />
Example 13: <strong>Packed</strong>-Column Pressure Drop Air and water are flowing<br />
countercurrently through a bed of 2-inch metal Pall rings. The air mass velocity<br />
is 2.03 kg/s⋅m 2 (1500 lbs/hr⋅ft 2 ), and the liquid mass velocity is 12.20 kg/s⋅m 2 (9000<br />
lbs/hr⋅ft 2 ). Calculate the pressure drop by the generalized pressure drop (GPDC,<br />
Fig. 14-55) and the Robbins methods. Properties: ρ G = 0.074 lbs/ft 3 ; ρ L = 62.4 lbs/ft 3 ,<br />
µ L = 1.0 cP, ν=1.0 cS. The packing factor F p = 27 ft −1 . For Robbins, F pd = 24 ft −1 .<br />
The flow parameter FLG = L/G (ρG/ρL) 0.5 = (9000/1500) (0.074/62.4) 0.5 = 0.207. The<br />
F-factor = F s = UtρG 0.5 = G/(ρG 0.5 3600) = 1500/[(0.074) 0.5 (3600)] = 1.53 ft/s(lb/ft 3 ) 0.5 .
Using the GPDC method, the capacity parameter [by Eq. (14-140)] =<br />
U t[ρG/(ρL −ρG)] 0.5 Fp 0.5 ν 0.05 , which is roughly equivalent to<br />
Fs<br />
� ρL 0.5<br />
F p 0.5ν0.05 = 270.5 1.53<br />
� (1.0)<br />
0.5 62.4<br />
= 1.01<br />
Referring to Fig. 14-55, the intersection of the capacity parameter and the flow<br />
parameter lines gives a pressure drop of 0.38 inches H2O/ft packing.<br />
Using the Robbins method, Gf = 986Fs(Fpd/20) 0.5 = 986(1.53)(24/20) 0.5 = 1653.<br />
Lf = L (62.4/ρL)(Fpd/20) 0.5 µ 0.1 = 9000 (1.0)(1.095)(1.0) = 9859. Lf /Gf = 5.96.<br />
From Fig. 14-58, pressure drop = 0.40 in. H2O/ft packing.<br />
PACKING EFFICIENCY<br />
HETP vs. Fundamental Mass Transfer The two-film model<br />
gives the following transfer unit relationship:<br />
H OG = HG +λHL<br />
where HOG = height of an overall transfer unit, gas concentration<br />
basis, m<br />
HG = height of a gas-phase transfer unit, m<br />
HL = height of a liquid-phase transfer unit, m<br />
λ=m/(LM/GM) = slope of equilibrium line/slope of<br />
operating line<br />
EQUIPMENT FOR DISTILLATION AND GAS ABSORPTION: PACKED COLUMNS 14-63<br />
(14-152)<br />
In design practice, a less rigorous parameter, HETP, is used to<br />
express packing efficiency. The HETP is the height of packed bed<br />
required to achieve a theoretical stage. The terms HOG and HETP may<br />
be related under certain conditions:<br />
ln λ<br />
�<br />
(λ−1)<br />
HETP = HOG� � (14-153)<br />
and since Z p = (H OG)(N OG) = (HETP)(N t) (14-154)<br />
N OG = Nt[ln λ/(λ−1)] (14-155)<br />
Equations (14-153) and (14-155) have been developed for binary mixture<br />
separations and hold for cases where the operating line and equilibrium<br />
line are straight. Thus, when there is curvature, the equations<br />
should be used for sections of the column where linearity can be<br />
assumed. When the equilibrium line and operating line have the same<br />
slope, HETP = H OG and N OG = N t (theoretical stages).<br />
An alternative parameter popular in Europe is the NTSM (number<br />
of theoretical stages per meter) which is simply the reciprocal of the<br />
HETP.<br />
Factors Affecting HETP: An Overview Generally, packing<br />
efficiency increases (HETP decreases) when the following occur.<br />
• Packing surface area per unit volume increases. Efficiency increases<br />
as the particle size decreases (random packing, Fig. 14-59) or as the<br />
channel size narrows (structured packing, Fig. 14-60).<br />
• The packing surface is better distributed around a random packing<br />
element.<br />
• Y structured packings (45° inclination) give better efficiencies than<br />
X structured packings (60° inclination to the horizontal) of the same<br />
surface areas (Fig. 14-60).<br />
• For constant L/V operation in the preloading regime, generally<br />
liquid and vapor loads have little effect on random and most corrugated<br />
sheet structured packings HETP (Figs. 14-59 and 14-60).<br />
HETP increases with loadings in some wire-mesh structured<br />
packing.<br />
• Liquid and vapor are well distributed. Both liquid and vapor maldistribution<br />
have a major detrimental effect on packing efficiency.<br />
• Other. These include L/V ratio (lambda), pressure, and physical<br />
properties. These come into play in some systems and situations, as<br />
discussed below.<br />
HETP Prediction HETP can be predicted from mass-transfer<br />
models, rules of thumb, and data interpolation.<br />
Mass-Transfer Models Development of a reliable mass-transfer<br />
model for packing HETP prediction has been inhibited by a lack of<br />
understanding of the complex two-phase flow that prevails in packings,<br />
by the shortage of commercial-scale efficiency data for the newer<br />
packings, and by difficulty in quantifying the surface generation in<br />
modern packings. Bennett and Ludwig (Chem. Eng. Prog., p. 72,<br />
April 1994) point out that the abundant air-water data cannot be reliably<br />
used for assessing real system mass-transfer resistance due to<br />
variations in turbulence, transport properties, and interfacial areas.<br />
More important, the success and reliability of rules of thumb for predicting<br />
packing efficiency made it difficult for mass-transfer models to<br />
compete.<br />
For random packings, the Bravo and Fair correlation [Ind. Eng.<br />
Chem. Proc. Des. Dev. 21, 162 (1982)] has been one of the most<br />
popular theoretical correlations. It was shown (e.g., McDougall,<br />
Chem SA, p. 255, October 1985) to be better than other theoretical<br />
correlations, yet produced large discrepancies when compared to<br />
test data [Shariat and Kunesh, Ind. Eng. Chem. Res. 34(4), 1273<br />
(1995)]. For structured packings, the Bravo, Fair, and Rocha correlation<br />
[Chem. Eng. Progr. 86(1), 19 (1990); Ind. Eng. Chem. Res.<br />
35, 1660 (1996)] is one of the most popular theoretical correlations.<br />
This correlation is based on the two-film theory. Interfacial areas<br />
are calculated from the packing geometry and an empirical wetting<br />
parameter.<br />
Alternate popular theoretical correlations for random packings,<br />
structured packings, or both (e.g., Billet and Schultes, “Beitrage zur<br />
Verfahrens-und Umwelttechnik,” p. 88, Ruhr Universitat, Bochum,<br />
Germany, 1991) are also available.<br />
Rules of Thumb Since in most circumstances packing HETP is<br />
sensitive to only few variables, and due to the unreliability of even the<br />
best mass-transfer model, it has been the author’s experience that<br />
rules of thumb for HETP are more accurate and more reliable than<br />
mass-transfer models. A similar conclusion was reached by Porter<br />
and Jenkins (IChemE Symp. Ser. 56, Summary paper, London,<br />
1979).<br />
The majority of published random packing rules of thumb closely<br />
agree with one another. They are based on second- and third-generation<br />
random packings and should not be applied to the obsolete<br />
first-generation packings. Porter and Jenkins’s (loc. cit.), Frank’s<br />
(Chem. Eng., p. 40, March 14, 1977), Harrison and France’s (Chem.<br />
Eng., p. 121, April 1989), Chen’s (Chem. Eng., p. 40, March 5, 1984),<br />
and Walas’ (Chem. Eng., p. 75, March 16, 1987) general rules of<br />
thumb are practically the same, have been successfully tested against<br />
an extensive data bank, and are slightly conservative, and therefore<br />
suitable for design.<br />
For small-diameter columns, the rules of thumb presented by<br />
Frank (loc. cit.), Ludwig (Applied Process Design for Chemical and<br />
Petrochemical Plants, vol. 2, 2d ed., Gulf Publishing, Houston, Tex.,<br />
1979), and Vital et al. [Hydrocarbon Processing, 63(12), 75 (1984)]<br />
are identical. The author believes that for small columns, the more<br />
conservative value predicted from either the Porter and Jenkins or<br />
the Frank-Ludwig-Vital rule should be selected for design. Summarizing:<br />
HETP = 18D P<br />
(14-156a)<br />
HETP > DT for DT < 0.67 m (14-156b)<br />
where DP and D T are the packing and tower diameters, m, respectively,<br />
and the HETP is in meters. In high-vacuum columns (
14-64 EQUIPMENT FOR DISTILLATION, GAS ABSORPTION, PHASE DISPERSION, AND PHASE SEPARATION<br />
(a)<br />
(b)<br />
FIG. 14-57 Superimposing experimental pressure-drop data for a given packing generates a GPDC interpolation<br />
chart for this packing. (a) A random packing; chart is based on Eckert’s GPDC, Fig. 14-55. (b) A structured packing;<br />
chart is based on Kister and Gill’s GPDC (SP), Fig. 14-56. (From Kister, H. Z., Distillation Design, copyright ©<br />
McGraw-Hill, 1992; used with permission.)<br />
Kister and Larson (in Schweitzer, Handbook of Separation Techniques<br />
for Chemical Engineers, 3d ed., McGraw-Hill, 1997) extended<br />
Eq. (14-156a) by expressing the packing diameter in terms of the<br />
more fundamental surface area per unit volume a P, m 2 /m 3 . For Pall<br />
rings, it can be shown that<br />
and Eq. (14-156a) becomes<br />
a P = 5.2/D P<br />
HETP = 93/a P<br />
(14-157)<br />
(14-158)
LIVE GRAPH<br />
Click here to view<br />
FIG. 14-58 The Robbins generalized pressure-drop correlation. (From L. A.<br />
Robbins. Chem Eng. Progr., May 1991. p. 87, reprinted courtesy of the American<br />
Institute of Chemical Engineers.)<br />
HETP, in<br />
EQUIPMENT FOR DISTILLATION AND GAS ABSORPTION: PACKED COLUMNS 14-65<br />
0.0 0.5 1.0 1.5 2.0 2.5 3.0<br />
100<br />
90<br />
80<br />
70<br />
60<br />
50<br />
40<br />
3.5 inch (88.9 mm)<br />
2 inch (50.8 mm)<br />
Harrison and France (loc. cit.) presented the only published rule of<br />
thumb for structured packings efficiency as a function of packing<br />
crimp. Kister and Larson reexpressed it in terms of the surface area<br />
per unit volume to accommodate a wider range of packing geometries.<br />
The final expression is<br />
F s , m/s (kg/m 3 ) 0.5<br />
30<br />
0.8<br />
5/8 inch (15.9 mm)<br />
20<br />
0.4<br />
10<br />
1 inch (25.4 mm)<br />
0<br />
0.0 0.4 0.8 1.2 1.6 2.0 2.4<br />
0.0<br />
2.8<br />
F s , ft/s (lb/ft 3 ) 0.5<br />
HETP = 100C XY/ap + 0.10 (14-159)<br />
Specific surface areas are listed in Tables 14-13 and 14-14.<br />
The above rules of thumb apply to organic and hydrocarbon systems,<br />
whose surface tensions are relatively low (σ
14-66 EQUIPMENT FOR DISTILLATION, GAS ABSORPTION, PHASE DISPERSION, AND PHASE SEPARATION<br />
FIG. 14-60 Effect of structured packing surface areas, loads, and inclination angle on packing efficiency. Efficiency<br />
expressed as number of theoretical stages per meter, the reciprocal of HETP. Sulzer data, chlorobenzene–ethylbenzene,<br />
100 mbar, at total reflux; 250-mm-diameter test column. (Reprinted courtesy of Sulzer<br />
Chemtech.)<br />
these data to the good, yet imperfect, distributors used in the real<br />
world. For poor distributors, the above rules of thumb will usually<br />
predict well below the HETPs measured in the field.<br />
Lockett (Chem. Eng. Progr., p. 60, January 1998) simplified the<br />
fundamental Bravo-Fair-Rocha correlation [Ind. Eng. Chem. Res. 35,<br />
p. 1660 (1996)] to derive an alternative rule of thumb for structured<br />
packing efficiency. This rule of thumb predicts HETPs under perfect<br />
distribution conditions. Lockett recommends caution when applying<br />
this rule of thumb for aqueous systems as it does not predict the<br />
effects of underwetting (below).<br />
Service-Oriented Rules of Thumb Strigle (<strong>Packed</strong> Tower<br />
Design and Applications, 2d ed., Gulf Publishing, Houston, Tex.,<br />
1994) proposed a multitude of rules of thumb as a function of the service,<br />
column pressure, and physical properties. These rules are based<br />
on the extensive experience of Strigle and the Norton Company (now<br />
merged with Koch-Glitsch LP).
Data Interpolation Interpolation of experimental HETP data is<br />
the most reliable means of obtaining design HETP values. This is<br />
hardly surprising in an area where our understanding of the theory is<br />
so poor that rules of thumb can do better than theoretical models. The<br />
author believes that it is best to derive HETP from experimental data,<br />
and to check it against a rule of thumb.<br />
Eckert [Chem. Eng. Progr. 59(5), 76 (1963)], Chen (Chem. Eng.<br />
p. 40, March 5, 1984), and Vital et al. [Hydroc. Proc. 63(12), 75<br />
(1984)] tabulated experimental HETP data for various random packings.<br />
Kister (Distillation Design, McGraw-Hill, 1992) extended these<br />
tabulations and included published HETP data and a detailed procedure<br />
for interpolating such HETP data. A prerequisite to any interpolation<br />
of packing data is thorough familiarity with the factors that<br />
affect HETP. Overlooking any of the factors listed can easily lead to<br />
poor interpolation and grossly incorrect design. In particular, it is<br />
imperative to recognize that the quality of distribution in pilot towers<br />
is generally superior to the quality of distribution in commercial towers.<br />
Underwetting Laboratory- and pilot-scale distillation experiments<br />
with systems that exhibit large differences in surface tension<br />
along the column such as methanol-water showed a sharp drop in efficiency<br />
at the high-surface-tension end of the column [Ponter et al.,<br />
Trans. Instn. Chem. Engineers [London], 45, T345 (1967)]. There<br />
appeared to be a critical methanol composition below which performance<br />
deteriorated rapidly. The poor performance at the lowmethanol-concentration<br />
end appeared independent of the type and<br />
size of packing. Visual observations with disk columns attributed these<br />
effects to underwetting.<br />
Underwetting is a packing surface phenomenon, which breaks up<br />
liquid film. The tendency of the liquid film to break (the degree of<br />
wetting) is expressed by the contact angle (Fig. 14-61). A contact<br />
angle of 0° indicates perfect wetting; an angle of 180° indicates no<br />
wetting. Mersmann and Deixler [Chem. Ing. Tech. 58(1), 19 (1986)]<br />
provide a preliminary chart for estimating contact angles. The contact<br />
angle depends on both the surface and the liquid and is a strong function<br />
of composition. In systems with large surface tension gradients,<br />
both contact angles and minimum wetting rates may vary rapidly with<br />
changes of composition or surface tension. Extensive studies by Ponter<br />
et al. [loc. cit.; also, Ponter and Au-Yeung, Chem. Ing. Tech., 56(9),<br />
701 (1984)] showed that<br />
• Underwetting is most significant in aqueous-organic systems, and<br />
tends to occur at the high-surface-tension (aqueous) end of the<br />
composition range. Liquid viscosity may also have an effect.<br />
• Underwetting may be alleviated by changing the material and surface<br />
roughness of the packing.<br />
• In systems susceptible to underwetting, column efficiency can<br />
sometimes (but not always) be improved by the addition of small<br />
amounts of surfactants.<br />
Effect of Lambda Most packed-column efficiency testing has<br />
been at total reflux. Some tests for both random and structured packings<br />
[Billet, “<strong>Packed</strong> Towers Analysis and Design,” Ruhr University,<br />
Bochum, Germany, 1989; Meier, Hunkeler, and Stocker, IChemE<br />
Symp. Ser. 56, 3.3/1 (1979); Eckert and Walter, Hydroc. Proc. 43(2),<br />
107 (1964)] suggest that efficiencies at finite reflux are similar to those<br />
at total reflux when lambda (λ=mG M/LM, which is the ratio of the<br />
slope of the equilibrium curve to the slope of the operating line)<br />
ranges between 0.5 and 2.0. This range is typical for most distillation<br />
systems.<br />
Koshy and Rukovena [Hydroc. Proc., 65(5), 64 (1986)], experimenting<br />
with methanol-water and water-DMF using #25 IMTP pack-<br />
FIG. 14-61 Contact angles. (a) Acute, good wetting. (b) Obtuse, poor wetting.<br />
EQUIPMENT FOR DISTILLATION AND GAS ABSORPTION: PACKED COLUMNS 14-67<br />
ing in a pilot-scale column, observed a sharp efficiency drop when the<br />
group λ was greater than 2 or lower than 0.5. The efficiency loss escalated<br />
as λ deviated more from this range. Koshy and Rukovena recognized<br />
that surface tension gradients and underwetting may have<br />
influenced some of their findings, but argue that the lambda effect is<br />
the major cause for the efficiency differences observed in their tests.<br />
High-relative-volatility systems are those most likely to be affected by<br />
λ, because at low volatility, λ ranges from 0.5 to 2. Strigle (loc. cit.)<br />
quantified the lambda effect on HETP using the following equation:<br />
Actual HETP/standard HETP = 1 + 0.278[ABS(ln λ) 3 ] (14-160)<br />
For 0.5
14-68 EQUIPMENT FOR DISTILLATION, GAS ABSORPTION, PHASE DISPERSION, AND PHASE SEPARATION<br />
11 of Kister’s Distillation Design (McGraw-Hill, New York, 1992)<br />
leads to a similar conclusion for structured packings. For water-rich<br />
systems, packing HETPs tend to be much higher than for nonaqueous<br />
systems due to their high lambda or surface underwetting, as discussed<br />
above. High hydrogen concentrations (>30 percent or so in the<br />
gas) have also led to low packing efficiencies (Kister et al., Proc. 4th<br />
Ethylene Producers Conference, AIChE, New Orleans, La., p. 283,<br />
1992), possibly due to the fast-moving hydrogen molecule dragging<br />
heavier molecules with it as it diffuses from a liquid film into the<br />
vapor.<br />
Errors in VLE These affect packing HETP in the same way as<br />
they affect tray efficiency. The discussions and derivation earlier in<br />
this subsection apply equally to tray and packed towers.<br />
Comparison of Various Packing Efficiencies for Absorption<br />
and Stripping In past editions of this handbook, extensive data on<br />
absorption/stripping systems were given. Emphasis was given to the<br />
following systems:<br />
Ammonia-air-water Liquid and gas phases contributing; chemical<br />
reaction contributing<br />
Air-water Gas phase controlling<br />
Sulfur dioxide-air-water Liquid and gas phase controlling<br />
Carbon dioxide-air-water Liquid phase controlling<br />
The reader may refer to the data in the 5th edition. For the current<br />
work, emphasis will be given to one absorption system, carbon dioxide-air-caustic.<br />
Carbon Dioxide-Air-Caustic System The vendors of packings<br />
have adopted this system as a “standard” for comparing the performance<br />
of different packing types and sizes for absorption/stripping.<br />
For tests, air containing 1.0 mol % CO2 is passed countercurrently to<br />
a circulating stream of sodium hydroxide solution. The initial concentration<br />
of NaOH in water is 1.0 N (4.0 wt %), and as the circulating<br />
NaOH is converted to sodium carbonate it is necessary to make a<br />
mass-transfer correction because of reduced mass-transfer rate in the<br />
liquid phase. The procedure has been described by Eckert et al. [Ind.<br />
Eng. Chem., 59(2), 41 (1967); Chem. Eng. Progr., 54(1), 790 (1958)].<br />
An overall coefficient is measured using gas-phase (CO2) concentrations:<br />
moles CO2 absorbed<br />
KOGae = ������<br />
time-bed volume-partial pressure CO2 driving force<br />
(14-161)<br />
The coefficients are usually corrected to a hydroxide conversion of 25<br />
percent at 24°C. For other conversions, Fig. 14-14 may be used.<br />
Reported values of KOGa for representative random packings are given<br />
in Table 14-15. The effect of liquid rate on the coefficient is shown in<br />
Fig. 14-63.<br />
While the carbon dioxide/caustic test method has become accepted,<br />
one should use the results with caution. The chemical reaction masks<br />
TABLE 14-15 Overall Coefficients for Representative Packings<br />
CO2-air-caustic system<br />
Nominal size,<br />
mm<br />
Overall coefficient KOGa, kg⋅moles/(hr⋅m3⋅atm) Ceramic raschig rings 25 37.0<br />
50 26.1<br />
Ceramic Intalox saddles 25 45.1<br />
50 30.1<br />
Metal pall rings 25 49.6<br />
50 34.9<br />
Metal Intalox saddles (IMTP ® ) 25 54.8<br />
50 39.1<br />
NOTE: Basis for reported values: CO2 concentration in inlet gas, 1.0 vol %; 1N<br />
NaOH solution in water, 25 percent NaOH conversion; temperature = 24°C;<br />
atmospheric pressure: gas rate = 1.264 kg/(s⋅m2 ); liquid rate = 6.78 kg/(s⋅m2 ).<br />
SOURCE: Strigle, R. L., <strong>Packed</strong> Tower Design and Applications, 2d ed., Gulf<br />
Publ. Co., Houston, 1994.<br />
K Ga, lb-moles/hr, ft 3 , atm<br />
K Ga, lb-moles/hr, ft 3 , atm<br />
10<br />
5<br />
3<br />
2<br />
1<br />
.8<br />
.6<br />
.4<br />
.3<br />
.2<br />
0.1<br />
100 500 1000 2000 5000<br />
2<br />
Liquid rate, lbm/(hr•ft )<br />
(a)<br />
10<br />
5<br />
3<br />
2<br />
1<br />
.8<br />
.6<br />
.4<br />
.3<br />
.2<br />
0.1 100<br />
1<br />
'<br />
'<br />
p<br />
'<br />
'<br />
1<br />
2<br />
a<br />
r<br />
'<br />
'<br />
the effect of physical absorption, and the relative values in the table<br />
may not hold for other cases, where much of the resistance to mass<br />
transfer is in the gas phase. Background on this combination of physical<br />
and chemical absorption may be found earlier in the present section,<br />
under “Absorption with Chemical Reaction.”<br />
l<br />
l<br />
n<br />
i<br />
r<br />
a<br />
a<br />
r<br />
s<br />
'<br />
'<br />
2<br />
s<br />
c<br />
c<br />
g<br />
i<br />
h<br />
p<br />
h<br />
s<br />
l<br />
a<br />
g<br />
i<br />
g<br />
l<br />
r<br />
r<br />
i<br />
r<br />
i<br />
n<br />
i<br />
n<br />
n<br />
g<br />
g<br />
g<br />
s<br />
500 1000 2000 5000<br />
2<br />
Liquid rate, lbm/(hr•ft )<br />
FIG. 14-63 Overall mass transfer coefficients for carbon dioxide absorbed<br />
from air by 1N caustic solution. (a) 1-in Pall rings and Raschig rings. (b) 2-in Pall<br />
rings and Raschig rings. Air rate = 0.61 kg/s⋅m 2 (450 lb/hr⋅ft 2 ). To convert from<br />
lb/hr⋅ft 2 to kg/s⋅m 2 , multiply by 0.00136. To convert from lb-moles/hr⋅ft 3 atm to<br />
kg-moles/s⋅m 3 atm, multiply by 0.0045. [Eckert et al., Chem. Eng. Progr., 54(1),<br />
70 (1958).]<br />
(b)<br />
s<br />
s
Summary In the preloading regime, packing size, type, and distribution<br />
affect HETP. With aqueous-organic systems, HETP may be<br />
sensitive to underwetting and composition. A lambda value<br />
(λ=mG M/L M) outside the range of 0.5 to 2.0 causes HETP to rise, and<br />
so does a high hydrogen concentration. HETP of structured packings<br />
may also be affected by pressure (at high pressure), and vapor and liquid<br />
loads.<br />
MALDISTRIBUTION AND ITS EFFECTS<br />
ON PACKING EFFICIENCY<br />
Modeling and Prediction Maldistribution may drastically<br />
reduce packing efficiency. HETP may increase by a factor as high as 2<br />
or 3 due to maldistribution. Shariat and Kunesh [Ind. Eng. Chem.<br />
Res., 34(4), 1273 (1995)] provide a good demonstration.<br />
Early models [Mullins, Ind. Chem. Mfr., 33, 408 (1957); Manning<br />
and Cannon, Ind. Eng. Chem. 49(3), 347 (1957)] expressed the effect<br />
of liquid maldistribution on packing efficiency in terms of a simple<br />
channeling model. A portion of the liquid bypasses the bed, undergoing<br />
negligible mass transfer, and then rejoins and contaminates the<br />
rest of the liquid. Huber et al. [Chem. Ing. Tech. 39, 797 (1967);<br />
Chem. Eng. Sci. 21, 819 (1966)] and Zuiderweg et al. [IChemE Symp.<br />
Ser. 104, A217 (1987)] replaced the simple bypassing by variations in<br />
the local L/V ratios. The overirrigated parts have a high L/V ratio, the<br />
underirrigated parts a low L/V ratio. Regions with low L/V ratios experience<br />
pinching, and, therefore, produce poor separation.<br />
Huber et al. (loc. cit.) and Yuan and Spiegel [Chem. Ing. Tech. 54,<br />
774 (1982)] added lateral mixing to the model. Lateral deflection of<br />
liquid by the packing particles tends to homogenize the liquid, thus<br />
counteracting the channeling and pinching effect.<br />
A third factor is the nonuniformity of the flow profile through the<br />
packing. This nonuniformity was observed as far back as 1935 [Baker,<br />
Chilton, and Vernon, Trans. Instn. Chem. Engrs. 31, 296 (1935)] and<br />
was first modeled by Cihla and Schmidt [Coll. Czech. Chem. Commun.,<br />
22, 896 (1957)]. Hoek (Ph.D. Thesis, The University of Delft,<br />
The Netherlands, 1983) combined all three factors into a single<br />
model, leading to the zone-stage model below.<br />
The Zone-Stage Model Zuiderweg et al. [IChemE Symp. Ser.<br />
104, A217, A233 (1987)] extended Hoek’s work combining the effects<br />
of local L/V ratio, lateral mixing, and flow profile into a model describing<br />
the effect of liquid maldistribution on packing efficiency. This<br />
work was performed at Fractionation Research Inc. (FRI) and at The<br />
University of Delft in The Netherlands. The model postulates that, in<br />
the absence of maldistribution, there is a “basic” (or “true” or “inherent”)<br />
HETP which is a function of the packing and the system only.<br />
This HETP can be inferred from data for small towers, in which lateral<br />
mixing is strong enough to offset any pinching. For a given initial<br />
liquid distribution, the model uses a diffusion-type equation to characterize<br />
the splitting and recombining of liquid streams in the horizontal<br />
and vertical directions. The mass transfer is then calculated by<br />
integrating the liquid flow distribution at each elevation and the basic<br />
HETP. Kunesh et al. successfully applied the model to predict measured<br />
effects of maldistribution on packing efficiency. However, this<br />
model is difficult to use and has not gained industrywide acceptance.<br />
Empirical Prediction Moore and Rukovena [Chemical Plants<br />
and Processing (European edition), p. 11, August 1987] proposed the<br />
empirical correlation in Fig. 14-64 for efficiency loss due to liquid<br />
maldistribution in packed towers containing Pall ® rings or Metal<br />
Intalox ® packing. This correlation was shown to work well for several<br />
case studies (Fig. 14-64), is simple to use, and is valuable, at least as a<br />
preliminary guide.<br />
To quantify the quality of liquid irrigation, the correlation uses the<br />
distribution quality rating index. Typical indexes are 10 to 70 percent<br />
for most standard commercial distributors, 75 to 90 percent for intermediate-quality<br />
distributors, and over 90 percent for high-performance<br />
distributors. Moore and Rukovena present a method for calculating a<br />
distribution-quality rating index from distributor geometry. Their<br />
method is described in detail in their paper as well as in Kister’s book<br />
(Distillation Operation, McGraw-Hill, New York, 1990).<br />
Maximum Liquid Maldistribution Fraction fmax. To characterize<br />
the sensitivity of packed beds to maldistribution, Lockett and<br />
EQUIPMENT FOR DISTILLATION AND GAS ABSORPTION: PACKED COLUMNS 14-69<br />
FIG. 14-64 Effect of irrigation quality on packing efficiency. (a) Case histories<br />
demonstrating efficiency enhancement with higher distribution quality rating. (b)<br />
Correlation of the effect of irrigation quality on packing efficiency. (From F. Moore<br />
and F. Rukovena, Chemical Plants and Processing, Europe edition, Aug. 1987;<br />
reprinted courtesy of Chemical Plants and Processing.)<br />
Billingham (Trans. IChemE. 80, Part A, p. 373, May 2002; Trans.<br />
IChemE. 81, Part A, p. 134, January 2003) modeled maldistribution as<br />
two parallel columns, one receiving more liquid (1 + f )L, the other<br />
receiving less (1 − f )L. The vapor was assumed equally split (Fig. 14-65)<br />
(a)<br />
(b)
14-70 EQUIPMENT FOR DISTILLATION, GAS ABSORPTION, PHASE DISPERSION, AND PHASE SEPARATION<br />
FIG. 14-65 Parallel-columns model. (From Lockett and Billingham, Trans.<br />
IChemE 80, Part A, p. 373, May 2002; reprinted courtesy of IChemE.)<br />
without lateral mixing. Because of the different L/V ratios, the overall<br />
separation is less than is obtained at uniform distribution. A typical<br />
calculated result (Fig. 14-66) shows the effective number of stages<br />
from the combined two-column system decreasing as the maldistribution<br />
fraction f increases. Figure 14-66a shows that the decrease is minimal<br />
in short beds (e.g., 10 theoretical stages) or when the<br />
maldistribution fraction is small. Figure 14-66a shows that there is a<br />
limiting fraction f max which characterizes the maximum maldistribution<br />
that still permits achieving the required separation. Physically, f max<br />
represents the maldistribution fraction at which one of the two parallel<br />
columns in the model becomes pinched. Figure 14-66b highlights<br />
the steep drop in packing efficiency upon the onset of this pinch.<br />
Billingham and Lockett derived the following equation for f max in a<br />
binary system:<br />
yN + 1 − yN<br />
��<br />
x1 − xo<br />
�<br />
xN + 1 − xo<br />
yN + 1 − yN<br />
��<br />
x1 − xo<br />
�<br />
xN + 1 − xo<br />
f max = + − � �� � (14-162)<br />
yN − yo<br />
yN − yo<br />
This equation can be used to calculate fmax directly without the need<br />
for a parallel column model. Billingham and Lockett show that the<br />
various terms in Eq. (14-162) can be readily calculated from the output<br />
of a steady-state computer simulation. Multicomponent systems<br />
are represented as binary mixtures, either by lumping components<br />
together to form a binary mixture of pseudolight and pseudoheavy<br />
components, or by normalizing the mole fractions of the two key components.<br />
Once fmax is calculated, Billingham and Lockett propose the<br />
following guidelines:<br />
• fmax
the pinching effect. The effects of maldistribution on efficiency are<br />
therefore most severe in large-diameter columns and small-diameter<br />
packings.<br />
A good design practice is to seek a packing size that gives a D T/D p<br />
between 10 and 40. This is often impractical, and higher ratios are<br />
common. When D T/D p exceeds 100, avoiding efficiency loss due to<br />
maldistribution is difficult. Either ratios exceeding 100 should be<br />
avoided, or a special allowance should be made for loss of efficiency<br />
due to maldistribution.<br />
3. Wall flow effects become large when D T/D p falls below about 10.<br />
Packing diameter should be selected such that D T/D p exceeds 10.<br />
4. Columns containing less than five theoretical stages per bed are<br />
relatively insensitive to liquid maldistribution. With 10 or more stages<br />
per bed, efficiency can be extremely sensitive to maldistribution<br />
(Strigle, <strong>Packed</strong> Tower Design and Applications, 2d ed., Gulf Publishing,<br />
Houston, Tex., 1994) (Fig. 14-66). <strong>Bed</strong>s consisting of small packings<br />
or structured packings, which develop more theoretical stages<br />
per bed, are therefore more sensitive to maldistribution than equaldepth<br />
beds of larger packings. This is clearly demonstrated by FRI’s<br />
experiments [Shariat and Kunesh, Ind. Eng. Chem. Res. 34(4), 1273<br />
(1995)]. Lockett and Billingham (Trans. IChemE, vol. 81, Part A, p.<br />
131, January 2003) concur with these comments when their procedure<br />
(above) indicates high sensitivity to maldistribution, but allow a higher<br />
number of stages per bed when the sensitivity is low.<br />
5. Maldistribution tends to be a greater problem at low liquid flow<br />
rates than at high liquid flow rates [Zuiderweg, Hoek, and Lahm, I.<br />
ChemE Symp. Ser. 104, A217 (1987)]. The tendency to pinch and to<br />
spread unevenly is generally higher at the lower liquid flow rates.<br />
6. A packed column has reasonable tolerance for a uniform or<br />
smooth variation in liquid distribution and for a variation that is totally<br />
random (small-scale maldistribution). The impact of discontinuities or<br />
zonal flow (large-scale maldistribution) is much more severe [Zuiderweg<br />
et al., loc. cit.; Kunesh, Chem. Eng., p. 101, Dec. 7, 1987; Kunesh,<br />
Lahm, and Yanagi, Ind. Eng. Chem. Res. 26(9), 1845 (1987)]. This is<br />
so because the local pinching of small-scale maldistribution is evened<br />
out by the lateral mixing, and therefore causes few ill effects. In contrast,<br />
the lateral mixing either is powerless to rectify a large-scale<br />
maldistribution or takes considerable bed length to do so (meanwhile,<br />
efficiency is lost).<br />
Figure 14-67 shows HETPs measured in tests that simulate various<br />
types of maldistribution in FRI’s 1.2-m column containing a 3.6-m bed<br />
of 1-in Pall ® rings. The y axis is the ratio of measured HETP in the<br />
maldistribution tests to the HETP obtained with an excellent distributor.<br />
Analogous measurements with structured packing were reported<br />
by Fitz, King, and Kunesh [Trans. IChemE 77, Part A, p. 482 (1999)].<br />
Generally, the response of the structured packings resembled that of<br />
the Pall ® rings, except as noted below.<br />
Figure 14-67a shows virtually no loss of efficiency when a distributor<br />
uniformly tilts, such that the ratio of highest to lowest flow is 1.25<br />
(i.e., a “1.25 tilt”). In contrast, an 11 percent chordal blank of a level<br />
distributor causes packing HETP to rise by 50 percent.<br />
Figure 14-67b compares continuous tilts with ratios of highest to<br />
lowest flow of 1.25 and 1.5 to a situation where one-half of the distributor<br />
passes 25 percent more liquid than the other half. The latter<br />
(“zonal”) situation causes a much greater rise in HETP than a “uniform”<br />
maldistribution with twice as much variation from maximum to<br />
minimum.<br />
Figure 14-67c shows results of tests in which flows from individual<br />
distributor drip points were varied in a gaussian pattern (maximum/mean<br />
= 2). When the pattern was randomly assigned, there was<br />
no efficiency loss. When the variations above the mean were assigned<br />
to a “high zone,” and those below the mean to a “low zone,” HETP<br />
rose by about 20 percent. With structured packing, both random and<br />
zonal maldistribution caused about the same loss of efficiency at the<br />
same degree of maldistribution.<br />
7. A packed bed appears to have a “natural distribution,” which is<br />
an inherent and stable property of the packings. An initial distribution<br />
which is better than natural will rapidly degrade to it, and one that is<br />
worse will finally achieve it, but sometimes at a slow rate. If the rate is<br />
extremely slow, recovery from a maldistributed pattern may not be<br />
observed in practice (Zuiderweg et al., loc. cit.). Even though the<br />
EQUIPMENT FOR DISTILLATION AND GAS ABSORPTION: PACKED COLUMNS 14-71<br />
FIG. 14-67 Comparing the effects of “small-scale” and “large-scale” maldistribution<br />
on packing HETP. (a) Comparing the effect of a simulated continuous<br />
tilt (max/min flow ratio = 1.25) with the simulated effect of blanking a chordal<br />
area equal to 11 percent of the tower area. (b) Comparing the effects of simulated<br />
continuous tilts (max/min flow ratios of 1.25 and 1.5) with the effects of a<br />
situation where one-half of the distributor passes 25 percent more liquid to the<br />
other half. (c) Comparing the effects of random maldistribution with those of<br />
zonal maldistribution. (Reprinted with permission from J. G. Kunesh, L. Lahm,<br />
and T. Yahagi, Ind. Eng. Chem. Res., 26, p. 1845; copyright © 1987, American<br />
Chemical Society.)<br />
(a)<br />
(b)<br />
(c)
14-72 EQUIPMENT FOR DISTILLATION, GAS ABSORPTION, PHASE DISPERSION, AND PHASE SEPARATION<br />
volumetric distribution improves along the bed, the concentration<br />
profile could have already been damaged, and pinching occurs<br />
(Bonilla, Chem. Eng. Prog., p. 47, March 1993).<br />
8. Liquid maldistribution lowers packing turndown. The 2-in Pall<br />
rings curve in Fig. 14-59 shows HETP rise upon reaching the distributor<br />
turndown limit.<br />
9. The major source of gas maldistribution is undersized gas inlet<br />
and reboiler return nozzles, leading to the entry of high-velocity gas<br />
jets into the tower. These jets persist through low-pressure-drop<br />
devices such as packings. Installing gas distributors and improving gas<br />
distributor designs, even inlet baffles, have alleviated many of these<br />
problems. Vapor distribution is most troublesome in large-diameter<br />
columns. Strigle (<strong>Packed</strong> Tower Design and Applications, 2d ed., Gulf<br />
Publishing, Houston, Tex., 1994) recommends considering a gas distributing<br />
device whenever the gas nozzle F-factor (F N = u Nρ G 0.5 )<br />
exceeds 27 m/s (kg/m 3 ) 0.5 , or the kinetic energy of the inlet gas exceeds<br />
8 times the pressure drop through the first foot of packing, or the<br />
pressure drop through the bed is less than 0.65 mbar/m. Gas maldistribution<br />
is best tackled at the source by paying attention to the gas<br />
inlet arrangements.<br />
10. A poor initial liquid maldistribution may cause gas maldistribution<br />
in the loading region, i.e., at high gas rates [Stoter, Olujic, and de<br />
Graauw, IChemE Symp. Ser. 128, A201 (1992); Kouri and Sohlo,<br />
IChemE Symp. Ser. 104, B193 (1987)]. At worst, initial liquid maldistribution<br />
may induce local <strong>flooding</strong>, which would channel the gas. The<br />
segregation tends to persist down the bed. Outside the loading region,<br />
the influence of the liquid flow on gas maldistribution is small or negligible.<br />
Similarly, in high-gas-velocity situations, the liquid distribution<br />
pattern in the bottom structured packing layers is significantly influenced<br />
by a strongly maldistributed inlet gas flow [Olujic et al., Chem.<br />
Eng. and Processing, 43, 465 (2004)]. Duss [IChemE Symp. Ser. 152,<br />
418 (2006)] suggests that high liquid loads such as those experienced<br />
in high-pressure distillation also increase the susceptibility to gas<br />
maldistribution.<br />
11. The effect of gas maldistribution on packing performance is<br />
riddled with unexplained mysteries. FRI’s (Cai, Paper presented at<br />
the AIChE Annual Meeting, Reno, Nev., 2001) commercial-scale<br />
tests show little effect of gas maldistribution on both random and<br />
structured packing efficiencies. Cai et al. (Trans IChemE 81, Part A,<br />
p. 85, 2003) distillation tests in a 1.2-m-diameter tower showed that<br />
blocking the central 50 percent or the chordal 30 percent of the tower<br />
cross-sectional area beneath a 1.7-m-tall bed of 250 m 2 /m 3 structured<br />
packing had no effect on packing efficiency, pressure drop, or capacity.<br />
The blocking did not permit gas passage but allowed collection of<br />
the descending liquid. Simulator tests with similar blocking with packing<br />
heights ranging from 0.8 to 2.4 m (Olujic et al., Chemical Engineering<br />
and Processing, 43, p. 465, 2004; Distillation 2003: Topical<br />
Conference Proceedings, AIChE Spring National Meeting, New<br />
Orleans, La., AIChE, p. 567, 2003) differed, showing that a 50 percent<br />
chordal blank raised pressure drop, gave a poorer gas pattern, and<br />
prematurely loaded the packing. They explain the difference by the<br />
ability of liquid to drain undisturbed from the gas in the blocked segment<br />
in the FRI tests. Olujic et al. found that while gas maldistribution<br />
generated by collectors and by central blockage of 50 percent of<br />
the cross-sectional areas was smoothed after two to three layers of<br />
structured packing, a chordal blockage of 30 to 50 percent of crosssectional<br />
area generated maldistribution that penetrated deeply into<br />
the bed.<br />
12. Computational fluid dynamics (CFD) has been demonstrated<br />
effective for analyzing the effects of gas inlet geometry on gas maldistribution<br />
in packed beds. Using CFD, Wehrli et al. (Trans. IChemE<br />
81, Part A, p. 116, January 2003) found that a very simple device such<br />
as the V-baffle (Fig. 14-70) gives much better distribution than a bare<br />
nozzle, while a more sophisticated vane device such as a Schoepentoeter<br />
(Fig. 14-71c) is even better. Implications of the gas inlet geometry<br />
to gas distribution in refinery vacuum towers was studied by<br />
Vaidyanathan et al. (Distillation 2001, Topical Conference Proceedings,<br />
AIChE Spring National Meeting, Houston, Tex., p. 287, April<br />
22–26, 2001); Paladino et al. (Distillation 2003: Topical Conference<br />
Proceedings, AIChE Spring National Meeting, New Orleans, La.,<br />
p. 241, 2003); Torres et al. (ibid., p. 284); Waintraub et al. (Distillation<br />
2005: Topical Conference Proceedings, AIChE Spring National<br />
Meeting, Atlanta, Ga., p. 79, 2005); and Wehrli et al. (IChemE Symp.<br />
Ser 152, London, 2006). Vaidyanathan et al. and Torres et al. examined<br />
the effect of the geometry of a chimney tray (e.g., Fig. 14-72)<br />
above the inlet on gas distribution and liquid entrainment. Paladino<br />
et al. demonstrated that the presence of liquid in the feed affects the<br />
gas velocity profile, and must be accounted for in modeling. Paladino<br />
et al. and Waintraub et al. used their two-fluid model to study the<br />
velocity distributions and entrainment generated by different designs<br />
of vapor horns (e.g., Fig. 14-71). Wehrli et al. produced pilot-scale<br />
data simulating a vacuum tower inlet, which can be used in CFD<br />
model validation. Ali et al. (Trans. IChemE, vol. 81, Part A, p. 108,<br />
January 2003) found that the gas velocity profile obtained using a<br />
commercial CFD package compared well to those measured in a 1.4m<br />
simulator equipped with structured packing together with commercial<br />
distributors and collectors. Their CFD model effectively<br />
pointed them to a collector design that minimizes gas maldistribution.<br />
PACKED-TOWER SCALE-UP<br />
Diameter For random packings there are many reports [Billet,<br />
Distillation Engineering, Chem Publishing Co., New York, 1979;<br />
Chen, Chem. Eng., p. 40, March 5, 1984; Zuiderweg, Hoek, and<br />
Lahm, IChemE. Symp. Ser. 104, A217 (1987)] of an increase in<br />
HETP with column diameter. Billet and Mackowiak’s (Billet, <strong>Packed</strong><br />
Column Analysis and Design, Ruhr University, Bochum, Germany,<br />
1989) scale-up chart for Pall ® rings implies that efficiency decreases as<br />
column diameter increases.<br />
Practically all sources explain the increase of HETP with column<br />
diameter in terms of enhanced maldistribution or issues with the<br />
scale-up procedure. Lab-scale and pilot columns seldom operate at<br />
column-to-packing diameter ratios (DT/Dp) larger than 20; under<br />
these conditions, lateral mixing effectively offsets loss of efficiency<br />
due to maldistribution pinch. In contrast, industrial-scale columns<br />
usually operate at DT/Dp ratios of 30 to 100; under these conditions,<br />
lateral mixing is far less effective for offsetting maldistribution pinch.<br />
To increase DT/Dp, it may appear attractive to perform the bench-scale<br />
tests using a smaller packing size than will be used in the prototype.<br />
Deibele, Goedecke, and Schoenmaker [IChemE Symp. Ser. 142, 1021<br />
(1997)], Goedecke and Alig (Paper presented at the AIChE Spring<br />
National Meeting, Atlanta, Ga., April 1994), and Gann et al. [Chem. Ing.<br />
Tech., 64(1), 6 (1992)] studied the feasibility of scaling up from 50- to 75mm-diameter<br />
packed columns directly to industrial columns. Deibele<br />
et al. and Gann et al. provide an extensive list of factors that can affect<br />
this scale-up, including test mixture, packing pretreatment, column<br />
structure, packing installation, snug fit at the wall, column insulation and<br />
heat losses, vacuum tightness, measurement and control, liquid distribution,<br />
reflux subcooling, prewetting, sampling, analysis, adjusting the<br />
number of stages to avoid pinches and analysis issues, evaluation procedure,<br />
and more. Data from laboratory columns can be particularly sensitive<br />
to some of these factors. Goedecke and Alig show that for wire-mesh<br />
structured packing, bench-scale efficiency tends to be better than largecolumn<br />
efficiency, while for corrugated-sheets structured packing, the<br />
converse occurs, possibly due to excessive wall flow. For some packings,<br />
variation of efficiency with loads at bench scale completely differs from<br />
its variation in larger columns. For one structured packing, Kuhni Rombopak<br />
9M, there was little load effect and there was good consistency<br />
between data obtained from different sources—at least for one test mixture.<br />
Deibele et al. present an excellent set of practical guidelines to<br />
improve scale-up reliability. So, it appears that great caution is required<br />
for packing data scale-up from bench-scale columns.<br />
Height Experimental data for random packings show that HETP<br />
slightly increases with bed depth [Billet, Distillation Engineering,<br />
Chemical Publishing Co., New York, 1979; “<strong>Packed</strong> Tower Analysis<br />
and Design,” Ruhr University, Bochum, Germany, 1989; Eckert and<br />
Walter, Hydrocarbon Processing, 43(2), 107 (1964)].<br />
For structured packing, some tests with Mellapak 250Y [Meier,<br />
Hunkeler, and Stöcker, IChemE Symp. Ser. 56, p. 3, 3/1 (1979)]<br />
showed no effect of bed height on packing efficiency, while others<br />
(Cai et al., Trans IChemE, vol. 81, Part A, p. 89, January 2003) did<br />
show a significant effect.
The effect of bed depth on packing HETP is attributed to liquid<br />
maldistribution. Zuiderweg et al. [IChemE. Symp. Ser. 104, A217<br />
(1987)] suggest that the uneven irrigation generates an uneven concentration<br />
profile and localized pinching near the bottom of the beds.<br />
The tests by Martin, Bravo, and Fair (Paper presented at the National<br />
AIChE Meeting, New Orleans, La., 1988) confirm that the problem<br />
area is near the bottom. According to the zone-stage and Lockett and<br />
Billingham models (above), as well as the empirical correlation by<br />
Moore and Rukovena (Fig. 14-64), the more stages per bed, the<br />
greater is the rise in HETP with bed depth. The presence and extent<br />
of maldistribution play an important role in determining the beddepth<br />
effect.<br />
As the bed depth increases, end effects (i.e., mass transfer in the<br />
region of liquid introduction and in the region where liquid drips from<br />
the packing supports) become less important. Such end effects tend to<br />
lower the HETP observed in short columns, such as pilot-plant<br />
columns.<br />
In summary, bed depth may significantly influence HETP. This<br />
adds uncertainty to scale-up. Shallow test beds should be avoided.<br />
Most investigators use beds at least 1.5 m tall, and often more than 3 m<br />
tall. The FRI sampling technique (below) can detect maldistribution<br />
along the bed height.<br />
Loadings For many random and corrugated-sheet structured<br />
packings, HETP is independent of vapor and liquid loadings (Figs.<br />
14-59 and 14-60). For wire-mesh and some corrugated-sheet structured<br />
packings, HETP changes with gas and liquid loads.<br />
Wu and Chen [IChemE Symp. Ser. 104, B225 (1987)] recommend<br />
pilot testing over the entire range between the expected minimum<br />
and maximum operating rates, and taking the highest measured<br />
HETP as the basis for scale-up. The author concurs. With structured<br />
packings, the load effect may be due to liquid rather than gas loads,<br />
and the pilot tests should cover the range of liquid loads (i.e., m/s<br />
based on column cross section) that is expected in the prototype.<br />
Wetting For operation at low liquid loads, the onset of minimum<br />
wetting can adversely affect scale-up, particularly with random packings<br />
and aqueous systems. Scale-up reliability at low liquid loads can<br />
be improved by pilot-testing at the composition range expected in the<br />
prototype, and by using identical packing materials and surface treatment<br />
in the pilot tests and in the prototype.<br />
Underwetting At the aqueous end of aqueous-organic columns,<br />
underwetting is important. Rapid changes of concentration profiles<br />
and physical properties in organic-water separations complicate scaleup<br />
[Eiden and Kaiser, IChemE Symp. Ser. 142, 757 (1997)]. Near the<br />
onset of underwetting, HETP becomes strongly dependent on composition,<br />
packing material and surface roughness, and the presence of<br />
surfactants. Scale-up reliability can be enhanced by pilot-testing at the<br />
composition range expected in the prototype, and by using identical<br />
packing material and surface treatment in the pilot tests and in the<br />
prototype.<br />
Pre<strong>flooding</strong> For one structured packing test with an aqueous<br />
system, Billet (“<strong>Packed</strong> Column Analysis and Design,” Ruhr University,<br />
Bochum, Germany, 1989) measured higher efficiency for a preflooded<br />
bed compared with a non-preflooded bed. Presumably, the<br />
pre<strong>flooding</strong> improved either wetting or distribution. Billet recommends<br />
pre<strong>flooding</strong> the packing, both in the prototype and in the pilot<br />
column, to ensure maximum efficiency.<br />
Sampling Fractionation Research Inc. (FRI) developed a sampling<br />
technique that eliminates the influence of “end effects” and<br />
detects a maldistributed composition profile. This technique [Silvey<br />
and Keller, IChemE Symp. Ser. 32, p. 4:18 (1969)] samples the bed at<br />
frequent intervals, typically every 0.6 m or so. HETP is determined<br />
from a plot of these interbed samples rather than from the top and<br />
bottom compositions.<br />
It is imperative that the interbed samplers catch representative<br />
samples, which are an average through the bed cross section. Caution<br />
is required when the liquid is highly aerated and turbulent (e.g., above<br />
1300 kPa psia or above 1 m/min). The author highly recommends the<br />
FRI sampling technique for all other conditions.<br />
Aging Billet (loc. cit.) showed that for some plastic packings in<br />
aqueous systems, the efficiency after one week’s operation was almost<br />
double the efficiency of new packings. Little further change was<br />
EQUIPMENT FOR DISTILLATION AND GAS ABSORPTION: PACKED COLUMNS 14-73<br />
observed after one week. Billet explains the phenomenon by<br />
improved wetting. He recommends that data for plastic packings<br />
should only be used for scale-up after being in operation for an adequately<br />
long period.<br />
DISTRIBUTORS<br />
Liquid Distributors A liquid distributor (or redistributor)<br />
should be used in any location in a packed column where an external<br />
liquid stream is introduced. Liquid redistributors are also used<br />
between packed beds to avoid excessive bed lengths that may impair<br />
packing efficiency or mechanical strength. It is best to have the packing<br />
supplier also supply the distributor, with the user critically reviewing<br />
the design. The user must provide the supplier with concise<br />
information about the plugging, corrosive, and foaming tendencies of<br />
the service as well as the range of liquid flow rates that it needs to handle<br />
and the physical properties of the liquid.<br />
Olsson (Chem. Eng. Progr., p. 57, October 1999) discussed the key<br />
for successful distributor design and operation. He states that it is critical<br />
to correctly evaluate the fouling potential of the service and design<br />
for it (e.g., preventing small holes, filtering the feed, etc.); to avoid gas<br />
entry into liquid distributors (e.g., no flashing feed into a liquid distributor);<br />
to systematically check the irrigation pattern using a method<br />
such as the circle analysis of Moore and Rukovena [Chem. Plants and<br />
Process (European ed.), p. 11, August 1987; described in detail in<br />
Kister’s Distillation Operation, McGraw-Hill, New York, 1990]; to<br />
water-test any liquid distributor (major suppliers have dedicated test<br />
stands that are available for those purposes at cost); to ensure correct<br />
entry of a feed into a liquid distributor; and to thoroughly inspect a<br />
distributor. Kister [Trans. IChemE. vol. 81, Part A, p. 5 (January<br />
2003)] found that between 80 and 90 percent of the distributor failures<br />
reported in the literature in the last 50 years could have been prevented<br />
if users and suppliers had followed Olsson’s measures.<br />
A minimum of 40 irrigation points per square meter has been recommended,<br />
with 60 to 100 per square meter being ideal [Strigle,<br />
<strong>Packed</strong> Tower Design and Applications, 2d ed., Gulf Publishing,<br />
Houston, Tex., 1994; Kister, Distillation Operation, McGraw-Hill,<br />
New York, 1990; Norton Company (now Koch-Glitsch LP), <strong>Packed</strong><br />
Column Internals, Bulletin TA-80R, 1974]. Commercial-scale tests<br />
with both random and structured packings showed no improvement<br />
in packing efficiency by increasing the irrigation point density above<br />
40 per square meter [Fitz, King, and Kunesh, Trans. IChemE 77, Part<br />
A, p. 482 (1999)]. So going to larger numbers of irrigation points per<br />
square meter provides little improvement while leading to smaller<br />
holes which increases the plugging tendency. In orifice-type distributors,<br />
which are the most common type, the head-flow relationship is<br />
given by the orifice equation<br />
Q = 3.96 × 10⁻⁴ KDnDd2 h h0.5 (14-163)<br />
where Q is the liquid flow rate, m3 /h; KD is the orifice discharge coefficient,<br />
with a recommended value of 0.707 (Chen, Chem. Eng., p. 40,<br />
March 5, 1984); nD is the number of holes; dh is the hole diameter,<br />
mm; and h is the liquid head, mm. Equation (14-163) shows that at a<br />
given Q, increasing n leads to either smaller d or smaller h.<br />
Figures 14-68 and 14-69 show common distributor types used for<br />
distillation and absorption. An excellent detailed discussion of the<br />
types of distributors and their pros and cons was given by Bonilla<br />
(Chem. Eng. Progr., p. 47, March 1993). The perforated pipe (or ladder<br />
pipe) distributor (Fig. 14-68a) has holes on the underside of the<br />
pipes. It is inexpensive, provides a large open area for vapor flow, and<br />
does not rely on gravity. On the debit side, it is typically designed for<br />
high velocity heads, 500 to 1000 mm of water, which is 5 to 10 times<br />
more than gravity distributors, requiring [per Eq. (14-163)] either<br />
fewer irrigation points or the use of plugging-prone smaller holes. The<br />
high hole velocities make it prone to corrosion and erosion. These disadvantages<br />
make it relatively unpopular. A gravity variation of this distributor<br />
uses a liquid drum above the distributor that gravity-feeds it.<br />
Spray distributors (Fig. 14-68b) are pipe headers with spray nozzles<br />
fitted on the underside. The spray nozzles are typically wide-angle<br />
(often 120°) full-cone. Spray distributors are unpopular in distillation<br />
but are common in heat transfer, washing and scrubbing services
14-74 EQUIPMENT FOR DISTILLATION, GAS ABSORPTION, PHASE DISPERSION, AND PHASE SEPARATION<br />
(especially in refinery towers), and in small-diameter towers where a<br />
single spray nozzle can be used. They are inexpensive and offer a large<br />
open area for vapor flow and a robustness for handling of fouling fluids<br />
when correctly designed, and the sprays themselves contribute to<br />
mass and heat transfer. On the debit side, the spray cones often generate<br />
regions of over- and underirrigation, the sprays may not be<br />
homogeneous, the spray nozzles are prone to corrosion, erosion, and<br />
damage. With highly subcooled liquids, the spray angle may collapse<br />
when pushed at high pressure drops (above 100 to 150 kPa) (Fractionation<br />
Research Inc., “A Spray Collapse Study,” motion picture<br />
919, Stillwater, Okla., 1985). The design and spray pattern are highly<br />
empirical. Sprays also generate significant entrainment to the section<br />
above [Trompiz and Fair, Ind. Eng. Chem, Res., 39(6), 1797 (2000)].<br />
Orifice pan distributors (Fig. 14-69a) and orifice tunnel distributors<br />
(Fig. 14-69b) have floor holes for liquid flow and circular (Fig. 14-69a)<br />
or rectangular (Fig. 14-69b) risers for vapor passages. When they are<br />
used as redistributors, a hat is installed above each riser to prevent liquid<br />
from the bed above from dripping into the risers. Unlike the ladder<br />
pipe and spray distributors that operate by pressure drop, orifice distributors<br />
operate by gravity, and therefore use a much smaller liquid<br />
head, typically 100 to 150 mm at maximum rates. Using Eq. (14-163),<br />
the lower head translates to either more distributions points (nD), which<br />
helps irrigation quality, or larger hole diameters, which resists plugging.<br />
However, the low liquid velocities, large residence times, and open pans<br />
(or troughs) make them more prone to plugging than the pressure distributors.<br />
A good hole pattern and avoidance of oversized risers are<br />
essential. Orifice distributors are self-collecting, a unique advantage for<br />
redistributors. Orifice distributors are one of the most popular types<br />
and are favored whenever the liquid loads are high enough to afford<br />
hole diameters large enough to resist plugging (>12 mm).<br />
(a)<br />
(b)<br />
Orifice trough (or orifice channel) distributors (Fig. 14-69c–f) are<br />
some of the most popular types. The trough construction does away<br />
with the multitude of joints in the orifice pans, making them far more<br />
leak-resistant, a major advantage in large towers and low-liquid-rate<br />
applications. Liquid from a central parting box (Fig. 14-69c, e) or middle<br />
channel (Fig. 14-69d) is metered into each trough. The troughs<br />
can have floor holes, but elevating the holes above the floor<br />
(Fig. 14-69c–g) is preferred as it enhances plugging resistance. Tubes<br />
(Fig. 14-69c, d, f) or baffles (Fig. 14-69e) direct the liquid issuing from<br />
the elevated holes downward onto the packings. Orifice trough distributors<br />
are not self-collecting. When used for redistribution, they<br />
require a liquid collector to be installed above them.<br />
Turndown of orifice distributors is constrained to about 2 : 1 by Eq.<br />
(14-163). For example, a 100-mm liquid head at the design drops to<br />
25 mm when the liquid rate is halved. Lower heads give poor irrigation<br />
and high sensitivity to levelness. Turndown is often enhanced by<br />
using two rows of side tubes (in the Fig. 14-69c type) or of side holes<br />
(in the Fig. 14-69d or e types). Perforated drip tubes (as in Fig. 14-<br />
69d) are popular in either orifice trough or orifice pan distributors.<br />
The lower, smaller hole is active at low liquid rates, with the larger<br />
upper hole becoming active at higher liquid rates. Use of perforated<br />
drip tubes is not recommended when the vapor dew point is much<br />
higher than the liquid bubble point, because liquid may boil in the<br />
tubes, causing dryout underneath [Kister, Stupin, and Oude<br />
Lenferink, IChemE. Symp. Ser. 152, p. 409, London (2006)].<br />
A popular type of the orifice trough distributor is the splash plate distributor<br />
(Fig. 14-69e). The splash plates spread the issuing liquid over<br />
their lengths, making it possible to reduce the number of irrigation<br />
points. This is a special advantage with small liquid rates, as fewer irrigation<br />
points (at a given head) translate to larger, more fouling-resistant<br />
FIG. 14-68 Pressure liquid distributors. (a) Ladder pipe. (b) Spray. (Courtesy of Koch-Glitsch LP.)
hole diameters [Eq. (14-163)]. Lack of the drip tubes eliminates the<br />
possible in-tube boiling issue (above).<br />
Multistage orifice trough distributors (Fig. 14-69f) also attempt to<br />
provide good irrigation at low liquid rates without resorting to plugging-prone<br />
small holes. The primary stage uses fewer irrigation points.<br />
Liquid from the primary stage is further split at the secondary stage.<br />
The secondary stage is of small size, so leveling and small flow variations<br />
are not of great concern. The secondary stage may use the same<br />
or a different liquid splitting principle as the primary stage. Even<br />
short layers of structured packings have been used as a secondary distribution<br />
stage.<br />
Notched trough distributors (Fig. 14-69g) consist of parallel<br />
troughs with side V notches. This distributor obeys the triangular<br />
notch equation instead of the orifice equation, which makes the<br />
flow proportional to h 2.5 [instead of h 0.5 in Eq. (14-163)]. This high<br />
power renders the distributor highly sensitive to out-of-levelness and<br />
EQUIPMENT FOR DISTILLATION AND GAS ABSORPTION: PACKED COLUMNS 14-75<br />
(a) (b)<br />
hydraulic gradients and makes it difficult to incorporate a large number<br />
of distribution points. Since the liquid issues sideways, it is difficult<br />
to predict where the liquid will hit the packings. Baffles are<br />
sometimes used to direct the liquid downward. Overall, the quality of<br />
distribution is inferior to that of orifice distributors, making notchedtrough<br />
distributors unpopular. Their strength is their insensitivity to<br />
fouling and corrosive environments and their ability to handle high<br />
liquid rates at good turndown.<br />
With any trough distributor, and especially those with V notches,<br />
excessive hydraulic gradients must be avoided. This is often achieved<br />
by using more parting boxes.<br />
The hydraulic gradient is highest where the liquid enters the<br />
troughs, approaching zero at the end of the trough. The hydraulic gradient<br />
(between entry point and trough end) can be calculated from<br />
[Moore and Rukovena, Chemical Plants and Processing (European<br />
ed.), p. 11, August 1987]<br />
(c) (d)<br />
FIG. 14-69 Gravity liquid distributors. (a) Orifice pan. (b) Orifice tunnel. (c) Orifice tube, using external drip tubes. (d) Orifice trough, using internal drip tubes.<br />
(e) Splash plate orifice trough. (f) Two-stage orifice trough. (g) Notched trough. (Parts a–c, g, courtesy of Koch-Glitsch LP; parts d–f, courtesy of Sulzer Chemtech.)
14-76 EQUIPMENT FOR DISTILLATION, GAS ABSORPTION, PHASE DISPERSION, AND PHASE SEPARATION<br />
(e)<br />
FIG. 14-69 (Continued)<br />
hhg = 51vH 2 (14-164)<br />
where hhg is the hydraulic gradient head, mm, and vH is the horizontal<br />
velocity in the troughs, m/s.<br />
Flashing Feed and Vapor Distributors When the feed or reflux<br />
is a flashing feed, the vapor must be separated out of the liquid before<br />
the liquid enters a liquid distributor. At low velocities (only), this can be<br />
achieved by a bare nozzle (Fig. 14-70a). A V baffle (Fig. 14-70b) is<br />
sometimes installed as a primitive flashing feed or vapor distributor.<br />
For better vapor-liquid separation and distribution, with smallerdiameter<br />
towers (
(“Fluiddynamik von Kolonnen mit Modernen Füllkörpern und<br />
Packungen für Gas/Flüssigkeitssysteme, Otto Salle Verlag, Frankfurt<br />
am Main, and Verlag Sauerländer, Aarau, 1991), and by Mersmann<br />
and Deixler [Chem. Ing. Tech. 58(1), 19 (1986)] apply to<br />
second- and third-generation random packings as well as to some<br />
structured packings.<br />
Stichlmair and Fair (Distillation Principles and Practice, Wiley-<br />
VCH, New York, 1998) show that liquid holdup is primarily a function<br />
of the liquid Froude number, specific surface area of the<br />
packing, and physical properties. They recommend the correction by<br />
Engel, Stichlmair, and Geipel [Ind. Eng. Chem. Symp. Ser. 142, 939<br />
(1997)].<br />
EQUIPMENT FOR DISTILLATION AND GAS ABSORPTION: PACKED COLUMNS 14-77<br />
(a) (b)<br />
(c)<br />
FIG. 14-70 Flashing feed and vapor distributors. (a) Bare nozzle. (b) Rounded V baffle. (c) Peripheral flash box—the box extends right around<br />
the tower wall, with the collected liquid descending via downpipes to a liquid distributor below. (d) Gallery distributor—the feed enters the<br />
gallery area (upper plate). (Parts a–c, courtesy of Sulzer Chemtech; part d, courtesy of Koch-Glitsch LP.)<br />
U 2 Lap<br />
(d)<br />
µ 2 La 3 p<br />
σa 2 p<br />
1/6<br />
hLo = 0.93� � � � 1/10<br />
� � 1/8<br />
� � ��<br />
2 g ρLg 1000ρLg<br />
(14-165)<br />
where hLo = liquid holdup, fractional<br />
UL = liquid superficial velocity, m/s<br />
ap = packing specific surface area, m2 /m3 g = acceleration due to gravity, m/s<br />
µ L = liquid viscosity, kg/(m⋅s)<br />
σ=surface tension, mN/m<br />
The Engel, Stichlmair, and Geipel correlation applies only in the<br />
preloading regime. The packing geometry is represented in the
14-78<br />
(a)<br />
(b)<br />
(c)<br />
FIG. 14-71 High-velocity flashing feed and vapor distributors. (a) Vapor horn. (b) Radial vane<br />
distributor. (c) Schoepentoeter. (Parts a, b, courtesy of Koch-Glitsch LP; part c, courtesy of<br />
Sulzer Chemtech.)
FIG. 14-72 Chimney tray vapor distributor. (Reprinted courtesy of Koch-<br />
Glitsch LP.)<br />
correlation solely by the readily available specific surface area<br />
(Tables 14-13 and 14-14).<br />
Minimum Wetting Rate The minimum wetting rate (MWR) is<br />
the lower stability limit of packings. Below this liquid load the liquid<br />
film on the packing surfaces breaks up and dewetting occurs. The area<br />
available for mass transfer diminishes, and efficiency drops.<br />
Schmidt [IChemE Symp. Ser. 56, 3.1/1 (1979)] described the<br />
MWR in terms of a force balance at a dry patch along the path of a<br />
falling liquid film. While the gravity and viscous forces resist dewetting,<br />
the surface tension and vapor shear forces tend to dewet the<br />
falling film. The MWR therefore rises with an increase in surface tension<br />
and liquid density, and with a decrease in liquid viscosity. Large<br />
packing sizes and poor surface wetting characteristics also contribute<br />
to higher MWR.<br />
Schmidt presented a fundamental correlation to predict minimum<br />
wetting for Raschig and Pall ® rings. More popular have been the<br />
Glitsch rules of thumb [Table 14-16; Glitsch, Inc. (now Koch Glitsch),<br />
Bulletin 345, Dallas, Tex., 1986] for CMR ® random packings with<br />
packing surface areas around 200 m 2 /m 3 . To extend these rules to<br />
other random packings, Kister (Distillation Design, McGraw-Hill,<br />
New York, 1992) applied Schmidt’s model to give<br />
FIG. 14-73 Liquid holdup, air-water data by Billet (“<strong>Packed</strong> Column Design<br />
and Analysis,” Ruhr University, Bochum, Germany), preloading regime. (From<br />
Kister, H. Z., Distillation Design, copyright © by McGraw-Hill; reprinted with<br />
permission.)<br />
EQUIPMENT FOR DISTILLATION AND GAS ABSORPTION: PACKED COLUMNS 14-79<br />
FIG. 14-74 Effect of liquid and gas rates on the operating holdup of modern<br />
random packings (25-mm NorPac ® ). [From R. Billet and M. Schultes, IChemE<br />
Symp. Ser. 104, p. A159, 1987. Reprinted courtesy of the Institution of Chemical<br />
Engineers (UK).]<br />
Q MW ≈ (Q MW from Table 14-16) × (200/a p) 0.5 (14-166)<br />
The Glitsch brochure did not state the surface tension bases of Table<br />
14-16. The author believes that they conservatively apply to organic and<br />
hydrocarbon systems (σ 150 m 2 /m 3<br />
Minimum wetting rate,<br />
Material m 3 /(m 2 ⋅h)<br />
Unglazed ceramic (chemical stoneware) 0.5<br />
Oxidized metal (carbon steel, copper) 0.7<br />
Surface-treated metal (etched stainless steel) 1.0<br />
Glazed ceramic 2.0<br />
Glass 2.5<br />
Bright metal (stainless steel, tantalum, other alloys) 3.0<br />
PVC-CPVC 3.5<br />
Polypropylene 4.0<br />
Fluoropolymers (PTFE type) 5.0
14-80 EQUIPMENT FOR DISTILLATION, GAS ABSORPTION, PHASE DISPERSION, AND PHASE SEPARATION<br />
component was soluble in both liquid phases, and HETP was about 50<br />
percent above normal. Harrison argued that a second liquid phase<br />
leads to lower efficiency only when it impairs diffusion of the key<br />
species. On this basis, Harrison expects efficiency loss also when an<br />
“inert” liquid or vapor represents a large fraction of the liquid or vapor<br />
phase. Meier et al. recommend obtaining efficiencies by scaling up<br />
laboratory-scale data using a similar type of packing.<br />
Both Harrison and Meier et al. emphasize adequately distributing<br />
each liquid phase to the packing. Harrison noted that a well-designed<br />
ladder pipe distributor can maintain high velocities and low residence<br />
times that provide good mixing. With trough distributors that separate<br />
the phases and then distribute each to the packing, a light-to-heavy<br />
phase maldistribution may occur, especially when the phase ratio and<br />
separation vary. Meier et al. noted the existence of a cloudy two-liquid<br />
layer between the clear light and heavy liquid and recommend an<br />
additional middle distribution point for this layer. They also noticed<br />
that phase separation unevenness can have a large influence on the<br />
phase ratio irrigated to the packing.<br />
High Viscosity and Surface Tension Bravo (Paper presented<br />
at the AIChE Spring National Meeting, Houston, Tex., 1995) studied<br />
a system that had 425-cP viscosity, 350 mN/m surface tension, and a<br />
high foaming tendency. He found that efficiencies were liquid-phasecontrolled<br />
and could be estimated from theoretical HTU models.<br />
Capacity was less than predicted by conventional methods which do<br />
not account for the high viscosity. Design equations for orifice distributors<br />
extended well to the system once the orifice coefficient was calculated<br />
as a function of the low Reynolds number and the surface<br />
tension head was taken into account.<br />
OTHER TOPICS FOR DISTILLATION AND GAS ABSORPTION EQUIPMENT<br />
COMPARING TRAYS AND PACKINGS<br />
Most separations can be performed either with trays or with packings.<br />
The factors below represent economic pros and cons that favor each<br />
and may be overridden. For instance, column complexity is a factor<br />
favoring trays, but gas plant demethanizers that often use one or more<br />
interreboilers are traditionally packed.<br />
Factors Favoring Packings<br />
Vacuum systems. Packing pressure drop is much lower than that of<br />
trays because the packing open area approaches the tower crosssectional<br />
area, while the tray’s open area is only 8 to 15 percent of<br />
the tower cross-sectional area. Also, the tray liquid head, which<br />
incurs substantial pressure drop (typically about 50 mm of the<br />
liquid per tray), is absent in packing. Typically, tray pressure drop<br />
is of the order of 10 mbar per theoretical stage, compared to 3 to<br />
4 mbar per theoretical stage with random packings and about<br />
one-half of that with structured packings.<br />
Consider a vacuum column with 10 theoretical stages, operating at<br />
70-mbar top pressure. The bottom pressure will be 170 mbar with<br />
trays, but only 90 to 110 mbar with packings. The packed tower will<br />
have a much better relative volatility in the lower parts, thus reducing<br />
reflux and reboil requirements and bottom temperature. These<br />
translate to less product degradation, greater capacity, and smaller<br />
energy consumption, giving packings a major advantage.<br />
Lower-pressure-drop applications. When the gas is moved by a fan<br />
through the tower, or when the tower is in the suction of a compressor,<br />
the smaller packing pressure drop is often a controlling<br />
consideration. This is particularly true for towers operating close to<br />
atmospheric pressure. Here excessive pressure drop in the tower<br />
increases the size of the fan or compressor (new plant), bottlenecks<br />
them (existing plant), and largely increases power consumption.<br />
Due to the compression ratio, pressure drop at the compressor discharge<br />
is far less important and seldom a controlling consideration.<br />
Revamps. The pressure drop advantage is invaluable in vacuum column<br />
revamps, can be translated to a capacity gain, an energy<br />
gain, a separation improvement, or various combinations of these<br />
benefits. Likewise, for towers in the suction of compressors,<br />
replacing trays by packings reduces the compression ratio and<br />
helps debottleneck the compressor.<br />
Packings also offer an easy tradeoff between capacity and separation.<br />
In the loaded sections of the tower, larger packings can<br />
overcome capacity bottlenecks at the expense of loss in separation.<br />
The separation loss can often be regained by retrofitting<br />
with smaller packings in sections of the tower that are not highly<br />
loaded. In tray towers, changing tray spacing gives similar results,<br />
but is more difficult to do.<br />
Foaming (and emulsion). The low gas and liquid velocities in packing<br />
suppress foam formation. The large open area of the larger<br />
random packing promotes foam dispersal. Both attributes make<br />
random packing excellent for handling foams. In many cases<br />
recurrent foaming was alleviated by replacing trays by random<br />
packing, especially when tray downcomers were poorly designed.<br />
Switching from trays to structured packing can aggravate foaming.<br />
While the low gas and liquid velocities help, the solid walls<br />
restrict lateral movement of foams and give support to the foams.<br />
Small-diameter columns. Columns with diameter less than 1 m<br />
(3 ft) are difficult to access from inside to install and maintain the<br />
trays. “Cartridge” trays or an oversized diameter are often used.<br />
Either option is expensive. Cartridge trays also run into problems<br />
with sealing to the tower wall and matching tower to tray hardware<br />
[Sands, Chem. Eng., p. 86 (April 2006)]. Packing is normally<br />
a cheaper and more desirable alternative.<br />
Corrosive systems. The practical range of packing materials is<br />
wider. Ceramic and plastic packings are cheap and effective.<br />
Trays can be manufactured in nonmetals, but packing is usually a<br />
cheaper and more desirable alternative.<br />
Low liquid holdup. Packings have lower liquid holdup than do<br />
trays. This is often advantageous for reducing polymerization,<br />
degradation, or the inventory of hazardous materials.<br />
Batch distillation. Because of the smaller liquid holdup of packing, a<br />
higher percentage of the liquid can be recovered as top product.<br />
Factors Favoring Trays<br />
Solids. Trays handle solids much more easily than packing. Both gas<br />
and liquid velocities on trays are often an order of magnitude<br />
higher than through packing, providing a sweeping action that<br />
keeps tray openings clear. Solids tend to accumulate in packing<br />
voids. There are fewer locations on trays where solids can be<br />
deposited. Plugging in liquid distributors has been a common trouble<br />
spot. Cleaning trays is much easier than cleaning packings.<br />
Not all trays are fouling-resistant. Floats on moving valve trays<br />
tend to “stick” to deposits on the tray deck. Fouling-resistant trays<br />
have large sieve holes or large fixed valves, and these should be<br />
used when plugging and fouling are the primary considerations.<br />
There is much that can be done to alleviate plugging with random<br />
packing. Large, open packing with minimal pockets offers<br />
good plugging resistance. Distributors that resist plugging have<br />
large holes (> 13-mm diameter). Such large holes are readily<br />
applied with high liquid flow rates, but often not practical for<br />
small liquid flow rates.<br />
Maldistribution. The sensitivity of packing to liquid and gas maldistribution<br />
has been a common cause of failures in packed towers.<br />
Maldistribution issues are most severe in large-diameter towers,<br />
long beds, small liquid flow rates, and smaller packing. Structured<br />
packing is generally more prone to maldistribution than random<br />
packing. While good distributor design, water testing, and inspection<br />
can eliminate most maldistribution issues, it only takes a few<br />
small details that fall through the cracks to turn success into failure.<br />
Due to maldistribution, there are far more failures experienced
with packing than in trays, and it takes more trials “to get it right”<br />
than with trays. This makes trays more robust.<br />
Complex towers. Interreboilers, intercondensers, cooling coils, and<br />
side drawoffs are more easily incorporated in trays than in packed<br />
towers. In packed towers, every complexity requires additional<br />
distribution and/or liquid collection equipment.<br />
Feed composition variation. One way of allowing for design uncertainties<br />
and feedstock variation is by installing alternate feed<br />
points. In packed towers, every alternate feed point requires<br />
expensive distribution equipment.<br />
Performance prediction. Due to their sensitivity to maldistribution<br />
there is greater uncertainty in predicting packed column performance.<br />
Chemical reaction, absorption. Here the much higher liquid<br />
holdup on trays provides greater residence time for absorption or<br />
chemical reaction than does packing.<br />
Turndown. Moving valve and bubble-cap trays normally give better<br />
turndown than packings. Unless very expensive distributors are<br />
used, packed tower turndown is usually limited by distributor<br />
turndown.<br />
Weight. Tray towers usually weigh less than packed towers, saving<br />
on the cost of foundations, supports, and column shell.<br />
Trays vs. Random Packings The following factors generally<br />
favor trays compared to random packings, but not compared to structured<br />
packings.<br />
Low liquid rates. With the aid of serrated weirs, splash baffles,<br />
reverse-flow trays, and bubble-cap trays, low liquid rates can be<br />
handled better in trays. Random packings suffer from liquid<br />
dewetting and maldistribution sensitivity at low liquid rates.<br />
Process surges. Random packings are usually more troublesome<br />
than trays in services prone to process surges (e.g., those caused<br />
by slugs of water entering a hot oil tower, relief valve lifting, compressor<br />
surges, or instability of liquid seal loops). Structured<br />
packings are usually less troublesome than trays in such services.<br />
Trays vs. Structured Packings The following factors generally<br />
favor trays compared to structured packings, but not compared to random<br />
packings.<br />
Packing fires. The thin sheets of structured packing (typically 0.1<br />
mm) poorly dissipate heat away from hot spots. Also, cleaning,<br />
cooling, and washing can be difficult, especially when distributors<br />
or packing plug up. Many incidents of packing fires during<br />
turnarounds (while towers with structured packings were open<br />
to atmosphere) have been reported. Most of these fires were<br />
initiated by pyrophoric deposits, hot work (e.g., welding) above<br />
the packing, opening the tower while hot organics were still<br />
present, and packing metallurgy that was not fire-resistant.<br />
Detailed discussion can be found in Fractionation Research<br />
Inc. (FRI) Design Practices Committee, “Causes and Prevention<br />
of Packing Fires,” Chem. Eng., July 2007.<br />
Materials of construction. Due to the thin sheets of structured<br />
packings, their materials of construction need to have better<br />
resistance to oxidation or corrosion. For a service in which carbon<br />
steel is usually satisfactory with trays, stainless steel is usually<br />
required with structured packings.<br />
Column wall inspection. Due to their snug fit, structured packings<br />
are easily damaged during removal. This makes it difficult to<br />
inspect the column wall (e.g., for corrosion).<br />
Washing and purging. Thorough removal of residual liquid, wash<br />
water, air, or process gas trapped in structured packings at startup<br />
and shutdown is more difficult than with trays. Inadequate<br />
removal of these fluids may be hazardous.<br />
High liquid rates. Multipass trays effectively lower the liquid load<br />
“seen” by each part of the tray. A similar trick cannot be applied<br />
with packings. The capacity of structured packings tends to<br />
rapidly fall off at high liquid rates.<br />
Capacity and Efficiency Comparison Kister et al. [Chem. Eng.<br />
Progr., 90(2), 23 (1994)] reported a study of the relative capacity and<br />
efficiency of conventional trays, modern random packings, and conventional<br />
structured packings. They found that, for each device optimally<br />
designed for the design requirements, a rough guide could be<br />
developed on the basis of flow parameter L/G (ρ G/ρ L) 0.5 (abcissa in<br />
OTHER TOPICS FOR DISTILLATION AND GAS ABSORPTION EQUIPMENT 14-81<br />
Figs. 14-31, 14-55, and 14-56) and the following tentative conclusions<br />
could be drawn:<br />
Flow Parameter 0.02–0.1<br />
1. Trays and random packings have much the same efficiency and<br />
capacity.<br />
2. Structured packing efficiency is about 1.5 times that of trays or<br />
random packing.<br />
3. At a parameter of 0.02, the structured packing has a 1.3–1.4<br />
capacity advantage over random packing and trays. This advantage<br />
disappears as the parameter approaches 0.1.<br />
Flow Parameter 0.1–0.3<br />
1. Trays and random packings have about the same efficiency and<br />
capacity.<br />
2. Structured packing has about the same capacity as trays and random<br />
packings.<br />
3. The efficiency advantage of structured packing over random<br />
packings and trays decreases from 1.5 to 1.2 as the parameter<br />
increases from 0.1 to 0.3.<br />
Flow Parameter 0.3–0.5<br />
1. The loss of capacity of structured packing is greatest in this<br />
range.<br />
2. The random packing appears to have the highest capacity and<br />
efficiency with conventional trays just slightly behind. Structured<br />
packing has the least capacity and efficiency.<br />
Experience indicates that use of structured packings has capacity/<br />
efficiency disadvantages in the higher-pressure (higher-flow-parameter)<br />
region.<br />
Zuiderweg and Nutter [IChemE Symp. Ser. 128, A481 (1992)]<br />
explain the loss of capacity/efficiency by a large degree of backmixing<br />
and vapor recycle at high flow parameters, promoted by the solid walls<br />
of the corrugated packing layers.<br />
SYSTEM LIMIT: THE ULTIMATE CAPACITY<br />
OF FRACTIONATORS<br />
Liquid drops of various sizes form in the gas-liquid contact zones of<br />
tray or packed towers. Small drops are easily entrained upward, but<br />
their volume is usually too small to initiate excessive liquid accumulation<br />
(<strong>flooding</strong>). When the gas velocity is high enough to initiate a<br />
massive carryover of the larger drops to the tray above, or upward<br />
in a packed bed, liquid accumulation (entrainment <strong>flooding</strong>) takes<br />
place. This flood can be alleviated by increasing the tray spacing or<br />
using more hole areas on trays or by using larger, more open packings.<br />
Upon further increase of gas velocity, a limit is reached when the<br />
superficial gas velocity in the gas-liquid contact zone exceeds the settling<br />
velocity of large liquid drops. At gas velocities higher than this,<br />
ascending gas lifts and carries over much of the tray or packing liquid,<br />
causing the tower to flood. This flood is termed system limit or ultimate<br />
capacity. This flood cannot be debottlenecked by improving<br />
packing size or shape, tray hole area, or tray spacing. The system limit<br />
gas velocity is a function only of physical properties and liquid flow<br />
rate. Once this limit is reached, the liquid will be blown upward. This<br />
is analogous to spraying water against a strong wind and getting<br />
drenched (Yangai, Chem. Eng., p. 120, November 1990). The system<br />
limit represents the ultimate capacity of the vast majority of existing<br />
trays and packings. In some applications, where very open packings<br />
(or trays) are used, such as in refinery vacuum towers, the system limit<br />
is the actual capacity limit.<br />
The original work of Souders and Brown [Ind. Eng. Chem. 26(1),<br />
98 (1934), Eq. (14-80)] related the capacity of fractionators due to<br />
entrainment <strong>flooding</strong> to the settling velocity of drops. The concept of<br />
system limit was advanced by Fractionation Research Inc. (FRI),<br />
whose measurements and model have recently been published (Fitz<br />
and Kunesh, Distillation 2001: Proceedings of Topical Conference,<br />
AIChE Spring National Meeting, Houston, Tex., 2001; Stupin, FRI<br />
Topical Report 34, 1965 available through Special Collection Section,<br />
Oklahoma <strong>State</strong> University Library, Stillwater, Okla.). Figure 14-75 is<br />
a plot of FRI system limit data (most derived from tests with dual-flow<br />
trays with 29 percent hole area and 1.2- to 2.4-m tray spacing) against<br />
liquid superficial velocity for a variety of systems (Stupin, loc. cit.,
14-82 EQUIPMENT FOR DISTILLATION, GAS ABSORPTION, PHASE DISPERSION, AND PHASE SEPARATION<br />
FIG. 14-75 Effect of liquid rate on ultimate capacity at higher liquid rates. (From Stupin, W. J., and H. Z. Kister, Trans. IChemE, vol. 81, Part A, p. 136,<br />
January 2003. Reprinted courtesy of IChemE.)<br />
1965). The data show a constant-slope linear dependence of the system<br />
limit C-factor on the liquid load. There was a shortage of data at<br />
low liquid loads. Later data (Fig. 14-76) showed that as the liquid load<br />
was reduced, the system limit Cs,ult stopped increasing and reached a<br />
limiting value. Based on this observation, Stupin and Kister [Trans.<br />
IChemE 81, Part A, p. 136 (January 2003)] empirically revised the<br />
earlier Stupin/FRI correlation to give<br />
σ<br />
�<br />
∆ρ<br />
C1 = 0.445(1 − F) � � 0.25<br />
σ<br />
�<br />
∆ρ<br />
C 2 = 0.356(1 − F) � � 0.25<br />
− 1.4LS<br />
(14-167)<br />
(14-168)<br />
FIG. 14-76 Comparison of original ultimate capacity correlation to test data,<br />
C 6/C7, 1.66 bar. (From Stupin, W. J., and H. Z. Kister, Trans. IChemE, vol. 81,<br />
Part A, p. 136, January 2003. Reprinted courtesy of IChemE.)<br />
where<br />
Cs,ult = smaller of C1 and C2<br />
(14-169)<br />
1<br />
F = ��<br />
(14-170)<br />
1 + 1.4(∆ρ/ρG) 1/2<br />
In Eqs. (14-167) through (14-170), Cs,ult is the system limit C-factor<br />
based on the tower superficial area [see Eq. (14-77) for C-factor definition];<br />
LS is the liquid superficial velocity, m/s; σ is the surface tension,<br />
mN/m; ∆ρ is the difference between the liquid and gas densities,<br />
kg/m 3 ; and ρG is the gas density, kg/m 3 .<br />
Stupin and Kister (loc. cit.) relate the flattening of the curve in Fig.<br />
14-76 at low liquid loads to the formation of more, smaller, easier-toentrain<br />
liquid drops when the liquid load is lowered beyond the limiting<br />
liquid load. It follows that devices that can restrict the formation of<br />
smaller drops may be able to approach the system limit capacity predicted<br />
by Stupin’s original equation [Eq. (14-167)] even at low liquid<br />
loads.<br />
The only devices capable of debottlenecking a tray system-limit<br />
device are those that introduce a new force that helps disentrain the<br />
vapor space. Devices that use centrifugal force (see “Centrifugal<br />
Force Deentrainment”) are beginning to make inroads into commercial<br />
distillation and have achieved capacities as high as 25 percent<br />
above the system limit. Even the horizontal vapor push (see “Truncated<br />
Downcomers/Forward-Push Trays”) can help settle the<br />
entrained drops, but to a much lesser extent. It is unknown whether<br />
the horizontal push alone can achieve capacities exceeding the system<br />
limit.<br />
WETTED-WALL COLUMNS<br />
Wetted-wall or falling-film columns have found application in masstransfer<br />
problems when high-heat-transfer-rate requirements are<br />
concomitant with the absorption process. Large areas of open surface
are available for heat transfer for a given rate of mass transfer in this<br />
type of equipment because of the low mass-transfer rate inherent in<br />
wetted-wall equipment. In addition, this type of equipment lends<br />
itself to annular-type cooling devices.<br />
Gilliland and Sherwood [Ind. Eng. Chem., 26, 516 (1934)] found<br />
that, for vaporization of pure liquids in air streams for streamline flow,<br />
kgDtube<br />
� Dg<br />
OTHER TOPICS FOR DISTILLATION AND GAS ABSORPTION EQUIPMENT 14-83<br />
FIG. 14-77 Mass-transfer rates in wetted-wall columns having turbulence promoters. To convert<br />
pound-moles per hour-square foot-atmosphere to kilogram-moles per second-square meter-atmosphere,<br />
multiply by 0.00136; to convert pounds per hour-square foot to kilograms per second-square meter, multiply<br />
by 0.00136; and to convert inches to millimeters, multiply by 25.4. (Data of Greenewalt and Cogan<br />
and Cogan, Sherwood, and Pigford, Absorption and Extraction, 2d ed., McGraw-Hill, New York, 1952.)<br />
PBM<br />
� P<br />
0.83 0.44 = 0.023NRe NSc (14-171)<br />
where Dg = diffusion coefficient, ft2 /h<br />
Dtube = inside diameter of tube, ft<br />
kg = mass-transfer coefficient, gas phase,<br />
lb⋅mol/(h⋅ft2 ) (lb⋅mol/ft3 )<br />
PBM = logarithmic mean partial pressure of inert gas, atm<br />
P = total pressure, atm<br />
NRe = Reynolds number, gas phase<br />
NSc = Schmidt number, gas phase<br />
Note that the group on the left side of Eq. (14-171) is dimensionless.<br />
When turbulence promoters are used at the inlet-gas section,<br />
an improvement in gas mass-transfer coefficient for absorption of<br />
water vapor by sulfuric acid was observed by Greenewalt [Ind. Eng.<br />
Chem., 18, 1291 (1926)]. A falling off of the rate of mass transfer<br />
below that indicated in Eq. (14-171) was observed by Cogan and<br />
Cogan (thesis, Massachusetts Institute of Technology, 1932) when a<br />
calming zone preceded the gas inlet in ammonia absorption (Fig.<br />
14-77).<br />
In work with the hydrogen chloride-air-water system, Dobratz,<br />
Moore, Barnard, and Meyer [Chem. Eng. Prog., 49, 611 (1953)]<br />
using a cocurrent-flow system found that Kg�G 1.8 (Fig. 14-78)<br />
instead of the 0.8 power as indicated by the Gilliland equation.<br />
Heat-transfer coefficients were also determined in this study. The<br />
radical increase in heat-transfer rate in the range of G = 30<br />
kg/(s⋅m2 ) [20,000 lb/(h⋅ft2 )] was similar to that observed by Tepe<br />
and Mueller [Chem. Eng. Prog., 43, 267 (1947)] in condensation<br />
inside tubes.<br />
FIG. 14-78 Mass-transfer coefficients versus average gas velocity—HCl<br />
absorption, wetted-wall column. To convert pound-moles per hour-square footatmosphere<br />
to kilogram-moles per second-square meter-atmosphere, multiply<br />
by 0.00136; to convert pounds per hour-square foot to kilograms per secondsquare<br />
meter, multiply by 0.00136; to convert feet to meters, multiply by 0.305;<br />
and to convert inches to millimeters, multiply by 25.4. [Dobratz et al., Chem.<br />
Eng. Prog., 49, 611 (1953).]
14-84 EQUIPMENT FOR DISTILLATION, GAS ABSORPTION, PHASE DISPERSION, AND PHASE SEPARATION<br />
Gaylord and Miranda [Chem. Eng. Prog., 53, 139M (1957)] using a<br />
multitube cocurrent-flow falling-film hydrochloric acid absorber for<br />
hydrogen chloride absorption found<br />
1.66(10−5 )<br />
��<br />
DtubeG<br />
� µ<br />
K g = � � (14.172)<br />
Mm 1.75<br />
where Kg = overall mass-transfer coefficient, (kg⋅mol)/(s⋅m2⋅atm) Mm = mean molecular weight of gas stream at inlet to tube<br />
Dtube = diameter of tube, m<br />
G = mass velocity of gas at inlet to tube, kg/(s⋅m2 )<br />
µ=viscosity of gas, Pa⋅s<br />
Note that the group DtubeG/µ is dimensionless. This relationship also<br />
satisfied the data obtained for this system, with a single-tube fallingfilm<br />
unit, by Coull, Bishop, and Gaylor [Chem. Eng. Prog., 45, 506<br />
(1949)].<br />
The rate of mass transfer in the liquid phase in wetted-wall columns is<br />
highly dependent on surface conditions. When laminar-flow conditions<br />
prevail without the presence of wave formation, the laminar-penetration<br />
theory prevails. When, however, ripples form at the surface, and they<br />
may occur at a Reynolds number exceeding 4, a significant rate of surface<br />
regeneration develops, resulting in an increase in mass-transfer rate.<br />
If no wave formations are present, analysis of behavior of the liquidfilm<br />
mass transfer as developed by Hatta and Katori [J. Soc. Chem.<br />
Ind., 37, 280B (1934)] indicates that<br />
where BF = (3uΓ/ρ 2 g) 1/3<br />
D�Γ<br />
k� = 0.422�� �<br />
ρBF 2<br />
Dl = liquid-phase diffusion coefficient, m 2 /s<br />
ρ=liquid density, kg/m 3<br />
Z = length of surface, m<br />
kl = liquid-film-transfer coefficient,<br />
(kg⋅mol)/[(s⋅m 2 )(kg⋅mol)/m 3 ]<br />
Γ=liquid-flow rate, kg/(s⋅m) based on wetted perimeter<br />
µ=viscosity of liquid, Pa⋅s<br />
g = gravity acceleration, 9.81 m/s 2<br />
FIG. 14-79 Liquid-film resistance in absorption of gases in wetted-wall columns. Theoretical lines are calculated for oxygen<br />
absorption in water at 55°F. To convert feet to meters, multiply by 0.3048; °C = 5 ⁄9 (°F − 32). (Sherwood and Pigford, Absorption<br />
and Extraction, 2d ed., McGraw-Hill, New York, 1952.)<br />
(14-173)
When Z is large or Γ/ρB F is so small that liquid penetration is complete,<br />
and<br />
k� = 11.800 D�/BF<br />
H � = 0.95 ΓB F/D �<br />
OTHER TOPICS FOR DISTILLATION AND GAS ABSORPTION EQUIPMENT 14-85<br />
(14-174)<br />
(14-175)<br />
A comparison of experimental data for carbon dioxide absorption<br />
obtained by Hatta and Katori (op. cit.), Grimley [Trans. Inst. Chem.<br />
Eng., 23, 228 (1945)], and Vyazov [Zh. Tekh. Fiz. (U.S.S.R.), 10,<br />
1519 (1940)] and for absorption of oxygen and hydrogen by Hodgson<br />
(S.M. thesis, Massachusetts Institute of Technology, 1949), Henley<br />
(B.S. thesis, University of Delaware, 1949), Miller (B.S. thesis, University<br />
of Delaware, 1949), and Richards (B.S. thesis, University of<br />
Delaware, 1950) was made by Sherwood and Pigford (Absorption<br />
and Extraction, McGraw-Hill, New York, 1952) and is indicated in<br />
Fig. 14-79.<br />
In general, the observed mass-transfer rates are greater than those<br />
predicted by theory and may be related to the development of surface<br />
rippling, a phenomenon which increases in intensity with increasing<br />
liquid path.<br />
Vivian and Peaceman [Am. Inst. Chem. Eng. J., 2, 437 (1956)]<br />
investigated the characteristics of the CO 2-H 2O and Cl 2-HCl, H 2O<br />
system in a wetted-wall column and found that gas rate had no effect<br />
on the liquid-phase coefficient at Reynolds numbers below 2200.<br />
Beyond this rate, the effect of the resulting rippling was to increase<br />
significantly the liquid-phase transfer rate. The authors proposed a<br />
behavior relationship based on a dimensional analysis but suggested<br />
caution in its application concomitant with the use of this type of relationship.<br />
Cognizance was taken by the authors of the effects of column<br />
length, one to induce rippling and increase of rate of transfer,<br />
one to increase time of exposure which via the penetration theory<br />
decreases the average rate of mass transfer in the liquid phase. The<br />
equation is<br />
k�h<br />
� D�<br />
= 0.433� � 1/2<br />
µ�<br />
�<br />
ρ�D� � � 1/6<br />
� � 0.4<br />
2 3 ρ� gh 4Γ<br />
�<br />
µ� 2<br />
where D � = diffusion coefficient of solute in liquid, ft 2 /h<br />
g = gravity-acceleration constant, 4.17 � 10 8 ft/h 2<br />
h = length of wetted wall, ft<br />
k � = mass-transfer coefficient, liquid phase, ft/h<br />
� µ�<br />
(14-176)<br />
TABLE 14-17 Relative Fabricated Cost for Metals<br />
Used in Tray-Tower Construction*<br />
Relative cost<br />
per ft2 of tray<br />
area (based on<br />
Materials of construction carbon steel = 1)<br />
Sheet-metal trays<br />
Steel 1<br />
4–6% chrome—a moly alloy steel 2.1<br />
11–13% chrome type 410 alloy steel 2.6<br />
Red brass 3<br />
Stainless steel type 304 4.2<br />
Stainless steel type 347 5.1<br />
Monel 7.0<br />
Stainless steel type 316 5.5<br />
Inconel 8.2<br />
Cast-iron trays 2.8<br />
*Peters and Timmerhaus, Plant Design and Economics for Chemical Engineers,<br />
4th ed., McGraw-Hill, New York, 1991. To convert cost per square foot to<br />
cost per square meter, multiply by 10.76.<br />
Γ=mass rate of flow of liquid, lb/(h)(ft of periphery)<br />
µ � = viscosity of liquid, lb/(ft)(h)<br />
ρ� = density of liquid, lb/ft 3<br />
The equation is dimensionless.<br />
The effect of chemical reaction in reducing the effect of variation<br />
of the liquid rate on the rate of absorption in the laminar-flow<br />
regime was illustrated by the evaluation of the rate of absorption of<br />
chlorine in ferrous chloride solutions in a wetted-wall column by<br />
Gilliland, Baddour, and White [Am. Inst. Chem. Eng. J., 4, 323<br />
(1958)].<br />
Flooding in Wetted-Wall Columns When gas and liquid are in<br />
counterflow in wetted-wall columns, <strong>flooding</strong> can occur at high gas<br />
rates. Methods for calculating this flood are given in “Upper Limit<br />
Flooding in Vertical Tubes.” In the author’s experience, Eq. (14-204)<br />
has had an excellent track record for calculating <strong>flooding</strong> in these<br />
columns.<br />
COLUMN COSTS<br />
Estimation of column costs for preliminary process evaluations<br />
requires consideration not only of the basic type of internals but also of<br />
their effect on overall system cost. For a distillation system, for example,<br />
the overall system can include the vessel (column), attendant<br />
structures, supports, and foundations; auxiliaries such as reboiler, condenser,<br />
feed heater, and control instruments; and connecting piping.<br />
The choice of internals influences all these costs, but other factors<br />
influence them as well. A complete optimization of the system requires<br />
a full-process simulation model that can cover all pertinent variables<br />
influencing economics.<br />
Cost of Internals Installed costs of trays may be estimated from<br />
Fig. 14-80, with corrections for tray material taken from Table 14-17.<br />
For two-pass trays the cost is 15 to 20 percent higher. Approximate<br />
costs of random packing materials may be obtained from Table 14-18,<br />
but it should be recognized that, because of competition, there can be<br />
significant variations in these costs from vendor to vendor. Also, packings<br />
sold in very large quantities carry discounts. In 1995, costs of<br />
structured packings, made from sheet metal, averaged $90 to $110 per<br />
cubic foot, but the need for special distributors and redistributors can<br />
double the cost of structured-packings on a volumetric basis. Note<br />
TABLE 14-18<br />
January 1990<br />
Costs of Random Packings, Uninstalled,<br />
Prices in dollars per ft3 , 100 ft3 orders, f.o.b. manufacturing plant<br />
Size, in, $/ft3 1 1a2 3<br />
Raschig rings<br />
Chemical porcelain 12.8 10.3 9.4 7.8<br />
Carbon steel 36.5 23.9 20.5 16.8<br />
Stainless steel 155 117 87.8 —<br />
Carbon<br />
Intalox saddles<br />
52 46.2 33.9 31.0<br />
Chemical stoneware 17.6 13.0 11.8 10.7<br />
Chemical porcelain 18.8 14.1 12.9 11.8<br />
Polypropylene<br />
Berl saddles<br />
21.2 — 13.1 7.0<br />
Chemical stoneware 27.0 21.0 — —<br />
Chemical porcelain<br />
Pall rings<br />
33.5 21.5 15.6 —<br />
Carbon steel 29.3 19.9 18.2 —<br />
Stainless steel 131 99.0 86.2 —<br />
Polypropylene 21.2 14.4 13.1<br />
Peters and Timmerhaus, Plant Design and Economics for Chemical Engineers,<br />
4th ed., McGraw-Hill, New York, 1991. To convert cubic feet to cubic<br />
meters, multiply by 0.0283; to convert inches to millimeters, multiply by 25.4;<br />
and to convert dollars per cubic foot to dollars per cubic meter, multiply by 35.3.
14-86 EQUIPMENT FOR DISTILLATION, GAS ABSORPTION, PHASE DISPERSION, AND PHASE SEPARATION<br />
Installed cost, dollars/tray<br />
10 4<br />
10 3<br />
10 2<br />
Quantity factors apply to all types of trays<br />
Bubble-cap trays<br />
(stainless steel)<br />
that for Fig. 14-80 and Table 14-17, the effective cost date is January<br />
1990, with the Marshall and Swift cost index being taken as 904.<br />
As indicated above, packed column internals include liquid distributors,<br />
packing support plates, redistributors (as needed), and holddown<br />
plates (to prevent movement of packing under flow conditions). Costs of<br />
these internals for columns with random packing are given in Fig. 14-81,<br />
based on early 1976 prices, and a Marshall and Swift cost index of 460.<br />
1<br />
2<br />
3<br />
4<br />
5<br />
6<br />
7<br />
3.00<br />
2.80<br />
2.65<br />
2.50<br />
2.30<br />
2.15<br />
2.00<br />
8<br />
9<br />
10<br />
11<br />
12<br />
13<br />
14<br />
1.80<br />
1.65<br />
1.50<br />
1.45<br />
1.40<br />
1.35<br />
1.30<br />
15<br />
16<br />
17<br />
18<br />
19<br />
20<br />
30<br />
40+<br />
29<br />
39<br />
Valve trays<br />
(stainless steel)<br />
1.25<br />
1.20<br />
1.15<br />
1.10<br />
1.05<br />
1.00<br />
0.98<br />
0.97<br />
Stamped turbogrid<br />
trays (stainless steel)<br />
Valve trays<br />
(carbon steel)<br />
Sieve trays<br />
(stainless steel)<br />
Sieve trays<br />
(carbon steel)<br />
or<br />
Bubble-cap trays<br />
(carbon steel)<br />
1 2 3 4 5 6 7 8 9 10 11 12 13 14 15<br />
Tower diameter, ft<br />
FIG. 14-80 Cost of trays. Price includes tray deck, valves, bubble caps, risers, downcomers, and structural-steel<br />
parts. The stainless steel designated is type 410 (Peters and Timmerhaus, Plant Design and Economics for Chemical<br />
Engineers, 4th ed., McGraw-Hill, New York, 1991).<br />
GENERAL REFERENCES: For an overall discussion of gas-liquid breakup<br />
processes, see Brodkey, The Phenomena of Fluid Motions, Addison-Wesley,<br />
Reading, Massachusetts, 1967. For a discussion of atomization devices and how<br />
they work, see Masters, Spray Drying Handbook, 5th ed., Wiley, New York,<br />
1991; and Lefebvre, Atomization and Sprays, Hemisphere, New York, 1989. A<br />
beautifully illustrated older source is Dombrowski and Munday, Biochemical<br />
and Biological Engineering Science, vol. 2, Academic Press, London, 1968, pp.<br />
209–320. Steinmeyer [Chem. Engr. Prog., 91(7), 72–80 (1995)] built on Hinze’s<br />
work with turbulence and showed that several atomization processes follow the<br />
common theme of breakup of large droplets due to turbulence in the gas phase.<br />
Turbulence in turn correlates with power dissipation per unit mass. In the text<br />
below, correlations referring to power/mass are taken from this source. For a<br />
survey on fog formation, see Amelin, Theory of Fog Formation, Israel Program<br />
for Scientific Translations, Jerusalem, 1967.<br />
PHASE DISPERSION<br />
Cost of Column The cost of the vessel, including heads,<br />
skirt, nozzles, and ladderways, is usually estimated on the basis<br />
of weight. Figure 14-82 provides early 1990 cost data for the<br />
shell and heads, and Fig. 14-83 provides 1990 cost data for<br />
connections. For very approximate estimates of complete<br />
columns, including internals, Fig. 14-84 may be used. As for<br />
Figs. 14-82 and 14-83, the cost index is 904.<br />
BASICS OF INTERFACIAL CONTACTORS<br />
Steady-<strong>State</strong> Systems: Bubbles and Droplets Bubbles are<br />
made by injecting vapor below the liquid surface. In contrast,<br />
droplets are commonly made by atomizing nozzles that inject liquid<br />
into a vapor. Bubble and droplet systems are fundamentally different,<br />
mainly because of the enormous difference in density of the<br />
injected phase. There are situations where each is preferred. Bubble<br />
systems tend to have much higher interfacial area as shown by<br />
Example 16 contrasted with Examples 14 and 15. Because of their<br />
higher area, bubble systems will usually give a closer approach to<br />
equilibrium.
(a)<br />
PHASE DISPERSION 14-87<br />
FIG. 14-81 Cost of internal devices for columns containing random packings. (a) Holddown plates and support plates. (b) Redistributors. [Pikulik and Diaz,<br />
Chem. Eng., 84(21), 106 (Oct. 10, 1977).]<br />
FIG. 14-82 Fabricated costs and installation time of towers. Costs are for shell<br />
with two heads and skirt, but without trays, packing, or connections. (Peters and<br />
Timmerhaus, Plant Design and Economics for Chemical Engineers, 4th ed.,<br />
McGraw-Hill, New York, 1991.)<br />
FIG. 14-83 Approximate installed cost of steel-tower connections. Values<br />
apply to 2070-kPa connections. Multiply costs by 0.9 for 1035-kPa (150-lb) connections<br />
and by 1.2 for 4140-kPa (600-lb) connections. To convert inches to millimeters,<br />
multiply by 25.4; to convert dollars per inch to dollars per centimeter,<br />
multiply by 0.394. (Peters and Timmerhaus, Plant Design and Economics for<br />
Chemical Engineers, 4th ed., New York, McGraw-Hill, 1991.)<br />
(b)
14-88 EQUIPMENT FOR DISTILLATION, GAS ABSORPTION, PHASE DISPERSION, AND PHASE SEPARATION<br />
FIG. 14-84 Cost of towers including installation and auxiliaries. To convert<br />
inches to millimeters, multiply by 25.4; to convert feet to meters, multiply by<br />
0.305; and to convert dollars per foot to dollars per meter, multiply by 3.28.<br />
(Peters and Timmerhaus, Plant Design and Economics for Chemical Engineers,<br />
4th ed., McGraw-Hill, New York, 1991.)<br />
However, droplet systems can enable much higher energy input<br />
(via gas phase pressure drop in cocurrent systems) and, as a result,<br />
dominate applications where a quick quench is needed. See Examples<br />
21 and 22. Conversely, droplet systems can also be designed for very<br />
low pressure drop which is advantageous in applications such as vacuum<br />
condensers.<br />
Unstable Systems: Froths and Hollow Cone Atomizing<br />
Nozzles We usually think of interfacial contact as a steady-state<br />
system of raining droplets or rising bubbles, but some of the most efficient<br />
interfacial contactors take advantage of unstable interfacial<br />
geometry. The most common is the distillation tray which operates<br />
with a wild mix of bubbles, jets, films, and droplets. The mix is often<br />
described as froth. Gas pressure drop provides the energy to create<br />
the froth.<br />
A variant on the froth contact is the reverse jet contactor (Example<br />
22), which can be considered as an upside-down distillation tray, operated<br />
above the <strong>flooding</strong> velocity in cocurrent flow of gas and liquid. It<br />
is limited to one stage.<br />
An entirely different unstable contactor involves the thin expanding<br />
liquid film produced by a hollow cone spray nozzle. Because of fresh surface<br />
and the thinness of the film, this can give very high transfer for liquid-limited<br />
systems. Two applications are direct contact condensation<br />
and removal of volatile components from a high-boiling residual liquid.<br />
Surface Tension Makes Liquid Sheets and Liquid Columns<br />
Unstable Surface tension is the energy required to make an increment<br />
of interfacial surface. A sheet or column of liquid has more surface<br />
than a sphere, hence surface tension converts sheets and columns<br />
to droplets. See Fig. 14-86.<br />
There are many different atomizers, but the underlying principle of<br />
all is the same—to first generate a flat sheet or a liquid column. Liquid<br />
sheets and columns are unstable, a small surface disturbance on either<br />
will propagate, and the liquid will reshape itself into droplets. The key<br />
property in controlling this process is surface tension. Surface tension<br />
gets a high exponent in all the atomization correlations.<br />
Little Droplets and Bubbles vs. Big Droplets and Bubbles—<br />
Coalescence vs. Breakup When big drops are subjected to shear<br />
forces, as in falling rain, the droplets are distorted; and if the distor-<br />
tions are great enough, the big droplets break into little ones. This is<br />
why raindrops never exceed a certain size. A variant on this is breakup<br />
in highly turbulent systems such as in high-velocity quench systems or<br />
pneumatic nozzles. Here the droplets are distorted by the energy of<br />
the turbulent eddies.<br />
But little droplets and bubbles have more surface per unit of liquid<br />
than big ones. Hence little droplets tend to coalesce into big ones, and<br />
will grow in size if given enough quiet time.<br />
While the primary difficulty is estimating the interfacial area due to<br />
the unstable interface, a secondary problem is that freshly made,<br />
unstable surface gives higher transfer than older, more stable surface.<br />
Empirical Design Tempered by Operating Data The net of<br />
these is that interfacial area is difficult to predict and interfacial contactors<br />
are difficult to design.<br />
Prediction methods are given below but should always be tempered<br />
by operating experience.<br />
INTERFACIAL AREA—IMPACT OF DROPLET<br />
OR BUBBLE SIZE<br />
Transfer is aided by increased interfacial area. Interfacial area per unit<br />
volume aD of a single droplet or bubble is inversely proportional to the<br />
diameter of the droplet or bubble D.<br />
aD = 6/D (14-177)<br />
To estimate the total interfacial area in a given volume, the ad value is<br />
multiplied by the fractional holdup of dispersed phase in the total<br />
volume.<br />
a = aD(ΦD) (14-178)<br />
where a = interfacial area/volume and ΦD = fraction of volume in dispersed<br />
phase = holdup. Fractional holdup in a continuous process<br />
depends on the velocities of the two phases, as if they were flowing by<br />
themselves.<br />
ΦD = (dispersed phase volume)/(volume of dispersed and<br />
continuous phases)<br />
Example 14: Interfacial Area for Droplets/Gas in Cocurrent<br />
Flow For equal mass flow of gas and liquid and with gas density 0.001 of liquid<br />
density, the gas velocity in cocurrent flow will be 1000 times the liquid velocity.<br />
This sets Φ D.<br />
ΦD = 1/(1 + 1000) = 0.00099<br />
If the droplets are 500 µm in diameter, Eqs. (14-177) and (14-178) give<br />
a = (6/0.0005)(0.00099) = 12 m2 /m3 If the droplets are 100 µm in diameter, Eqs. (14-177) and (14-178) give<br />
a = (6/0.0001)(0.00099) = 60 m2 /m3 Example 15: Interfacial Area for Droplets Falling in a Vessel<br />
Droplet systems rarely exceed a ΦD value of 0.01. At this low level, ΦD in a lowvelocity<br />
countercurrent contactor can be approximated by Eq. (14-179).<br />
ΦD = UL/(Ut − UG) (14-179)<br />
where UL = liquid superficial velocity<br />
Ut = terminal velocity of droplet<br />
UG = gas superficial velocity<br />
With a gas superficial velocity of 1.5 m/s, for equal mass flow of gas and liquid,<br />
with gas density 0.001 of liquid density, and with 500-µm-diameter droplets<br />
falling at a terminal settling of 2.5 m/s, Eq. (14-179) gives a fractional holdup of<br />
liquid of<br />
ΦD = (0.001)1.5/(2.5 − 1.5) = 0.0015<br />
Equations (14-177) and (14-178) then give<br />
a = (6/0.0005)(0.0015) = 18 m 2 /m 3<br />
Example 16: Interfacial Area for Bubbles Rising in a Vessel<br />
For bubble systems (gases dispersed in liquids) fractional holdup can approach<br />
0.5 as shown by Fig. 14-104. However, before reaching this holdup, the bubble<br />
systems shift to an unstable mix of bubbles and vapor jets. Hence an exact
comparison to Example 14 isn’t possible because at the 1.5 m/s velocity of<br />
Example 14, the system becomes a froth. But at about one-fifth the velocity of<br />
Example 14, an estimate of interfacial area is possible.<br />
If the bubble size is 10,000 µm and fractional holdup is 0.4, Eqs. (14-177) and<br />
(14-178) give an interfacial area of<br />
a = (6/0.01)(0.4) = 240 m 2 /m 3<br />
Measured interfacial area in distillation trays is consistent with this high value.<br />
Note the much higher interfacial area than in the droplet systems of<br />
Examples 14 and 15. The higher interfacial area when the gas is dispersed<br />
explains why bubbling and froth systems often give better performance<br />
than droplet systems. The big difference in interfacial area stems from the<br />
much larger volume per unit of mass of gas, i.e., lower density of the gas<br />
than the liquid.<br />
RATE MEASURES, TRANSFER UNITS, APPROACH<br />
TO EQUILIBRIUM, AND BYPASSING<br />
What Controls Mass/Heat Transfer: Liquid or Gas Transfer<br />
or Bypassing Either gas side or liquid side of the interface can be<br />
controlling.<br />
Liquid-Controlled In fractionation systems with high viscosity<br />
or component relative volatility that greatly exceeds 1, the liquid side<br />
will be controlling. This is clearly illustrated by Fig. 14-47 which<br />
shows a sharp decline in efficiency with either a rise in liquid viscosity<br />
or a rise in component relative volatility.<br />
Note that high component relative volatility means the same<br />
thing as sparingly soluble. Oxygen dissolving in a fermentation<br />
reactor is an example of a system being liquid-controlled due to a<br />
sparingly soluble gas. Another application that is liquid-controlled<br />
is the removal of high relative volatility components out of residual<br />
oil.<br />
Still another case where liquid controls is in condensing a pure<br />
vapor, as in Example 23, or absorbing a pure gas, as in Example 24.<br />
Gas-Controlled The gas side dominates in gas cooling applications.<br />
An example is the quenching of a furnace effluent with a vaporizing<br />
liquid. In this application the liquid is nearly uniform in<br />
temperature. Restated, the reduction in driving force across the liquid<br />
side of the interface is unimportant.<br />
Other applications that are gas-side-controlled include removal of a<br />
component such as NH3 from a gas by using an acidic liquid, or<br />
removing a component such as SO2 from a gas with a basic liquid. See<br />
Examples 19 through 22.<br />
Bypassing-Controlled Trayed or packed columns operate with<br />
countercurrent flow and can achieve many equilibrium stages in<br />
series by good distribution of gas and liquid, and careful control of<br />
details. Other devices such as sprays are vulnerable to bypassing and<br />
are limited to one equilibrium stage.<br />
Rate Measures for Interfacial Processes Terminology used<br />
for reporting rate data can be confusing. Normally rate data are<br />
reported on a volumetric basis with transfer rate and effective area<br />
combined. For example, kLa denotes mass-transfer data per unit volume.<br />
The L subscript means it is referenced to the molar concentration<br />
difference between the interface and the bulk liquid. This is<br />
commonly used on data involving a sparingly soluble (high relative<br />
volatility) component. Note that the lowercase k means the data deal<br />
only with the resistance in the liquid phase.<br />
Less commonly, data are given as kGa. The G subscript means it is<br />
referenced to the molar concentration difference between the interface<br />
and the gas. This might be used for data on absorbing a gas such<br />
as NH3 by a highly acidic liquid. Note that kGa only deals with the<br />
resistance in the gas phase.<br />
When one is dealing with direct contact heat transfer, the corresponding<br />
terms are hLa and hGa. Here the driving force is the temperature<br />
difference. The L subscript means that we are dealing with a<br />
liquid-limited process such as condensing a pure liquid. How to convert<br />
kLa data to an hLa value is illustrated by Example 23.<br />
There are ways to combine the liquid and gas resistance to get an<br />
overall transfer rate such as KGa (as denoted by the uppercase K).<br />
However, data are rarely reported in this form.<br />
PHASE DISPERSION 14-89<br />
Approach to Equilibrium Although rate measures such as k Ga<br />
and h Ga are often cited in the literature, they are often not as useful to<br />
designers as the simpler concept of approach to equilibrium. Approach<br />
to equilibrium compares the transfer between liquid and gas phases to<br />
the best possible that could be achieved in a single backmixed equilibrium<br />
stage.<br />
Approach to equilibrium is easy to understand and easy to apply.<br />
Examples 17 through 23 illustrate its use.<br />
Example 17: Approach to Equilibrium—Perfectly Mixed, Complete<br />
Exchange This would be approximated by a very long pipeline contactor<br />
where an acidic aqueous stream is injected to cool the gas and remove NH 3.<br />
If the adiabatic saturation temperature of the gas is 70°C, at the exit of the<br />
contactor, the gas would be cooled to 70°C.<br />
Similarly, at the exit of the contactor, the NH 3 in the gas would be zero,<br />
regardless of the initial concentration.<br />
Example 18: Approach to Equilibrium—Complete Exchange<br />
but with 10 Percent Gas Bypassing A spray column is used, and an<br />
acidic liquid rains down on the gas of Example 17. If the initial NH3 is 1000 ppm<br />
and 10 percent of the gas bypasses, the NH3 in the exit gas would be<br />
0.1(1000) = 100 ppm<br />
Similarly, if the gas enters at 120°C, at the exit we would find 10 percent of the<br />
differential above the adiabatic saturation temperature. For an adiabatic saturation<br />
temperature of 70°C, the exit gas temperature would be<br />
70 + 0.1(120 − 70) = 75°C<br />
Approach to Equilibrium—Finite Contactor with No Bypassing<br />
When there is no bypassing, the measure that sets the approach<br />
is the ratio of change to driving force. This ratio is called the number<br />
of transfer units NG. It is dimensionless. For heat-transfer applications,<br />
it can be envisioned as a conventional heat exchanger where a<br />
vaporizing liquid cools a gas:<br />
No. of gas-phase transfer units = �� =NG (14-180)<br />
(TG − TL)av<br />
Where T G = gas temperature and T L = liquid temperature. The<br />
number of transfer units N G can also be calculated as the capability<br />
for change divided by the thermal capacitance of the flowing<br />
streams.<br />
N G =<br />
(gas contact time)(hGa)<br />
= ���<br />
(14-181)<br />
ρGcG<br />
TG,out − TG,in<br />
(system volume)(hGa)<br />
���<br />
(volumetric flow rate)ρGcG<br />
where a = interfacial area per unit volume<br />
h G = heat-transfer coefficient from interface to gas<br />
ρ G = gas density<br />
c G = gas specific heat<br />
Note that in the above, performance and properties all refer to the<br />
gas, which is appropriate when dealing with a gas-limited transfer<br />
process.<br />
This leads to a way to estimate the approach to equilibrium.<br />
E = 1 − e−N G (14-182)<br />
where E = “approach to equilibrium” fractional removal of NH3 or<br />
fractional approach to adiabatic liquid temperature<br />
N G = number of transfer units calculated relative to gas flow<br />
Example 19: Finite Exchange, No Bypassing, Short Contactor<br />
A short cocurrent horizontal pipeline contactor gives 86 percent removal of<br />
NH 3. There is no bypassing because of the highly turbulent gas flow and injection<br />
of liquid into the center of the pipe. What would we expect the exit gas temperature<br />
to be?
14-90 EQUIPMENT FOR DISTILLATION, GAS ABSORPTION, PHASE DISPERSION, AND PHASE SEPARATION<br />
Equation (14-182) says that the backcalculated NG is 2:<br />
NG =−ln(1 − 0.86) = 2<br />
For diffusing gases of similar molecular weight, the properties that control<br />
heat transfer follow the same rules as those that control mass transfer. As a<br />
result, the NH3 scrubbing and gas cooling processes achieve similar approaches<br />
to equilibrium.<br />
For an entry temperature of 120°C and an adiabatic saturation temperature<br />
of 70°C, the expected outlet temperature would be<br />
70 + (1 − 0.86)(120 − 70) = 77°C<br />
This looks like a powerful concept, but its value is limited due to uncertainty<br />
in estimating hGa. Both h G and a are difficult to estimate due to<br />
dependence on power dissipation as discussed below. The primary<br />
value of the N G concept is in estimating an expected change from baseline<br />
data as in the comparison of Example 19 with Example 20.<br />
Example 20: A Contactor That Is Twice as Long, No Bypassing<br />
If we double the length of the pipeline contactor, double the effective<br />
contact area, and double the number of transfer units to 4, what do we expect<br />
for performance?<br />
For NG = 4,<br />
E = 1 − e−4 = 0.982<br />
The NH3 in the exit gas would be expected to drop to<br />
(1 − 0.982)(1000) = 18 ppm<br />
and the expected outlet temperature would be<br />
70 + (1 − 0.982)(120 − 70) = 70.9°C<br />
If we double the length again, we increase the number of transfer units to 8 and<br />
achieve an approach of<br />
E = 1 − e −8 = 0.9997<br />
The outlet temperature would be<br />
70 + (1 − 0.9997)(120 − 70) = 70.015°C<br />
Similarly the NH3 in the exit gas would be<br />
(1 − 0.9997)(1000) = 0.3 ppm<br />
Note that this approximates the exit condition of Example 17.<br />
Transfer Coefficient—Impact of Droplet Size The transfer<br />
coefficients increase as the size of droplets decreases. This is so<br />
because the transfer process is easier if it only has to move mass or<br />
heat a shorter distance (i.e., as the bubble or droplet gets smaller).<br />
In the limiting case of quiescent small bubbles or droplets, the<br />
transfer coefficients vary inversely with average bubble or droplet<br />
diameter. For example, in heat transfer from a droplet interface to a<br />
gas, the minimum value is<br />
hG,min = heat transfer coefficient from interface to gas = 2kG/D<br />
(14-183)<br />
where kG = gas thermal conductivity and<br />
D = droplet diameter.<br />
IMPORTANCE OF TURBULENCE<br />
The designer usually has control over the size of a droplet. As discussed<br />
below, several of the correlations show that droplet diameter<br />
varies with turbulent energy dissipation. For example, Eqs. (14-190)<br />
and (14-201) suggest that in droplet systems<br />
D ∝ {1/(gas velocity)] 1.2<br />
and hence from Eq. (14-178)<br />
a ∝ 1/D ∝ (gas velocity) 1.2 (14-184)<br />
However, just looking at the impact of velocity on droplet size underestimates<br />
the velocity impact because turbulence gives higher transfer<br />
than Eq. (14-183) predicts. Transfer coefficients increase as the mixing<br />
adjacent to the surface increases. This mixing depends on the<br />
energy dissipated into the phases. To a first approximation this transfer<br />
from droplets increases with local power dissipation raised to the<br />
0.2 power.<br />
h G,turbulent ∝ (power dissipated) 0.2<br />
and since power dissipation per unit volume increases with (velocity) 3 ,<br />
h G,turbulent ∝ (velocity) 0.6 (14-185)<br />
The combined effect on interfacial area and on the transfer coefficient<br />
is that the effective transfer increases greatly with gas velocity. From<br />
Eqs. (14-178) and (14-185)<br />
h Ga turbulent ∝ (velocity) 1.8 (14-186)<br />
For quenching operations, this means that even though residence<br />
time is cut as gas velocity goes up, the effective approach to equilibrium<br />
increases. Since the volume for a given length of pipe falls with<br />
(velocity) −1 , the expected number of transfer units NG in a given length<br />
of pipe increases with (velocity) 0.8 .<br />
See Example 21.<br />
NG,turbulent ∝ (hGaturbulent)(volume) ∝ (velocity) 0.8 (14-187)<br />
EXAMPLES OF CONTACTORS<br />
High-Velocity Pipeline Contactors High-velocity cocurrent<br />
flow can give more power input than any other approach. This is<br />
critical when extremely high rates of reaction quenching are<br />
needed.<br />
Example 21: Doubling the Velocity in a Horizontal Pipeline<br />
Contactor—Impact on Effective Heat Transfer Velocity in pipeline<br />
quench systems often exceeds 62 m/s (200 ft/s). Note that this is far above the<br />
<strong>flooding</strong> velocity in distillation packing, distillation trays, or gas-sparged reactors.<br />
There are few data available to validate performance even though liquid<br />
injection into high-velocity gas streams has been historically used in quenching<br />
reactor effluent systems. However, the designer knows the directional impact of<br />
parameters as given by Eq. (14-187).<br />
For example, if a 10-ft length of pipe gives a 90 percent approach to equilibrium<br />
in a quench operation, Eq. (14-182) says that the backcalculated NG is<br />
2.303:<br />
NG −ln(1 − 0.9) =2.303<br />
Equation (14-187) says if we double velocity but retain the same length, we<br />
would expect an increase of NG to 4.0.<br />
NG = 2.303(2) 0.8 = 4<br />
and<br />
E = 1 − e−4 = 0.982<br />
Restated, the approach to equilibrium rises from 90 percent to greater than 98<br />
percent even though the contact time is cut in half.<br />
Vertical Reverse Jet Contactor A surprisingly effective<br />
modification of the liquid injection quench concept is to inject the<br />
liquid countercurrent upward into a gas flowing downward, with<br />
the gas velocity at some multiple of the <strong>flooding</strong> velocity defined<br />
by Eq. (14-203). The reverse jet contactor can be envisioned as an<br />
upside-down distillation tray. For large gas volumes, multiple<br />
injection nozzles are used. One advantage of this configuration is<br />
that it minimizes the chance of liquid or gas bypassing. Another<br />
advantage is that it operates in the froth region which generates<br />
greater area per unit volume than the higher-velocity cocurrent<br />
pipeline quench.<br />
The concept was first outlined in U.S. Patent 3,803,805 (1974) and<br />
was amplified in U.S. Patent 6,339,169 (2002). The 1974 patent presents<br />
data which clarify that the key power input is from the gas stream.<br />
A more recent article discusses use of the reverse jet in refinery offgas<br />
scrubbing for removal of both SO 2 and small particles [Hydrocarbon
Processing, 84,(9), 99–106 (2005)]. This article cites downward gas<br />
velocities in the range of 10 to 37 m/s and notes gas pressure drop in the<br />
range of 6 to 20 in of water. Removals of SO 2 and fine particles were both<br />
close to 99 percent. The froth produced by the contactor reverses direction,<br />
flows down, and is largely disengaged in a vessel mounted below.<br />
Example 22: The Reverse Jet Contactor, U.S. Patent 6,339,169<br />
This patent deals with rapid cooling and removal of NH 3 from gas exiting an<br />
acrylonitrile reactor. Liquid is injected upward. The claims suggest downwardflowing<br />
gas velocity is between 20 and 25 m/s.<br />
Gas cooling is reported to be largely complete in 0.1 s. NH 3 removal at the<br />
exit of the contactor is reported to be greater than 99 percent. The gas is cooled<br />
by water vaporizing from the injected liquid, with total water circulated being in<br />
the range of 100 times that evaporated.<br />
Since the gas cooling and NH 3 scrubbing move in parallel, they would be<br />
expected to achieve nearly the same approach to equilibrium as long as the pH<br />
of all the liquid stays below a key threshold. The great excess of liquid enables this.<br />
The key is high froth interfacial area per unit volume.<br />
Simple Spray Towers The other extreme to the pipeline and<br />
reverse jet contactors is an open vessel where spray is injected down into<br />
upflowing gas to form a rain of liquid. The advantage of simple spray towers<br />
is that they give low gas pressure drop and also tend to be nonfouling.<br />
Even though gas velocity is well below <strong>flooding</strong> velocity, the finer<br />
droplets of the spray will be entrained. Note the wide spectrum of<br />
particle sizes shown by Fig. 14-88.<br />
However, as shown by Examples 23 and 24, they can be extremely<br />
effective in liquid-limited systems.<br />
Bypassing Limits Spray Tower Performance in Gas Cooling<br />
As shown by Example 18, only modest performance is achieved in gaslimited<br />
systems. The modest efficiency is due to gas bypassing. Tall<br />
spray towers are not effective countercurrent devices. Even with<br />
nominally falling droplets, there is a great deal of backmixing because<br />
there is no stabilizing pressure drop as there would be in a column<br />
filled with packing or trays. A packet of droplets weighs more than a<br />
gas-filled space. The result is that the volume that is filled with the<br />
most droplets moves down relative to all other volumes. Similarly the<br />
gas volume that has fewest droplets moves up more quickly than<br />
other volumes. This generates bypassing of liquid and gas. The flows<br />
are driven by the rain of droplets themselves. Anything less than perfect<br />
distribution of liquid and gas will induce a dodging action<br />
between the flowing streams. Most designers limit expectations for<br />
spray contactors to some fraction of a single equilibrium stage<br />
regardless of height.<br />
One approach that has been employed to get better distribution in<br />
spray systems is to mount a single large-capacity nozzle in the center<br />
of the vessel with radial discharge of large droplets. The droplets are<br />
discharged with enough velocity to penetrate to the vessel walls.<br />
Spray Towers in Liquid-Limited Systems—Hollow Cone<br />
Atomizing Nozzles If we follow an element of liquid leaving a hollow<br />
cone hydraulic spray nozzle, the sequence is a rapidly thinning<br />
cone followed by wave development, followed by shedding of ligaments,<br />
followed by breakage of the ligaments into droplets. See Fig.<br />
14-86. The sequence gives high transfer for liquid-limited systems.<br />
This results from the thin sheet of the hollow cone as well as the creation<br />
of fresh surface in the breakup process.<br />
Devolatilizers Devolatilization systems are liquid-limited due to<br />
the combination of high liquid viscosity and removal of a component<br />
with high relative volatility. Simpson and Lynn [AIChE J., 23 (5),<br />
666–673 (1977)] reported oxygen stripping from water at 98 percent<br />
complete, in less than 1 ft of contact. The concept has been employed<br />
for residual devolatilization in refineries.<br />
Spray Towers as Direct Contact Condensers Similarly spray<br />
contactors can be highly effective for direct contact condensers, which<br />
are also liquid-limited. The high transfer rate in the initial formation<br />
of sprays is the key. Kunesh [Ind. Engr. Chem. Res., 32, 2387–2389<br />
(1993)] reported a 97 percent approach to equilibrium in a hydrocarbon<br />
system in the 6-in space below the discharge of a row of hollow<br />
cone spray nozzles.<br />
Other results on heat transfer in a large spray condenser are given<br />
by Waintraub et al. (“Removing Packings from Heat Transfer Sections<br />
of Vacuum Towers,” AIChE 2005 Spring National Meeting, Proceed-<br />
PHASE DISPERSION 14-91<br />
ings of Topical Conference, April 10, 2005, Atlanta, p. 79). The paper<br />
highlights the importance of good gas and liquid distribution.<br />
Converting Liquid Mass-Transfer Data to Direct Contact<br />
Heat Transfer Liquid-limited performance measures are much<br />
more commonly given for mass-transfer than for heat transfer. Often<br />
mass-transfer data are reported as kLa with units of h−1 . This can be<br />
converted to hLa with units of Btu/(h⋅°F⋅ft3 ) by Eq. (14-188).<br />
hLa = 187(kLa) (cL) (ρL) (µ L/T) 0.5 (14-188)<br />
where µ L = liquid, cP<br />
T = temperature, °R<br />
ρL = liquid density, lb/ft3 cL = liquid specific heat, Btu/(lb⋅°F)<br />
Calculation of transfer units for heat transfer is relatively simple. For<br />
a liquid<br />
(liquid contact time)(hLa)<br />
NL = ��� (14-189)<br />
ρLcL<br />
where ρ L = liquid density and c L = liquid specific heat. [See parallel<br />
gas expression, Eq. (14-181).]<br />
Unlike gases, the liquid properties that control mass and heat transfer<br />
differ greatly. The key term is diffusivity which for liquids drops<br />
with viscosity.<br />
The resulting values for h La and N L can be surprisingly large when<br />
a pure vapor such as steam is condensed. See Example 23.<br />
Example 23: Estimating Direct Contact Condensing Performance<br />
Based on kLa Mass-Transfer Data If an aqueous system at<br />
560°R gives a kLa of 60 h−1 , what does Eq. (14-188) predict for hLa in a direct<br />
contact steam condenser?<br />
For an aqueous system<br />
µ L = 1 cP<br />
ρL = 62 lb/ft3 c L = 1 Btu/(lb⋅°F)<br />
and Eq. (14-189) predicts<br />
hLa = 187(60)(1)(62)(1/560) 0.5 = 29,400 Btu/(h⋅°F⋅ft3 )<br />
When a pure gas such as HCl is absorbed by low viscosity liquid<br />
such as water, simple spray systems can also be highly effective. See<br />
Example 24.<br />
Example 24: HCl Vent Absorber (Kister, Distillation Troubleshooting,<br />
Wiley, 2006, p. 95.) A 6-in-diameter, 8-ft-tall packed bed was giving major<br />
problems due to failure of the packing support. Water was the scrubbing fluid.<br />
The liquid distributors were replaced with carefully positioned spray nozzles,<br />
and the packing was removed. HCl in the vent was removed to a level onefortieth<br />
of the original design.<br />
LIQUID-IN-GAS DISPERSIONS<br />
Liquid Breakup into Droplets There are four basic mechanisms<br />
for breakup of liquid into droplets:<br />
• Droplets in a field of high turbulence (i.e., high power dissipation<br />
per unit mass)<br />
• Simple jets at low velocity<br />
• Expanding sheets of liquid at relatively low velocity<br />
• Droplets in a steady field of high relative velocity<br />
These mechanisms coexist, and the one that gives the smallest drop<br />
size will control. The four mechanisms follow distinctly different<br />
velocity dependencies:<br />
1. Breakup in a highly turbulent field (1/velocity) 1.2 . This appears to<br />
be the dominant breakup process in distillation trays in the spray<br />
regime, pneumatic atomizers, and high-velocity pipeline contactors.<br />
2. Breakup of a low-velocity liquid jet (1/velocity) 0 . This governs in<br />
special applications like prilling towers and is often an intermediate<br />
step in liquid breakup processes.<br />
3. Breakup of a sheet of liquid (1/velocity) 0.67 . This governs drop<br />
size in most hydraulic spray nozzles.
14-92 EQUIPMENT FOR DISTILLATION, GAS ABSORPTION, PHASE DISPERSION, AND PHASE SEPARATION<br />
4. Single-droplet breakup at very high velocicty (1/velocity) 2 . This<br />
governs drop size in free fall as well as breakup when droplets impinge<br />
on solid surfaces.<br />
Droplet Breakup—High Turbulence This is the dominant<br />
breakup mechanism for many process applications. Breakup results<br />
from local variations in turbulent pressure that distort the droplet<br />
shape. Hinze [Am. Inst. Chem. Eng. J., 1, 289–295 (1953)] applied<br />
turbulence theory to obtain the form of Eq. (14-190) and took liquidliquid<br />
data to define the coefficient:<br />
Dmax = 0.725(σ/ρG) 0.6 /E0.4 (14-190)<br />
where E = (power dissipated)/mass length 2 /time 3<br />
σ=surface tension mass/time 2<br />
ρG = gas density mass/length 3<br />
Note that Dmax comes out with units of length. Since E typically varies with<br />
(gas velocity) 3 , this results in drop size dependence with (1/velocity) 1.2 .<br />
The theoretical requirement for use of Eq. (14-190) is that the<br />
microscale of turbulence
NWe crit for low-viscosity fluids commonly ranges from 10 to 20, with<br />
the larger value for a free-fall condition and the smaller for a sudden<br />
acceleration. High liquid viscosity also increases NWe crit.<br />
Droplet breakup via impingement appears to follow a similar relationship,<br />
but much less data is available. This type of breakup can<br />
result from impingement on equipment walls or compressor blades.<br />
In general, there is less tendency to shatter on wetted surfaces.<br />
Droplet Size Distribution Instead of the single droplet size<br />
implied by the discussion above, a spectrum of droplet sizes is produced.<br />
The most common ways to characterize this spectrum are:<br />
• Volume median (mass median) Dvm. This has no fundamental meaning<br />
but is easy to determine since it is at the midpoint of a cumulative-volume<br />
plot.<br />
• Sauter mean D32. This has the same ratio of surface to volume as the<br />
total drop population. It is typically 70 to 90 percent of Dvm. It is frequently<br />
used in transport processes and is used here to characterize<br />
drop size.<br />
• Maximum Dmax. This is the largest-sized particle in the population.<br />
It is typically 3 to 4 times D32 in turbulent breakup processes, per<br />
Walzel [International Chemical Engineering, 33, 46, (1993)]. It is<br />
the size directly calculated from the power/mass relationship. D32 is<br />
estimated from Dmax by<br />
D32 = 0.3⋅Dmax<br />
(14-193)<br />
and Dvm is estimated from it by<br />
Dvm = 0.4⋅Dmax<br />
(14-194)<br />
However, any average drop size is fictitious, and none is completely<br />
satisfactory. For example, there is no way in which the high surface<br />
and transfer coefficients in small drops can be made available to the<br />
larger drops. Hence, a process calculation based on a given droplet<br />
size describes only what happens to that size and gives at best an<br />
approximation to the total mass.<br />
There are a variety of ways to describe the droplet population. Figures<br />
14-88 and 14-90 illustrate one of the most common methods, the<br />
plot of cumulative volume against droplet size on log-normal graph<br />
paper. This satisfies the restraint of not extrapolating to a negative<br />
drop size. Its other advantages are that it is easy to plot, the results are<br />
easy to visualize, and it yields a nearly straight line at lower drop sizes.<br />
Cumulative volume over the range of 1 to 50 percent can also be<br />
shown to vary approximately as D2 . This is equivalent to finding that<br />
the number of droplets of a given size is inversely proportional to the<br />
droplet area or the surface energy of the droplet.<br />
Atomizers The common need to disperse a liquid into a gas has<br />
spawned a large variety of mechanical devices. The different designs<br />
emphasize different advantages such as freedom from plugging, pattern<br />
of spray, small droplet size, uniformity of spray, high turndown<br />
ratio, and low power consumption.<br />
As shown in Table 14-19, most atomizers fall into three categories:<br />
1. Pressure nozzles (hydraulic)<br />
2. Two-fluid nozzles (pneumatic)<br />
3. Rotary devices (spinning cups, disks, or vaned wheels)<br />
These share certain features such as relatively low efficiency and<br />
low cost relative to most process equipment. The energy required to<br />
produce the increase in area is typically less than 0.1 percent of the<br />
total energy consumption. This is because atomization is a secondary<br />
process resulting from high interfacial shear or turbulence. As droplet<br />
sizes decrease, this efficiency drops lower.<br />
Other types are available that use sonic energy (from gas streams),<br />
ultrasonic energy (electronic), and electrostatic energy, but they are<br />
less commonly used in process industries. See Table 14-19 for a summary<br />
of the advantages/disadvantages of the different type units. An<br />
expanded discussion is given by Masters [Spray Drying Handbook,<br />
Wiley, New York (1991)].<br />
Special requirements such as size uniformity in prilling towers can<br />
dictate still other approaches to dispersion. Here plates are drilled<br />
with many holes to develop nearly uniform columns.<br />
Commonly, the most important feature of a nozzle is the size of<br />
droplet it produces. Since the heat or mass transfer that a given dispersion<br />
can produce is often proportional to (1/Dd) 2 , fine drops are<br />
usually favored. On the other extreme, drops that are too fine will not<br />
PHASE DISPERSION 14-93<br />
settle, and a concern is the amount of liquid that will be entrained<br />
from a given spray operation. For example, if sprays are used to contact<br />
atmospheric air flowing at 1.5 m/s, drops smaller than 350 mm<br />
[terminal velocity = 1.5 m/s (4.92 ft/s)] will be entrained. Even for the<br />
relative coarse spray of the hollow-cone nozzle shown in Fig. 14-88,<br />
7.5 percent of the total liquid mass will be entrained.<br />
Hydraulic (Pressure) Nozzles Manufacturers’ data such as<br />
shown by Fig. 14-88 are available for most nozzles for the air-water<br />
system. In Fig. 14-88, note the much coarser solid-cone spray. The<br />
coarseness results from the less uniform discharge.<br />
Effect of Physical Properties on Drop Size Because of the<br />
extreme variety of available geometries, no attempt to encompass this<br />
variable is made here. The suggested predictive route starts with airwater<br />
droplet size data from the manufacturer at the chosen flow rate.<br />
This drop size is then corrected by Eq. (14-195) for different viscosity<br />
and surface tension:<br />
Dvm, system<br />
� Dvm, water<br />
=� � 0.25<br />
� � 0.25<br />
σsystem µ�<br />
where Dvm = volume median droplet diameter<br />
σ=surface tension, mN/m (dyn/cm)<br />
µ� = liquid viscosity, mPa⋅s (cP)<br />
(14-195)<br />
The exponential dependencies in Eq. (14-195) represent averages of<br />
values reported by a number of studies with particular weight given to<br />
Lefebvre ([Atomization and Sprays, Hemisphere, New York (1989)].<br />
Since viscosity can vary over a much broader range than surface tension,<br />
it has much more leverage on drop size. For example, it is common<br />
to find an oil with 1000 times the viscosity of water, while most<br />
liquids fall within a factor of 3 of its surface tension. Liquid density is<br />
generally even closer to that of water, and since the data are not clear<br />
that a liquid density correction is needed, none is shown in Eq.<br />
(14-195). Vapor density also has an impact on dropsize but the impact<br />
is complex, involving conflicts of a number of effects, and vapor density<br />
is commonly omitted in atomizer dropsize correlations.<br />
Effect of Pressure Drop and Nozzle Size For a nozzle with a<br />
developed pattern, the average drop size can be estimated to fall with<br />
rising ∆P (pressure drop) by Eq. (14-196):<br />
∆P2 1/3<br />
= � �<br />
(14-196)<br />
For similar nozzles and constant ∆P, the drop size will increase with<br />
nozzle size as indicated by Eq. (14-197):<br />
D 1<br />
� D2<br />
D1<br />
� D2<br />
� 73<br />
� ∆P1<br />
orifice diameter1<br />
orifice diameter2<br />
1/2<br />
= �� � �<br />
(14-197)<br />
Once again, these relationships are averages of a number of reported<br />
values and are intended as rough guides.<br />
The normal operating regime is well below turbulent breakup<br />
velocity. However the data of Kennedy [J. of Engineering for Gas Turbines<br />
and Power, 108, 191 (1986)] at very high pressure drop in large<br />
nozzles shows a shift to a higher dependence on pressure drop. This<br />
data suggests that turbulent droplet breakup can also be governing<br />
with hydraulic spray nozzles, although this is unusual.<br />
Spray Angle A shift to a smaller-angle nozzle gives slightly larger<br />
drops for a given type of nozzle because of the reduced tendency of<br />
the sheet to thin. Dietrich [Proc. 1st Int. Conf. Liq. Atomization Spray<br />
Systems, Tokyo (1978)] shows the following:<br />
Angle 25° 50° 65° 80° 95°<br />
Dvm, µm 1459 1226 988 808 771<br />
In calculating the impact point of spray, one should recognize that<br />
the spray angle closes in as the spray moves away from the nozzle. This<br />
is caused by loss of momentum of the spray to the gas.<br />
� 1.0
14-94 EQUIPMENT FOR DISTILLATION, GAS ABSORPTION, PHASE DISPERSION, AND PHASE SEPARATION<br />
Types of atomizer<br />
Design features<br />
Pressure.<br />
Flow α(∆P/ρ�) 1/2 TABLE 14-19 Atomizer Summary<br />
. Only source of<br />
energy is from fluid being atomized.<br />
1. Hollow cone.<br />
a. Whirl chamber (see Fig.<br />
14-87a).<br />
b. Grooved core.<br />
2. Solid cone (see Fig. 14-87b).<br />
3. Fan (flat) spray.<br />
a. Oval or rectangular orifice (see<br />
Fig. 14-87c). Numerous variants<br />
on cavity and groove exist.<br />
b. Deflector (see Fig. 14-87d).<br />
c. Impinging jets (see Fig.<br />
14-87e).<br />
4. Nozzles with wider range of<br />
turndown.<br />
a. Spill (bypass) (see Fig.<br />
14-87f).<br />
b. Poppet (see Fig. 14-87g).<br />
Two-fluid (see Fig. 14-87h).<br />
Sonic.<br />
Rotary wheels (see Fig. 14-87i)<br />
disks, and cups.<br />
Ultrasound.<br />
Liquid leaves as conical sheet as a<br />
result of centrifugal motion of<br />
liquid. Air core extends into nozzle.<br />
Centrifugal motion developed by<br />
tangential inlet in chamber<br />
upstream of orifice.<br />
Centrifugal motion developed by<br />
inserts in chamber.<br />
Similar to hollow cone but with<br />
insert to provide even distribution.<br />
Liquid leaves as a flat sheet or<br />
flattened ellipse.<br />
Combination of cavity and orifice<br />
produces two streams that impinge<br />
within the nozzle.<br />
Liquid from plain circular orifice<br />
impinges on curved deflector.<br />
Two jets collide outside nozzle and<br />
produce a sheet perpendicular to<br />
their plane.<br />
A portion of the liquid is recirculated<br />
after going through the swirl<br />
chamber.<br />
Conical sheet is developed by flow<br />
between orifice and poppet.<br />
Increased pressure causes poppet<br />
to move out and increase flow area.<br />
Gas impinges coaxially and supplies<br />
energy for breakup.<br />
Gas generates an intense sound field<br />
into which liquid is directed.<br />
Liquid is fed to a rotating surface<br />
and spreads in a uniform film. Flat<br />
disks, disks with vanes, and bowlshaped<br />
cups are used. Liquid is<br />
thrown out at 90° to the axis.<br />
Liquid is fed over a surface vibrating<br />
at a frequency > 20 kHz.<br />
At some low flow, pressure nozzles do not develop their normal pattern<br />
but tend to approach solid streams. The required flow to achieve<br />
the normal pattern increases with viscosity.<br />
Two-Fluid (Pneumatic) Atomizers This general category<br />
includes such diverse applications as venturi atomizers and reactoreffluent<br />
quench systems in addition to two-fluid spray nozzles.<br />
Depending on the manner in which the two fluids meet, several of the<br />
breakup mechanisms may be applicable, but the final one is high-level<br />
turbulent rupture.<br />
As shown by Table 14-20, empirical correlations for two-fluid atomization<br />
show dependence on high gas velocity to supply atomizing<br />
energy, usually to a power dependence close to that for turbulent<br />
breakup. In addition, the correlations show a dependence on the ratio<br />
of gas to liquid and system dimension.<br />
Advantages<br />
Simplicity and low cost.<br />
High atomization efficiency.<br />
Minimum opportunity for plugging.<br />
Smaller spray angle than 1a and<br />
ability to handle flows smaller<br />
than 1a.<br />
More uniform spatial pattern than<br />
hollow cone.<br />
Flat pattern is useful for coating<br />
surfaces and for injection into<br />
streams.<br />
Minimal plugging.<br />
Different liquids are isolated until<br />
they mix outside of orifice. Can<br />
produce a flat circular sheet when<br />
jets impinge at 180°.<br />
Achieves uniform hollow cone<br />
atomization pattern with very high<br />
turndown (50:1).<br />
Simplest control over broad range.<br />
High velocities can be achieved at<br />
lower pressures because the gas is<br />
the high-velocity stream. Liquidflow<br />
passages can be large, and<br />
hence plugging can be minimized.<br />
Similar to two-fluid but with greater<br />
tolerance for solids.<br />
The velocity that determines drop<br />
size is independent of flow. Hence<br />
these can handle a wide range of<br />
rates. They can also tolerate very<br />
viscous materials as well as slurries.<br />
Can achieve very high capacity in a<br />
single unit; does not require a highpressure<br />
pump.<br />
Fine atomization, small size, and low<br />
injection velocity.<br />
Disadvantages<br />
Limited tolerance for solids;<br />
uncertain spray with high-viscosity<br />
liquids; susceptible to erosion.<br />
Need for special designs (e.g.,<br />
bypass) to achieve turndown.<br />
Concentrated spray pattern at cone<br />
boundaries.<br />
Coarser drops for comparable flows<br />
and pressure drops. Failure to yield<br />
same pattern with different fluids.<br />
Small clearances.<br />
Coarser drops.<br />
Extreme care needed to align jets.<br />
Waste of energy in bypass stream.<br />
Added piping for spill flow.<br />
Difficult to maintain proper<br />
clearances.<br />
Because gas is also accelerated,<br />
efficiency is inherently lower than<br />
pressure nozzles.<br />
Similar to two-fluid.<br />
Mechanical complexity of rotating<br />
equipment. Radial discharge.<br />
Low flow rate and need for<br />
ultrasound generator.<br />
Further differences from hydraulic nozzles (controlled by sheet and<br />
ligament breakup) are the stronger increase in drop size with increasing<br />
surface tension and decreasing gas density.<br />
The similarity of these dependencies to Eq. (14-190) led to a reformulation<br />
with two added terms that arise naturally from the theory of<br />
power dissipation per unit mass. The result is Eq. (14-198) which is<br />
labeled power/mass in Table 14-20.<br />
0.6<br />
D32 = 0.29� � (1/velocity) 1.2<br />
�1 + � 0.4<br />
�Dnozzle� 0.4 σ<br />
L<br />
� � (14-198)<br />
ρG<br />
G<br />
where σ=surface tension<br />
ρG = gas density<br />
L/G = mass ratio of liquid flow to gas flow<br />
Dnozzle = diameter of the air discharge
(f)<br />
(a)<br />
This is remarkably similar to the empirical two-fluid atomizer relationships<br />
of El-Shanawany and Lefebvre [J. Energy, 4, 184 (1980)]<br />
and Jasuja [Trans. Am. Soc. Mech. Engr., 103, 514 (1981)]. For example,<br />
El-Shanawany and Lefebvre give a relationship for a prefilming<br />
atomizer:<br />
D32 = 0.0711(σ/ρG) 0.6 (1/velocity) 1.2 (1 + L/G)(Dnozzle) 0.4 (ρL/ρG) 0.1<br />
+ 0.015[(µL) 2 /(σ×ρL)] 0.5 (Dnozzle) 0.5 (1 + L/G) (14-199)<br />
where µL is liquid viscosity.<br />
According to Jasuja,<br />
D32 = 0.17(σ/ρG) 0.45 (1/velocity) 0.9 (1 + L/G) 0.5 (Dnozzle) 0.55<br />
+ viscosity term (14-200)<br />
[Eqs. (14-198), (14-199), and (14-200) are dimensionally consistent;<br />
any set of consistent units on the right-hand side yields the droplet<br />
size in units of length on the left-hand side.]<br />
The second, additive term carrying the viscosity impact in Eq. (14-<br />
199) is small at viscosities around 1 cP but can become controlling as<br />
viscosity increases. For example, for air at atmospheric pressure atomizing<br />
water, with nozzle conditions<br />
Dnozzle = 0.076 m (3 in)<br />
velocity = 100 m/s (328 ft/s)<br />
L/G = 1<br />
El-Shanaway measured 70 µm and his Eq. (14-199) predicted 76 µm.<br />
The power/mass correlation [Eq. (14-198)] predicts 102 µm. The<br />
agreement between both correlations and the measurement is much<br />
better than normally achieved.<br />
(b)<br />
(h)<br />
(c) (d)<br />
(e)<br />
(g) (i)<br />
PHASE DISPERSION 14-95<br />
FIG. 14-87 Charactersitic spray nozzles. (a) Whirl-chamber hollow cone. (b) Solid cone. (c) Oval-orifice fan. (d) Deflector jet. (e) Impinging jet.<br />
( f) Bypass. (g) Poppet. (h) Two-fluid. (i) Vaned rotating wheel.<br />
Rotary Atomizers For rotating wheels, vaneless disks, and cups,<br />
there are three regimes of operation. At low rates, the liquid is shed<br />
directly as drops from the rim. At intermediate rates, the liquid leaves<br />
the rim as threads; and at the highest rate, the liquid extends from the<br />
edge as a thin sheet that breaks down similarly to a fan or hollow-cone<br />
spray nozzle. As noted in Table 14-19, rotary devices have many<br />
unique advantages such as the ability to handle high viscosity and slurries<br />
and produce small droplets without high pressures. The prime<br />
applications are in spray drying. See Masters [Spray Drying Handbook,<br />
Wiley, New York (1991)] for more details.<br />
Pipeline Contactors The correlation for droplet diameter based<br />
on power/mass is similar to that for two-fluid nozzles. The dimensionless<br />
correlation is<br />
D32 = 0.8(σ/ρG) 0.6 (1/velocity) 1.2 (Dpipe) 0.4 (14-201)<br />
(The relation is dimensionally consistent; any set of consistent units on<br />
the right-hand side yields the droplet size in units of length on the lefthand<br />
side.)<br />
The relationship is similar to the empirical correlation of Tatterson,<br />
Dallman, and Hanratty [Am. Inst. Chem. Eng. J., 23(1), 68 (1977)]<br />
σ<br />
� ρG<br />
D 32 ∼ � � 0.5<br />
(1/velocity) 1 (Dpipe) 0.5<br />
Predictions from Eq. (14-201) align well with the Tatterson data. For<br />
example, for a velocity of 43 m/s (140 ft/s) in a 0.05-m (1.8-inch)<br />
equivalent diameter channel, Eq. (14-201) predicts D32 of 490<br />
microns, compared to the measured 460 to 480 microns.
14-96 EQUIPMENT FOR DISTILLATION, GAS ABSORPTION, PHASE DISPERSION, AND PHASE SEPARATION<br />
FIG. 14-88 Droplet-size distribution for three different types of nozzles. To convert pounds per square inch<br />
gauge to kilopascals, multiply by 6.89; to convert gallons per minute to cubic meters per hour, multiply by<br />
0.227. (Spraying Systems Inc.)<br />
Entrainment due to Gas Bubbling/Jetting through a Liquid<br />
Entrainment generally limits the capacity of distillation trays and is<br />
commonly a concern in vaporizers and evaporators. Fortunately, it is<br />
readily controllable by simple inertial entrainment capture devices<br />
such as wire mesh pads in gravity separators.<br />
In distillation towers, entrainment lowers the tray efficiency, and 1<br />
pound of entrainment per 10 pounds of liquid is sometimes taken as<br />
the limit for acceptable performance. However, the impact of entrainment<br />
on distillation efficiency depends on the relative volatility of the<br />
component being considered. Entrainment has a minor impact on<br />
close separations when the difference between vapor and liquid concentration<br />
is small, but this factor can be dominant for systems where<br />
the liquid concentration is much higher than the vapor in equilibrium<br />
with it (i.e., when a component of the liquid has a very low volatility, as<br />
in an absorber).<br />
As shown by Fig. 14-90, entrainment droplet sizes span a broad<br />
range. The reason for the much larger drop sizes of the upper curve<br />
is the short disengaging space. For this curve, over 99 percent of<br />
the entrainment has a terminal velocity greater than the vapor<br />
velocity. For contrast, in the lower curve the terminal velocity of the<br />
largest particle reported is the same as the vapor velocity. For the<br />
TABLE 14-20 Exponential Dependence of Drop Size on<br />
Different Parameters in Two-Fluid Atomization<br />
Relative Surface Atomizer<br />
velocity tension Gas density 1 + L/G dimension<br />
Jasuja (empirical for small<br />
nozzle)<br />
−0.9 0.45 −0.45 0.5 0.55<br />
El-Shanawany and Lefebvre<br />
(empirical for small nozzle)<br />
−1.2 0.6 −0.7 1 0.40<br />
Tatterson, Dallman, and<br />
Hanratty (pipe flow)<br />
−1 0.5 −0.5 0.5<br />
Power/mass −1.2 0.6 −0.6 0.4 0.4<br />
settling velocity to limit the maximum drop size entrained, at least<br />
0.8 m (30 in) disengaging space is usually required. Note that even<br />
for the lower curve, less than 10 percent of the entrainment is in<br />
drops of less than 50 µm. The coarseness results from the relatively<br />
low power dissipation per mass on distillation trays. This means that<br />
it is relatively easy to remove by a device such as a wire mesh pad.<br />
Over 50 percent is typically captured by the underside of the next<br />
higher tray or by a turn in the piping leaving an evaporator. Conversely,<br />
though small on a mass basis, the smaller drops are<br />
extremely numerous. On a number basis, more than one-half of the<br />
drops in the lower curve are under 5 µm. These can serve as nuclei<br />
for fog condensation in downstream equipment.<br />
Entrainment E is inherent in the bubbling process and can stem<br />
from a variety of sources, as shown by Fig. 14-89. However, the<br />
biggest practical problem is entrainment generated by the kinetic<br />
energy of the flowing vapor rather than the bubbling process. As vapor<br />
velocity approaches the <strong>flooding</strong> limit [Eq. (14-168)], the entrainment<br />
rises approximately with (velocity) 8 .<br />
Pinczewski and Fell [Trans. Inst. Chem Eng., 55, 46 (1977)] show<br />
that the velocity at which vapor jets onto the tray sets the droplet size,<br />
rather than the superficial tray velocity. The power/mass correlation<br />
predicts an average drop size close to that measured by Pinczewski<br />
and Fell. Combination of this prediction with the estimated fraction of<br />
the droplets entrained gave a relationship for entrainment, Eq. (14-<br />
202). The dependence of entrainment with the eighth power of velocity<br />
even approximates the observed velocity dependence, as <strong>flooding</strong><br />
is approached.<br />
constant(velocity)<br />
E = (14-202)<br />
8 (ρG) 4<br />
���<br />
(Af) 3 (ρL −ρG) 2.5 σ 1.5<br />
(Here E is the mass of entrainment per mass of vapor and A f is the<br />
fractional open area on the tray.)<br />
When <strong>flooding</strong> is defined as the condition that gives E of 1, the<br />
flood velocity is estimated by Eq. (14-203).
1.25(Af)<br />
Uflood = (14-203)<br />
3/8 [g(ρL −ρG)] 0.3125 σ 0.1875<br />
����<br />
The relationship is dimensionally consistent; any set of consistent<br />
units on the right-hand side yields velocity units on the left-hand side.<br />
It is similar in form to Eq. (14-168) and provides a conceptual framework<br />
for understanding the ultimate distillation column capacity concept.<br />
“Upper Limit” Flooding in Vertical Tubes If, instead of a gas<br />
jet being injected into a liquid as in distillation, the liquid runs down<br />
the walls and the gas moves up the center of the tube, higher velocities<br />
can be achieved than shown by Eq. (14-168) or (14-203). This<br />
application is important in the design of vertical condensers.<br />
Maharudrayya and Jayanti [AIChE J., 48(2), 212–220 (2002)] show<br />
that peak pressure drop in a 25-mm vertical tube occurs at a value<br />
close to that predicted by Eq. (14-168) or (14-203). At this velocity<br />
about 20 percent of the injected liquid is being entrained out the top<br />
of the tube. However, the condition where essentially all liquid was<br />
entrained didn’t occur until a velocity over twice the value estimated<br />
from Eq. (14-168) and Eq. (14-203).<br />
The higher velocities at modest entrainment observed by Maharudrayya<br />
and Jayanti were obtained with special smooth entry of gas<br />
(and exit of liquid) at the bottom of the tube. Hewitt (Handbook of<br />
Heat Exchanger Design, pp. 2.3.2-23, 1992) suggests that these values<br />
should be derated by at least 35 percent for more typical sharp heat<br />
exchanger tube entry. Similar to the smooth entry effect, other data<br />
suggest that countercurrent capacity can be increased by providing<br />
an extension of the tube below the tube sheet, with the bottom of the<br />
extension cut on a steep angle (>60°) to the horizontal. The tapered<br />
extension facilitates drainage of liquid.<br />
An extensive data bank correlated by Diehl and Koppany [Chem. Eng.<br />
Prog. Symp. Ser., 65, 77–83 (1965)] also gave higher allowable entry<br />
velocities than Eq. (14-168) or (14-203). Dielhl and Koppany’s correlation<br />
[Eq. (14-204)] is dimensional, and appears to give a much higher<br />
dependence on σ than the more recent work. However, for many fluids,<br />
σ 0.5 is essentially the same as the combination σ 0.1875 (ρ l − ρ g) 0.3125 that<br />
appears in Eq. (14-203). Hence Eq. (14-204) gives a similar physical<br />
property dependence.<br />
where U f = <strong>flooding</strong> gas velocity, m/s<br />
F 1 = 1.22 when 3.2 d i/σ>1.0<br />
= 1.22 (3.2 d i/σ) 0.4 when 3.2 d i/σ
14-98 EQUIPMENT FOR DISTILLATION, GAS ABSORPTION, PHASE DISPERSION, AND PHASE SEPARATION<br />
TABLE 14-21 Simulation of Three Heat Exchangers<br />
with Varying Foreign Nuclei<br />
1 2 3<br />
Weight fraction, noncondensable<br />
Inlet 0.51 0.42 0.02<br />
Outlet<br />
Molecular weight<br />
0.80 0.80 0.32<br />
Inert 28 29 29<br />
Condensable<br />
Temperature difference between gas and<br />
liquid interface, K<br />
86 99 210<br />
Inlet 14 24 67<br />
Outlet<br />
Percent of liquid that leaves unit as fog<br />
Nuclei concentration in inlet particles/cm<br />
4 10 4<br />
3<br />
100 0.05 1.1 2.2<br />
1,000 0.44 5.6 3.9<br />
10,000 3.2 9.8 4.9<br />
100,000 9.6 11.4 5.1<br />
1,000,000 13.3 11.6<br />
10,000,000 14.7<br />
∞ 14.7 11.8 5.1<br />
Fog particle size based on 10,000 nuclei/cm3 at inlet, µm<br />
28 25 4<br />
yields the same relative increase in temperature driving force. However,<br />
the interface vapor pressure can only approach the limit of zero.<br />
Because of this, for equal molecular and thermal diffusivities a saturated<br />
mixture will supersaturate when cooled. The tendency to supersaturate<br />
generally increases with increased molecular weight of the<br />
condensable, increased temperature differences, and reduced initial<br />
superheating. To evaluate whether a given condensing step yields fog<br />
requires rigorous treatment of the coupled heat-transfer and masstransfer<br />
processes through the entire condensation. Steinmeyer<br />
[Chem. Eng. Prog., 68(7), 64 (1972)] illustrates this, showing the<br />
impact of foreign-nuclei concentration on calculated fog formation.<br />
See Table 14-21. Note the relatively large particles generated for cases<br />
1 and 2 for 10,000 foreign nuclei per cm 3 . These are large enough to<br />
be fairly easily collected. There have been very few documented problems<br />
with industrial condensers despite the fact that most calculate to<br />
generate supersaturation along the condensing path. The explanation<br />
appears to be a limited supply of foreign nuclei.<br />
Ryan et al. [Chem. Eng. Progr., 90(8), 83 (1994)] show that separate<br />
mass and heat transfer-rate modeling of an HCl absorber predicts 2<br />
percent fog in the vapor. The impact is equivalent to lowering the<br />
stage efficiency to 20 percent.<br />
Spontaneous (Homogeneous) Nucleation This process is<br />
quite difficult because of the energy barrier associated with creation<br />
of the interfacial area. It can be treated as a kinetic process with the<br />
rate a very steep function of the supersaturation ratio (S = partial pressure<br />
of condensable per vapor pressure at gas temperature). For<br />
water, an increase in S from 3.4 to 3.9 causes a 10,000-fold increase in<br />
the nucleation rate. As a result, below a critical supersaturation (Scrit),<br />
homogeneous nucleation is slow enough to be ignored. Generally, Scrit<br />
is defined as that which limits nucleation to one particle produced per<br />
cubic centimeter per second. It can be estimated roughly by traditional<br />
theory (Theory of Fog Condensation, Israel Program for Scientific<br />
Translations, Jerusalem, 1967) using the following equation:<br />
Scrit = exp�0.56 �� 3/2<br />
� �<br />
ρl T<br />
where σ=surface tension, mN/m (dyn/cm)<br />
ρ l = liquid density, g/cm 3<br />
T = temperature, K<br />
M = molecular weight of condensable<br />
�<br />
(14-205)<br />
Table 14-22 shows typical experimental values of S crit taken from the<br />
work of Russel [J. Chem. Phys., 50, 1809 (1969)]. Since the critical<br />
supersaturation ratio for homogeneous nucleation is typically greater<br />
M<br />
σ<br />
TABLE 14-22 Experimental Critical Supersaturation Ratios<br />
Temperature, K Scrit H2O 264 4.91<br />
C2H5OH 275 2.13<br />
CH4OH 264 3.55<br />
C6H6 253 5.32<br />
CCl4 247 6.5<br />
CHCl3 258 3.73<br />
C6H5Cl 250 9.5<br />
than 3, it is not often reached in process equipment. However, fog formation<br />
is typically found in steam turbines. Gyarmathy [Proc. Inst.<br />
Mech. E., Part A: J. Power and Energy 219(A6), 511–521 (2005)]<br />
reports fog in the range 3.5 to 5 percent of total steam flow, with average<br />
fog diameter in the range of 0.1 to 0.2 µm.<br />
Growth on Foreign Nuclei As noted above, foreign nuclei are<br />
often present in abundance and permit fog formation at much lower<br />
supersaturation. For example,<br />
1. Solids. Surveys have shown that air contains thousands of particles<br />
per cubic centimeter in the 0.1-µm to 1-µm range suitable for<br />
nuclei. The sources range from ocean-generated salt spray to combustion<br />
processes. The concentration is highest in large cities and industrial<br />
regions. When the foreign nuclei are soluble in the fog,<br />
nucleation occurs at S values very close to 1.0. This is the mechanism<br />
controlling atmospheric water condensation. Even when not soluble,<br />
a foreign particle is an effective nucleus if wet by the liquid. Thus, a<br />
1-µm insoluble particle with zero contact angle requires an S of only<br />
1.001 in order to serve as a condensation site for water.<br />
2. Ions. Amelin [Theory of Fog Condensation, Israel Program for<br />
Scientific Translations, Jerusalem, (1967)] reports that ordinary air<br />
contains even higher concentrations of ions. These ions also reduce<br />
the required critical supersaturation, but by only about 10 to 20 percent,<br />
unless multiple charges are present.<br />
3. Entrained liquids. Production of small droplets is inherent in<br />
the bubbling process, as shown by Fig. 14-90. Values range from near<br />
zero to 10,000/cm 3 of vapor, depending on how the vapor breaks<br />
through the liquid and on the opportunity for evaporation of the small<br />
drops after entrainment.<br />
As a result of these mechanisms, most process streams contain<br />
enough foreign nuclei to cause some fogging. While fogging has been<br />
reported in only a relatively low percent of process partial condensers,<br />
it is rarely looked for and volunteers its presence only when yield<br />
losses or pollution is intolerable.<br />
Dropsize Distribution Monodisperse (nearly uniform droplet<br />
size) fogs can be grown by providing a long retention time for growth.<br />
However, industrial fogs usually show a broad distribution, as in Fig.<br />
14-91. Note also that for this set of data, the sizes are several orders of<br />
magnitude smaller than those shown earlier for entrainment and<br />
atomizers.<br />
The result, as discussed in a later subsection, is a demand for different<br />
removal devices for the small particles.<br />
While generally fog formation is a nuisance, it can occasionally be<br />
useful because of the high surface area generated by the fine drops.<br />
An example is insecticide application.<br />
GAS-IN-LIQUID DISPERSIONS<br />
GENERAL REFERENCES: Design methods for agitated vessels are presented by<br />
Penney in Couper et al., Chemical Process Equipment, Selection and Design,<br />
Chap. 10, Gulf Professional Publishing, Burlington, Mass., 2005. A comprehensive<br />
review of all industrial mixing technology is given by Paul, Atemo-Obeng,<br />
and Kresta, Handbook of Industrial Mixing, Wiley, Hoboken, N.J., 2004. Comprehensive<br />
treatments of bubbles or foams are given by Akers, Foams: Symposium<br />
1975, Academic Press, New York, 1973; Bendure, Tappi, 58, 83 (1975);<br />
Benfratello, Energ Elettr., 30, 80, 486 (1953); Berkman and Egloff, Emulsions<br />
and Foams, Reinhold, New York, 1941, pp. 112–152; Bikerman, Foams,<br />
Springer-Verlag, New York, 1975; Kirk-Othmer Encyclopedia of Chemical Technology,<br />
4th ed., Wiley, New York, 1993, pp. 82–145; Haberman and Morton,<br />
Report 802, David W. Taylor Model Basin, Washington, 1953; Levich, Physicochemical<br />
Hydrodynamics, Prentice-Hall, Englewood Cliffs, NJ, 1962; and Soo,<br />
Fluid Dynamics of Multiphase Systems, Blaisdell, Waltham, Massachusetts,
FIG. 14-90 Entrainment droplet-size distribution. To convert meters per second to feet per second, multiply<br />
by 3.28, to convert meters to feet multiply by 3.28.<br />
1967. The formation of bubbles is comprehensively treated by Clift, Grace, and<br />
Weber, Bubbles, Drops and Particles, Academic, New York, 1978; Kumar and<br />
Kuloor, Adv. Chem. Eng, 8, 255–368 (1970); and Wilkinson and Van Dierendonck,<br />
Chem. Eng Sci., 49, 1429–1438 (1994). Design methods for units operation<br />
in bubble columns and stirred vessels are covered by Atika and Yoshida, Ind.<br />
Eng Chem. Process Des. Dev., 13, 84 (1974); Calderbank, The Chem. Eng. (London),<br />
CE209 (October, 1967); and Mixing, vol. II, Academic, New York, 1967,<br />
pp. 1–111; Fair, Chem. Eng, 74, 67 (July 3, 1967); Jordan, Chemical Process Dev.,<br />
Interscience, New York, 1968, part 1, pp. 111–175; Mersmann, Ger. Chem. Eng,<br />
1, 1 (1978); Resnick and Gal-Or, Adv. Chem. Eng., 7, 295–395 (1968); Valentin,<br />
Absorption in Gas-Liquid Dispersions, E. & F. N. Spon, London, 1967; Tatterson,<br />
Fluid Mixing and Gas Dispersion in Agitated Tanks, McGraw-Hill, 1991;<br />
and Deckwer and Schumpe, Chem. Eng. Sci., 48, 889–991 (1993).<br />
FIG. 14-91 Particle-size distribution and mist loading from absorption tower<br />
in a contact H 2SO 4 plant. [Gillespie and Johnstone, Chem. Eng. Prog., 51(2), 74<br />
(1955).]<br />
PHASE DISPERSION 14-99<br />
Review of foam rheology is given by Herzhaft [Oil & Gas Sci. & Technol. 54,<br />
587 (1999)] and Heller and Kuntamukkula [Ind. Eng. Chem. Res., 26, 318<br />
(1987)]. The influence of surface-active agents on bubbles and foams is summarized<br />
in selected passages from Schwartz and Perry, Surface Active Agents, vol.<br />
1, Interscience, New York, 1949; and from Schwartz, Perry, and Berch, Surface<br />
Active Agents and Detergents, vol. 2, Interscience, New York, 1958. See also<br />
Elenkov, Theor. Found Chem. Eng., 1, 1, 117 (1967); and Rubel, Antifoaming<br />
and Defoaming Agents, Noyes Data Corp., Park Ridge, NJ, 1972.<br />
A review of foam stability also is given by de Vries, Meded, Rubber Sticht.<br />
Delft. No. 328, 1957. Foam-separation methodology is discussed by Aguoyo<br />
and Lemlich, Ind. Eng. Chem. Process Des. Dev., 13, 153 (1974); and Lemlich,<br />
Ind. Eng Chem., 60, 16 (1968). The following reviews of specific applications<br />
of gas-to-liquid dispersions are recommended: Industrial fermentations Aiba,<br />
Humphrey, and Millis, Biochemical Engineering, Academic, New York, 1965.<br />
Finn, Bacteriol. Rev., 18, 254 (1954). Oldshue, “Fermentation Mixing Scale-<br />
Up Techniques,” in Biotechnology and Bioengineering, vol. 8, 1966, pp. 3–24.<br />
Aerobic oxidation of wastes: Eckenfelder and McCabe, Advances in Biological<br />
Waste Treatment, Macmillan, New York, 1963. Eckenfelder and O’Connor,<br />
Biological Waste Treatment, Pergamon, New York, 1961. McCabe and Eckenfelder,<br />
Biological Treatment of Sewage and Industrial Wastes, vol. 1, Reinhold,<br />
New York, 1955. Proceedings of Industrial Waste Treatment Conference, Purdue<br />
University, annually. Zlokarnik, Adv. Biochem. Eng., 11, 158–180 (1979).<br />
Cellular elastomers: Fling, Natural Rubber Latex and Its Applications: The<br />
Preparation of Latex Foam Products, British Rubber Development Board,<br />
London, 1954. Gould, in Symposium on Application of Synthetic Rubbers,<br />
American Society for Testing and Materials, Philadelphia, 1944, pp. 90–103.<br />
Firefighting foams: Perri, in Bikerman, op. cit., Chap. 12. Ratzer, Ind. Eng.<br />
Chem., 48, 2013 (1956). Froth-flotation methods and equipment: Booth, in<br />
Bikerman, op. cit., Chap. 13. Gaudin, Flotation, McGraw-Hill, New York,<br />
1957. Taggart, Handbook of Mineral Dressing, Wiley, New York, 1945, Sec. 12,<br />
pp. 52–81. Tatterson, Fluid Mixing and Gas Dispersion in Agitated Tanks,<br />
McGraw-Hill, New York, 1991.<br />
Objectives of Gas Dispersion The dispersion of gas as bubbles<br />
in a liquid or in a plastic mass is effected for one of the following purposes:<br />
(1) gas-liquid contacting (to promote absorption or stripping,<br />
with or without chemical reaction), (2) agitation of the liquid phase, or
14-100 EQUIPMENT FOR DISTILLATION, GAS ABSORPTION, PHASE DISPERSION, AND PHASE SEPARATION<br />
(3) foam or froth production. Gas-in-liquid dispersions also may be<br />
produced or encountered inadvertently, sometimes undesirably.<br />
Gas-Liquid Contacting Usually this is accomplished with conventional<br />
columns or with spray absorbers (see preceding subsection<br />
“Liquid-in-Gas Dispersions”). For systems containing solids or tar<br />
likely to plug columns, absorptions accomplished by strongly exothermic<br />
reactions, or treatments involving a readily soluble gas or a condensable<br />
vapor, however, bubble columns or agitated vessels may be<br />
used to advantage.<br />
Agitation Agitation by a stream of gas bubbles (often air) rising<br />
through a liquid is often employed when the extra expense of mechanical<br />
agitation is not justified. Gas spargers may be used for simple<br />
blending operations involving a liquid of low volatility or for applications<br />
where agitator shaft sealing is difficult.<br />
Foam Production This is important in froth-flotation separations;<br />
in the manufacture of cellular elastomers, plastics, and glass;<br />
and in certain special applications (e.g., food products, fire extinguishers).<br />
Unwanted foam can occur in process columns, in agitated vessels,<br />
and in reactors in which a gaseous product is formed; it must be<br />
avoided, destroyed, or controlled. Berkman and Egloff (Emulsions<br />
and Foams, Reinhold, New York, 1941, pp. 112–152) have mentioned<br />
that foam is produced only in systems possessing the proper combination<br />
of interfacial tension, viscosity, volatility, and concentration of<br />
solute or suspended solids. From the standpoint of gas comminution,<br />
foam production requires the creation of small bubbles in a liquid<br />
capable of sustaining foam.<br />
Theory of Bubble and Foam Formation A bubble is a globule<br />
of gas or vapor surrounded by a mass or thin film of liquid. By extension,<br />
globular voids in a solid are sometimes called bubbles. Foam is a<br />
group of bubbles separated from one another by thin films, the aggregation<br />
having a finite static life. Although nontechnical dictionaries do<br />
not distinguish between foam and froth, a technical distinction is often<br />
made. A highly concentrated dispersion of bubbles in a liquid is considered<br />
a froth even if its static life is substantially nil (i.e., it must be<br />
dynamically maintained). Thus, all foams are also froths, whereas the<br />
reverse is not true. The term lather implies a froth that is worked up<br />
on a solid surface by mechanical agitation; it is seldom used in technical<br />
discussions. The thin walls of bubbles comprising a foam are called<br />
laminae or lamellae.<br />
Bubbles in a liquid originate from one of three general sources: (1)<br />
They may be formed by desupersaturation of a solution of the gas or<br />
by the decomposition of a component in the liquid; (2) They may be<br />
introduced directly into the liquid by a bubbler or sparger or by<br />
mechanical entrainment; and (3) They may result from the disintegration<br />
of larger bubbles already in the liquid.<br />
Generation Spontaneous generation of gas bubbles within a<br />
homogeneous liquid is theoretically impossible (Bikerman, Foams:<br />
Theory and Industrial Applications, Reinhold, New York, 1953, p.<br />
10). The appearance of a bubble requires a gas nucleus as a void in the<br />
liquid. The nucleus may be in the form of a small bubble or of a solid<br />
carrying adsorbed gas, examples of the latter being dust particles, boiling<br />
chips, and a solid wall. A void can result from cavitation, mechanically<br />
or acoustically induced. Basu, Warrier, and Dhir [J. Heat<br />
Transfer, 124, 717 (2002)] have reviewed boiling nucleation, and<br />
Blander and Katz [AIChE J., 21, 833 (1975)] have thoroughly<br />
reviewed bubble nucleation in liquids.<br />
Theory permits the approximation of the maximum size of a bubble<br />
that can adhere to a submerged horizontal surface if the contact angle<br />
between bubble and solid (angle formed by solid-liquid and liquid-gas<br />
interfaces) is known [Wark, J. Phys. Chem., 37, 623 (1933); Jakob,<br />
Mech. Eng., 58, 643 (1936)]. Because the bubbles that actually rise<br />
from a surface are always considerably smaller than those so calculated<br />
and inasmuch as the contact angle is seldom known, the theory<br />
is not directly useful.<br />
Formation at a Single Orifice The formation of bubbles at an<br />
orifice or capillary immersed in a liquid has been the subject of much<br />
study, both experimental and theoretical. Kulkarni and Joshi [Ind.<br />
Eng. Chem. Res., 44, 5873 (2005)] have reviewed bubble formation<br />
and rise. Bikerman (op. cit., Secs. 3 to 7), Valentin (op. cit., Chap. 2),<br />
Jackson (op. cit.), Soo (op. cit., Chap. 3), Fair (op. cit.), Kumer et al.<br />
(op. cit.), Clift et al. (op. cit.) and Wilkinson and Van Dierendonck<br />
[Chem. Eng. Sci., 49, 1429 (1994)] have presented reviews and analyses<br />
of this subject.<br />
There are three regimes of bubble production (Silberman in Proceedings<br />
of the Fifth Midwestern Conference on Fluid Mechanics,<br />
Univ. of Michigan Press, Ann Arbor, 1957, pp. 263–284): (1) singlebubble,<br />
(2) intermediate, and (3) jet.<br />
Single-Bubble Regime Bubbles are produced one at a time,<br />
their size being determined primarily by the orifice diameter d o, the<br />
interfacial tension of the gas-liquid film σ, the densities of the liquid<br />
ρ L and gas ρ G, and the gravitational acceleration g according to the<br />
relation<br />
where d b is the bubble diameter.<br />
d b /d o = [6σ/gd o 2 (ρL −ρ C)] 1/3 (14-206)<br />
f = Q/(πd b 3 /6) = Qg(ρL −ρC)/(πdoσ) (14-207)<br />
where f is the frequency of bubble formation and Q is the volumetric<br />
rate of gas flow in consistent units.<br />
Equations (14-206) and (14-207) result from a balance of bubble<br />
buoyancy against interfacial tension. They include no inertia or viscosity<br />
effects. At low bubbling rates (
submerged orifice increases beyond the limit of the single-bubble<br />
regime, the frequency of bubble formation increases more slowly, and<br />
the bubbles begin to grow in size. Between the two regimes there may<br />
indeed be a range of gas rates over which the bubble size decreases<br />
with increasing rate, owing to the establishment of liquid currents that<br />
nip the bubbles off prematurely. The net result can be the occurrence<br />
of a minimum bubble diameter at some particular gas rate [Mater,<br />
U.S. Bur. Mines Bull. 260 (1927) and Bikerman, op. cit., p. 4]. At the<br />
upper portion of this region, the frequency becomes very nearly constant<br />
with respect to gas rate, and the bubble size correspondingly<br />
increases with gas rate. The bubble size is affected primarily by (1) orifice<br />
diameter, (2) liquid-inertia effects, (3) liquid viscosity, (4) liquid<br />
density, and (5) the relationship between the constancy of gas flow and<br />
the constancy of pressure at the orifice.<br />
Kumar et al. have done extensive experimental and theoretical<br />
work reported in Ind. Eng. Chem. Fundam., 7, 549 (1968); Chem.<br />
Eng. Sci, 24, part 1, 731; part 2, 749; part 3, 1711 (1969) and summarized<br />
in Adv. Chem. Eng., 8, 255 (1970). They, along with other<br />
investigators—Swope [Can. J Chem. Eng., 44, 169 (1972)], Tsuge<br />
and Hibino [J. Chem. Eng. Japan, 11, 307 (1972)], Pinczewski<br />
[Chem. Eng. Sci., 36, 405 (1981)], Tsuge and Hibino [Int. Chem.<br />
Eng., 21, 66 (1981)], and Takahashi and Miyahara [ibid., p. 224]—<br />
have solved the equations resulting from a force balance on the forming<br />
bubble, taking into account buoyancy, surface tension, inertia,<br />
and viscous-drag forces for both conditions of constant flow through<br />
the orifice and constant pressure in the gas chamber. The design<br />
method is complex and tedious and involves the solution of algebraic<br />
and differential equations. Although Mersmann [Ger. Chem. Eng., 1,<br />
1 (1978)] claims that the results of Kumar et al. (loc. cit.) well fit<br />
experimental data, Lanauze and Harn [Chem. Eng. Sci., 29, 1663<br />
(1974)] claim differently:<br />
Further, it has been shown that the mathematical formulation of Kumar’s<br />
model, including the condition of detachment, could not adequately<br />
describe the experimental situation—Kumar’s model has several fundamental<br />
weaknesses, the computational simplicity being achieved at the<br />
expense of physical reality.<br />
In lieu of careful independent checks of predictive accuracy, the<br />
results of the comprehensive theoretical work will not be presented<br />
here. Simpler, more easily understood predictive methods, for certain<br />
important limiting cases, will be presented. As a check on the accuracy<br />
of these simpler methods, it will perhaps be prudent to calculate the<br />
bubble diameter from the graphical representation by Mersmann<br />
(loc. cit.) of the results of Kumar et al. (loc. cit.) and the review by<br />
Kulkarni et al. (op. cit.)<br />
For conditions approaching constant flow through the orifice, a<br />
relationship derived by equating the buoyant force to the inertia force<br />
of the liquid [Davidson et al., Trans. Instn. Chem. Engrs., 38, 335<br />
(1960)] (dimensionally consistent),<br />
PHASE DISPERSION 14-101<br />
FIG. 14-92 Bubble-diameter correlation for air sparged into relatively inviscid liquids. D b = bubble diameter, D = orifice<br />
diameter, V o = gas velocity through sparging orifice, P = fluid density, and µ=fluid viscosity. [From Can. J. Chem. Eng., 54,<br />
503 (1976).]<br />
db = 1.378 × �3/5 (14-209)<br />
πg<br />
fits experimental data reasonably well. Surface tension and liquid viscosity<br />
tend to increase the bubble size—at a low Reynolds number.<br />
The effect of surface tension is greater for large orifice diameters. The<br />
magnitude of the diameter increase due to high liquid viscosity can be<br />
obtained from Eq. (14-208).<br />
For conditions approaching constant pressure at the orifice entrance,<br />
which probably simulates most industrial applications, there is no independently<br />
verified predictive method. For air at near atmospheric pressure<br />
sparged into relatively inviscid liquids (11 ~ 100 cP), the correlation<br />
of Kumar et al. [Can. J. Chem. Eng., 54, 503 (1976)] fits experimental<br />
data well. Their correlation is presented here as Fig. 14-92.<br />
Wilkinson et al. (op. cit.) make the following observation about the<br />
effect of gas density on bubble size: “The fact that the bubble size<br />
decreases slightly for higher gas densities can be explained on the<br />
basis of a force balance.”<br />
Jet Regime With further rate increases, turbulence occurs at the<br />
orifice, and the gas stream approaches the appearance of a continuous<br />
jet that breaks up 7.6 to 10.2 cm above the orifice. Actually, the stream<br />
consists of large, closely spaced, irregular bubbles with a rapid<br />
swirling motion. These bubbles disintegrate into a cloud of smaller<br />
ones of random size distribution between 0.025 cm or smaller and<br />
about 1.25 cm, with a mean size for air and water of about 0.4 cm<br />
(Leibson et al., loc. cit.). According to Wilkinson et al. (op. cit.), jetting<br />
begins when<br />
ρ g d oU o 2<br />
6Q 6/5<br />
NWe,g = � ≤ 2 (14-210)<br />
σ<br />
There are many contradictory reports about the jet regime, and theory,<br />
although helpful (see, for example, Siberman, loc. cit.), is as yet<br />
unable to describe the phenomena observed. The correlation of<br />
Kumar et al. (Fig. 14-92) is recommended for air-liquid systems.<br />
Formation at Multiple Orifices At high velocities, coalescence<br />
of bubbles formed at individual orifices occurs; Helsby and Tuson<br />
[Research (London), 8, 270 (1955)], for example, observed the frequent<br />
coalescence of bubbles formed in pairs or in quartets at an orifice.<br />
Multiple orifices spaced by the order of magnitude of the orifice<br />
diameter increase the probability of coalescence, and when the magnitude<br />
is small (as in a sintered plate), there is invariably some. The<br />
broken lines of Fig. 14-92 presumably represent zones of increased<br />
coalescence and relatively less effective dispersion as the gas rate<br />
through porous-carbon tubes is increased. Savitskaya [Kolloidn. Zh.,<br />
13, 309 (1951)] found that the average bubble size formed at the
14-102 EQUIPMENT FOR DISTILLATION, GAS ABSORPTION, PHASE DISPERSION, AND PHASE SEPARATION<br />
surface of a porous plate was such as to maintain constancy of the<br />
product of bubble specific surface and interfacial tension as the latter<br />
was varied by addition of a surfactant. Konig et al. [Ger. Chem. Eng.,<br />
1, 199 (1978)] produced bubble sizes varying from 0.5 to 4 mm by the<br />
use of two porous-plate spargers and one perforated-plate sparger<br />
with superficial gas velocities from 1 to 8 cm/s. The small bubble sizes<br />
were stabilized by adding up to 0.5 percent of various alcohols to<br />
water.<br />
At high-flow rates through perforated plates such as those that<br />
occur in distillation columns, Calderbank and Rennie [Trans. Instn.<br />
Chem. Engrs., 40, T3 (1962)]; Porter et al. [ibid., 45, T265 (1967)];<br />
Rennie and Evans [Br. Chem. Eng, 7, 498 (1962)]; and Valentin (op.<br />
cit., Chap. 3) have investigated and discussed the effect of the flow<br />
conditions through the multiple orifices on the froths and foams that<br />
occur above perforated plates.<br />
Entrainment and Mechanical Disintegration Gas can be<br />
entrained into a liquid by a solid or a stream of liquid falling from the<br />
gas phase into the liquid, by surface ripples or waves, and by the vertical<br />
swirl of a mass of agitated liquid about the axis of a rotating agitator.<br />
Small bubbles probably form near the surface of the liquid and are<br />
caught into the path of turbulent eddies, whose velocity exceeds the<br />
terminal velocity of the bubbles. The disintegration of a submerged<br />
mass of gas takes place by the turbulent tearing of smaller bubbles<br />
away from the exterior of the larger mass or by the influence of surface<br />
tension on the mass when it is attenuated by inertial or shear forces<br />
into a cylindrical or disk form. A fluid cylinder that is greater in length<br />
than in circumference is unstable and tends to break spontaneously<br />
into two or more spheres. These effects account for the action of fluid<br />
attrition and of an agitator in the disintegration of suspended gas.<br />
Quantitative correlations for gas entrainment by liquid jets and in agitated<br />
vessels will be given later.<br />
Foams Two excellent reviews (Shedlovsky, op. cit.; Lemlich, op.<br />
cit.; Herzhaft, op. cit.; and Heller et al., op. cit) covering the literature<br />
pertinent to foams have been published. A foam is formed when bubbles<br />
rise to the surface of a liquid and persist for a while without coalescence<br />
with one another or without rupture into the vapor space.<br />
The formation of foam, then, consists simply of the formation, rise,<br />
and aggregation of bubbles in a liquid in which foam can exist. The life<br />
of foams varies over many magnitudes—from seconds to years—but<br />
in general is finite. Maintenance of a foam, therefore, is a dynamic<br />
phenomenon.<br />
Gravitational force favors the separation of gas from liquid in a disperse<br />
system, causing the bubbles to rise to the liquid surface and the<br />
liquid contained in the bubble walls to drain downward to the main<br />
body of the liquid. Interfacial tension favors the coalescence and ultimate<br />
disappearance of bubbles; indeed, it is the cause of bubble<br />
destruction upon the rupture of the laminae.<br />
The viscosity of the liquid in a film opposes the drainage of the film<br />
and its displacement by the approach of coalescing bubbles. The<br />
higher the viscosity, the slower will be the film-thinning process; furthermore,<br />
if viscosity increases as the film grows thinner, the process<br />
becomes self-retarding. The viscosity of films appears to be greater<br />
than that of the main body of the parent liquid in many cases. Sometimes<br />
this is a simple temperature effect, the film being cooler<br />
because of evaporation; sometimes it is a concentration effect, with<br />
dissolved or fine suspended solids migrating to the interface and producing<br />
classical or anomalous increases in viscosity; at yet other times,<br />
the effect seems to occur without explanation.<br />
If the liquid laminae of a foam system can be converted to impermeable<br />
solid membranes, the film viscosity can be regarded as having<br />
become infinite, and the resulting solid foam will be permanent.<br />
Likewise, if the laminae are composed of a gingham plastic or a<br />
thixotrope, the foam will be permanently stable for bubbles whose<br />
buoyancy does not permit exceeding the yield stress. For other nonnewtonian<br />
fluids, however, and for all newtonian ones, no matter<br />
how viscous, the viscosity can only delay but never prevent foam<br />
disappearance. The popular theory, held since the days of Plateau,<br />
that foam life is proportional to surface viscosity and inversely proportional<br />
to interfacial tension, is not correct, according to Bikerman<br />
(op. cit., p. 161), who points out that it is contradicted by<br />
experiment.<br />
The idea that foam films drain to a critical thickness at which they<br />
spontaneously burst is also rejected by Bikerman. Foam stability, rather,<br />
is keyed to the existence of a surface skin of low interfacial tension<br />
immediately overlying a solution bulk of higher tension, latent until it is<br />
exposed by rupture of the superficial layer [Maragoni, Nuovo Cimento,<br />
2 (5–6), 239 (1871)]. Such a phenomenon of surface elasticity, resulting<br />
from concentration differences between bulk and surface of the liquid,<br />
accounts for the ability of bubbles to be penetrated by missiles without<br />
damage. It is conceivable that films below a certain thickness no longer<br />
carry any bulk of solution and hence have no capacity to close surface<br />
ruptures, thus becoming vulnerable to mechanical damage that will<br />
destroy them. The Maragoni phenomenon is consistent also with the<br />
observation that neither pure liquids nor saturated solutions will sustain<br />
a foam, since neither extreme will allow the necessary differences in<br />
concentration between surface and bulk of solution.<br />
The specific ability of certain finely divided, insoluble solids to stabilize<br />
foam has long been known [Berkman and Egloff, op. cit., p. 133;<br />
and Bikerman, op. cit., Chap. 11]. Bartsch [Kolloidchem. Beih, 20, 1<br />
(1925)] found that the presence of fine galena greatly extended the<br />
life of air foam in aqueous isoamyl alcohol, and the finer the solids, the<br />
greater the stability. Particles on the order of 50 µm length extended<br />
the life from 17 seconds to several hours. This behavior is consistent<br />
with theory, which indicates that a solid particle of medium contact<br />
angle with the liquid will prevent the coalescence of two bubbles with<br />
which it is in simultaneous contact. Quantitative observations of this<br />
phenomenon are scanty.<br />
Berkman and Egloff explain that some additives increase the flexibility<br />
or toughness of bubble walls, rather than their viscosity, to render<br />
them more durable. They cite as illustrations the addition of small<br />
quantities of soap to saponin solutions or of glycerin to soap solution<br />
to yield much more stable foam. The increased stability with ionic<br />
additives is probably due to electrostatic repulsion between charged,<br />
nearly parallel surfaces of the liquid film, which acts to retard draining<br />
and hence rupture.<br />
Characteristics of Dispersion<br />
Properties of Component Phases As discussed in the preceding<br />
subsection, dispersions of gases in liquids are affected by the viscosity<br />
of the liquid, the density of the liquid and of the gas, and the interfacial<br />
tension between the two phases. They also may be affected directly by<br />
the composition of the liquid phase. Both the formation of bubbles and<br />
their behavior during their lifetime are influenced by these quantities<br />
as well as by the mechanical aspects of their environment.<br />
Viscosity and density of the component phases can be measured<br />
with confidence by conventional methods, as can the interfacial<br />
tension between a pure liquid and a gas. The interfacial tension of a<br />
system involving a solution or micellar dispersion becomes less satisfactory,<br />
because the interfacial free energy depends on the concentration<br />
of solute at the interface. Dynamic methods and even<br />
some of the so-called static methods involve the creation of new<br />
surfaces. Since the establishment of equilibrium between this surface<br />
and the solute in the body of the solution requires a finite<br />
amount of time, the value measured will be in error if the measurement<br />
is made more rapidly than the solute can diffuse to the fresh<br />
surface. Eckenfelder and Barnhart (Am. Inst. Chem. Engrs., 42d<br />
national meeting, Repr. 30, Atlanta, 1960) found that measurements<br />
of the surface tension of sodium lauryl sulfate solutions by<br />
maximum bubble pressure were higher than those by DuNuoy tensiometer<br />
by 40 to 90 percent, the larger factor corresponding to a<br />
concentration of about 100 ppm, and the smaller to a concentration<br />
of 2500 ppm of sulfate.<br />
Even if the interfacial tension is measured accurately, there may be<br />
doubt about its applicability to the surface of bubbles being rapidly<br />
formed in a solution of a surface-active agent, for the bubble surface may<br />
not have time to become equilibrated with the solution. Coppock and<br />
Meiklejohn [Trans. Instn. Chem. Engrs., 29, 75 (1951)] reported that<br />
bubbles formed in the single-bubble regime at an orifice in a solution of<br />
a commercial detergent had a diameter larger than that calculated in<br />
terms of the measured surface tension of the solution [Eq. (14-206)].<br />
The disparity is probably a reflection of unequilibrated bubble laminae.
One concerned with the measurement of gas-liquid interfacial tension<br />
should consult the useful reviews of methods prepared by<br />
Harkins [in Chap. 9 of Weissberger, Techniques of Organic Chemstry,<br />
2d ed., vol. 1, part 2, Interscience, New York, 1949), Schwartz and<br />
coauthors [Surface Acttve Agents, vol. 1, Interscience, New York,<br />
1949, pp. 263–271; Surface Active Agents and Detergents, vol. 2,<br />
Interscience, New York, 1958, pp. 389–391, 417–418], and by Adamson<br />
[Physical Chemistry of Surfaces, Interscience, New York, 1960].<br />
Dispersion Characteristics The chief characteristics of gas-inliquid<br />
dispersions, like those of liquid-in-gas suspensions, are heterogeneity<br />
and instability. The composition and structure of an unstable<br />
dispersion must be observed in the dynamic situation by looking at the<br />
mixture, with or without the aid of optical devices, or by photographing<br />
it, preferably in nominal steady state; photographs usually are<br />
required for quantitative treatment. Stable foams may be examined<br />
after the fact of their creation if they are sufficiently robust or if an<br />
immobilizing technique such as freezing is employed [Chang et al.,<br />
Ind. Eng Chem., 48, 2035 (1956)].<br />
The rate of rise of bubbles has been discussed by Kulkarni, op. cit.;<br />
Benfratello, Energ Elettr., 30, 80 (1953); Haberman and Morton,<br />
Report 802: David W. Taylor Model Basin, Washington, September<br />
1953; Jackson, loc. cit.; Valentin, op. cit., Chap. 2; Soo, op. cit., Chap.<br />
3; Calderbank, loc. cit., p. CE220; and Levich, op. cit., Chap. 8). A<br />
comprehensive and apparently accurate predictive method has been<br />
published [Jamialahamadi et al., Trans ICE, 72, part A, 119–122<br />
(1994)]. Small bubbles (below 0.2 mm in diameter) are essentially<br />
rigid spheres and rise at terminal velocities that place them clearly in<br />
the laminar-flow region; hence their rising velocity may be calculated<br />
from Stokes’ law. As bubble size increases to about 2 mm, the spherical<br />
shape is retained, and the Reynolds number is still sufficiently<br />
small (
14-104 EQUIPMENT FOR DISTILLATION, GAS ABSORPTION, PHASE DISPERSION, AND PHASE SEPARATION<br />
require careful technique. Satisfactory photographic methods have<br />
been developed by Vermenlen, Williams, and Langlois [Chem. Eng.<br />
Progr., 51, 85 (1955)] and by Calderbank [Trans. Instn. Chem. Engrs.,<br />
36, 443 (1958)] and are described by these authors. Calderbank’s<br />
technique resulted in particularly precise measurements that permitted<br />
a good estimation of the surface area of the dispersed bubbles.<br />
Methods of Gas Dispersion The problem of dispersing a gas in<br />
a liquid may be attacked in several ways: (1) The gas bubbles of the<br />
desired size or which grow to the desired size may be introduced<br />
directly into the liquid; (2) a volatile liquid may be vaporized by either<br />
decreasing the system pressure or increasing its temperature; (3) a<br />
chemical reaction may produce a gas; or (4) a massive bubble or stream<br />
of gas is disintegrated by fluid shear and/or turbulence in the liquid.<br />
Spargers: Simple Bubblers The simplest method of dispersing<br />
gas in a liquid contained in a tank is to introduce the gas through an<br />
open-end standpipe, a horizontal perforated pipe, or a perforated<br />
plate at the bottom of the tank. At ordinary gassing rates (corresponding<br />
to the jet regime), relatively large bubbles will be produced<br />
regardless of the size of the orifices.<br />
Perforated-pipe or -plate spargers usually have orifices 3 to 12 mm<br />
in diameter. Effective design methods to minimize maldistribution<br />
are presented in the fifth edition of this handbook, p. 5–47, 1973, and<br />
by Knaebel [Chem. Eng., 116 (Mar. 9, 1981)]. For turbulent flow conditions<br />
into the sparger, the following relationship will allow design of<br />
a perforated-pipe sparger for a given degree of maldistribution provided<br />
N h > 5 and length/diameter
operation, for the resistance of a septum to the flow of gas increases<br />
when it is wet. The air permeabilities for water-submerged porous<br />
carbon of some of the grades listed in the table are shown in Fig. 14-96.<br />
The data were determined with septa 0.625 in thick in water at 70°F.<br />
Comparable wet-permeability data for 1-in Alundum plates of two<br />
grades of fineness are given in Table 14-24.<br />
The gas rate at which coalescence begins to reduce the effectiveness<br />
of dispersion appears to depend not only on the pore size and<br />
pore structure of the dispersing medium but also on the liquid properties,<br />
liquid depth, agitation, and other features of the sparging environment;<br />
coalescence is strongly dependent on the concentration of<br />
surfactants capable of forming an electrical double layer and thus<br />
produce ionic bubbles, long-chain alcohols in water being excellent<br />
examples. For porous-carbon media, the manufacturer suggests that<br />
the best dispersion performance will result if the broken-line regions<br />
of Fig. 14-96 are avoided. For porous stainless-steel spargers, which<br />
extend to a lower pore size than carbon, Micro Metallic Division, Pall<br />
Corp., recommends (Release 120A, 1959) a working limit of 8 ft/min<br />
(0.044 m/s) to avoid serious coalescence. This agrees with the data<br />
reported by Konig et al. (loc. cit.), in which 0.08 m/s was used and<br />
bubbles as small as 1 mm were produced from a 5-µm porous<br />
sparger.<br />
Slabs of porous material are installed by grouting or welding<br />
together to form a diaphragm, usually horizontal. Tubes are prone to<br />
produce coalesced gas at rates high enough to cause bubbling from<br />
their lower faces, but they have the advantage of being demountable<br />
for cleaning or replacement (U.S. Patent 2,328,655). Roe [Sewage<br />
(a) (b)<br />
PHASE DISPERSION 14-105<br />
FIG. 14-95 Comparison of bubbles from a porous septum and from a perforated-pipe sparger. Air in water at 70°F. (a) Grade<br />
25 porous-carbon diffuser operating under a pressure differential of 13.7 in of water. (b) Karbate pipe perforated with 1/16-in<br />
holes on 1-in centers. To convert inches to centimeters, multiply by 2.54; °C = 5 ⁄9 (°F − 32). (National Carbon Co.)<br />
Works J., 18, 878 (1945)] claimed that silicon carbide tubes are superior<br />
to horizontal plates, principally because of the wiping action of<br />
the liquid circulating past the tube. He reported respective maximum<br />
capacities of 2.5 and 1.5 cm 2 /s of gas/cm 2 of sparger for a horizontal<br />
tube and a horizontal plate of the same material (unspecified grade).<br />
Mounting a flat-plate porous sparger vertically instead of horizontally<br />
seriously reduces the effectiveness of the sparger for three reasons: (1)<br />
The gas is distributed over a reduced cross section; (2) at normal rates,<br />
the lower portion of the sparger may not operate because of difference<br />
in hydrostatic head; and (3) there is a marked tendency for bubbles<br />
to coalesce along the sparger surface. Bone (M.S. thesis in<br />
chemical engineering, University of Kansas, 1948) found that the oxygen<br />
sulfite solution coefficient for a 3.2- by 10-cm rectangular porous<br />
carbon sparger was 26 to 41 percent lower for vertical than for horizontal<br />
operation of the sparger, the greatest reduction occurring when<br />
the long dimension was vertical.<br />
Precipitation and Generation Methods For a thorough understanding<br />
of the phenomena involved, bubble nucleation should be considered.<br />
A discussion of nucleation phenomena is beyond the scope of<br />
this handbook; however, a starting point with recent references is Deng,<br />
Lee, and Cheng, J. Micromech. Microeng., 15, 564 (2005), and Jones,<br />
Evans, and Galvin, Adv. Colloid and Interface Sci. 80, 27 (1999).<br />
Gas Dispersion—Vessel Headspace Boerma and Lankester<br />
have measured the surface aeration of a nine-bladed disk-type turbine<br />
(NOTE: A well-designed pitched-blade turbine will give equal or better<br />
performance). In a fully baffled vessel, the optimum depth to obtain<br />
maximum gas dispersion was 15 to 50 percent of the impeller diameter.
14-106 EQUIPMENT FOR DISTILLATION, GAS ABSORPTION, PHASE DISPERSION, AND PHASE SEPARATION<br />
TABLE 14-23 Characteristics of Porous Septa<br />
Air-permeability data<br />
Avg. Diaphragm Pressure Air flow,<br />
Avg. % pore thickness, differential, cu ft/<br />
Grade porosity diam. in in water (sq ft)(min)<br />
Alundum porous alumina*<br />
P2220 25 1 2 0.35<br />
P2120 36 60 1 2 2<br />
P260 35 164 1 2 15<br />
P236 34 240 1 2 40<br />
P216 720 1 2 110<br />
National porous carbon†<br />
60 48 33 1 2<br />
45 48 58 1 2 2<br />
25 48 120 1 2 13<br />
Filtros porous silica‡<br />
Extra fine 26.0 55 1.5 2 1–3<br />
Fine 28.8 110 1.5 2 4–8<br />
Medium fine 31.1 130 1.5 2 9–12<br />
Medium 33.7 150 1.5 2 13–20<br />
Medium coarse 33.8 200 1.5 2 21–30<br />
Coarse 34.5 250 1.5 2 31–59<br />
Extra coarse 36.5 300 1.5 2 60–100<br />
Porous plastic§<br />
Teflon 9 0.125 1.38 5<br />
Kel-F 15 0.125 1.38 13<br />
Micro Metallic porous stainless steel§,¶<br />
H 45 5 0.125 1.38 1.8<br />
G 50 10 0.125 1.38 3<br />
F 50 20 0.125 1.38 5<br />
E 50 35 0.125 1.38 18<br />
D 50 65 0.125 1.38 60<br />
C 55 165 0.125 27.7 990<br />
*Data by courtesy of Norton Co., Worcester, Mass. A number of other grades<br />
between the extremes listed are available.<br />
†Data by courtesy of National Carbon Co., Cleveland, Ohio.<br />
‡Data by courtesy of Filtros Inc., East Rochester, N.Y.<br />
§Data by courtesy of Pall Corp., Glen Cove, N.Y.<br />
¶Similar septa made from other metals are available.<br />
In a vessel with baffles extending only halfway to the liquid surface the<br />
optimum impeller submergence increased with agitator speed<br />
because of the vortex formed. At optimum depth, the following correlation<br />
is recommended for larger vessels:<br />
Q = 0.00015(N/10) 2.5 (D/0.1) 4.5 (14-214)<br />
with Q in m 3 /s, N in rps, and D in m. Thus, a typical 3-m-diameter<br />
plant-size vessel, with four-blade pitched impeller (D = 1 m) operating<br />
at 2 rps will give gas dispersion from the headspace into the batch of<br />
Q = 0.00015(2/10) 2.5 (2/0.1) 4.5 = 1.9 m 3 /s (4000 ft 3 /min).<br />
Borema et al. (op. cit.) recommend headspace gas dispersion with<br />
partial baffling for fatty oils hydrogenation in stirred reactors: “The<br />
hydrogen in the head-space of the closed reactor can again be brought<br />
into contact with the liquid by a stirrer under the liquid level, . . .” And<br />
Penney in Paul et al. (loc. cit.) says, “partial baffling can be very effective<br />
to produce a vortex, which can effectively drawdown gas from the<br />
headspace. . . .” However, Middleton et al. in Paul et al. (op. cit) say,<br />
“The simplest self-inducer for an agitated vessel is an impeller located<br />
near the surface, sometimes with the upper part of the baffles removed<br />
so as to encourage the formation of a vortex. This is, however, a sensitive<br />
and unstable arrangement. It is better, although probably more<br />
expensive, to use a self-inducing impeller system in which gas is drawn<br />
down a hollow shaft to the low-pressure region behind the blades of a<br />
suitable, often shrouded impeller. ...Various proprietary designs are<br />
available, such as the Ekato gasjet, Prasair AGR and the Frings Friborator.<br />
. . .” Figure 14-97 illustrates a gas-inducing hollow shaft/hollow<br />
impeller agitator. In many hydrogenation reactors, the impeller just<br />
FIG. 14-96 Pressure drop across porous-carbon diffusers submerged in water<br />
at 70°F. To convert feet per minute to meters per second, multiply by 0.0051; to<br />
convert inches to millimeters, multiply by 25.4; °C = 5 ⁄9 (°F − 32). (National<br />
Carbon Co.)<br />
underneath the free surface has, without any doubt, performed<br />
admirably; consequently, one must consider this fact very carefully<br />
before using a self-inducing impeller.<br />
Gas dispersion through the free surface by mechanical aerators is<br />
commonplace in aerobic waste-treatment lagoons. Surface aerators<br />
are generally of three types: (1) large-diameter flow-speed turbines<br />
operating just below the free surface of the liquid, often pontoonmounted;<br />
(2) small-diameter high-speed (normally motor-speed)<br />
propellers operating in draft tubes, the units of which are always pontoon-mounted;<br />
and (3) hollow-tube turbines (Fig. 14-97). An example<br />
of the turbine type is illustrated in Fig. 14-98 and the propeller<br />
type is illustrated in Fig. 14-99. There are several other styles of the<br />
turbine type; for instance, Mixing Equipment Co., Inc., (www.lightninmixers.com),<br />
uses an unshrouded 45° axial-flow turbine [see Dykman<br />
and Michel, Chem. Eng., 117 (Mar. 10, 1969)], and Infilco<br />
(www.infilcodegremont.com) makes a unit that has a large-diameter<br />
vaned disk operating just below the free surface with a smaller-diameter<br />
submerged-disk turbine for additional solids suspension.<br />
Aeration injectors, like the one shown in Fig. 14-100 by Penberthy<br />
[a division of Houdialle Industries (penberthy-online.com/jet1.asp)],<br />
are used to provide mass transfer in gas-liquid applications, and simple<br />
impingement aerators (Fig. 14-101) are sometimes used for masstransfer<br />
applications.<br />
Equipment Selection Ideally, selection of equipment to produce<br />
a gas-in-liquid dispersion should be made on the basis of a complete<br />
economic analysis. The design engineer and especially the<br />
pilot-plant engineer seldom have sufficient information or time to do<br />
a complete economic analysis. In the following discussion, some<br />
TABLE 14-24<br />
1 in Thick*<br />
Wet Permeability of Alundum Porous Plates<br />
Dry permeability at 2 in Pressure differential Air flow through<br />
of water differential, across wet plate, wet plate,<br />
cu ft/(min)(sq ft) in of water cu ft/(min)(sq ft)<br />
4.3 20.67 2.0<br />
21.77 3.0<br />
22.86 4.0<br />
23.90 5.0<br />
55.0 4.02 1.0<br />
4.14 2.0<br />
4.22 3.0<br />
4.27 4.0<br />
4.30 5.0<br />
*Data by courtesy of Norton Company, Worcester, Mass. To convert inches to<br />
centimeters, multiply by 2.54; to convert feet per minute to meters per second,<br />
multiply by 0.0051.
FIG. 14-97 Installation and dimensions of a tube stirrer: h/d = 1; H/D ≈ 1; D/δ = 10; A = 1.5 d w 2 ; D/dN = 10;<br />
d/d N = 3; d/d ri = 7.5; d/d ra = 6. [Zlokarnik, Ullman’s Encyclopedia of Industrial Chemistry, Sec. 25, VCH, Weinheim,<br />
Germany, 1988.]<br />
guidelines are given as to what equipment might be feasible and what<br />
equipment might prove most economical.<br />
For producing foam for foam-separation processes, perforated-plate or<br />
porous-plate spargers are normally used. Mechanical agitators are often<br />
not effective in the light foams needed in foam fractionation. Dissolvedair<br />
flotation, based on the release of a pressurized flow in which oxygen<br />
was dissolved, has been shown to be effective for particulate removal<br />
when sparged air failed because the bubbles formed upon precipitation<br />
are smaller—down to 80 µm—than bubbles possible with sparging, typically<br />
1000 µm [Grieves and Ettelt, AIChE J., 13, 1167 (1967)]. Mechanically<br />
agitated surface aerators such as the Wemco-Fagergren flotation<br />
unit (Fig. 14-102) are used extensively for ore flotation.<br />
To produce foam in batch processes, mechanical agitators are used<br />
almost exclusively. The gas can either be introduced through the free<br />
surface by the entraining action of the impeller or alternatively<br />
sparged beneath the impeller. In such batch operation, the liquid level<br />
gradually rises as the foam is generated; thus, squatly impellers such as<br />
turbines are rapidly covered with foam and must almost always be<br />
sparged from below. Tall impellers such as wire whips (Fig. 14-103)<br />
are especially well suited to entrain gas from the vapor space. Intermeshing<br />
wire whips are standard kitchen utensils for producing<br />
foamed meringues, consisting of air, vegetable oil, and egg whites. For<br />
a new application, generally some experimentation with different<br />
impellers is necessary in order to get the desired fine final bubble size<br />
without getting frothing over initially. For producing foams continually,<br />
an aspirating venturi nozzle and restrictions in pipes such as baffles<br />
and metal gauzes are generally most economical.<br />
For gas absorption, the equipment possibilities are generally packed<br />
columns; plate distillation towers, possibly with mechanical agitation<br />
on every plate; deep-bed contactors (bubble columns or sparged<br />
lagoons); and mechanically agitated vessels or lagoons. <strong>Packed</strong> towers<br />
and plate distillation columns are discussed elsewhere. Generally these<br />
FIG. 14-98 The Cyclox surface aerator. (Cleveland Mixer Co.)<br />
PHASE DISPERSION 14-107<br />
devices are used when a relatively large number of stages (more than<br />
two or three) is required to achieve the desired result practically.<br />
The volumetric mass-transfer coefficients and heights of transfer<br />
units for bubble columns and packed towers have been compared for<br />
absorption of CO2 into water by Houghton et al. [Chem. Eng. Sci., 7,<br />
26 (1957)]. The bubble column will tolerate much higher vapor velocities,<br />
and in the overlapping region (superficial gas velocities of 0.9 to<br />
1.8 cm/s), the bubble column has about three times higher masstransfer<br />
coefficient and about 3 times greater height of transfer unit.<br />
The liquid in a bubble column is, for practical purposes, quite well<br />
mixed; thus, chemical reactions and component separations requiring<br />
significant plug flow of the liquid cannot be effected with bubble<br />
columns. Bubble columns and agitated vessels are the ideal equipment<br />
for processes in which the fraction of gas absorbed need not be<br />
great, possibly the gas can be recycled, and the liquid can or should be<br />
well mixed. The gas phase in bubble columns is not nearly so well<br />
back-mixed as the liquid, and often plug flow of the gas is a logical<br />
assumption, but in agitated vessels the gas phase is also well mixed.<br />
The choice of a bubble column or an agitated vessel depends primarily<br />
on the solubility of the gas in the liquid, the corrosiveness of the<br />
liquid (often a gas compressor can be made of inexpensive material,<br />
whereas a mechanical agitator may have to be made of exotic, expensive<br />
materials), and the rate of chemical reaction as compared with the<br />
mass-transfer rate. Bubble columns and agitated vessels are seldom<br />
used for gas absorption except in chemical reactors. As a general rule,<br />
if the overall reaction rate is five times greater than the mass-transfer<br />
rate in a simple bubble column, a mechanical agitator will be most<br />
economical unless the mechanical agitator would have to be made<br />
from considerably more expensive material than the gas compressor.<br />
In bubble columns and simply sparged lagoons, selecting the<br />
sparger is a very important consideration. In the turbulent regime<br />
(superficial gas velocity greater than 4.6 to 6 cm/s), inexpensive
14-108 EQUIPMENT FOR DISTILLATION, GAS ABSORPTION, PHASE DISPERSION, AND PHASE SEPARATION<br />
FIG. 14-99 Propeller-type surface aerator. (Ashbrook-Simon-Hartley Corp.)<br />
perforated-pipe spargers should be used. Often the holes must be<br />
placed on the pipe bottom in order to make the sparger free-draining<br />
during operation. In the quiescent regime, porous septa will often give<br />
considerably higher overall mass-transfer coefficients than perforated<br />
plates or pipes because of the formation of tiny bubbles that do not<br />
coalesce. Chain and coworkers (First International Symposium on<br />
Chemical Microbiology, World Health Organization, Monograph Ser.<br />
10, Geneva, 1952) claimed that porous disks are about twice as effective<br />
as open-pipe and ring spargers for the air oxidation of sodium sulfite.<br />
Eckenfelder [Chem. Eng. Progr., 52(7), 290 (1956)] has compared<br />
the oxygen-transfer capabilities of various devices on the basis of the<br />
operating power required to absorb a given quantity of O2. The<br />
installed cost of the various pieces of equipment probably would not<br />
vary sufficiently to warrant being including in an economic analysis.<br />
Surface mechanical aerators are not included in this comparison. Of<br />
the units compared, it appears that porous tubes give the most efficient<br />
power usage. Kalinske (Adv. Biol. Waste Treatment, 1963, p. 157) has<br />
compared submerged sparged aerators with mechanical surface aerators.<br />
He has summarized this comparison in Water Sewage Works, 33<br />
(January 1968). He indicates that surface aerators are significantly<br />
more efficient than subsurface aeration, both for oxygen absorption<br />
and for gas-stripping operations.<br />
FIG. 14-100 Aeration ejector. (Penberthy, a division of Houdaille Industries, Inc.)<br />
Zlokarnik and Mann (paper at Mixing Conf., Rindge, New Hampshire,<br />
August 1975) have found the opposite of Kalinske, i.e., subsurface<br />
diffusers, subsurface sparged turbines, and surface aerators<br />
compare approximately as 4:2:1 respectively in terms of O2 transfer<br />
efficiency; however, Zlokarnik [Adv. Biochem. Eng., 11, 157 (1979)]<br />
later indicates that the scale-up correlation used earlier might be<br />
somewhat inaccurate. When all available information is considered, it<br />
appears that with near-optimum design any of the aeration systems<br />
(diffusers, submerged turbines, or surface impellers) should give a<br />
transfer efficiency of at least 2.25 kg O2/kWh. Thus, the final selection<br />
should probably be made primarily on the basis of operational reliability,<br />
maintenance, and capital costs.<br />
Mass Transfer Mass transfer in plate and packed gas-liquid contactors<br />
has been covered earlier in this subsection. Attention here will<br />
be limited to deep-bed contactors (bubble columns and agitated vessels).<br />
Theory underlying mass transfer between phases is discussed in<br />
Sec. 5 of this handbook.<br />
To design deep-bed contactors for mass-transfer operations, one<br />
must have, in general, predictive methods for the following design<br />
parameters:<br />
• Flooding (for both columns and agitator impellers)<br />
• Agitator power requirements
FIG. 14-101 Impingement aerator.<br />
• Gas-phase and liquid-phase mass-transfer coefficients<br />
• Interfacial area<br />
• Interface resistance<br />
• Mean concentration driving force for mass transfer<br />
In most cases, available methods are incomplete or unreliable, and<br />
some supporting experimental work is necessary, followed by scaleup.<br />
The methods given here should allow theoretical feasibility studies,<br />
help minimize experimentation, and permit a measure of<br />
optimization in final design.<br />
Flooding of Agitator Impellers Impeller <strong>flooding</strong> correlations<br />
for six-blade disk (6BD) Rusthon turbines and six-blade disk Smith<br />
turbines (Chemineer designation: CD-6) are presented by Bakker,<br />
Myers, and Smith [Chem. Eng., 101, 98 (Dec. 1994)] and a review of<br />
impeller <strong>flooding</strong>. The Bakker et al. (loc. cit.) correlation is<br />
Q/ND 3 = C FLN Fr(D/T) 3.5 (14-215)<br />
where C FL = 30 for a 6BD impeller and C FL = 70 for a concave blade<br />
CD-6 impeller and N Fr = Froude number = N 2 D/g; Q = gas flow rate<br />
at <strong>flooding</strong>, m 3 /s; N = impeller speed, rps; D = impeller diameter, m;<br />
and T = tank diameter, m. Note that the CD-6 impeller will handle<br />
70/30 = 2.33 times the gas a 6BD will handle, without <strong>flooding</strong>, at the<br />
FIG. 14-102 The Wemco-Fagergren flotation machine. [From www.<br />
tucottbus.de/BTU/Fak4/Aufbtech/pages/pbrr_N 7 Sep2-(elstat-flotat).<strong>pdf</strong>].<br />
FIG. 14-103 Wire whip.<br />
PHASE DISPERSION 14-109<br />
same N and D; this is the great advantage of the CD-6 along with<br />
lower power decrease as the gas flow rate increases.<br />
Gassed Impeller Power Bakker et al. (op. cit.) have given a<br />
gassed power correlation for the 6BD and CD-6 impellers.<br />
Pg/Pu = [1 − (b − aµ)]N d Fr tanh (cNA) (14-216a)<br />
where Pg = gassed power, W; Pu = ungassed power, W; NA = Q/ND 3 ;<br />
and the constants of Eq. (14-216a) are given in Table 14-25.<br />
As mentioned previously, the CD-6 suffers much less power<br />
decrease with increased gassing compared to the 6BD. For example,<br />
at NA = 0.15, Pg/Pu = 0.7 for the CD-6 and 0.5 for the CD-6.<br />
The ungassed power is calculated by<br />
Pu = Npρ/N 3 D 5 (14-216b)<br />
where the impeller power numbers Np are given Table 14-25.<br />
Bakker et al. (op. cit.) and Sensel et al. (op. cit.) have given correlations<br />
for gas holdup in agitated vessels. The Bakker et al. correlation is<br />
ε=Cε = (Pg/V) A B vsg (14-217)<br />
where C ε = 0.16, A = 0.33, B = 0.67; V = batch volume, m 3 ; v sg = superficial<br />
gas velocity = Q/[(π/4)T 2 ]; T = tank diameter, m. Equation (14-<br />
217) applies for both 6BD and CD-6.<br />
Interfacial Area This consideration in agitated vessels has been<br />
reviewed and summarized by Tatterson (op. cit.). Predictive methods<br />
for interfacial area are not presented here because correlations are<br />
given for the overall volumetric mass transfer coefficient liquid phase<br />
controlling mass transfer.<br />
TABLE 14-25<br />
Numbers<br />
Constants in Eq. (14-216) and Impeller Power<br />
Impeller type a b c d Np<br />
6BD 0.72 0.72 24 0.25 3.2<br />
CD-6 0.12 0.44 12 0.37 5.5
14-110 EQUIPMENT FOR DISTILLATION, GAS ABSORPTION, PHASE DISPERSION, AND PHASE SEPARATION<br />
Overall Mass-Transfer Coefficient In systems with relatively<br />
sparing soluble gases, where the gas-phase resistance is negligible, the<br />
mass-transfer rate can be determined by using the concept of an overall<br />
volumetric mass-transfer coefficient k La as follows:<br />
M s = kLa(Cs* − Cs,b) (14-218)<br />
where Ms = solute molar mass-transfer rate, kg⋅mol/s; kLa = overall<br />
mass-transfer coefficient, 1/s; Cs* = solute concentration in equilibrium<br />
with the liquid phase, kg⋅mol/s; and C s,b = solute concentration in<br />
bulk of liquid.<br />
Bakker et al. (op. cit.) have given a correlation for kLa for aqueous<br />
systems in the absence of significant surface active agents.<br />
kLa = CkLa(Pg/V) avsg b (14-219)<br />
where CkLa = 0.015, 1/s; Eq. (14-219) applies for both 6BD and CD-6.<br />
Interfacial Phenomena These can significantly affect overall<br />
mass transfer. Deckwer, Bubble Column Reactors, Wiley, Hoboken,<br />
N.J., 1992, has covered the effect of surfactants on mass transfer in<br />
bubble columns. In fermentation reactors, small quantities of surface-active<br />
agents (especially antifoaming agents) can drastically<br />
reduce overall oxygen transfer (Aiba et al., op. cit., pp. 153, 154), and<br />
in aerobic mechanically aerated waste-treatment lagoons, overall oxygen<br />
transfer has been found to be from 0.5 to 3 times that for pure<br />
water from tests with typical sewage streams (Eckenfelder et al., op.<br />
cit., p. 105).<br />
One cannot quantitatively predict the effect of the various interfacial<br />
phenomena; thus, these phenomena will not be covered in detail<br />
here. The following literature gives a good general review of the<br />
effects of interfacial phenomena on mass transfer: Goodridge and<br />
Robb, Ind. Eng. Chem. Fund., 4, 49 (1965); Calderbank, Chem. Eng.<br />
(London), CE 205 (1967); Gal-Or et al., Ind. Eng. Chem., 61(2), 22<br />
(1969); Kintner, Adv. Chem. Eng., 4 (1963); Resnick and Gal-Or, op.<br />
cit., p. 295; Valentin, loc. cit.; and Elenkov, loc. cit., and Ind. Eng.<br />
Chem. Ann. Rev. Mass Transfer, 60(1), 67 (1968); 60(12), 53 (1968);<br />
62(2), 41 (1970). In the following outline, the effects of the various<br />
interfacial phenomena on the factors that influence overall mass<br />
transfer are given. Possible effects of interfacial phenomena are tabulated<br />
below:<br />
1. Effect on continuous-phase mass-transfer coefficient<br />
a. Impurities concentrate at interface. Bubble motion produces<br />
circumferential surface-tension gradients that act to retard<br />
circulation and vibration, thereby decreasing the mass-transfer<br />
coefficient.<br />
b. Large concentration gradients and large heat effects (very<br />
soluble gases) can cause interfacial turbulence (the Marangoni<br />
effect), which increases the mass-transfer coefficient.<br />
2. Effect on interfacial area<br />
a. Impurities will lower static surface tension and give smaller<br />
bubbles.<br />
b. Surfactants can electrically charge the bubble surface (produce<br />
ionic bubbles) and retard coalescence (soap stabilization of an<br />
oil-water emulsion is an excellent example of this phenomenon),<br />
thereby increasing the interfacial area.<br />
c. Large concentration gradients and large heat effects can<br />
cause bubble breakup.<br />
3. Effect on mean mass-transfer driving force<br />
a. Relatively insoluble impurities concentrate at the interface,<br />
giving an interfacial resistance. This phenomenon has been used in<br />
retarding evaporation from water reservoirs.<br />
b. The axial concentration variation can be changed by changes<br />
in coalescence. The mean driving force for mass transfer is therefore<br />
changed.<br />
Gas Holdup (ε) in Bubble Columns With coalescing systems,<br />
holdup may be estimated from a correlation by Hughmark [Ind. Eng<br />
Chem. Process Des. Dev., 6, 218–220 (1967)] reproduced here as Fig.<br />
14-104. For noncoalescing systems, with considerably smaller bubbles,<br />
ε can be as great as 0.6 at U sg = 0.05 m/s, according to Mersmann<br />
[Ger. Chem. Eng., 1, 1 (1978)].<br />
LIVE GRAPH<br />
Click here to view<br />
FIG. 14-104 Gas holdup correlation. [Ind. Eng. Chem. Process Des. Dev., 6,<br />
218 (1967).]<br />
It is often helpful to use the relationship between ε and superficial<br />
gas velocity (Usg) and the rise velocity of a gas bubble relative to the<br />
liquid velocity (Ur + UL, with UL defined as positive upward):<br />
ε= � (14-220)<br />
Ur + UL Rise velocities of bubbles through liquids have been discussed previously.<br />
For a better understanding of the interactions between parameters,<br />
it is often helpful to calculate the effective bubble rise velocity<br />
Ur from measured valves of ε; for example, the data of Mersmann<br />
(loc. cit.) indicated ε =0.6 for Usg = 0.05 m/s, giving Ur = 0.083 m/s,<br />
which agrees with the data reported in Fig. 14-43 for the rise velocity<br />
of bubble clouds. The rise velocity of single bubbles, for db ∼ 2 mm,<br />
is about 0.3 m/s, for liquids with viscosities not too different from<br />
water. Using this value in Eq. (14-220) and comparing with Fig. 14-<br />
104, one finds that at low values of Usg, the rise velocity of the bubbles<br />
is less than the rise velocity of a single bubble, especially for smalldiameter<br />
tubes, but that the opposite occurs for large values of Usg.<br />
More recent literature regarding generalized correlational efforts<br />
for gas holdup is adequately reviewed by Tsuchiya and Nakanishi<br />
[Chem. Eng Sci., 47(13/14), 3347 (1992)] and Sotelo et al. [Int. Chem.<br />
Eng., 34(1), 82–90 (1994)]. Sotelo et al. (op. cit.) have developed a<br />
dimensionless correlation for gas holdup that includes the effect of gas<br />
and liquid viscosity and density, interfacial tension, and diffuser pore<br />
diameter. For systems that deviate significantly from the waterlike liquids<br />
for which Fig. 14-104 is applicable, their correlation (the fourth<br />
numbered equation in the paper) should be used to obtain a more<br />
accurate estimate of gas holdup. Mersmann (op. cit.) and Deckwer et<br />
al. (op. cit.) should also be consulted.<br />
Liquid-phase mass-transfer coefficients in bubble columns have<br />
been reviewed by Calderbank (“Mixing,” loc. cit.), Fair (Chem. Eng.,<br />
loc. cit.), Mersmann [Ger. Chem. Eng. 1, 1 (1978), Int. Chem. Eng.,<br />
32(3) 397–405 (1991)], Deckwer et al. [Can. J. Chem. Eng, 58, 190<br />
(1980)], Hikita et al. [Chem. Eng. J., 22, 61 (1981)] and Deckwer and<br />
Schumpe [Chem. Eng. Sci., 48(5), 889–911 (1993)]. The correlation<br />
of Ozturk, Schumpe, and Deckwer [AIChE J., 33, 1473–1480 (1987)]<br />
is recommended. Deckwer et al. (op. cit.) have documented the case<br />
for using the correlation:<br />
Ozturk et al. (1987) developed a new correlation on the basis of a modification<br />
of the Akita-Yoshida correlation suggested by Nakanoh and Yoshida<br />
(1980). In addition, the bubble diameter db rather than the column diameter<br />
was used as the characteristic length as the column diameter has little<br />
influence on kLa. The value of db was assumed to be approximately constant<br />
(db = 0.003 m). The correlation was obtained by nonlinear regression<br />
is as follows:<br />
U sg
� � = 0.62� � 0.5<br />
� � 0.33<br />
� � 0.29 gρL 2 dB<br />
�<br />
µL 2<br />
gρLd B 2<br />
kLa dB<br />
µ L<br />
� DL<br />
U G<br />
� (ρLDL)<br />
ρG �<br />
ρL<br />
� σ<br />
× � � 0.68<br />
� � 0.04<br />
�<br />
(gdB) 0.5<br />
(14-221)<br />
where k La = overall mass-transfer coefficient, d B = bubble diameter =<br />
0.003 m, D L = diffusivity of gas in liquid, ρ =density, µ =viscosity, σ =<br />
interfacial tension, g = gravitational acceleration.<br />
As mentioned earlier, surfactants and ionic solutions significantly<br />
affect mass transfer. Normally, surface affects act to retard coalescence<br />
and thus increase the mass transfer. For example, Hikata et al. [Chem.<br />
Eng. J., 22, 61–69 (1981)] have studied the effect of KCl on mass transfer<br />
in water. As KCI concentration increased, the mass transfer<br />
increased up to about 35 percent at an ionic strength of 6 gm/l. Other<br />
investigators have found similar increases for liquid mixtures.<br />
Axial Dispersion Backmixing in bubble columns has been<br />
extensively studied. Wiemann and Mewes [Ind. Eng. Chem. Res., 44,<br />
4959 (2005)] and Wild et al. [Int. J. Chemical Reactor Eng., 1, R7<br />
(2003)] give a long list of references pertaining to backmixing in<br />
bubble columns. An excellent review article by Shah et al. [AIChE J.,<br />
24, 369 (1978)] has summarized the literature prior to 1978. Works by<br />
Konig et al. [Ger. Chem. Eng., 1, 199 (1978)], Lucke et al. [Trans. Inst.<br />
Chem. Eng., 58, 228 (1980)], Riquarts [Ger. Chem. Eng., 4, 18<br />
(1981)], Mersmann (op. cit.), Deckwer (op. cit.), Yang et al. [Chem.<br />
Eng. Sci., 47(9–11), 2859 (1992)], and Garcia-Calvo and Leton<br />
[Chem. Eng. Sci., 49(21), 3643 (1994)] are particularly useful references.<br />
Axial dispersion occurs in both the liquid and the gas phases. The<br />
degree of axial dispersion is affected by vessel diameter, vessel internals,<br />
gas superficial velocity, and surface-active agents that retard coalescence.<br />
For systems with coalescence-retarding surfactants the<br />
initial bubble size produced by the gas sparger is also significant.<br />
The gas and liquid physical properties have only a slight effect on the<br />
degree of axial dispersion, except that liquid viscosity becomes important<br />
as the flow regime becomes laminar. With pure liquids, in the<br />
absence of coalescence-inhibiting, surface-active agents, the nature of<br />
the sparger has little effect on the axial dispersion, and experimental<br />
results are reasonably well correlated by the dispersion model. For the<br />
liquid phase the correlation recommended by Deckwer et al. (op.<br />
cit.), after the original work by Baird and Rice [Chem. Eng. J., 9,<br />
171(1975)] is as follows:<br />
= 0.35� � 1/3 gD<br />
�<br />
UG 2<br />
EL<br />
�<br />
(DUG)<br />
(14-222)<br />
Gases and liquids may be intentionally contacted as in absorption and<br />
distillation, or a mixture of phases may occur unintentionally as in<br />
vapor condensation from inadvertent cooling or liquid entrainment<br />
from a film. Regardless of the origin, it is usually desirable or necessary<br />
ultimately to separate gas-liquid dispersions. While separation<br />
will usually occur naturally, the rate is often economically intolerable<br />
and separation processes are employed to accelerate the step.<br />
GAS-PHASE CONTINUOUS SYSTEMS<br />
Practical separation techniques for liquid particles in gases are discussed.<br />
Since gas-borne particulates include both liquid and solid particles,<br />
many devices used for dry-dust collection (discussed in Sec. 17<br />
under “Gas-Solids Separation”) can be adapted to liquid-particle separation.<br />
Also, the basic subject of particle mechanics is covered in Sec.<br />
6. Separation of liquid particulates is frequently desirable in chemical<br />
processes such as in countercurrent-stage contacting because liquid<br />
entrainment with the gas partially reduces true countercurrency. Sep-<br />
PHASE SEPARATION<br />
PHASE SEPARATION 14-111<br />
where EL = liquid-phase axial dispersion coefficient, UG = superficial<br />
velocity of the gas phase, D = vessel diameter, and g = gravitational<br />
acceleration.<br />
The recommended correlation for the gas-phase axial-dispersion<br />
coefficient is given by Field and Davidson (loc. cit.):<br />
EG = 56.4 D1.33� � 3.56<br />
UG<br />
(14-223)<br />
where EG = gas-phase axial-dispersion coefficient, m2 �<br />
ε<br />
/s; D = vessel<br />
diameter, m; UG = superficial gas velocity, m/s; and ε =fractional gas<br />
holdup, volume fraction.<br />
The correlations given in the preceding paragraphs are applicable<br />
to vertical cylindrical vessels with pure liquids without coalescence<br />
inhibitors. For other vessel geometries such as columns of rectangular<br />
cross section, packed columns, and coiled tubes, the work of Shah<br />
et al. (loc. cit.) should be consulted. For systems containing coalescence-inhibiting<br />
surfactants, axial dispersion can be vastly different<br />
from that in systems in which coalescence is negligible. Konig et al.<br />
(loc. cit.) have well demonstrated the effects of surfactants and<br />
sparger type by conducting tests with weak alcohol solutions using<br />
three different porous spargers. With pure water, the sparger—and,<br />
consequently, initial bubble size—had little effect on back mixing<br />
because coalescence produced a dynamic-equilibrium bubble size not<br />
far above the sparger. With surfactants, the average bubble size was<br />
smaller than the dynamic-equilibrium bubble size. Small bubbles produced<br />
minimal back mixing up to ε ≈ 0.40; however, above ε ≈ 0.40<br />
backmixing increased very rapidly as UG increased The rapid increase<br />
in back mixing as ε exceeds 0.40 was postulated to occur indirectly<br />
because a bubble carries upward with it a volume of liquid equal to<br />
about 70 percent of the bubble volume, and, for ε≈0.40, the bubbles<br />
carry so much liquid upward that steady, uniform bubble rise can no<br />
longer be maintained and an oscillating, slugging flow develops, which<br />
produces fluctuating pressure at the gas distributor and the formation<br />
of large eddies. The large eddies greatly increase backmixing. For the<br />
air alcohol-water system, the minimum bubble size to prevent<br />
unsteady conditions was about 1, 1.5, and 2 mm for UG = 1, 3, and 5<br />
cm/s, respectively. Any smaller bubble size produced increased backmixing.<br />
The results of Konig et al. (loc. cit.) clearly indicate that the<br />
interaction of surfactants and sparger can be very complex; thus, one<br />
should proceed very cautiously in designing systems for which surfactants<br />
significantly retard coalescence. Caution is particularly important<br />
because surfactants can produce either much more or much less<br />
backmixing than surfactant-free systems, depending on the bubble<br />
size, which, in turn, depends on the sparger utilized.<br />
aration before entering another process step may be needed to prevent<br />
corrosion, to prevent yield loss, or to prevent equipment damage<br />
or malfunction. Separation before the atmospheric release of gases<br />
may be necessary to prevent environmental problems and for regulatory<br />
compliance.<br />
GENERAL REFERENCES<br />
G-1. Buonicore and Davis, eds., Air Pollution Engineering Manual, Van Nostrand<br />
Reinhold, New York, 1992.<br />
G-2. Calvert and Englund, eds., Handbook of Air Pollution Technology, Wiley,<br />
New York, 1984.<br />
G-3. Cheremisinoff, ed., Encyclopedia of Environmental Control Technology,<br />
vol. 2, Gulf Pub., Houston, 1989.<br />
G-4. McKetta, Unit Operations Handbook, vol. 1–2, Dekker, New York, 1992.<br />
G-5. Wark and Warner, Air Pollution: Its Origin and Control, 2d ed., Harper &<br />
Row, New York, 1981.<br />
G-6. Hesketh, Air Pollution Control, 1979; Fine Particles in Gaseous Media,<br />
Ann Arbor Science Pubs., Ann Arbor, MI, 1977.<br />
G-7. Stern, Air Pollution, 3d ed., vols. 3–5, Academic, Orlando, FL, 1976–77.
14-112 EQUIPMENT FOR DISTILLATION, GAS ABSORPTION, PHASE DISPERSION, AND PHASE SEPARATION<br />
G-8. Strauss, Industrial Gas Cleaning, 2d ed., Pergamon, New York, 1975.<br />
G-9. Theodore and Buonicore, Air Pollution Control Equipment; Selection,<br />
Design, Operation and Maintenance, Prentice Hall, Englewood Cliffs,<br />
NJ, 1982.<br />
G-10. Wang and Pereira, eds., Handbook of Environmental Engineering, vol. 1,<br />
Humana, Clifton, NJ 1979.<br />
G-11. Cheremisinoff and Young, Air Pollution Control and Design Handbook,<br />
parts 1–2, Dekker, New York, 1977.<br />
G-12. Nonhebel, Gas Purification Processes for Air Pollution Control, Newnes-<br />
Butterworth, London, 1972.<br />
Sampling<br />
R-1. Code of Federal Regulations, 40 (CFR 40), subchapter C—Air Programs,<br />
parts 50–99, Office of the Federal Register, Washington.<br />
R-2. Ref. G-11, part 1, pp. 65–121.<br />
R-3. Cooper and Rossano, Source Testing for Air Pollution Control, Environmental<br />
Science Services, Wilton, Connecticut, 1970.<br />
R-4. Ref. G-7, vol. 3, pp. 525–587.<br />
R-5. Methods of Air Sampling and Analysis, 2d Ed., American Public Health<br />
Assoc., Washington, 1977.<br />
R-6. Stockham and Fochtman, Particle Size Analysis, Ann Arbor Science<br />
Pubs., Ann Arbor, Michigan, 1977.<br />
R-7. Ref. G-2, Ch. 31, pp. 785–832.<br />
R-8. Ref. G-8, Ch. 2, pp. 39–79.<br />
Specific<br />
R-9. Calvert, Goldchmid, Leith, and Mehta, NTIS Publ. PB-213016, 213017,<br />
1972.<br />
R-10. Calvert, J. Air Pollut. Control Assoc. 24, 929 (1974).<br />
R-11. Calvert, Chem. Eng., 84(18), 54 (1977).<br />
R-12. Calvert, Yung, and Leung, NTIS Publ. PB-248050, 1975.<br />
R-13. Calvert and Lundgren, J. Air Pollut. Control Assoc., 18, 677 (1968).<br />
R-14. Calvert, Lundgren, and Mehta, J. Air Pollut. Control Assoc., 22, 529<br />
(1972).<br />
R-15. Yung, Barbarika, and Calvert, J. Air Pollut. Control Assoc., 27, 348,<br />
(1977).<br />
R-16. Katz, M.S. thesis, Pennsylvania <strong>State</strong> University, 1958.<br />
R-17. York and Poppele, Chem. Eng. Prog., 59(6), 45 (1963).<br />
R-18. York, Chem. Eng. Prog., 50, 421 (1954).<br />
R-19. Ref. G-2, Ch. 10, pp. 215–248.<br />
References with the notation (R- ) are cited in the text.<br />
Definitions: Mist and Spray Little standardization has been<br />
adopted in defining gas-borne liquid particles, and this frequently<br />
leads to confusion in the selection, design, and operation of collection<br />
equipment. Aerosol applies to suspended particulate, either solid or<br />
liquid, which is slow to settle by gravity and to particles from the submicrometer<br />
range up to 10 to 20 µm. Mists are fine suspended liquid<br />
dispersions usually resulting from condensation and ranging upward<br />
in particle size from around 0.1 µm. Spray refers to entrained liquid<br />
droplets. The droplets may be entrained from atomizing processes<br />
previously discussed under “Liquid-in-Gas Dispersions” in this section.<br />
In such instances, size will range from the finest particles produced<br />
up to a particle whose terminal settling velocity is equal to the<br />
entraining gas velocity if some settling volume is provided. Process<br />
spray is often created unintentionally, such as by the condensation of<br />
vapors on cold duct walls and its subsequent reentrainment, or from<br />
two-phase flow in pipes, gas bubbling through liquids, and entrainment<br />
from boiling liquids. Entrainment size distribution from sieve<br />
trays has been given by Cheng and Teller [Am. Inst. Chem. Eng. J.,<br />
7(2), 282 (1961)] and evaporator spray by Garner et al. [Trans. Inst.<br />
Chem. Eng., 32, 222 (1954)]. In general, spray can range downward in<br />
particle size from 5000 µm. There can be overlapping in size between<br />
the coarsest mist particles and the finest spray particles, but some<br />
authorities have found it convenient arbitrarily to set a boundary of 10<br />
µm between the two. Actually, considerable overlap exists in the<br />
region of 5 to 40 µm. Table 14-26 lists typical ranges of particle size<br />
created by different mechanisms. The sizes actually entrained can be<br />
influenced by the local gas velocity. Figure 14-105 compares the<br />
approximate size range of liquid particles with other particulate material<br />
and the approximate applicable size range of collection devices.<br />
Figure 17-34 gives an expanded chart by Lapple for solid particles.<br />
Mist and fog formation has been discussed previously.<br />
Gas Sampling The sampling of gases containing mists and sprays<br />
may be necessary to obtain data for collection-device design, in which<br />
case particle-size distribution, total mass loading, and gas volume,<br />
TABLE 14-26 Particle Sizes Produced by Various Mechanisms<br />
Mechanism or process Particle-size range, µm<br />
Liquid pressure spray nozzle 100–5000<br />
Gas-atomizing spray nozzle 1–100<br />
Gas bubbling through liquid or boiling liquid 20–1000<br />
Condensation processes with fogging 0.1–30<br />
Annular two-phase flow in pipe or duct 10–2000<br />
temperature, pressure, and composition may all be needed. Other<br />
reasons for sampling may be to determine equipment performance,<br />
measure yield loss, or determine compliance with regulations.<br />
Location of a sample probe in the process stream is critical especially<br />
when larger particles must be sampled. Mass loading in one portion<br />
of a duct may be severalfold greater than in another portion as<br />
affected by flow patterns. Therefore, the stream should be sampled at<br />
a number of points. The U.S. Environmental Protection Agency (R-1)<br />
has specified 8 points for ducts between 0.3 and 0.6 m (12 and 24 in)<br />
and 12 points for larger ducts, provided there are no flow disturbances<br />
for eight pipe diameters upstream and two downstream from the sampling<br />
point. When only particles smaller than 3 µm are to be sampled,<br />
location and number of sample points are less critical since such particles<br />
remain reasonably well dispersed by brownian motion. However,<br />
some gravity settling of such particles and even gases of high<br />
density have been observed in long horizontal breeching. Isokinetic<br />
sampling (velocity at the probe inlet is equal to local duct velocity) is<br />
required to get a representative sample of particles larger than 3 µm<br />
(error is small for 4- to 5-µm particles). Sampling methods and procedures<br />
for mass loading have been developed (R-1 through R-8).<br />
Particle Size Analysis Many particle-size-analysis methods suitable<br />
for dry-dust measurement are unsuitable for liquids because of<br />
coalescence and drainage after collection. Measurement of particle<br />
sizes in the flowing aerosol stream by using a cascade impactor is one<br />
FIG. 14-105 Particle classification and useful collection equipment versus<br />
particle size.
of the better means. The impacting principle has been described by<br />
Ranz and Wong [Ind. Eng. Chem., 44, 1371 (1952)] and Gillespie and<br />
Johnstone [Chem. Eng. Prog., 51, 75F (1955)]. The Andersen, Sierra,<br />
and University of Washington impactors may be used if the sampling<br />
period is kept short so as not to saturate the collection substrate. An<br />
impactor designed specifically for collecting liquids has been described<br />
by Brink, Kennedy, and Yu [Am. Inst. Chem. Eng. Symp. Ser.,<br />
70(137), 333 (1974)].<br />
Collection Mechanisms Mechanisms which may be used for<br />
separating liquid particles from gases are (1) gravity settling, (2) inertial<br />
(including centrifugal) impaction, (3) flow-line interception, (4)<br />
diffusional (brownian) deposition, (5) electrostatic attraction, (6) thermal<br />
precipitation, (7) flux forces (thermophoresis, diffusiophoresis,<br />
Stefan flow), and (8) particle agglomeration (nucleation) techniques.<br />
Equations and parameters for these mechanisms are given in Table<br />
17-2. Most collection devices rarely operate solely with a single mechanism,<br />
although one mechanism may so predominate that it may be<br />
referred to, for instance, as an inertial-impaction device.<br />
After collection, liquid particles coalesce and must be drained from<br />
the unit, preferably without reentrainment. Calvert (R-12) has studied<br />
the mechanism of reentrainment in a number of liquid-particle collectors.<br />
Four types of reentrainment were typically observed: (1) transition<br />
from separated flow of gas and liquid to a two-phase region of<br />
separated-entrained flow, (2) rupture of bubbles, (3) liquid creep on<br />
the separator surface, and (4) shattering of liquid droplets and splashing.<br />
Generally, reentrainment increased with increasing gas velocity.<br />
Unfortunately, in devices collecting primarily by centrifugal and<br />
inertial impaction, primary collection efficiency increases with gas<br />
velocity; thus overall efficiency may go through a maximum as reentrainment<br />
overtakes the incremental increase in efficiency. Prediction<br />
of collection efficiency must consider both primary collection and<br />
reentrainment.<br />
Procedures for Design and Selection of Collection Devices<br />
Calvert and coworkers (R-9 to R-12 and R-19) have suggested useful<br />
design and selection procedures for particulate-collection devices in<br />
which direct impingement and inertial impaction are the most significant<br />
mechanisms. The concept is based on the premise that the mass<br />
median aerodynamic particle diameter d p50 is a significant measure of<br />
the difficulty of collection of the liquid particles and that the collection<br />
device cut size dpc (defined as the aerodynamic particle diameter collected<br />
with 50 percent efficiency) is a significant measure of the capability<br />
of the collection device. The aerodynamic diameter for a particle<br />
is the diameter of a spherical particle (with an arbitrarily assigned density<br />
of 1 g/cm 3 ) which behaves in an air stream in the same fashion as<br />
the actual particle. For real spherical particles of diameter dp, the<br />
equivalent aerodynamic diameter dpa can be obtained from the equation<br />
dpa = dp(ρpC′) 1/2 , where ρp is the apparent particle density<br />
(mass/volume) and C′ is the Stokes-Cunningham correction factor for<br />
the particle size, all in consistent units. If particle diameters are<br />
expressed in micrometers, ρp can be in grams per cubic centimeter<br />
and C′ can be approximated by C′=1 + Ac(2λ/Dp), where Ac is a constant<br />
dependent upon gas composition, temperature, and pressure<br />
(Ac = 0.88 for atmospheric air at 20°C) and λ is the mean free path<br />
of the gas molecules (λ =0.10 µm for 20°C atmospheric air). For<br />
other temperatures or pressures, or gases other than air, calculations<br />
using these more precise equations may be made: Ac = 1.257 + 0.4 exp<br />
[−1.1 (dp/2λ)] and λ =µg/0.499ρg ×µm (where µg is the gas viscosity,<br />
kg/m⋅h; pg is gas density, g/cm 3 ; and µm is the mean molecular speed,<br />
m/s. um = [8RuT/πM] 0.5 , where Ru is the universal gas constant, 8.315<br />
kJ/kg⋅mol⋅K; T is the gas absolute temperature, K; and M is the molar<br />
mass or equivalent molecular weight of the gas. (π is the usual geometric<br />
constant.) For test purposes (air at 25°C and 1 atm), pg = 1.183<br />
kg/m, µg = 0.0666 kg/m⋅h, λ=0.067 µm, and um = 467 m/s. For airborne<br />
liquid particles, the assumption of spherical shape is reasonably<br />
accurate, and ρp is approximately unity for dilute aqueous particles at<br />
ambient temperatures. C′ is approximately unity at ambient conditions<br />
for such particles larger than 1 to 5 µm, so that often the actual<br />
liquid particle diameter and the equivalent aerodynamic diameter are<br />
identical.<br />
When a distribution of particle sizes which must be collected is<br />
present, the actual size distribution must be converted to a mass dis-<br />
PHASE SEPARATION 14-113<br />
tribution by aerodynamic size. Frequently the distribution can be represented<br />
or approximated by a log-normal distribution (a straight line<br />
on a log-log plot of cumulative mass percent of particles versus diameter)<br />
which can be characterized by the mass median particle diameter<br />
d p50 and the standard statistical deviation of particles from the<br />
median σ g. σ g can be obtained from the log-log plot by σ g = D pa50/D pe<br />
at 15.87 percent = D pe at 84.13 percent/D pa50.<br />
The grade efficiency η of most collectors can be expressed as a<br />
function of the aerodynamic particle size in the form of an exponential<br />
equation. It is simpler to write the equation in terms of the particle<br />
penetration P t (those particles not collected), where the fractional<br />
penetration P t = 1 −η, when η is the fractional efficiency. The typical<br />
collection equation is<br />
Pt = e (−AaDpaB) (14-224)<br />
where Aa and B are functions of the collection device. Calvert (R-12)<br />
has determined that for many devices in which the primary collection<br />
mechanism is direct interception and inertial impaction, such as<br />
packed beds, knitted-mesh collectors, zigzag baffles, target collectors<br />
such as tube banks, sieve-plate columns, and venturi scrubbers, the<br />
value of B is approximately 2.0. For cyclonic collectors, the value of B<br />
is approximately 0.67. The overall integrated penetration P�t for a<br />
device handling a distribution of particle sizes can be obtained by<br />
P�t =� W<br />
� � 0 Pt<br />
dW<br />
� (14-225)<br />
W<br />
where (dW/W) is the mass of particles in a given narrow size distribution<br />
and Pt is the average penetration for that size range. When the<br />
particles to be collected are log-normally distributed and the collection<br />
device efficiency can be expressed by Eq. (14-224), the required<br />
overall integrated collection efficiency P�t can be related to the ratio of<br />
the device aerodynamic cut size Dpc to the mass median aerodynamic<br />
particle size Dpa50. This required ratio for a given distribution and<br />
collection is designated RrL and these relationships are illustrated<br />
graphically in Fig. 14-106. For the many devices for which B is<br />
approximately 2.0, a simplified plot (Fig. 14-107) is obtained. From<br />
these figures, by knowing the desired overall collection efficiency and<br />
particle distribution, the value of RrL can be read. Substituting the<br />
mass median particle diameter gives the aerodynamic cut size<br />
FIG. 14-106 Overall integrated penetration as a function of particle-size distribution<br />
and collector parameters. (Calvert, Yung, and Leung, NTIS Publ. PB-<br />
248050, 1975.)
14-114 EQUIPMENT FOR DISTILLATION, GAS ABSORPTION, PHASE DISPERSION, AND PHASE SEPARATION<br />
FIG. 14-107 Overall integrated penetration as a function of particle-size distribution<br />
and collector cut diameter when B = 2 in Eq. (14-224). (Calvert, Goldshmid,<br />
Leith, and Mehta, NTIS Publ. PB-213016, 213017, 1972.)<br />
required from the collection device being considered. Therefore, an<br />
experimental plot of aerodynamic cut size for each collection device<br />
versus operating parameters can be used to determine the device suitability.<br />
Collection Equipment<br />
Gravity Settlers Gravity can act to remove larger droplets. Settling<br />
or disengaging space above aerated or boiling liquids in a tank or<br />
spray zone in a tower can be very useful. If gas velocity is kept low, all<br />
particles with terminal settling velocities (see Sec. 6) above the gas<br />
velocity will eventually settle. Increasing vessel cross section in the<br />
settling zone is helpful. Terminal velocities for particles smaller than<br />
50 µm are very low and generally not attractive for particle removal.<br />
Laminar flow of gas in long horizontal paths between trays or shelves<br />
on which the droplets settle is another effective means of employing<br />
gravity. Design equations are given in Sec. 17 under “Gas-Solids Separations.”<br />
Settler pressure drop is very low, usually being limited to<br />
entrance and exit losses.<br />
Centrifugal Separation Centrifugal force can be utilized to<br />
enhance particle collection to several hundredfold that of gravity. The<br />
design of cyclone separators for dust removal is treated in detail in<br />
Sec. 17 under “Gas-Solids Separations,” and typical cyclone designs<br />
are shown in Fig. 17-43. Dimension ratios for one family of cyclones<br />
are given in Fig. 17-36. Cyclones, if carefully designed, can be more<br />
efficient on liquids than on solids since liquids coalesce on capture<br />
and are easy to drain from the unit. However, some precautions not<br />
needed for solid cyclones are necessary to prevent reentrainment.<br />
Tests by Calvert (R-12) show high primary collection efficiency on<br />
droplets down to 10 µm and in accordance with the efficiency equations<br />
of Leith and Licht [Am. Inst. Chem. Eng. Symp. Ser., 68(126),<br />
196–206 (1972)] for the specific cyclone geometry tested if entrainment<br />
is avoided. Typical entrainment points are (1) creep along the<br />
gas outlet pipe, (2) entrainment by shearing of the liquid film from the<br />
walls, and (3) vortex pickup from accumulated liquid in the bottom<br />
(Fig. 14-108a). Reentrainment from creep of liquid along the top of<br />
the cyclone and down the outlet pipe can be prevented by providing<br />
the outlet pipe with a flared conical skirt (Fig. 14-108b), which provides<br />
a point from which the liquid can drip without being caught in<br />
the outlet gas. The skirt should be slightly shorter than the gas outlet<br />
pipe but extend below the bottom of the gas inlet. The cyclone inlet<br />
gas should not impinge on this skirt. Often the bottom edge of the<br />
skirt is V-notched or serrated.<br />
(a)<br />
FIG. 14-108 (a) Liquid entrainment from the bottom of a vessel by centrifugal<br />
flow. (Rietema and Verver, Cyclones in Industry, Elsevier, Amsterdam, 1961.)<br />
(b) Gas-outlet skirt for liquid cyclones. (Stern et al., Cyclone Dust Collectors,<br />
American Petroleum Institute, New York, 1955.)<br />
Reentrainment is generally reduced by lower inlet gas velocities.<br />
Calvert (R-12) reviewed the literature on predicting the onset of<br />
entrainment and found that of Chien and Ibele (ASME Pap. 62-<br />
WA170) to be the most reliable. Calvert applies their correlation to a<br />
liquid Reynolds number on the wall of the cyclone, NRe,L = 4QL/hivL,<br />
where QL is the volumetric liquid flow rate, cm 3 /s; hi is the cyclone<br />
inlet height, cm; and vL is the kinematic liquid viscosity, cm 2 /s. He<br />
finds that the onset of entrainment occurs at a cyclone inlet gas velocity<br />
Vci, m/s, in accordance with the relationship in Vci = 6.516 − 0.2865<br />
ln NRe,L.<br />
Reentrainment from the bottom of the cyclone can be prevented in<br />
several ways. If a typical long-cone dry cyclone is used and liquid is<br />
kept continually drained, vortex entrainment is unlikely. However, a<br />
vortex breaker baffle in the outlet is desirable, and perhaps a flat disk<br />
on top extending to within 2 to 5 cm (0.8 to 2 in) of the walls may be<br />
beneficial. Often liquid cyclones are built without cones and have<br />
dished bottoms. The modifications described earlier are definitely<br />
needed in such situations. Stern, Caplan, and Bush (Cyclone Dust<br />
Collectors, American Petroleum Institute, New York, 1955) and<br />
Rietema and Verver (in Tengbergen, Cyclones in Industry, Elsevier,<br />
Amsterdam, 1961, chap. 7) have discussed liquid-collecting cyclones.<br />
As with dust cyclones, no reliable pressure-drop equations exist (see<br />
Sec. 17), although many have been published. A part of the problem<br />
is that there is no standard cyclone geometry. Calvert (R-12) experimentally<br />
obtained ∆P = 0.000513 ρg(Qg/hiWi) 2 (2.8hiwi/d o 2 ), where ∆P<br />
is in cm of water; ρg is the gas density, g/cm 3 ; Qg is the gas volumetric<br />
flow rate, cm 3 /s; hi and wi are cyclone inlet height and width respectively,<br />
cm; and do is the gas outlet diameter, cm. This equation is in the<br />
same form as that proposed by Shepherd and Lapple [Ind. Eng.<br />
Chem., 31, 1246 (1940)] but gives only 37 percent as much pressure<br />
drop.<br />
Liquid cyclone efficiency can be improved somewhat by introducing<br />
a coarse spray of liquid in the cyclone inlet. Large droplets which<br />
are easily collected collide with finer particles as they sweep the gas<br />
stream in their travel to the wall. (See subsection “Wet Scrubbers”<br />
regarding optimum spray size.) Cyclones may also be operated wet to<br />
improve their operation on dry dust. Efficiency can be improved<br />
through reduction in entrainment losses since the dust particles<br />
become trapped in the water film. Collision between droplets and<br />
dust particles aids collection, and adequate irrigation can eliminate<br />
problems of wall buildup and fouling. The most effective operation is<br />
obtained by spraying countercurrently to the gas flow in the cyclone<br />
inlet duct at liquid rates of 0.7 to 2.0 L/m 3 of gas. There are also many<br />
proprietary designs of liquid separators using centrifugal force, some<br />
of which are illustrated in Fig. 14-109. Many of these were originally<br />
(b)
developed as steam separators to remove entrained condensate. In<br />
some designs, impingement on swirl baffles aids separation.<br />
Impingement Separation Impingement separation employs<br />
direct impact and inertial forces between particles, the gas streamlines,<br />
and target bodies to provide capture. The mechanism is discussed<br />
in Sec. 17 under “Gas-Solids Separations.” With liquids,<br />
droplet coalescence occurs on the target surface, and provision must<br />
be made for drainage without reentrainment. Calvert (R-12) has studied<br />
droplet collection by impingement on targets consisting of banks<br />
of tubes, zigzag baffles, and packed and mesh beds. Figure 14-110<br />
illustrates some other types of impingement-separator designs.<br />
In its simplest form, an impingement separator may be nothing<br />
more than a target placed in front of a flow channel such as a disk at<br />
the end of a tube. To improve collection efficiency, the gas velocity<br />
may be increased by forming the end into a nozzle (Fig. 14-110a). Particle<br />
collection as a function of size may be estimated by using the target-efficiency<br />
correlation in Fig. 17-39. Since target efficiency will be<br />
low for systems with separation numbers below 5 to 10 (small particles,<br />
low gas velocities), the mist will frequently be subjected to a<br />
number of targets in series as in Fig. 14-110c, d, and g.<br />
The overall droplet penetration is the product of penetration for<br />
each set of targets in series. Obviously, for a distribution of particle<br />
sizes, an integration procedure is required to give overall collection<br />
efficiency. This target-efficiency method is suitable for predicting efficiency<br />
when the design effectively prevents the bypassing or shortcircuiting<br />
of targets by the gas stream and provides adequate time to<br />
accelerate the liquid droplets to gas velocity. Katz (R-16) investigated<br />
a jet and target-plate entrainment separator design and found the<br />
pressure drop less than would be expected to supply the kinetic<br />
energy both for droplet acceleration and gas friction. An estimate<br />
based on his results indicates that the liquid particles on the average<br />
were being accelerated to only about 60 percent of the gas velocity.<br />
The largest droplets, which are the easiest to collect, will be accelerated<br />
less than the smaller particles. This factor has a leveling effect on<br />
collection efficiency as a function of particle size so that experimental<br />
results on such devices may not show as sharp a decrease in efficiency<br />
with particle size as predicted by calculation. Such results indicate<br />
that in many cases our lack of predicting ability results, not from<br />
imperfections in the theoretical treatment, but from our lack of<br />
knowledge of velocity distributions within the system.<br />
Katz (R-16) also studied wave-plate impingement separators (Fig.<br />
14-110b) made up of 90° formed arcs with an 11.1-mm (0.44-in)<br />
radius and a 3.8-mm (0.15-in) clearance between sheets. The pressure<br />
drop is a function of system geometry. The pressure drop for Katz’s<br />
system and collection efficiency for seven waves are shown in Fig.<br />
14-111. Katz used the Souders-Brown expression to define a design<br />
velocity for the gas between the waves:<br />
(a)<br />
U = K �ρ� l −� ρ� g)�/ρ� g� (14-226)<br />
(b) (c)<br />
FIG. 14-109 Typical separators using impingement in addition to centrifugal force. (a) Hi-eF<br />
purifier. (V. D. Anderson Co.) (b) Flick separator. (Wurster & Sanger, Inc.) (c) Type RA line separator.<br />
(Centrifix Corp., Bull. 220.)<br />
PHASE SEPARATION 14-115<br />
K is 0.12 to give U in ms −1 (0.4 for ft/s), and ρl and ρg are liquid and<br />
gas densities in any consistent set of units. Katz found no change in<br />
efficiency at gas velocities from one-half to 3 times that given by the<br />
equation.<br />
Calvert (R-12) investigated zigzag baffles of a design more like Fig.<br />
14-110e. The baffles may have spaces between the changes in direction<br />
or be connected as shown. He found close to 100 per collection<br />
for water droplets of 10 µm and larger. Some designs had high efficiencies<br />
down to 5 or 8 µm. Desirable gas velocities were 2 to 3.5 m/s<br />
(6.6 to 11.5 ft/s), with a pressure drop for a six-pass baffle of 2 to 2.5<br />
cm (0.8 to 1.0 in) of water. On the basis of turbulent mixing, an equation<br />
was developed for predicting primary collection efficiency as a<br />
function of particle size and collector geometry:<br />
η=1 − exp�− � (14-227)<br />
where η is the fractional primary collection efficiency; ute is the drop<br />
terminal centrifugal velocity in the normal direction, cm/s; Ug is the<br />
superficial gas velocity, cm/s; n is the number of rows of baffles or<br />
bends; θ is the angle of inclination of the baffle to the flow path, °;<br />
W is the width of the baffle, cm; and b is the spacing between baffles<br />
in the same row, cm. For conditions of low Reynolds number (NRe,D <<br />
0.1) where Stokes’ law applies, Calvert obtains the value for drop terminal<br />
centrifugal velocity of ute = d p 2 ρpa/18 µg, where dp and ρp are the<br />
drop particle diameter, cm, and particle density, g/cm3 utenWθ<br />
��<br />
57.3Ugb tan θ<br />
, respectively;<br />
µ g is the gas viscosity, P; and a is the acceleration due to centrifugal<br />
2 3 force. It is defined by the equation a = 2U g sin θ/W cos θ. For situations<br />
in which Stokes’ law does not apply, Calvert recommends substitution<br />
in the derivation of Eq. (14-227) for u of drag coefficients from<br />
drag-coefficient data of Foust et al. (Principles of Unit Operations,<br />
Toppan Co., Tokyo, 1959).<br />
Calvert found that reentrainment from the baffles was affected by<br />
the gas velocity, the liquid-to-gas ratio, and the orientation of the baffles.<br />
Horizontal gas flow past vertical baffles provided the best drainage<br />
and lowest reentrainment. Safe operating regions with vertical baffles<br />
are shown in Fig. 14-112. Horizontal baffles gave the poorest drainage<br />
and the highest reentrainment, with inclined baffles intermediate in<br />
performance. Equation (14-228), developed by Calvert, predicts pressure<br />
drop across zigzag baffles. The indicated summation must be<br />
made over the number of rows of baffles present.<br />
i = n<br />
∆P = �<br />
i = 1<br />
U′ gAp<br />
1.02 × 10⁻³ fDρg<br />
(14-228)<br />
∆P is the pressure drop, cm of water; ρg is the gas density, g/cm3 ; A p is<br />
the total projected area of an entire row of baffles in the direction of<br />
inlet gas flow, cm2 ; and At is the duct cross-sectional area, cm2 �<br />
2At<br />
. The
14-116 EQUIPMENT FOR DISTILLATION, GAS ABSORPTION, PHASE DISPERSION, AND PHASE SEPARATION<br />
(a)<br />
(b)<br />
(e)<br />
value fD is a drag coefficient for gas flow past inclined flat plates taken<br />
from Fig. 14-113, while U′g is the actual gas velocity, cm/s, which is<br />
related to the superficial gas velocity Ug by U′ g = Ug/cos θ. It must be<br />
noted that the angle of incidence θ for the second and successive rows<br />
of baffles is twice the angle of incidence for the first row. Most of<br />
(c) (d)<br />
(f)<br />
(h) (i) (j)<br />
FIG. 14-110 Typical impingement separators. (a) Jet impactor. (b) Wave plate. (c) Staggered channels. (Blaw-Knox Food & Chemical Equipment,<br />
Inc.) (d) Vane-type mist extractor. (Maloney-Crawford Tank and Mfg. Co.) (e) Peerless line separator. (Peerless Mfg. Co.) (f) Strong separator.<br />
(Strong Carlisle and Hammond.) (g) Karbate line separator. (Union Carbide Corporation) (h) Type E horizontal separator. (Wright-Austin<br />
Co.) (i) PL separator. (Ingersoll Rand.) (j) Wire-mesh demister. (Otto H. York Co.)<br />
Calvert’s work was with 30° baffles, but the method correlates well<br />
with other data on 45° baffles.<br />
The Karbate line separator (Fig. 14-110g) is composed of several<br />
layers of teardrop-shaped target rods of Karbate. A design flow constant<br />
K in Eq. (14-226) of 0.035 m/s (1.0 ft/s) is recommended by the<br />
(a) (b)<br />
FIG. 14-111 Pressure drop and collection efficiency of a wave-plate separator. (a) Pressure drop. (b) Efficiency<br />
D E = clearance between sheets. (Katz, M.S. thesis, Pennsylvania <strong>State</strong> University, 1958.)<br />
(g)
FIG. 14-112 Safe operating region to prevent reentrainment from vertical<br />
zigzag baffles with horizontal gas flow. (Calvert, Yung, and Leung, NTIS Publ.<br />
PB-248050, 1975.)<br />
manufacturer. Pressure drop is said to be 5a velocity heads on the<br />
basis of the superficial gas velocity. This value would probably<br />
increase at high liquid loads. Figure 14-114 gives the manufacturer’s<br />
reported grade efficiency curve at the design air velocity.<br />
The use of multiple tube banks as a droplet collector has also been<br />
studied by Calvert (R-12). He reports that collection efficiency for<br />
closely packed tubes follows equations for rectangular jet impaction<br />
which can be obtained graphically from Fig. 14-115 by using a dimensional<br />
parameter β which is based on the tube geometry; β =2l i/b,<br />
where b is the open distance between adjacent tubes in the row (orifice<br />
width) and l i is the impaction length (distance between orifice and<br />
impingement plane), or approximately the distance between centerlines<br />
of successive tube rows. Note that the impaction parameter K p is<br />
plotted to the one-half power in Fig. 14-115 and that the radius of the<br />
droplet is used rather than the diameter. Collection efficiency overall<br />
for a given size of particle is predicted for the entire tube bank by<br />
η=1 − (1 −η b) N (14-229)<br />
where η b is the collection efficiency for a given size of particle in one<br />
stage of a rectangular jet impactor (Fig. 14-115) and N is the number<br />
of stages in the tube bank (equal to one less than the number of rows).<br />
FIG. 14-113 Drag coefficient for flow past inclined flat plates for use in Eq.<br />
(14-228). [Calvert, Yung, and Leung, NTIS Publ. PB-248050; based on Fage and<br />
Johansen, Proc. R. Soc. (London), 116A, 170 (1927).]<br />
PHASE SEPARATION 14-117<br />
FIG. 14-114 Collection efficiency of Karbate line separator, based on particles<br />
with a specific gravity of 1.0 suspended in atmospheric air with a pressure<br />
drop of 2.5 cm water gauge. (Union Carbide Corporation Cat. Sec. S-6900,<br />
1960.)<br />
For widely spaced tubes, the target efficiency η g can be calculated<br />
from Fig. 17-39 or from the impaction data of Golovin and Putnam<br />
[Ind. Eng. Chem. Fundam., 1, 264 (1962)]. The efficiency of the overall<br />
tube banks for a specific particle size can then be calculated from<br />
the equation η =1 − (1 −η ta′/A) n , where a′ is the cross-sectional area<br />
of all tubes in one row, A is the total flow area, and n is the number of<br />
rows of tubes.<br />
Calvert reports pressure drop through tube banks to be largely<br />
unaffected by liquid loading and indicates that Grimison’s correlations<br />
in Sec. 6 (“Tube Banks”) for gas flow normal to tube banks or data for<br />
gas flow through heat-exchanger bundles can be used. However, the<br />
following equation is suggested:<br />
∆P = 8.48 × 10 −3 nρ gU′ g 2 (14-230)<br />
where ∆P is cm of water; n is the number of rows of tubes; ρg is the gas<br />
density, g/cm 3 ; and U′ g is the actual gas velocity between tubes in a row,<br />
cm/s. Calvert did find an increase in pressure drop of about 80 to 85<br />
percent above that predicted by Eq. (14-230) in vertical upflow of gas<br />
through tube banks due to liquid holdup at gas velocities above 4 m/s.<br />
FIG. 14-115 Experimental collection efficiencies of rectangular impactors.<br />
C′ is the Stokes-Cunningham correction factor; ρ p, particle density, g/cm 3 ; Ug,<br />
superficial gas velocity, approaching the impactor openings, cm/s; and µ g, gas<br />
viscosity, P. [Calvert, Yung, and Leung, NTIS Publ. PB-248050; based on Mercer<br />
and Chow, J. Coll. Interface Sci., 27, 75 (1968).]
14-118 EQUIPMENT FOR DISTILLATION, GAS ABSORPTION, PHASE DISPERSION, AND PHASE SEPARATION<br />
The onset of liquid reentrainment from tube banks can be predicted<br />
from Fig. 14-116. Reentrainment occurred at much lower velocities in<br />
vertical upflow than in horizontal gas flow through vertical tube banks.<br />
While the top of the cross-hatched line of Fig. 14-116a predicts reentrainment<br />
above gas velocities of 3 m/s (9.8 ft/s) at high liquid loading,<br />
most of the entrainment settled to the bottom of the duct in 1 to 2 m<br />
(3.3 to 6.6 ft), and entrainment did not carry significant distances until<br />
the gas velocity exceeded 7 m/s (23 ft/s).<br />
<strong>Packed</strong>-<strong>Bed</strong> Collectors Many different materials, including coal,<br />
coke, broken solids of various types such as brick, tile, rock, and stone,<br />
as well as normal types of tower-packing rings, saddles, and special<br />
plastic shapes, have been used over the years in packed beds to remove<br />
entrained liquids through impaction and filtration. Separators using<br />
natural materials are not available as standard commercial units but are<br />
designed for specific applications. Coke boxes were used extensively in<br />
the years 1920 to 1940 as sulfuric acid entrainment separators (see<br />
Chemical Engineers’ Handbook, 5th ed., p. 18–87) but have now been<br />
largely superseded by more sophisticated and efficient devices.<br />
Jackson and Calvert [Am. Inst. Chem. Eng. J., 12, 1075 (1966)]<br />
studied the collection of fine fuel-oil-mist particles in beds of a-in<br />
glass spheres, Raschig rings, and Berl and Intalox saddles. The mist<br />
had a mass median particle diameter of 6 µm and a standard deviation<br />
of 2.0. The collection efficiency as a function of particle size and gas<br />
velocity in a 355-mm- (14-in-) diameter by 152-mm- (6-in-) thick bed<br />
of Intalox saddles is given in Fig. 14-117. This and additional work<br />
have been generalized by Calvert (R-12) to predict collection efficiencies<br />
of liquid particles in any packed bed. Assumptions in the theoretical<br />
development are that the drag force on the drop is given by<br />
Stokes’ law and that the number of semicircular bends to which the<br />
gas is subjected, η1, is related to the length of the bed, Z (cm), in the<br />
direction of gas flow, the packing diameter, d c (cm), and the gas-flow<br />
channel width, b (cm), such that η 1 = Z/(d c + b). The gas velocity<br />
through the channels, U gb (cm/s), is inversely proportional to the bed<br />
(a) (b)<br />
FIG. 14-116 Experimental results showing effect of gas velocity and liquid load on entrainment from (a) vertical<br />
tube banks with horizontal gas flow and (b) horizontal tube banks with upflow. To convert meters per second to feet<br />
per second, multiply by 3.281. (Calvert, Yung, and Leung, NTIS Publ. PB-248050.)<br />
free volume for gas flow such that Ugb = Ug[1/(ε−hb)], where Ug is the<br />
gas superficial velocity, cm/s, approaching the bed, ε is the bed void<br />
fraction, and hb is the fraction of the total bed volume taken up with<br />
liquid which can be obtained from data on liquid holdup in packed<br />
beds. The width of the semicircular channels b can be expressed as a<br />
fraction j of the diameter of the packing elements, such that b = jdc.<br />
These assumptions (as modified by G. E. Goltz, personal communica-<br />
FIG. 14-117 Experimental collection efficiency. 1 ⁄2-in Intalox saddles. To convert<br />
feet per second to meters per second, multiply by 0.3048; to convert centimeters<br />
to inches, multiply by 0.394; and to convert grams per cubic centimeter<br />
to pounds per cubic foot, multiply by 62.43. [Jackson and Calvert, Am. Inst.<br />
Chem. Eng. J., 12, 1975 (1968).]
TABLE 14-27 Experimental Values for j, Channel Width<br />
in Packing as a Fraction of Packing Diameter<br />
Packing size<br />
cm in Type of packing j<br />
1.27 0.5 Berl and Intalox saddles, marbles, Raschig rings 0.192<br />
2.54 1.0 Berl and Intalox saddles, pall rings 0.190<br />
3.8 1.5 Berl and Intalox saddles, pall rings 0.165<br />
7.6–12.7 3–5 Coke 0.03<br />
tion) lead to an equation for predicting the penetration of a given size<br />
of liquid particle through a packed bed:<br />
where<br />
P t = exp� � � K p� (14-231)<br />
ρpdp 2 Ug<br />
−π<br />
��<br />
2( j + j2 )(ε −hb)<br />
Kp = � (14-232)<br />
9µgdc Values of ρ p and d p are droplet density, g/cm 3 , and droplet diameter,<br />
cm; µ g is the gas viscosity, P. All other terms were defined previously.<br />
Table 14-27 gives values of j calculated from experimental data of<br />
Jackson and Calvert. Values of j for most manufactured packing<br />
appear to fall in the range from 0.16 to 0.19. The low value of 0.03 for<br />
coke may be due to the porosity of the coke itself.<br />
Calvert (R-12) has tested the correlation in cross-flow packed beds,<br />
which tend to give better drainage than countercurrent beds, and has<br />
found the effect of gas-flow orientation insignificant. However, the<br />
onset of reentrainment was somewhat lower in a bed of 2.5-cm<br />
(1.0-in) pall rings with gas upflow [6 m/s (20 ft/s)] than with horizontal<br />
cross-flow of gas. The onset of reentrainment was independent of liquid<br />
loading (all beds were nonirrigated), and entrainment occurred at<br />
values somewhat above the flood point for packed beds as predicted<br />
by conventional correlations. In beds with more than 3 cm (1.2 in) of<br />
water pressure drop, the experimental drop with both vertical and<br />
horizontal gas flow was somewhat less than predicted by generalized<br />
packed-bed pressure-drop correlations. However, Calvert recommends<br />
these correlations for design as conservative.<br />
Calvert’s data indicate that packed beds irrigated only with the collected<br />
liquid can have collection efficiencies of 80 to 90 percent on<br />
mist particles down to 3 µm but have low efficiency on finer mist particles.<br />
Frequently, irrigated packed towers and towers with internals<br />
will be used with liquid having a wetting capability for the fine mist<br />
which must be collected. Tennessee Valley Authority (TVA) experiments<br />
with the collection of 1.0-µm mass median phosphoric acid<br />
mist in packed towers have shown that the strength of the circulating<br />
phosphoric acid is highly important [see Baskerville, Am. Inst. Chem.<br />
Eng. J., 37, 79 (1941); and p. 18–87, 5th ed. of the Handbook]. Hesketh<br />
(J. Air Pollut. Control Assoc., 24, 942 (1974)] has reported up to<br />
50 percent improvement in collection efficiency in venturi scrubbers<br />
on fine particles with the addition of only 0.10 percent of a lowfoaming<br />
nonionic surfactant to the scrubbing liquid, and others have<br />
experienced similar results in other gas-liquid-contacting devices.<br />
Calvert (R-9 and R-10) has reported on the efficiency of various gasliquid-contacting<br />
devices for fine particles. Figure 14-118 gives the<br />
particle aerodynamic cut size for a single-sieve-plate gas scrubber as a<br />
function of sieve hole size d h, cm; hole gas velocity uh, m/s; and froth<br />
or foam density on the plate F, g/cm 3 . This curve is based on standard<br />
air and water properties and wettable (hydrophilic) particles. The cut<br />
diameter decreases with an increase in froth density, which must be<br />
predicted from correlations for sieve-plate behavior (see Fig. 14-32).<br />
Equation (14-231) can be used to calculate generalized design curves<br />
for collection in packed columns in the same fashion by finding parameters<br />
of packing size, bed length, and gas velocity which give collection<br />
efficiencies of 50 percent for various size particles. Figure 14-119<br />
illustrates such a plot for three gas velocities and two sizes of packing.<br />
Z<br />
� dc<br />
PHASE SEPARATION 14-119<br />
FIG. 14-118 Aerodynamic cut diameter for a single-sieve-plate scrubber as a<br />
function of hole size, hole-gas velocity, and froth density, F, g/cm 3 . To convert<br />
meters per second to feet per second, multiply by 3.281; to convert grams per<br />
cubic centimeter to pounds per cubic foot, multiply by 62.43. [Calvert, J. Air<br />
Pollut. Control Assoc., 24, 929 (1974).]<br />
Wire-Mesh Mist Collectors Knitted mesh of varying density and<br />
voidage is widely used for entrainment separators. Its advantage is<br />
close to 100 percent removal of drops larger than 5 µm at superficial<br />
gas velocities from about 0.2 ms/s (0.6 ft/s) to 5 m/s (16.4 ft/s), depending<br />
somewhat on the design of the mesh. Pressure drop is usually no<br />
more than 2.5 cm (1 in) of water. A major disadvantage is the ease with<br />
which tars and insoluble solids plug the mesh. The separator can be<br />
made to fit vessels of any shape and can be made of any material which<br />
can be drawn into a wire. Stainless-steel and plastic fibers are most<br />
common, but other metals are sometimes used. Generally three basic<br />
types of mesh are used: (1) layers with a crimp in the same direction<br />
(each layer is actually a nested double layer); (2) layers with a crimp in<br />
FIG. 14-119 Aerodynamic cut diameter for a typical packed-bed entrainment<br />
separator as a function of packing size, bed depth, and three gas velocities: curve<br />
1–1.5 m/s, curve 2–3.0 m/s, and curve 3–4.5 m/s. To convert meters to feet, multiply<br />
by 3.281; to convert centimeters to inches, multiply by 0.394. [Calvert, J.<br />
Air Pollut. Control Assoc., 24, 929 (1974).]
14-120 EQUIPMENT FOR DISTILLATION, GAS ABSORPTION, PHASE DISPERSION, AND PHASE SEPARATION<br />
alternate directions, which increases voidage, reduces sheltering and<br />
increases target efficiency per layer, and gives a lower pressure drop<br />
per unit length; and (3) spiral-wound layers which reduce pressure<br />
drop by one-third, but fluid creep may lead to higher entrainment.<br />
Some small manufacturers of plastic meshes may offer other weaves<br />
claimed to be superior. The filament size can vary from about 0.15<br />
mm (0.006 in) for fine-wire pads to 3.8 mm (0.15 in) for some plastic<br />
fibers. Typical pad thickness varies from 100 to 150 mm (4 to 6 in), but<br />
occasionally pads up to 300 mm (12 in) thick are used. A typical wire<br />
diameter for standard stainless mesh is 0.28 mm (0.011 in), with a finished<br />
mesh density of 0.15 g/cm3 (9.4 lb/ft3 ). A lower mesh density<br />
may be produced with standard wire to give 10 to 20 percent higher<br />
flow rates.<br />
Figure 14-120 presents an early calculated estimate of mesh efficiency<br />
as a fraction of mist-particle size. Experiments by Calvert<br />
(R-12) confirm the accuracy of the equation of Bradie and Dickson<br />
( Joint Symp. Proc. Inst. Mech. Eng./Yorkshire Br. Inst. Chem. Eng.,<br />
1969, pp. 24–25) for primary efficiency in mesh separators:<br />
η=1 − exp(−2/3)πalηi) (14-232)<br />
where η is the overall collection efficiency for a given-size particle; l is<br />
the thickness of the mesh, cm, in the direction of gas flow; a is the surface<br />
area of the wires per unit volume of mesh pad, cm2 /cm3 ; and η i,<br />
the target collection efficiency for cylindrical wire, can be calculated<br />
from Fig. 17-39 or the impaction data of Golovin and Putnam [Ind.<br />
Eng. Chem., 1, 264 (1962)]. The factor 2/3, introduced by Carpenter<br />
and Othmer [Am. Inst. Chem. Eng. J., 1, 549 (1955)], corrects for the<br />
fact that not all the wires are perpendicular to the gas flow and gives<br />
the projected perpendicular area. If the specific mesh surface area a is<br />
not available, it can be calculated from the mesh void area ε and the<br />
mesh wire diameter dw in cm, a = 4(1 −ε)/dw.<br />
York and Poppele (R-17) have stated that factors governing maximum<br />
allowable gas velocity through the mesh are (1) gas and liquid<br />
density, (2) liquid surface tension, (3) liquid viscosity, (4) specific wire<br />
surface area, (5) entering-liquid loading, and (6) suspended-solids<br />
content. York (R-18) has proposed application of the Souders-Brown<br />
equation [Eq. (14-226)] for correlation of maximum allowable gas<br />
velocity with values of K for most cases of 0.1067 m/s to give U in m/s<br />
(0.35 for ft/s). When liquid viscosity or inlet loading is high or the liquid<br />
is dirty, the value of K must be reduced. Schroeder (M.S. thesis,<br />
Newark College of Engineering, 1962) found lower values for K necessary<br />
when liquid surface tension is reduced such as by the presence<br />
of surfactants in water. Ludwig (Applied Process Design for Chemical<br />
and Petrochemical Plants, 2d ed., vol. I, Gulf, Houston, 1977, p. 157)<br />
recommends reduced K values of (0.061 m/s) under vacuum at an<br />
absolute pressure of 6.77 kPa (0.98 lbf/in2 ) and K = 0.082 m/s at 54 kPa<br />
(7.83 lbf/in2 ) absolute. Most manufacturers suggest setting the design<br />
velocity at three-fourths of the maximum velocity to allow for surges in<br />
gas flow.<br />
York and Poppele (R-17) have suggested that total pressure drop<br />
through the mesh is equal to the sum of the mesh dry pressure drop<br />
FIG. 14-120 Collection efficiency of wire-mesh separator; 6-in thickness, 98.6<br />
percent free space, 0.006-in-diameter wire used for experiment points. Curves<br />
calculated for target area equal to 2 and 3 times the solids volume of packing. To<br />
convert inches to millimeters, multiply by 25.4.<br />
plus an increment due to the presence of liquid. They considered the<br />
mesh to be equivalent to numerous small circular channels and used<br />
the D’Arcy formula with a modified Reynolds number to correlate<br />
friction factor (see Fig. 14-121) for Eq. (14-233) giving dry pressure<br />
drop.<br />
∆Pdry = flaρgUg 2 /981 ε 3 (14-233)<br />
where ∆P is in cm of water; f is from Fig. (14-121); ρg is the gas density,<br />
g/cm 3 ; U g is the superficial gas velocity, cm/s; and ε is the mesh<br />
porosity or void fraction; l and a are as defined in Eq. (14-232). Figure<br />
14-121 gives data of York and Poppele for mesh crimped in the same<br />
and alternating directions and also includes the data of Satsangee, of<br />
Schuring, and of Bradie and Dickson.<br />
The incremental pressure drop for wet mesh is not available for all<br />
operating conditions or for mesh of different styles. The data of York<br />
and Poppele for wet-mesh incremental pressure drop, ∆P L in cm of<br />
water, are shown in Fig. 14-122 or parameters of liquid velocity L/A,<br />
defined as liquid volumetric flow rate, cm 3 /min per unit of mesh crosssectional<br />
area in cm 2 ; liquid density ρL is in g/cm 3 .<br />
York generally recommends the installation of the mesh horizontally<br />
with upflow of gas as in Fig. 14-110f; Calvert (R-12) tested the<br />
mesh horizontally with upflow and vertically with horizontal gas flow.<br />
He reports better drainage with the mesh vertical and somewhat<br />
higher permissible gas velocities without reentrainment, which is contrary<br />
to past practice. With horizontal flow through vertical mesh, he<br />
found collection efficiency to follow the predictions of Eq. (14-232)<br />
up to 4 m/s (13 ft/s) with air and water. Some reentrainment was<br />
encountered at higher velocities, but it did not appear serious until<br />
velocities exceeded 6.0 m/s (20 ft/s). With vertical upflow of gas,<br />
entrainment was encountered at velocities above and below 4.0 m/s<br />
(13 ft/s), depending on inlet liquid quantity (see Fig. 14-123). Figure<br />
14-124 illustrates the onset of entrainment from mesh as a function of<br />
liquid loading and gas velocity and the safe operating area recommended<br />
by Calvert. Measurements of dry pressure drop by Calvert<br />
gave values only about one-third of those predicted from Eq. (14-<br />
233). He found the pressure drop to be highly affected by liquid load.<br />
The pressure drop of wet mesh could be correlated as a function of<br />
Ug 1.65 and parameters of liquid loading L/A, as shown in Fig. 14-125.<br />
As indicated previously, mesh efficiency drops rapidly as particles<br />
decrease in size below 5 µm. An alternative is to use two mesh pads in<br />
series. The first mesh is made of fine wires and is operated beyond the<br />
FIG. 14-121 Value of friction factor f for dry knitted mesh for Eq. (14-233).<br />
Values of York and Poppele [Chem. Eng. Prog., 50, 421 (1954)] are given in<br />
curve 1 for mesh crimped in the alternating direction and curve 2 for mesh<br />
crimped in the same direction. Data of Bradie and Dickson (Joint Symp. Proc.<br />
Inst. Mech. Eng./Yorkshire Br. Inst. Chem. Eng., 1969, pp. 24–25) are given in<br />
curve 3 for layered mesh and curve 4 for spiral-wound mesh. Curve 5 is data of<br />
Satsangee (M.S. thesis, Brooklyn Polytechnic Institute, 1948) and Schurig<br />
(D.Ch.E. dissertation, Brooklyn Polytechnic Institute, 1946). (From Calvert,<br />
Yung, and Leung, NTIS Publ. PB-248050, 1975.)
flood point. It results in droplet coalescence, and the second mesh,<br />
using standard wire and operated below <strong>flooding</strong>, catches entrainment<br />
from the first mesh. Coalescence and <strong>flooding</strong> in the first mesh<br />
may be assisted with water sprays or irrigation. Massey [Chem. Eng.<br />
Prog., 53(5), 114 (1959)] and Coykendall et al. [ J. Air Pollut. Control<br />
Assoc., 18, 315 (1968)] have discussed such applications. Calvert<br />
(R-12) presents data on the particle size of entrained drops from mesh<br />
as a function of gas velocity which can be used for sizing the secondary<br />
collector. A major disadvantage of this approach is high pressure drop,<br />
which can be in the range from 25 cm (10 in) of water to as high as<br />
85 cm (33 in) of water if the mist is mainly submicrometer.<br />
Wet Scrubbers Scrubbers have not been widely used for the collection<br />
of purely liquid particulate, probably because they are generally<br />
more complex and expensive than impaction devices of the types<br />
previously discussed. Further, scrubbers are no more efficient than<br />
(a) (b)<br />
FIG. 14-122 Incremental pressure drop in knitted mesh due to the presence of liquid (a) with the mesh crimps<br />
in the same direction and (b) with crimps in the alternating direction, based on the data of York and Poppele<br />
[Chem. Eng. Prog., 50, 421 (1954)]. To convert centimeters per minute to feet per minute, multiply by 0.0328;<br />
to convert centimeters per second to feet per second, multiply by 0.0328. (From Calvert, Yung, and Leung, NTIS<br />
Publ. PB-248050, 1975.)<br />
FIG. 14-123 Experimental data of Calvert with air and water in mesh with<br />
vertical upflow, showing the effect of liquid loading on efficiency and reentrainment.<br />
To convert meters per second to feet per second, multiply by 3.281; to<br />
convert cubic centimeters per square centimeter-minute to cubic feet per<br />
square foot-minute, multiply by 0.0328. (Calvert, Yung, and Leung, NTIS Publ.<br />
PB-248050, 1975.)<br />
PHASE SEPARATION 14-121<br />
the former devices for the same energy consumption. However,<br />
scrubbers of the types discussed in Sec. 17 and illustrated in Figs.<br />
17-48 to 17-54 can be used to capture liquid particles efficiently. Their<br />
use is primarily indicated when it is desired to accomplish simultaneously<br />
another task such as gas absorption or the collection of solid and<br />
liquid particulate mixtures.<br />
FIG. 14-124 Effect of gas and liquid rates on onset of mesh reentrainment<br />
and safe operating regions. To convert meters per second to feet per second,<br />
multiply by 3.281. (Calvert, Yung, and Leung, NTIS Publ. PB-248050, 1975.)
14-122 EQUIPMENT FOR DISTILLATION, GAS ABSORPTION, PHASE DISPERSION, AND PHASE SEPARATION<br />
(a) (b)<br />
FIG. 14-125 Experimental pressure measured by Calvert as a function of gas<br />
velocity and liquid loading for (a) horizontal gas flow through vertical mesh and<br />
(b) gas upflow through horizontal mesh. Mesh thickness was 10 cm with 2.8-mm<br />
wire and void fraction of 98.2 percent, crimped in alternating directions. To convert<br />
meters per second to feet per second, multiply by 3.281; to convert centimeters<br />
to inches, multiply by 0.394. (Calvert, Yung, and Leung, NTIS Publ.<br />
PB-248050, 1975.)<br />
Table 20-41 [Chemical Engineers’ Handbook, 5th ed.)], showing<br />
the minimum size of particles collectible in different types of scrubbers<br />
at reasonably high efficiencies, is a good selection guide.<br />
Cyclonic spray towers can effectively remove liquid particles down<br />
to around 2 to 3 µm. Figures 20-112 and 20-113 (Chemical Engineers’<br />
Handbook, 5th ed.), giving target efficiency between spray<br />
drop size and particle size as calculated by Stairmand or Johnstone<br />
and Roberts, should be considered in selecting spray atomization for<br />
the most efficient tower operation. Figure 14-126 gives calculated<br />
particle cut size as a function of tower height (or length) for vertical<br />
countercurrent spray towers and for horizontal-gas-flow, verticalliquid-flow<br />
cross-current spray towers with parameters for liquid<br />
drop size. These curves are based on physical properties of standard<br />
air and water and should be used under conditions in which these are<br />
reasonable approximations. Lack of uniform liquid distribution or<br />
liquid flowing down the walls can affect the performance, requiring<br />
empirical correction factors. Calvert (R-10) suggests that a correction<br />
factor of 0.2 be used in small-diameter scrubbers to account for the<br />
liquid on the walls, i.e., let Q L/Q g = 0.2 (Q L/Q g) actual. Many more complicated<br />
wet scrubbers employ a combination of sprays or liquid<br />
atomization, cyclonic action, baffles, and targets. These combinations<br />
are not likely to be more efficient than similar devices previously discussed<br />
that operate at equivalent pressure drop. The vast majority of<br />
wet scrubbers operate at moderate pressure drop [8 to 15 cm (3 to 6<br />
in) of water or 18 to 30 cm (7 to 12 in) of water] and cannot be<br />
expected to have high efficiency on particles smaller than 10 µm or 3<br />
to 5 µm respectively. Fine and submicrometer particles can be captured<br />
efficiently only in wet scrubbers having high energy input<br />
such as venturi scrubbers, two-phase eductor scrubbers, and fluxforce-condensation<br />
scrubbers.<br />
Venturi Scrubbers One type of venturi scrubber is illustrated in<br />
Fig. 17-48. Venturi scrubbers have been used extensively for collecting<br />
fine and submicrometer solid particulate, condensing tars and<br />
mists, and mixtures of liquids and solids. To a lesser extent, they have<br />
also been used for simultaneous gas absorption, although Lundy [Ind.<br />
Eng. Chem., 50, 293 (1958)] indicates that they are generally limited<br />
to three transfer units. They have been used to collect submicrometer<br />
chemical incinerator fume and mist as well as sulfuric and phosphoric<br />
acid mists. The collection efficiency of a venturi scrubber is highly<br />
dependent on the throat velocity or pressure drop, the liquid-to-gas<br />
ratio, and the chemical nature of wettability of the particulate. Throat<br />
velocities may range from 60 to 150 m/s (200 to 500 ft/s). Liquid injection<br />
rates are typically 0.67 to 1.4 m 3 /1000 m 3 of gas. A liquid rate of<br />
1.0 m 3 per 1000 m 3 of gas is usually close to optimum, but liquid rates<br />
as high as 2.7 m 3 (95 ft 3 ) have been used. Efficiency improves with<br />
increased liquid rate but only at the expense of higher pressure drop<br />
and energy consumption. Pressure-drop predictions for a given efficiency<br />
are hazardous without determining the nature of the particulate<br />
and the liquid-to-gas ratio. In general, particles coarser than 1 µm<br />
can be collected efficiently with pressure drops of 25 to 50 cm of<br />
water. For appreciable collection of submicrometer particles, pressure<br />
drops of 75 to 100 cm (30 to 40 in) of water are usually required.<br />
When particles are appreciably finer than 0.5 µm, pressure drops of<br />
175 to 250 cm (70 to 100 in) of water have been used.<br />
(a) (b)<br />
FIG. 14-126 Predicted spray-tower cut diameter as a function of sprayed length and spray droplet size for (a) vertical-countercurrent<br />
towers and (b) horizontal-cross-flow towers per Calvert [J. Air Pollut. Control Assoc., 24, 929 (1974)]. Curve 1 is for<br />
200-µm spray droplets, curve 2 for 500-µm spray, and curve 3 for 1000-µm spray. Q L/QC is the volumetric liquid-to-gas ratio,<br />
L liquid/m 3 gas, and uG is the superficial gas velocity in the tower. To convert liters per cubic meter to cubic feet per cubic foot,<br />
multiply by 10 −3 .
FIG. 14-127 Prediction of venturi-scrubber cut diameter for hydrophobic<br />
particles as functions of operating parameters as measured by Calvert [Calvert,<br />
Goldshmid, Leith, and Mehta, NTIS Publ. PB-213016, 213017, 1972; and<br />
Calvert, J. Air Pollut. Control Assoc., 24, 929 (1974).] u G is the superficial throat<br />
velocity, and ∆P is the pressure drop from converging to diverging section. To<br />
convert meters per second to feet per second, multiply by 3.281; to convert liters<br />
per cubic meter to cubic feet per cubic foot, multiply by 10 −3 ; and to convert<br />
centimeters to inches, multiply by 0.394.<br />
One of the problems in predicting efficiency and required pressure<br />
drop of a venturi is the chemical nature or wettability of the particulate,<br />
which on 0.5-µm-size particles can make up to a threefold difference<br />
in required pressure drop for its efficient collection. Calvert<br />
(R-9, R-10) has represented this effect by an empirical factor f, which<br />
is based on the hydrophobic ( f = 0.25) or hydrophilic ( f = 0.50) nature<br />
of the particles. Figure 14-127 gives the cut diameter of a venturi<br />
scrubber as a function of its operating parameters (throat velocity,<br />
pressure drop, and liquid-to-gas ratio) for hydrophobic particles. Figure<br />
14-129 compares cut diameter as a function of pressure drop<br />
for an otherwise identically operating venturi on hydrophobic and<br />
hydrophilic particles. Calvert (R-9) gives equations which can be used<br />
for constructing cut-size curves similar to those of Fig. 14-127 for<br />
other values of the empirical factor f. Most real particles are neither<br />
completely hydrophobic nor completely hydrophilic but have f values<br />
lying between the two extremes. Phosphoric acid mist, on the basis of<br />
data of Brink and Contant [Ind. Eng. Chem., 50, 1157 (1958)] appears<br />
to have a value of f = 0.46. Unfortunately, no chemical-test methods<br />
have yet been devised for determining appropriate f values for a particulate<br />
in the laboratory.<br />
Pressure drop in a venturi scrubber is controlled by throat velocity.<br />
While some venturis have fixed throats, many are designed with variable<br />
louvers to change throat dimensions and control performance for<br />
changes in gas flow. Pressure-drop equations have been developed by<br />
Calvert (R-13, R-14, R-15), Boll [Ind. Eng. Chem. Fundam., 12, 40<br />
(1973)], and Hesketh [J. Air Pollut. Control Assoc., 24, 939 (1974)].<br />
Hollands and Goel [Ind. Eng. Chem. Fundam., 14, 16 (1975)] have<br />
developed a generalized pressure-drop equation.<br />
The Hesketh equation is empirical and is based upon a regression<br />
analysis of data from a number of industrial venturi scrubbers:<br />
2 0.155 0.78 ∆P = Ugt ρg A t L /1270 (14-234)<br />
where ∆P is the pressure drop, in of water; U gt is the gas velocity in the<br />
throat, ft/s; ρ g is the gas density, lb/ft 3 ; A t is the throat area, ft 2 ; and L is<br />
the liquid-to-gas ratio, gal/1000 acf.<br />
Calvert (R-15) critiqued the many pressure-drop equations and suggested<br />
the following simplified equation as accurate to �10 percent:<br />
where<br />
2 2ρ�Ug �<br />
981gc<br />
Qt �<br />
Qg<br />
PHASE SEPARATION 14-123<br />
∆P = � � [1 − x2 + �(x� 4 �−� x� 2 )� 0.5<br />
�] (14-235)<br />
x = (3ltCDiρg /16dlρl) + 1 (14-236)<br />
∆P is the pressure drop, cm of water; ρ � and ρ g are the density of the<br />
scrubbing liquid and gas respectively, g/cm 3 ; Ug is the velocity of the<br />
gas at the throat inlet, cm/s; Q t/Q g is the volumetric ratio of liquid to<br />
gas at the throat inlet, dimensionless; l t is the length of the throat, cm;<br />
C Di is the drag coefficient, dimensionless, for the mean liquid diameter,<br />
evaluated at the throat inlet; and d l is the Sauter mean diameter,<br />
cm, for the atomized liquid. The atomized-liquid mean diameter must<br />
be evaluated by the Nukiyama and Tanasawa [Trans. Soc. Mech Eng.<br />
( Japan), 4, 5, 6 (1937–1940)] equation:<br />
d� = � � 0.5<br />
+ 0.0597� � 0.45<br />
µ�<br />
�<br />
(σ�ρ�) 0.5<br />
0.0585 σ�<br />
� � 1.5 Q� � � � (14-237)<br />
Ug<br />
ρ�<br />
Qg<br />
where σ� is the liquid surface tension, dyn/cm; and µ � is the liquid viscosity;<br />
P. The drag coefficient CDi should be evaluated by the Dickin-<br />
son and Marshall [Am. Inst. Chem. Eng. J., 14, 541 (1968)] correlation<br />
0.6<br />
CDi = 0.22 + (24/NRei)(1 + 0.15 N Rei).<br />
The Reynolds number, NRei, is<br />
evaluated at the throat inlet considerations as d�Gg/µg.<br />
All venturi scrubbers must be followed by an entrainment collector<br />
for the liquid spray. These collectors are usually centrifugal and will<br />
have an additional pressure drop of several centimeters of water,<br />
which must be added to that of the venturi itself.<br />
Other Scrubbers A liquid-ejector venturi (Fig. 17-49), in<br />
which high-pressure water from a jet induces the flow of gas, has<br />
been used to collect mist particles in the 1- to 2-µm range, but submicrometer<br />
particles will generally pass through an eductor. Power<br />
costs for liquid pumping are high if appreciable motive force must<br />
be imparted to the gas because jet-pump efficiency is usually less<br />
than 10 percent. Harris [Chem. Eng. Prog., 42(4), 55 (1966)] has<br />
described their application. Two-phase eductors have been considerably<br />
more successful on capture of submicrometer mist particles<br />
and could be attractive in situations in which large quantities of<br />
waste thermal energy are available. However, the equivalent energy<br />
consumption is equal to that required for high-energy venturi scrubbers,<br />
and such devices are likely to be no more attractive than venturi<br />
scrubbers when the thermal energy is priced at its proper value.<br />
Sparks [ J. Air Pollut. Control Assoc., 24, 958 (1974)] has discussed<br />
steam ejectors giving 99 percent collection of particles 0.3 to 10 µm.<br />
Energy requirements were 311,000 J/m3 (8.25 Btu/scf). Gardenier<br />
[ J. Air Pollut. Control Assoc., 24, 954 (1974)] operated a liquid<br />
eductor with high-pressure (6900- to 27,600-kPa) (1000- to 4000lbf/in2<br />
) hot water heated to 200°C (392°F) which flashed into two<br />
phases as it issued from the jet. He obtained 95 to 99 percent collection<br />
of submicrometer particulate. Figure 14-128 shows the<br />
water-to-gas ratio required as a function of particle size to achieve 99<br />
percent collection.<br />
Effect of Gas Saturation in Scrubbing If hot unsaturated gas is<br />
introduced into a wet scrubber, spray particles will evaporate to cool<br />
and saturate the gas. The evaporating liquid molecules moving away<br />
from the target droplets will repel particles which might collide with<br />
them. This results in the forces of diffusiophoresis opposing particle<br />
collection. Semrau and Witham (Air Pollut. Control Assoc. Prepr. 75-<br />
30.1) investigated temperature parameters in wet scrubbing and<br />
found a definite decrease in the efficiency of evaporative scrubbers<br />
and an enhancement of efficiency when a hot saturated gas is<br />
scrubbed with cold water rather than recirculated hot water. Little<br />
improvement was experienced in cooling a hot saturated gas below a<br />
50°C dew point.<br />
Energy Requirements for Inertial-Impaction Efficiency<br />
Semrau [ J. Air Pollut. Control Assoc., 13, 587 (1963)] proposed a<br />
“contacting-power” principle which states that the collecting efficiency<br />
of a given size of particle is proportional to the power expended<br />
and that the smaller the particle, the greater the power required.
14-124 EQUIPMENT FOR DISTILLATION, GAS ABSORPTION, PHASE DISPERSION, AND PHASE SEPARATION<br />
FIG. 14-128 Superheated high-pressure hot-water requirements for 99 percent<br />
collection as a function of particle size in a two-phase eductor jet scrubber.<br />
To convert gallons per 1000 cubic feet to cubic meters per 1000 cubic meters,<br />
multiply by 0.134. [Gardenier, J. Air Pollut. Control Assoc., 24, 954 (1974).]<br />
�<br />
Mathematically expressed, NT =∝PT,<br />
where NT is the number of particulate<br />
transfer units achieved and PT is the total energy expended<br />
within the collection device, including gas and liquid pressure drop<br />
and thermal and mechanical energy added in atomizers. NT is further<br />
defined as NT = ln [1/(1 −η)], where η is the overall fractional collection<br />
efficiency. This was intended as a universal principle, but the constants<br />
∝ and γ have been found to be functions of the chemical nature<br />
of the system and the design of the control device. Others have<br />
pointed out that the principle is applicable only when the primary<br />
collection mechanism is impaction and direct interception. Calvert<br />
(R-10, R-12) has found that plotting particle cut size versus pressure<br />
drop (or power expended) as in Fig. 14-129 is a more suitable way<br />
to develop a generalized energy-requirement curve for impaction<br />
FIG. 14-129 Typical cut diameter as a function of pressure drop for various<br />
liquid-particle collectors. Curves 1a and b are single-sieve plates with froth density<br />
of 0.4 g/cm 3 ; 1a has sieve holes of 0.5 cm and 1b holes of 0.3 cm. Curves 2a<br />
and b are for a venturi scrubber with hydrophobic particles (2a) and hydrophilic<br />
particles (2b). Curve 3 is an impingement plate, and curve 4 is a packed column<br />
with 2.5-cm-diameter packing. Curve 5 is a zigzag baffle collector with six baffles<br />
at θ =30°. Curve 7 is for six rows of staggered tubes with 1-cm spacing<br />
between adjacent tube walls in a row. Curve 8 is similar, except that tube-wall<br />
spacing in the row is 0.3 cm. Curve 9 is for wire-mesh pads. To convert grams<br />
per cubic centimeter to pounds per cubic foot, multiply by 62.43; to convert<br />
centimeters to inches, multiply by 0.394. [Calvert, J. Air Pollut. Control Assoc.,<br />
24, 929 (1974); and Calvert, Yung, and Leung, NTIS Publ. PB-248050, 1975.]<br />
Aerodynamic cut-diameter, d pca, µm<br />
4.0<br />
3.0<br />
2.0<br />
1.0<br />
0.5<br />
0.4<br />
0.3<br />
<strong>Packed</strong> column<br />
Sieve plate<br />
Mobile bed<br />
Venturi<br />
0.2<br />
10 20 30 40 50 100<br />
Gas pressure drop, cm of water<br />
across wet scrubber collection device<br />
FIG. 14-130 Calvert’s refined particle cut-size/power relationship for particle<br />
inertial impaction wet collectors. Ref. (R-19) by permission.<br />
devices. The various curves fall close together and outline an imaginary<br />
curve that indicates the magnitude of pressure drop required as<br />
particle size decreases bound by the two limits of hydrophilic and<br />
hydrophobic particles. By calculating the required cut size for a given<br />
collection efficiency, Fig. 14-129 can also be used as a guide to deciding<br />
between different collection devices.<br />
Subsequently, Calvert (R-19, p. 228) has combined mathematical<br />
modeling with performance tests on a variety of industrial scrubbers<br />
and has obtained a refinement of the power-input/cut-size relationship<br />
as shown in Fig. 14-130. He considers these relationships sufficiently<br />
reliable to use this data as a tool for selection of scrubber type<br />
and performance prediction. The power input for this figure is based<br />
solely on gas pressure drop across the device.<br />
Collection of Fine Mists Inertial-impaction devices previously<br />
discussed give high efficiency on particles above 5 µm in size and<br />
often reasonable efficiency on particles down to 3 µm in size at moderate<br />
pressure drops. However, this mechanism becomes ineffective<br />
for particles smaller than 3 µm because of the particle gaslike mobility.<br />
Only impaction devices having extremely high energy input such<br />
as venturi scrubbers and a flooded mesh pad (the pad interstices really<br />
become miniature venturi scrubbers in parallel and in series) can give<br />
high collection efficiency on fine particles, defined as 2.5 or 3 µm and<br />
smaller, including the submicrometer range. Fine particles are subjected<br />
to brownian motion in gases, and diffusional deposition can be<br />
employed for their collection. Diffusional deposition becomes highly<br />
efficient as particles become smaller, especially below 0.2 to 0.3 µm.<br />
Table 14-28 shows typical displacement velocity of particles. Randomly<br />
oriented fiber beds having tortuous and narrow gas passages<br />
are suitable devices for utilizing this collection mechanism. (The diffusional<br />
collection mechanism is discussed in Sec. 17 under “Mechanisms<br />
of Dust Collection.”) Other collection mechanisms which are<br />
efficient for fine particles are electrostatic forces and flux forces such<br />
as thermophoresis and diffusiophoresis. Particle growth and nucleation<br />
methods are also applicable. Efficient collection of fine particles
TABLE 14-28 Brownian Movement of Particles*<br />
Particle diameter, µm Brownian displacement of particle, µm/s<br />
0.1 29.4<br />
0.25 14.2<br />
0.5 8.92<br />
1.0 5.91<br />
2.5 3.58<br />
5.0 2.49<br />
10.0 1.75<br />
*Brink, Can. J. Chem. Eng., 41, 134 (1963). Based on spherical water particles<br />
in air at 21°C and 1 atm.<br />
is important because particles in the range of 2.0 to around 0.2 µm are<br />
the ones which penetrate and are deposited in the lung most efficiently.<br />
Hence, particles in this range constitute the largest health<br />
hazard.<br />
Fiber Mist Eliminators These devices are produced in various<br />
configurations. Generally, randomly oriented glass or polypropylene<br />
fibers are densely packed between reinforcing screens, producing<br />
fiber beds varying in thickness usually from 25 to 75 mm (1 to 3 in),<br />
although thicker beds can be produced. Units with efficiencies as high<br />
as 99.9 percent on fine particles have been developed (see Chemical<br />
Engineers’ Handbook, 5th ed., p. 18–88). A combination of mechanisms<br />
interacts to provide high overall collection efficiency. Particles<br />
larger than 2 to 3 µm are collected on the fibers by inertial impaction<br />
and direct interception, while small particles are collected by brownian<br />
diffusion. When the device is designed to use this latter mechanism<br />
as the primary means, efficiency turndown problems are eliminated<br />
as collection efficiency by diffusion increases with residence time.<br />
Pressure drop through the beds increases with velocity to the first<br />
power since the gas flow is laminar. This leads to design capability<br />
trade-offs. As pressure drop is reduced and energy is conserved, capital<br />
increases because more filtering area is required for the same efficiency.<br />
Three series of fiber mist eliminators are typically available. A<br />
spray-catcher series is designed primarily for essentially 100 percent<br />
capture of droplets larger than 3 µm. The high-velocity type is<br />
designed to give moderately high efficiency on particles down to<br />
1.0 µm as well. Both of these types are usually produced in the form<br />
of flat panels of 25- to 50-mm (1- to 2-in) thickness. The highefficiency<br />
type is illustrated in Fig. 14-131. As mist particles are collected,<br />
they coalesce into a liquid film which wets the fibers. Liquid is<br />
moved horizontally through the bed by the gas drag force and downward<br />
by gravity. It drains down the downstream retaining screen to<br />
the bottom of the element and is returned to the process through a<br />
liquid seal. Table 14-29 gives typical operating characteristics of the<br />
three types of collectors. The application of these devices to sulfuric<br />
acid plants and other process gases has been discussed by Brink (see<br />
Chemical Engineers’ Handbook, 5th ed., pp. 18–89, 18–90).<br />
Solid particulates are captured as readily as liquids in fiber beds<br />
but can rapidly plug the bed if they are insoluble. Fiber beds have<br />
frequently been used for mixtures of liquids and soluble solids and<br />
with soluble solids in condensing situations. Sufficient solvent (usually<br />
water) is atomized into the gas stream entering the collector to<br />
irrigate the fiber elements and dissolve the collected particulate.<br />
Such fiber beds have been used to collect fine fumes such as ammonium<br />
nitrate and ammonium chloride smokes, and oil mists from<br />
compressed air.<br />
PHASE SEPARATION 14-125<br />
FIG. 14-131 Monsanto high-efficiency fiber-mist-eliminator element. (Monsanto<br />
Company.)<br />
Electrostatic Precipitators The principles and operation of<br />
electrical precipitators are discussed in Sec. 17 under “Gas-Solids Separations.”<br />
Precipitators are admirably suited to the collection of fine<br />
mists and mixtures of mists and solid particulates. Tube-type precipitators<br />
have been used for many years for the collection of acid mists and<br />
the removal of tar from coke-oven gas. The first practical installation of<br />
a precipitator by Cottrell was made on sulfuric acid mist in 1907. Most<br />
older installations of precipitators were tube-type rather than platetype.<br />
However, recently two plate-type wet precipitators employing<br />
water sprays or overflowing weirs have been introduced by Mikropul<br />
Corporation [Bakke, J. Air Pollut. Control Assoc., 25, 163 (1975)] and<br />
by Fluid Ionics. Such precipitators operate on the principle of making<br />
all particles conductive when possible, which increases the particle<br />
migration velocity and collection efficiency. Under these conditions,<br />
particle dielectric strength becomes a much more important variable,<br />
and particles with a low dielectric constant such as condensed hydrocarbon<br />
mists become much more difficult to collect than waterwettable<br />
particles. Bakke (U.S.–U.S.S.R. Joint Work. Group Symp.:<br />
Fine Particle Control, San Francisco, 1974) has developed equations<br />
for particle charge and relative collection efficiency in wet precipitators<br />
that show the effect of dielectric constant. Wet precipitators can also be<br />
used to absorb soluble gases simultaneously by adjusting the pH or the<br />
chemical composition of the liquid spray. The presence of the electric<br />
field appears to enhance absorption. Wet precipitators have found<br />
their greatest usefulness to date in handling mixtures of gaseous pollutants<br />
and submicrometer particulate (either liquid or solid, or both)<br />
such as fumes from aluminum-pot lines, carbon anode baking, fiberglass-fume<br />
control, coke-oven and metallurgical operations, chemical<br />
incineration, and phosphate-fertilizer operations. Two-stage precipitators<br />
are used increasingly for moderate-volume gas streams containing<br />
nonconductive liquid mists which will drain from the collecting plates.<br />
Their application on hydrocarbon mists has been quite successful, but<br />
careful attention must be given to fire and explosion hazards.<br />
Electrically Augmented Collectors A new area for enhancing<br />
collection efficiency and lowering cost is the combining of electrostatic<br />
forces with devices using other collecting mechanisms such as<br />
TABLE 14-29 Operating Characteristics of Various Types of Fiber Mist Eliminators as Used on Sulfuric Acid Plants*<br />
High efficiency High velocity Spray catcher<br />
Controlling mechanism for mist collection Brownian movement Impaction Impaction<br />
Superficial velocity, m/s 0.075–0.20 2.0–2.5 2.0–2.5<br />
Efficiency on particles greater than 3 µm, % Essentially 100 Essentially 100 Essentially 100<br />
Efficiency on particles 3 µm and smaller, % 95–99+ 90–98 15–30<br />
Pressure drop, cm H2O 12–38 15–20 1.0–2.5<br />
*Brink, Burggrabe, and Greenwell, Chem. Eng. Prog., 64(11), 82 (1968). To convert centimeters to inches, multiply by 0.394.
14-126 EQUIPMENT FOR DISTILLATION, GAS ABSORPTION, PHASE DISPERSION, AND PHASE SEPARATION<br />
impaction and diffusion. Cooper (Air Pollut. Control Assoc. Prepr. 75-<br />
02.1) evaluated the magnitude of forces operating between charged<br />
and uncharged particles and concluded that electrostatic attraction is<br />
the strongest collecting force operating on particles finer than 2 µm.<br />
Nielsen and Hill [Ind. Eng. Chem. Fundam., 15, 149 (1976)] have<br />
quantified these relationships, and a number of practical devices have<br />
been demonstrated. Pilat and Meyer (NTIS Publ. PB-252653, 1976)<br />
have demonstrated up to 99 percent collection of fine particles in a<br />
two-stage spray tower in which the inlet particles and water spray are<br />
charged with opposite polarity. The principle has been applied to<br />
retrofitting existing spray towers to enhance collection.<br />
Klugman and Sheppard (Air Pollut. Control Assoc. Prepr. 75-30.3)<br />
have developed an ionizing wet scrubber in which the charged mist<br />
particles are collected in a grounded, irrigated cross-flow bed of<br />
Tellerette packing. Particles smaller than 1 µm have been collected<br />
with 98 percent efficiency by using two units in series. Dembinsky and<br />
Vicard (Air Pollut. Control Assoc. Prepr. 78-17.6) have used an electrically<br />
augmented low-pressure [5 to 10 cm (2 to 4 in) of water]<br />
venturi scrubber to give 95 to 98 percent collection efficiency on submicrometer<br />
particles.<br />
Particle Growth and Nucleation Fine particles may be subjected<br />
to conditions favoring the growth of particles either through<br />
condensation or through coalescence. Saturation of a hot gas stream<br />
with water, followed by condensation on the particles acting as nuclei<br />
when the gas is cooled, can increase particle size and ease of collection.<br />
Addition of steam can produce the same results. Scrubbing of<br />
the humid gas with a cold liquid can bring diffusiophoresis into play.<br />
The introduction of cold liquid drops causes a reduction in watervapor<br />
pressure at the surface of the cold drop. The resulting vaporpressure<br />
gradient causes a hydrodynamic flow toward the drop known<br />
as Stefan flow which enhances the movement of mist particles toward<br />
the spray drop. If the molecular mass of the diffusing vapor is different<br />
from the carrier gas, this density difference also produces a driving<br />
force, and the sum of these forces is known as diffusiophoresis. A<br />
mathematical description of these forces has been presented by<br />
Calvert (R-9) and by Sparks and Pilat [Atmos. Environ., 4, 651<br />
(1970)]. Thermal differences between the carrier gas and the cold<br />
scrubbing droplets can further enhance collection through thermophoresis.<br />
Calvert and Jhaseri [ J. Air Pollut. Control Assoc., 24, 946<br />
(1974)]; and NTIS Publ. PB-227307, 1973)] have investigated condensation<br />
scrubbing in multiple-sieve plate towers.<br />
Submicrometer droplets can be coagulated through brownian diffusion<br />
if given ample time. The introduction of particles 50 to 100<br />
times larger in diameter can enhance coagulation, but the addition of<br />
a broad range of particle sizes is discouraged. Increasing turbulence<br />
will aid coagulation, so fans to stir the gas or narrow, tortuous passages<br />
such as those of a packed bed can be beneficial. Sonic energy can also<br />
produce coagulation, especially the production of standing waves in<br />
the confines of long, narrow tubes. Addition of water and oil mists can<br />
sometimes aid sonic coagulation. Sulfuric acid mist [Danser, Chem.<br />
Eng., 57(5), 158 (1950)] and carbon black [Stokes, Chem. Eng. Prog.,<br />
46, 423 (1950)] have been successfully agglomerated with sonic<br />
energy. Frequently sonic agglomeration has been unsuccessful<br />
because of the high energy requirement. Most sonic generators have<br />
very poor energy-transformation efficiency. Wegrzyn et al. (U.S. EPA<br />
Publ. EPA-600/7-79-004C, 1979, p. 233) have reviewed acoustic<br />
agglomerators. Mednikov (U.S.S.R. Akad. Soc. Moscow, 1963) suggested<br />
that the incorporation of sonic agglomeration with electrostatic<br />
precipitation could greatly reduce precipitator size.<br />
Other Collectors Tarry particulates and other difficult-to-handle<br />
liquids have been collected on a dry, expendable phenol formaldehydebonded<br />
glass-fiber mat (Goldfield, J. Air Pollut. Control Assoc., 20,<br />
466 (1970)] in roll form which is advanced intermittently into a filter<br />
frame. Superficial gas velocities are 2.5 to 3.5 m/s (8.2 to 11.5 ft/s), and<br />
pressure drop is typically 41 to 46 cm (16 to 18 in) of water. Collection<br />
efficiencies of 99 percent have been obtained on submicrometer particles.<br />
Brady [Chem. Eng. Prog., 73(8), 45 (1977)] has discussed a cleanable<br />
modification of this approach in which the gas is passed through a<br />
reticulated foam filter that is slowly rotated and solvent-cleaned.<br />
In collecting very fine (mainly submicron) mists of a hazardous<br />
nature where one of the collectors previously discussed has been used<br />
as the primary one (fiber-mist eliminators of the Brownian diffusion<br />
type and electrically augmented collectors are primarily recommended),<br />
there is the chance that the effluent concentration may still<br />
be too high for atmospheric release when residual concentration must<br />
be in the range of 1–2 µm. In such situations, secondary treatment<br />
may be needed. Probably removal of the residual mist by adsorption<br />
will be in order. See “Adsorption,” Sec. 16. Another possibility might<br />
be treatment of the remaining gas by membrane separation. A separator<br />
having a gas-permeable membrane that is essentially nonliquidpermeable<br />
could be useful. However, if the gas-flow volumes are<br />
appreciable, the device could be expensive. Most membranes have<br />
low capacity (requiring high membrane surface area) to handle high<br />
gas-permeation capacity. See “Membrane Separation Processes,” Sec. 20.<br />
Continuous Phase Uncertain Some situations exist such as in<br />
two-phase gas-liquid flow where the volume of the liquid phase may<br />
approach being equal to the volume of the vapor phase, and where it<br />
may be difficult to be sure which phase is the continuous phase.<br />
Svrcek and Monnery [Chem. Eng. Prog., 89(10), 53–60 (Oct. 1993)]<br />
have discussed the design of two-phase separation in a tank with gasliquid<br />
separation in the middle, mist elimination in the top, and<br />
entrained gas-bubble removal from the liquid in the bottom. Monnery<br />
and Svrcek [Chem. Eng. Prog., 90(9), 29–40 (Sept. 1994)] have<br />
expanded the separation to include multiphase flow, where the components<br />
are a vapor and two immiscible liquids and these are also<br />
separated in a tank. A design approach for sizing the gas-liquid disengaging<br />
space in the vessel is given using a tangential tank inlet nozzle,<br />
followed by a wire mesh mist eliminator in the top of the vessel for<br />
final separation of entrained mist from the vapor. Design approaches<br />
and equations are also given for sizing the lower portion of the vessel<br />
for separation of the two immiscible liquid phases by settling and separation<br />
of discontinuous liquid droplets from the continuous liquid<br />
phase.<br />
LIQUID-PHASE CONTINUOUS SYSTEMS<br />
Practical separation techniques for gases dispersed in liquids are discussed.<br />
Processes and methods for dispersing gas in liquid have been<br />
discussed earlier in this section, together with information for predicting<br />
the bubble size produced. Gas-in-liquid dispersions are also produced<br />
in chemical reactions and electrochemical cells in which a gas<br />
is liberated. Such dispersions are likely to be much finer than those<br />
produced by the dispersion of a gas. Dispersions may also be unintentionally<br />
created in the vaporization of a liquid.<br />
GENERAL REFERENCES: Adamson, Physical Chemistry of Surfaces, 4th ed.,<br />
Wiley, New York, 1982. Akers, Foams, Academic, New York, 1976. Bikerman,<br />
Foams, Springer-Verlag, New York, 1973. Bikerman, et al., Foams: Theory and<br />
Industrial Applications, Reinhold, New York, 1953. Cheremisinoff, ed., Encyclopedia<br />
of Fluid Mechanics, vol. 3, Gulf Publishing, Houston, 1986. Kerner,<br />
Foam Control Agents, Noyes Data Corp, Park Ridge, NJ, 1976. Rubel,<br />
Antifoaming and Defoaming Agents, Noyes Data Corp., Park Ridge, NJ, 1972.<br />
Rosen, Surfactants and Interfacial Phenomena, 2d ed., Wiley, New York, 1989.<br />
Sonntag and Strenge, Coagulation and Stability of Disperse Systems, Halsted-<br />
Wiley, New York, 1972. Wilson, ed., Foams: Physics, Chemistry and Structure,<br />
Springer-Verlag, London, 1989. “Defoamers” and “Foams”, Encyclopedia of<br />
Chemical Technology, 4th ed., vols. 7, 11, Wiley, New York, 1993–1994.<br />
Types of Gas-in-Liquid Dispersions Two types of dispersions<br />
exist. In one, gas bubbles produce an unstable dispersion which separates<br />
readily under the influence of gravity once the mixture has been<br />
removed from the influence of the dispersing force. Gas-liquid contacting<br />
means such as bubble towers and gas-dispersing agitators are<br />
typical examples of equipment producing such dispersions. More difficulties<br />
may result in separation when the gas is dispersed in the form<br />
of bubbles only a few micrometers in size. An example is the evolution<br />
of gas from a liquid in which it has been dissolved or released through<br />
chemical reaction such as electrolysis. Coalescence of the dispersed<br />
phase can be helpful in such circumstances.<br />
The second type is a stable dispersion, or foam. Separation can be<br />
extremely difficult in some cases. A pure two-component system of<br />
gas and liquid cannot produce dispersions of the second type. Stable<br />
foams can be produced only when an additional substance is adsorbed
TABLE 14-30 Terminal Velocity of Standard Air Bubbles Rising in Water at 20∞C*<br />
at the liquid-surface interface. The substance adsorbed may be in true<br />
solution but with a chemical tendency to concentrate in the interface<br />
such as that of a surface-active agent, or it may be a finely divided solid<br />
which concentrates in the interface because it is only poorly wetted by<br />
the liquid. Surfactants and proteins are examples of soluble materials,<br />
while dust particles and extraneous dirt including traces of nonmiscible<br />
liquids can be examples of poorly wetted materials.<br />
Separation of gases and liquids always involves coalescence, but<br />
enhancement of the rate of coalescence may be required only in difficult<br />
separations.<br />
Separation of Unstable Systems The buoyancy of bubbles suspended<br />
in liquid can frequently be depended upon to cause the bubbles<br />
to rise to the surface and separate. This is a special case of gravity<br />
settling. The mixture is allowed to stand at rest or is moved along a<br />
flow path in laminar flow until the bubbles have surfaced. Table 14-30<br />
shows the calculated rate of rise of air bubbles at atmospheric pressure<br />
in water at 20°C (68°F) as a function of diameter. It will be<br />
observed that the velocity of rise for 10-µm bubbles is very low, so that<br />
long separating times would be required for gas which is more finely<br />
dispersed.<br />
For liquids other than water, the rise velocity can be approximated<br />
from Table 14-30 by multiplying by the liquid’s specific gravity and the<br />
reciprocal of its viscosity (in centipoises). For bubbles larger than 100<br />
µm, this procedure is erroneous, but the error is less than 15 percent<br />
for bubbles up to 1000 µm. More serious is the underlying assumption<br />
of Table 14-30 that the bubbles are rigid spheres. Circulation within<br />
the bubble causes notable increases in velocity in the range of 100 µm<br />
to 1 mm, and the flattening of bubbles 1 cm and larger appreciably<br />
decreases their velocity. However, in this latter size range the velocity<br />
is so high as to make separation a trivial problem.<br />
In design of separating chambers, static vessels or continuous-flow<br />
tanks may be used. Care must be taken to protect the flow from turbulence,<br />
which could cause back mixing of partially separated fluids or<br />
which could carry unseparated liquids rapidly to the separated-liquid<br />
outlet. Vertical baffles to protect rising bubbles from flow currents are<br />
sometimes employed. Unseparated fluids should be distributed to the<br />
separating region as uniformly and with as little velocity as possible.<br />
When the bubble rise velocity is quite low, shallow tanks or flow channels<br />
should be used to minimize the residence time required.<br />
Quite low velocity rise of bubbles due either to small bubble size or<br />
to high liquid viscosity can cause difficult situations. With low-viscosity<br />
liquids, separation-enhancing possibilities in addition to those previously<br />
enumerated are to sparge the liquid with large-diameter gas<br />
bubbles or to atomize the mixture as a spray into a tower. Large gas<br />
bubbles rising rapidly through the liquid collide with small bubbles<br />
and aid their coalescence through capture. Atomizing of the continuous<br />
phase reduces the distance that small gas bubbles must travel to<br />
reach a gas interface. Evacuation of the spray space can also be beneficial<br />
in promoting small-bubble growth and especially in promoting<br />
gas evolution when the gas has appreciable liquid solubility. Liquid<br />
heating will also reduce solubility.<br />
Surfaces in the settling zone for bubble coalescence such as closely<br />
spaced vertical or inclined plates or tubes are beneficial. When clean<br />
low-viscosity fluids are involved, passage of the undegassed liquid<br />
through a tightly packed pad of mesh or fine fibers at low velocity will<br />
result in efficient bubble coalescence. Problems have been experienced<br />
in degassing a water-based organic solution that has been<br />
passed through an electrolytic cell for chemical reaction in which<br />
extremely fine bubbles of hydrogen gas are produced in the liquid<br />
within the cell. Near-total removal of hydrogen gas from the liquid is<br />
needed for process safety. This is extremely difficult to achieve by<br />
gravity settling alone because of the fine bubble size and the need for<br />
a coalescing surface. Utilization of a fine fiber media is strongly recommended<br />
in such situations. A low-forward liquid flow through the<br />
PHASE SEPARATION 14-127<br />
Bubble diameter, µm 10 30 50 100 200 300<br />
Terminal velocity, mm/s 0.061 0.488 1.433 5.486 21.95 49.38<br />
*Calculated from Stokes’ law. To convert millimeters per second to feet per second, multiply by 0.003281.<br />
media is desireable to provide time for the bubbles to attach themselves<br />
to the fiber media through Brownian diffusion. Spielman and<br />
Goren [Ind. Eng. Chem., 62(10), (1970)] reviewed the literature on<br />
coalescence with porous media and reported their own experimental<br />
results [Ind. Eng. Chem. Fundam., 11(1), 73 (1972)] on the coalescence<br />
of oil-water liquid emulsions. The principles are applicable to a<br />
gas-in-liquid system. Glass-fiber mats composed of 3.5-, 6-, or 12-µm<br />
diameter fibers, varying in thickness from 1.3 to 3.3 mm, successfully<br />
coalesced and separated 1- to 7-µm oil droplets at superficial bed<br />
velocities of 0.02 to 1.5 cm/s (0.00067 to 0.049 ft/s).<br />
In the deaeration of high-viscosity fluids such as polymers, the<br />
material is flowed in thin sheets along solid surfaces. Vacuum is<br />
applied to increase bubble size and hasten separation. The Versator<br />
(Cornell Machine Co.) degasses viscous liquids by spreading them<br />
into a thin film by centrifugal action as the liquids flow through an<br />
evacuated rotating bowl.<br />
Separation of Foam Foam is a colloidal system containing relatively<br />
large volumes of dispersed gas in a relatively small volume of liquid.<br />
Foams are thermodynamically unstable with respect to separation<br />
into their components of gas and vapor, and appreciable surface<br />
energy is released in the bursting of foam bubbles. Foams are<br />
dynamic systems in which a third component produces a surface layer<br />
that is different in composition from the bulk of the liquid phase. The<br />
stabilizing effect of such components (often present only in trace<br />
amounts) can produce foams of troubling persistence in many operations.<br />
(Foams which have lasted for years when left undisturbed have<br />
been produced.) Bendure [TAPPI, 58(2), 83 (1975)], Keszthelyi [ J.<br />
Paint Technol., 46(11), 31 (1974)], Ahmad [Sep. Sci. 10, 649 (1975)],<br />
and Shedlovsky (“Foams,” Encyclopedia of Chemical Technology, 2d<br />
ed., Wiley, New York, 1966) have presented concise articles on the<br />
characteristics and properties of foams in addition to the general references<br />
cited at the beginning of this subsection.<br />
Foams can be a severe problem in chemical-processing steps<br />
involving gas-liquid interaction such as distillation, absorption, evaporation,<br />
chemical reaction, and particle separation and settling. It can<br />
also be a major problem in pulp and paper manufacture, oil-well<br />
drilling fluids, production of water-based paints, utilization of lubricants<br />
and hydraulic fluids, dyeing and sizing of textiles, operation of<br />
steam boilers, fermentation operations, polymerization, wet-process<br />
phosphoric acid concentration, adhesive production, and foam control<br />
in products such as detergents, waxes, printing inks, instant coffee,<br />
and glycol antifreeze.<br />
Foams, as freshly generated, are gas emulsions with spherical bubbles<br />
separated by liquid films up to a few millimeters in thickness.<br />
They age rapidly by liquid drainage and form polyhedrals in which<br />
three bubbles intersect at corners with angles of approximately 120°.<br />
During drainage, the lamellae become increasingly thinner, especially<br />
in the center (only a few micrometers thickness), and more brittle.<br />
This feature indicates that with some foams if a foam layer can be tolerated,<br />
it may be self-limiting, as fresh foam is added to the bottom of<br />
the layer with drained foam collapsing on the top. (A quick-breaking<br />
foam may reach its maximum life cycle in 6 s. A moderately stable<br />
foam can persist for 140 s.) During drainage, gas from small foam bubbles,<br />
which is at a high pressure, will diffuse into large bubbles so that<br />
foam micelles increase with time. As drainage proceeds, weak areas in<br />
the lamella may develop. However, the presence of a higher concentration<br />
of surfactants in the surface produces a lower surface tension.<br />
As the lamella starts to fail, exposing bulk liquid with higher surface<br />
tension, the surface is renewed and healed. This is known as the<br />
Marangoni effect. If drainage can occur faster than Marangoni healing,<br />
a hole may develop in the lamella. The forces involved are such<br />
that collapse will occur in milliseconds without concern for rupture<br />
propagation. However, in very stable foams, electrostatic surface<br />
forces (zeta potential) prevent complete drainage and collapse. In
14-128 EQUIPMENT FOR DISTILLATION, GAS ABSORPTION, PHASE DISPERSION, AND PHASE SEPARATION<br />
some cases, stable lamella thicknesses of only two molecules have<br />
been measured.<br />
Drainage rate is influenced by surface viscosity, which is very temperature-sensitive.<br />
At a critical temperature, which is a function of the<br />
system, a temperature change of only a few degrees can change a<br />
slow-draining foam to a fast-draining foam. This change in drainage<br />
rate can be a factor of 100 or more; thus increasing the temperature of<br />
foam can cause its destruction. An increase in temperature may also<br />
cause liquid evaporation and lamella thinning. As the lamellae<br />
become thinner, they become more brittle and fragile. Thus, mechanical<br />
deformation or pressure changes, which cause a change in gasbubble<br />
volume, can also cause rupture.<br />
Bendure indicates 10 ways to increase foam stability: (1) increase<br />
bulk liquid viscosity, (2) increase surface viscosity, (3) maintain thick<br />
walls (higher liquid-to-gas ratio), (4) reduce liquid surface tension,<br />
(5) increase surface elasticity, (6) increase surface concentration,<br />
(7) reduce surfactant-adsorption rate, (8) prevent liquid evaporation,<br />
(9) avoid mechanical stresses, and (10) eliminate foam inhibitors.<br />
Obviously, the reverse of each of these actions, when possible, is a way<br />
to control and break foam.<br />
Physical Defoaming Techniques Typical physical defoaming<br />
techniques include mechanical methods for producing foam stress,<br />
thermal methods involving heating or cooling, and electrical methods.<br />
Combinations of these methods may also be employed, or they may be<br />
used in conjunction with chemical defoamers. Some methods are only<br />
moderately successful when conditions are present to reform the<br />
foam such as breaking foam on the surface of boiling liquids. In some<br />
cases it may be desirable to draw the foam off and treat it separately.<br />
Foam can always be stopped by removing the energy source creating<br />
it, but this is often impractical.<br />
Thermal Methods Heating is often a suitable means of destroying<br />
foam. As indicated previously, raising the foam above a critical<br />
temperature (which must be determined experimentally) can greatly<br />
decrease the surface viscosity of the film and change the foam from a<br />
slow-draining to a fast-draining foam. Coupling such heating with a<br />
mechanical force such as a revolving paddle to cause foam deformation<br />
is frequently successful. Other effects of heating are expansion of<br />
the gas in the foam bubbles, which increases strain on the lamella<br />
walls as well as requiring their movement and flexing. Evaporation of<br />
solvent may occur causing thinning of the walls. At sufficiently high<br />
temperatures, desorption or decomposition of stabilizing substances<br />
may occur. Placing a high-temperature bank of steam coils at the maximum<br />
foam level is one control method. As the foam approaches or<br />
touches the coil, it collapses. The designer should consider the fact<br />
that the coil will frequently become coated with solute.<br />
Application of radiant heat to a foam surface is also practiced.<br />
Depending on the situation, the radiant source may be electric lamps,<br />
Glowbar units, or gas-fired radiant burners. Hot gases from burners<br />
will enhance film drying of the foam. Heat may also be applied by jetting<br />
or spraying hot water on the foam. This is a combination of methods<br />
since the jetting produces mechanical shear, and the water itself<br />
provides dilution and change in foam-film composition. Newer<br />
approaches might include foam heating with the application of<br />
focused microwaves. This could be coupled with continuous or intermittent<br />
pressure fluctuations to stress lamella walls as the foam ages.<br />
Cooling can also destroy foam if it is carried to the point of freezing<br />
since the formation of solvent crystals destroys the foam structure.<br />
Less drastic cooling such as spraying a hot foam with cold water may<br />
be effective. Cooling will reduce the gas pressure in the foam bubbles<br />
and may cause them to shrink. This is coupled with the effects of shear<br />
and dilution mentioned earlier. In general, moderate cooling will be<br />
less effective than heating since the surface viscosity is being modified<br />
in the direction of a more stable foam.<br />
Mechanical Methods Static or rotating breaker bars or slowly<br />
revolving paddles are sometimes successful. Their application in conjunction<br />
with other methods is frequently better. As indicated in the<br />
theory of foams, they will work better if installed at a level at which the<br />
foam has had some time to age and drain. A rotating breaker works by<br />
deforming the foam, which causes rupture of the lamella walls.<br />
Rapidly moving slingers will throw the foam against the vessel wall<br />
and may cause impact on other foam outside the envelope of the<br />
slinger. In some instances, stationary bars or closely spaced plates will<br />
limit the rise of foam. The action here is primarily one of providing<br />
surface for coalescence of the foam. Wettability of the surface,<br />
whether moving or stationary, is frequently important. Usually a surface<br />
not wetted by the liquid is superior, just as is frequently the case<br />
of porous media for foam coalescence. However, in both cases there<br />
are exceptions for which wettable surfaces are preferred. Shkodin<br />
[Kolloidn. Zh., 14, 213 (1952)] found molasses foam to be destroyed<br />
by contact with a wax-coated rod and unaffected by a clean glass rod.<br />
Goldberg and Rubin [Ind. Eng. Chem. Process Des. Dev., 6 195<br />
(1967)] showed in tests with a disk spinning vertically to the foam layer<br />
that most mechanical procedures, whether centrifugation, mixing, or<br />
blowing through nozzles, consist basically of the application of shear<br />
stress. Subjecting foam to an air-jet impact can also provide a source<br />
of drying and evaporation from the film, especially if the air is heated.<br />
Other effective means of destroying bubbles are to lower a frame of<br />
metal points periodically into the foam or to shower the foam with<br />
falling solid particles.<br />
Pressure and Acoustic Vibrations These methods for rupturing<br />
foam are really special forms of mechanical treatment. Change in pressure<br />
in the vessel containing the foam stresses the lamella walls by<br />
expanding or contracting the gas inside the foam bubbles. Oscillation<br />
of the vessel pressure subjects the foam to repeated film flexing. Parlow<br />
[Zucker, 3, 468 (1950)] controlled foam in sugar-sirup evaporators<br />
with high-frequency air pulses. It is by no means certain that highfrequency<br />
pulsing is necessary in all cases. Lower frequency and higher<br />
amplitude could be equally beneficial. Acoustic vibration is a similar<br />
phenomenon causing localized pressure oscillation by using sound<br />
waves. Impulses at 6 kHz have been found to break froth from coal<br />
flotation [Sun, Min. Eng., 3, 865 (1958)]. Sonntag and Strenge (Coagulation<br />
and Stability of Disperse Systems, Halsted-Wiley, New York,<br />
1972, p. 121) report foam suppression with high-intensity sound waves<br />
(11 kHz, 150 dB) but indicate that the procedure is too expensive for<br />
large-scale application. The Sontrifuge (Teknika Inc., a subsidiary of<br />
Chemineer, Inc.) is a commercially available low-speed centrifuge<br />
employing sonic energy to break the foam. Walsh [Chem. Process., 29,<br />
91 (1966)], Carlson [Pap. Trade J., 151, 38 (1967)], and Thorhildsen<br />
and Rich [TAPPI, 49, 95A (1966)] have described the unit.<br />
Electrical Methods As colloids, most foams typically have electrical<br />
double layers of charged ions which contribute to foam stability.<br />
Accordingly, foams can be broken by the influence of an external electric<br />
field. While few commercial applications have been developed,<br />
Sonntag and Strenge (op. cit., p. 114) indicate that foams can be broken<br />
by passage through devices much like electrostatic precipitators<br />
for dusts. Devices similar to two-stage precipitators having closely<br />
spaced plates of opposite polarity should be especially useful. Sonntag<br />
and Strenge, in experiments with liquid-liquid emulsions, indicate<br />
that the colloid structure can be broken at a field strength of the order<br />
of 8 to 9 × 10 5 V/cm.<br />
Chemical Defoaming Techniques Sonntag and Strenge (op.<br />
cit., p. 111) indicate two chemical methods for foam breaking. One<br />
method is causing the stabilizing substances to be desorbed from the<br />
interface, such as by displacement with other more surface-active but<br />
nonstabilizing compounds. Heat may also cause desorption. The second<br />
method is to carry on chemical changes in the adsorption layer,<br />
leading to a new structure. Some defoamers may act purely by<br />
mechanical means but will be discussed in this subsection since their<br />
action is generally considered to be chemical in nature. Often chemical<br />
defoamers act in more than one way.<br />
Chemical Defoamers The addition of chemical foam breakers is<br />
the most elegant way to break a foam. Effective defoamers cause very<br />
rapid disintegration of the foam and frequently need be present only<br />
in parts per million. The great diversity of compounds used for<br />
defoamers and the many different systems in which they are applied<br />
make a brief and orderly discussion of their selection difficult. Compounds<br />
needed to break aqueous foams may be different from those<br />
needed for aqueous-free systems. The majority of defoamers are<br />
insoluble or nonmiscible in the foam continuous phase, but some<br />
work best because of their ready solubility. Lichtman (Defoamers, 3d<br />
ed., Wiley, New York, 1979) has presented a concise summary of the<br />
application and use of defoamers. Rubel (Antifoaming and Defoaming
TABLE 14-31 Major Types and Applications of Defoamers<br />
Agents, Noyes Data Corp., Park Ridge, N.J., 1972) has reviewed the<br />
extensive patent literature on defoamers. Defoamers are also discussed<br />
extensively in the general references at the beginning of this<br />
subsection.<br />
One useful method of aqueous defoaming is to add a nonfoam stabilizing<br />
surfactant which is more surface-active than the stabilizing<br />
substance in the foam. Thus a foam stabilized with an ionic surfactant<br />
can be broken by the addition of a very surface-active but nonstabilizing<br />
silicone oil. The silicone displaces the foam stabilizer from the<br />
interface by virtue of its insolubility. However, it does not stabilize the<br />
foam because its foam films have poor elasticity and rupture easily.<br />
A major requirement for a defoamer is cost-effectiveness. Accordingly,<br />
some useful characteristics are low volatility (to prevent stripping<br />
from the system before it is dispersed and does its work), ease of<br />
dispersion and strong spreading power, and surface attractionorientation.<br />
Chemical defoamers must also be selected in regard to<br />
their possible effect on product quality and their environmental and<br />
health suitability. For instance, silicone antifoam agents are effective<br />
in textile jet dyeing but reduce the fire retardancy of the fabric. Mineral-oil<br />
defoamers in sugar evaporation have been replaced by specifically<br />
approved materials. The tendency is no longer to use a single<br />
defoamer compound but to use a formulation specially tailored for the<br />
application comprising carriers, secondary antifoam agents, emulsifiers,<br />
and stabilizing agents in addition to the primary defoamer. Carriers,<br />
usually hydrocarbon oils or water, serve as the vehicle to support<br />
the release and spread of the primary defoamer. Secondary defoamers<br />
may provide a synergistic effect for the primary defoamer or modify<br />
its properties such as spreadability or solubility. Emulsifiers may<br />
enhance the speed of dispersion, while stabilizing agents may enhance<br />
defoamer stability or shelf life.<br />
Hydrophobic silica defoamers work on a basis which may not be<br />
chemical at all. They are basically finely divided solid silica particles<br />
dispersed in a hydrocarbon or silicone oil which serves as a spreading<br />
vehicle. Kulkarni [Ind. Eng. Chem. Fundam., 16, 472 (1977)] theorizes<br />
that this mixture defoams by the penetration of the silica particle<br />
into the bubble and the rupture of the wall. Table 14-31 lists major<br />
types of defoamers and typical applications.<br />
Other Chemical Methods These methods rely chiefly on<br />
destroying the foam stabilizer or neutralizing its effect through methods<br />
other than displacement and are applicable when the process will<br />
permit changing the chemical environment. Forms stabilized with<br />
alkali esters can be broken by acidification since the equivalent free<br />
PHASE SEPARATION 14-129<br />
Classification Examples Applications<br />
Silicones Dimethyl silicone, trialkyl and tetraalkyl silanes Lubricating oils; distillation; fermentation; jam and wine<br />
making; food processing<br />
Aliphatic acids or esters Mostly high-molecular-weight compounds; diethyl Papermaking; wood-pulp suspensions; water-based paints;<br />
phthalate; lauric acid food processing<br />
Alcohols Moderate- to high-molecular-weight monohydric and<br />
polyhydric alcohols; octyl alcohol; C-12 to C-20 alcohols;<br />
lauryl alcohol<br />
Distillation; fermentation; papermaking; glues and adhesives<br />
Sulfates or sulfonates Alkali metal salts of sulfated alcohols, sulfonic acid salts; Nonaqueous systems; mixed aqueous and nonaqueous<br />
alkyl-aryl sulfonates; sodium lauryl sulfate systems; oil-well drilling muds; spent H3SO4 recovery;<br />
deep-fat frying<br />
Amines or amides Alkyl amines (undecyloctyl and diamyl methyl amine);<br />
polyamides (acyl derivatives of piperazine)<br />
Boiler foam; sewage foam; fermentation; dye baths<br />
Halogenated compounds Fluochloro hydrocarbons with 5 to 50 C atoms; chlorinated<br />
hydrocarbons<br />
Lubrication-oil and grease distillation; vegetable-protein glues<br />
Natural products Vegetable oils; waxes, mineral oils plus their sulfated<br />
derivatives (including those of animal oils and fats)<br />
Sugar extraction; glue manufacture; cutting oils<br />
Fatty-acid soaps Alkali, alkaline earth, and other metal soaps; sodium<br />
stearate; aluminum stearate<br />
Gear oils; paper stock; paper sizing; glue solutions<br />
Inorganic compounds Monosodium phosphate mixed with boric acid and ethyl<br />
carbonate, disodium phosphate; sodium aluminate,<br />
bentonite and other solids<br />
Distillation; instant coffee; boiler feedwater; sugar extraction<br />
Phosphates Alkyl-alkalene diphosphates; tributyl phosphate in<br />
isopropanol<br />
Petroleum-oil systems; foam control in soap solutions<br />
Hydrophobic silica Finely divided silica in polydimethyl siloxane Aqueous foaming systems<br />
Sulfides or thio derivatives Metallic derivatives of thio ethers and disulfides, usually<br />
mixed with organic phosphite esters; long-chain alkyl<br />
thienyl ketones<br />
Lubricating oils; boiler water<br />
acids do not stabilize foam. Foams containing sulfated and sulfonated<br />
ionic detergents can be broken with the addition of fatty-acid soaps<br />
and calcium salts. Several theories have been proposed. One suggests<br />
that the surfactant is tied up in the foam as double calcium salts of<br />
both the sulfonate and the soap. Another suggests that calcium soaps<br />
oriented in the film render it inelastic.<br />
Ionic surfactants adsorb at the foam interface and orient with the<br />
charged group immersed in the lamellae and their uncharged tails<br />
pointed into the gas stream. As the film drains, the charged groups,<br />
which repel each other, tend to be moved more closely together. The<br />
repulsive force between like charges hinders drainage and stabilizes<br />
the film. Addition of a salt or an electrolyte to the foam screens the<br />
repulsive effect, permits additional drainage, and can reduce foam<br />
stability.<br />
Foam Prevention Chemical prevention of foam differs from<br />
defoaming only in that compounds or mixtures are added to a stream<br />
prior to processing to prevent the formation of foam either during<br />
processing or during customer use. Such additives, sometimes distinguished<br />
as antifoam agents, are usually in the same chemical class of<br />
materials as defoamers. However, they are usually specifically formulated<br />
for the application. Typical examples of products formulated<br />
with antifoam agents are laundry detergents (to control excess foaming),<br />
automotive antifreeze, instant coffee, and jet-aircraft fuel. Foaming<br />
in some chemical processes such as distillation or evaporation may<br />
be due to trace impurities such as surface-active agents. An alternative<br />
to antifoam agents is their removal before processing such as by treatment<br />
with activated carbon [Pool, Chem. Process., 21(9), 56 (1958)].<br />
Automatic Foam Control In processing materials when foam<br />
can accumulate, it is often desirable to measure the height of the<br />
foam layer continuously and to dispense defoamer automatically as<br />
required to control the foam. Other corrective action can also be<br />
taken automatically. Methods of sensing the foam level have included<br />
electrodes in which the electrical circuit is completed when the foam<br />
touches the electrode [Nelson, Ind. Eng. Chem., 48, 2183 (1956); and<br />
Browne, U.S. Patent 2,981,693, 1961], floats designed to rise in a foam<br />
layer (Carter, U.S. Patent 3,154,577, 1964), and change in power input<br />
required to turn a foam-breaking impeller as the foam level rises<br />
(Yamashita, U.S. Patent 3,317,435, 1967). Timers to control the duration<br />
of defoamer addition have also been used. Browne has suggested<br />
automatic addition of defoamer through a porous wick when the foam<br />
level reaches the level of the wick. Foam control has also been discussed<br />
by Kroll [Ind. Eng. Chem., 48, 2190 (1956)].