Unit 2 Statistics Booklet - Newbattle Community High School
Unit 2 Statistics Booklet - Newbattle Community High School
Unit 2 Statistics Booklet - Newbattle Community High School

You also want an ePaper? Increase the reach of your titles
YUMPU automatically turns print PDFs into web optimized ePapers that Google loves.
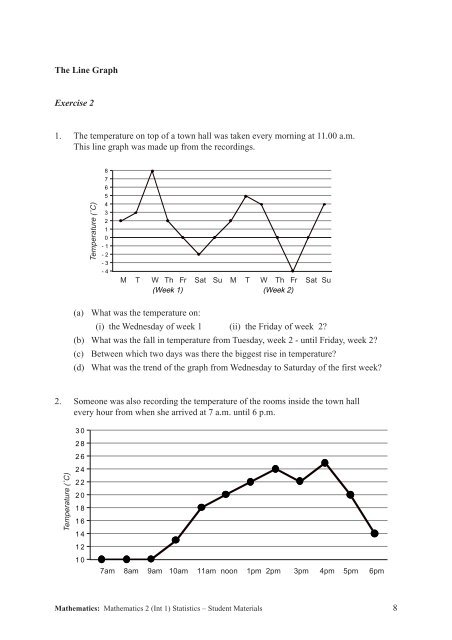
The Line GraphExercise 21. The temperature on top of a town hall was taken every morning at 11.00 a.m.This line graph was made up from the recordings.Temperature (˚C)876543210-1-2-3-4M T W Th Fr Sat Su M T W Th Fr Sat Su(Week 1) (Week 2)(a) What was the temperature on:(i) the Wednesday of week 1 (ii) the Friday of week 2?(b) What was the fall in temperature from Tuesday, week 2 - until Friday, week 2?(c) Between which two days was there the biggest rise in temperature?(d) What was the trend of the graph from Wednesday to Saturday of the first week?2. Someone was also recording the temperature of the rooms inside the town hallevery hour from when she arrived at 7 a.m. until 6 p.m.302826Temperature (˚C)24222018161412107am 8am 9am 10am 11am noon 1pm 2pm 3pm 4pm 5pm 6pmMathematics: Mathematics 2 (Int 1) <strong>Statistics</strong> – Student Materials 8