The State of Health in New Mexico 2011 - New Mexico Department ...
The State of Health in New Mexico 2011 - New Mexico Department ...
The State of Health in New Mexico 2011 - New Mexico Department ...

Create successful ePaper yourself
Turn your PDF publications into a flip-book with our unique Google optimized e-Paper software.
allengesmean opportunities for further reductions<strong>of</strong> disease burden.TobaccoTobacco use is the lead<strong>in</strong>g preventablecause <strong>of</strong> death <strong>in</strong> the United <strong>State</strong>s and<strong>New</strong> <strong>Mexico</strong>. Tobacco use kills anestimated 440,000 people per year <strong>in</strong> theU.S and about 2,100 people per year <strong>in</strong>NM. Fortunately, the adult smok<strong>in</strong>g rateshave dropped from 24% <strong>in</strong> 2001 to 18% <strong>in</strong>2009. Of concern is the fact that currently24% <strong>of</strong> high school youth <strong>in</strong> NM smokecompared to 20% nationally. Should theseyouth cont<strong>in</strong>ue smok<strong>in</strong>g <strong>in</strong>to adulthood,our statewide adult rates will <strong>in</strong>crease. <strong>New</strong>Mexicans are protected by stronglegislation, the Dee Johnson Clean IndoorAir Act. Cont<strong>in</strong>ued efforts to prevent youthfrom <strong>in</strong>itiat<strong>in</strong>g smok<strong>in</strong>g behaviors will beimportant <strong>in</strong> the future.DWI/Motor Vehicle Injury andMortalityMotor vehicle mortality rates for <strong>New</strong><strong>Mexico</strong> have dropped dramatically over thelast several decades. Alcohol-impairedmotor vehicle crash death rates have alsodropped dramatically dur<strong>in</strong>g this time.Despite these reductions, <strong>in</strong>juries anddeaths from motor vehicle crashes rema<strong>in</strong>a burden <strong>in</strong> <strong>New</strong> <strong>Mexico</strong>. Motor vehiclecrashes are the lead<strong>in</strong>g preventable cause<strong>of</strong> death <strong>in</strong> young people. Graduateddrivers’ licenses have been an effective toolfor reduc<strong>in</strong>g motor vehicle crashes amongyouth. Numerous efforts have beenimplemented to reduce driv<strong>in</strong>g while<strong>in</strong>toxicated (DWI) <strong>in</strong> recent years. Acomprehensive DWI prevention program<strong>in</strong>volv<strong>in</strong>g enhanced DWI and liquor controllaw enforcement and related media activity,has contributed to a 40% reduction <strong>in</strong> thealcohol-impaired motor vehicle trafficcrash fatality rate from 2004 to 2008. <strong>New</strong><strong>Mexico</strong> has also done a remarkable jobimprov<strong>in</strong>g seat belt use. Safer cars,improved road design and construction,and cont<strong>in</strong>uous enforcement <strong>of</strong> laws andprosecution <strong>of</strong> <strong>of</strong>fenders may lead tochang<strong>in</strong>g social norms and furtherreductions <strong>in</strong> motor vehicle crash <strong>in</strong>juriesand deaths.Violence—Homicide andSuicide<strong>The</strong> World <strong>Health</strong> Organization def<strong>in</strong>esviolence as the <strong>in</strong>tentional use <strong>of</strong> force orpower, threatened or actual, aga<strong>in</strong>st oneselfor another person, group, or community.Intentional, most <strong>of</strong>ten violent, <strong>in</strong>juriesconsist primarily <strong>of</strong> suicides, assaults, andhomicides. <strong>New</strong> <strong>Mexico</strong> had the secondhighest violence-related <strong>in</strong>jury death rateamong states nationally <strong>in</strong> 2007—66%higher than the rate for the U.S. <strong>The</strong> causesand prevention <strong>of</strong> violence are complex andrequire <strong>in</strong>tervention at multiple levels.Ag<strong>in</strong>g Related Disease andInjury—Alzheimer’s Disease,Falls <strong>in</strong> the Elderly, SuicideWith the ag<strong>in</strong>g <strong>of</strong> the population as timegoes along, we would anticipate morehealth issues seen <strong>in</strong> older populations.Three areas where we know we alreadyhave <strong>in</strong>creas<strong>in</strong>g rates are Alzheimer’sdisease, falls <strong>in</strong> the elderly, and suicideamong the elderly. <strong>New</strong> <strong>Mexico</strong> has seendramatic <strong>in</strong>creases <strong>in</strong> rates <strong>of</strong> Alzheimer’sdisease similar to those seen nationally.Un<strong>in</strong>tentional fall deaths among the elderlyhave also <strong>in</strong>creased dramatically. Suiciderates <strong>in</strong>crease with age and are very highamong those 65 years <strong>of</strong> age and older,because older adults are more likely to besuffer<strong>in</strong>g from physical illnesses and to bedivorced or widowed.Access to <strong>Health</strong>care <strong>in</strong> aChang<strong>in</strong>g <strong>Health</strong>care DeliveryEnvironmentWith recent federal legislation to extendhealthcare coverage to most Americans,the impact on public health rema<strong>in</strong>suncerta<strong>in</strong>. Greater access to healthcareshould mean improved medical care forthose who did not have access previously,however, this legislation will not affectunderly<strong>in</strong>g socioeconomic, community andpopulation dynamics that drive mostconditions and diseases <strong>of</strong> public healthimportance. With the economic downturn,it is likely that the need for public health<strong>in</strong>terventions will <strong>in</strong>crease <strong>in</strong>to theforeseeable future.What is Be<strong>in</strong>g Done <strong>State</strong>wide DWI preventionprograms have been effectiveand need to cont<strong>in</strong>ue. <strong>State</strong>wide tobacco controlefforts have been useful <strong>in</strong>reduc<strong>in</strong>g tobacco consumption. <strong>New</strong> efforts to reduce healthcareassociated <strong>in</strong>fections have beenimplemented <strong>in</strong> the state. Immunization efforts have beensuccessful <strong>in</strong> elim<strong>in</strong>at<strong>in</strong>g orreduc<strong>in</strong>g many preventable<strong>in</strong>fectious diseases.What Needs to Be Done A comprehensive effort toreverse the obesity andoverweight trend <strong>in</strong> <strong>New</strong> <strong>Mexico</strong>. An <strong>in</strong>-depth review <strong>of</strong> theeffectiveness <strong>of</strong> substanceabuse programs <strong>in</strong> the state. Development <strong>of</strong> acomprehensive food safetyprogram <strong>in</strong> <strong>New</strong> <strong>Mexico</strong>.Preface Review <strong>of</strong> systems and supportfor elderly persons <strong>in</strong> <strong>New</strong><strong>Mexico</strong>. Plann<strong>in</strong>g for how the<strong>Department</strong> <strong>of</strong> <strong>Health</strong> cansupport health statusimprovements <strong>in</strong> a chang<strong>in</strong>ghealthcare environment.Preface 5
ds are Largely Stable<strong>in</strong>clud<strong>in</strong>g prescription drug overdoses,contribute significantly to all <strong>of</strong> these<strong>in</strong>dicators except deaths from falls.However, prescription drug use may alsobe a factor <strong>in</strong> fall deaths occurr<strong>in</strong>g largelyamong older and elderly adults, s<strong>in</strong>cemany people <strong>in</strong> these age groups aretak<strong>in</strong>g multiple medications which could<strong>in</strong>teract <strong>in</strong> harmful ways.A number <strong>of</strong> worsen<strong>in</strong>g health trends areassociated with the ris<strong>in</strong>g obesity rates. Bothobesity and morbid obesity, typically 100pounds or more overweight, have markedly<strong>in</strong>creased with the morbid obesity rate(Figure 3) <strong>in</strong> NM doubl<strong>in</strong>g dur<strong>in</strong>g the lastdecade. <strong>The</strong> <strong>in</strong>creas<strong>in</strong>g prevalence <strong>of</strong> obesityis likely contribut<strong>in</strong>g to the worsen<strong>in</strong>gdiabetes prevalence rate and the worsen<strong>in</strong>garthritis hospitalization rate <strong>in</strong> NM.Several trends for <strong>in</strong>dicators that reflectthe quality and appropriateness <strong>of</strong> healthcare <strong>in</strong> NM are worsen<strong>in</strong>g. This analysisshowed that caesarean section rates are<strong>in</strong>creas<strong>in</strong>g, vag<strong>in</strong>al births after C-sectionare decreas<strong>in</strong>g, HIV screen<strong>in</strong>g rates aredecreas<strong>in</strong>g, and hospitalization rates foradverse effects <strong>of</strong> medical and surgicalcare are <strong>in</strong>creas<strong>in</strong>g. <strong>The</strong> fact that all <strong>of</strong>these rates <strong>in</strong> NM are worsen<strong>in</strong>g suggeststhat evidence-based medical practiceguidel<strong>in</strong>es need to be followed morerigorously, and additional systems, such assurveillance <strong>of</strong> healthcare-associated<strong>in</strong>fections, need to be developed forassur<strong>in</strong>g appropriate care.<strong>The</strong> last cluster <strong>of</strong> worsen<strong>in</strong>g health trendsis associated at least partly with an ag<strong>in</strong>gpopulation. While these rates were ageadjustedsuch that the rate was <strong>in</strong>dexed toa standard US population age structure,some rates <strong>of</strong> older adult and elderlydisease and death are <strong>in</strong>creas<strong>in</strong>g. Rates forAlzheimer’s disease deaths, fall deaths,arthritis hospitalizations, and septicemiahospitalizations all are associated with anag<strong>in</strong>g population.Future <strong>Health</strong> TrendsAs mentioned earlier, most health trends didnot significantly change over the last decade.Perhaps some currently unchang<strong>in</strong>g healthtrends may improve dur<strong>in</strong>g the next decade.With healthcare reform and furtherreductions <strong>in</strong> the number <strong>of</strong> people withouthealth care coverage, healthcare sensitive<strong>in</strong>dicators such as prenatal care <strong>in</strong> the firsttrimester <strong>of</strong> pregnancy, asthmahospitalization, hypertension hospitalization,and diabetes hospitalization may improve. Inaddition to improved health care coveragerates, greater adherence to evidence-basedpractice guidel<strong>in</strong>es <strong>in</strong> <strong>New</strong> <strong>Mexico</strong>’shealthcare system will also be required forthese healthcare system sensitive <strong>in</strong>dicatorsto move <strong>in</strong> the right direction.Also on the wish list for the next decadewould be decreas<strong>in</strong>g obesity and problemdr<strong>in</strong>k<strong>in</strong>g trends <strong>in</strong> <strong>New</strong> <strong>Mexico</strong>. Throughaggressive target<strong>in</strong>g <strong>of</strong> these health riskbehaviors—similar to what has alreadyoccurred for smok<strong>in</strong>g—obesity andproblem dr<strong>in</strong>k<strong>in</strong>g rates should decrease.Successfully reduc<strong>in</strong>g these health riskbehaviors will have a positive snowballeffect on many related health outcometrends and significantly improve the healthstatus <strong>of</strong> <strong>New</strong> <strong>Mexico</strong>.<strong>The</strong> f<strong>in</strong>al item on the next decade healthwish list would be a reduction <strong>in</strong> the <strong>New</strong><strong>Mexico</strong> poverty rate. <strong>The</strong> poverty rate, andassociated <strong>in</strong>come <strong>in</strong>equality, has a greaterimpact on overall health status <strong>in</strong> <strong>New</strong><strong>Mexico</strong> than any other s<strong>in</strong>gle <strong>in</strong>dicator.<strong>Health</strong> TrendsSelected <strong>Health</strong> Trends <strong>in</strong><strong>New</strong> <strong>Mexico</strong> for Various Years1998–2009Improv<strong>in</strong>g TrendsTeen birthInfant mortalityOlder adult (65–84 years) mortalityHeart attack mortalityHeart disease hospitalizationCancer hospitalizationHepatitis A and BAdult health care coverageAdult smok<strong>in</strong>gAdult b<strong>in</strong>ge dr<strong>in</strong>k<strong>in</strong>gYouth smok<strong>in</strong>gYouth b<strong>in</strong>ge dr<strong>in</strong>k<strong>in</strong>gWorsen<strong>in</strong>g TrendsCaesarean sectionVag<strong>in</strong>al birth after Caesarean sectionYoung adult (25–34 years) mortalityUn<strong>in</strong>tentional <strong>in</strong>jury mortalityFalls mortalityPoison<strong>in</strong>g mortalityAlzheimer’s disease mortalitySuicide attempt hospitalizationAdverse effects <strong>of</strong> medical andsurgical care hospitalizationArthritis hospitalizationSepticemia hospitalizationAdult diagnosed diabetes prevalenceAdult obesity prevalenceAdult ever tested for HIVYouth obesityStable TrendsPrenatal care <strong>in</strong> first trimesterChild (1–14 years) mortalityTeen (15–24 years) mortalityAdult (35–64 years) mortalityElderly adult (85 years and older)mortalityMotor vehicle crash mortalitySuicideAlcohol-<strong>in</strong>duced mortalityHeart disease mortalityDiabetes mortalityInfluenza and pneumonia mortalityCancer mortalityDiabetes hospitalizationAsthma hospitalizationTuberculosis <strong>in</strong>fectionHIV new <strong>in</strong>fectionPertussis <strong>in</strong>fectionSalmonellosis <strong>in</strong>fectionAdult physical activityYouth sexual activity<strong>Health</strong> Trends 7
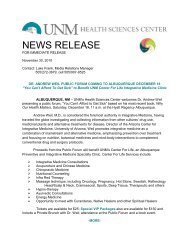
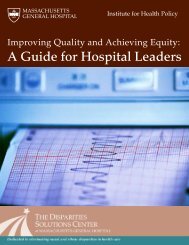
TableMothers’ Experience <strong>of</strong> Pregnancy andChildbear<strong>in</strong>g, NM, 2007–2009Race/EthnicityPregnancy wasun<strong>in</strong>tendedDid not getprenatal care asearly as wantedAbused dur<strong>in</strong>gpregnancyExperiencedpostpartumdepressionHispanicAmericanIndianWhite46.5% 48.8% 39.6%23.0% 26.5% 21.6%5.0% 8.7% 3.8%19.9% 24.6% 18.1%Source: NM Pregnancy Risk Assessment and Monitor<strong>in</strong>g System.African-American and Asian/Pacific Islander data not <strong>in</strong>cluded because<strong>of</strong> small numbers.Figure 1Births Among Teen Girls by RegionAge 15–17, NM, 1992–2007Births per 1,000 teen girls7060504030201001993–1995SouthwestSoutheastBernalillo CountyNortheastNorthwest1996–19981999–2001Source: NM Vital Records and <strong>Health</strong> Statistics2002–20042005–2007Figure 2Percent <strong>of</strong> Births with Low/No PrenatalCare by Mother’s Race/Ethnicity, NM, 2007Percent20161284011.1 17.4 7.9 11.9 11.5 7.5All RacesAfrican Hispanic WhiteAmericanAmericanIndian orAlaskan NativeAsian orPacificIslanderSource: NM Vital Records and <strong>Health</strong> Statistics<strong>Health</strong>y Mothers Make HAbout 30,000 babies are born every year <strong>in</strong><strong>New</strong> <strong>Mexico</strong>. Mothers whose pregnanciesare <strong>in</strong>tended, who enter prenatal care <strong>in</strong>the first trimester, and whose lives are freefrom domestic violence are better able togrow, deliver, and nurture healthy babies.Under ideal circumstances, babies are bornto mothers who do not use tobacco oralcohol, and who take nutritional supplementsconta<strong>in</strong><strong>in</strong>g folic acid before and dur<strong>in</strong>gpregnancy <strong>in</strong> order to prevent certa<strong>in</strong> birthdefects. Good mental health is essential.Racial/ethnic disparities affect mothers’experiences <strong>of</strong> pregnancy and childbear<strong>in</strong>g(Table). <strong>The</strong> <strong>New</strong> <strong>Mexico</strong> Pregnancy RiskAssessment Monitor<strong>in</strong>g System (PRAMS)asks each participat<strong>in</strong>g mother if herpregnancy was <strong>in</strong>tended or un<strong>in</strong>tended, ifshe was able to <strong>in</strong>itiate prenatal care asearly as she wanted to, if she wasphysically abused when she was pregnant,and if she experienced symptoms <strong>of</strong>postpartum depression.Teen Births<strong>The</strong> rate <strong>of</strong> births to 15–17 year old girls <strong>in</strong><strong>New</strong> <strong>Mexico</strong> decreased steadily from52.9/1,000 girls <strong>in</strong> 1992 to 32.9 <strong>in</strong> 2007. <strong>The</strong>northeastern region consistently had thelowest teen birth rates, while thesoutheastern region had the highest rates(Figure 1). Hispanic teens have the highestbirth rates both <strong>in</strong> <strong>New</strong> <strong>Mexico</strong> andnationally. Almost half <strong>of</strong> the population <strong>of</strong>females ages 15–17 years <strong>in</strong> <strong>New</strong> <strong>Mexico</strong> isHispanic, yet they account for 70% <strong>of</strong> thebirths to this age group.Prenatal CareIn 2007, 73% <strong>of</strong> live births were to motherswho <strong>in</strong>itiated prenatal care <strong>in</strong> the firsttrimester, up from 65.3% <strong>in</strong> 2000. Dur<strong>in</strong>gthat same year, 11.1% <strong>of</strong> live births were towomen who received either low or noprenatal care. American Indian mothershad the highest percent <strong>of</strong> births with lowor no prenatal care, followed by African-American mothers, Hispanic mothers, andWhite mothers. Asian or Pacific Islandermothers were least likely to have receivedlow or no prenatal care (Figure 2).Abuse<strong>The</strong> percent <strong>of</strong> mothers report<strong>in</strong>g that theywere physically abused dur<strong>in</strong>g pregnancydecl<strong>in</strong>ed steadily from 7.2% <strong>in</strong> 2003 to 4.4%<strong>in</strong> 2007. From 2003–2007, mothers with 12or fewer years <strong>of</strong> education were morethan twice as likely to report be<strong>in</strong>g abusedby their partners as those with 13 years ormore. American Indian mothers were mostlikely to have been abused (9.6%) followedby Hispanic mothers (5.7%) and Whitemothers (3.9%).Tobacco and Alcohol UseDur<strong>in</strong>g PregnancyAbsta<strong>in</strong><strong>in</strong>g from alcohol and tobacco isessential to a healthy pregnancy. Dur<strong>in</strong>g2001–2007, White mothers (13.5%) werealmost twice as likely to smoke dur<strong>in</strong>gtheir last three months <strong>of</strong> pregnancy ascompared to Hispanic mothers (7.4%) andmore than three times as likely asAmerican Indian mothers to do so (4.3%).White mothers were also more likely toconsume alcohol dur<strong>in</strong>g the last threemonths <strong>of</strong> pregnancy (7.2%) thanAmerican Indian (4.5%) and Hispanicmothers (3.9%).Maternal DepressionMaternal depression affected an estimated18% <strong>of</strong> <strong>New</strong> <strong>Mexico</strong> mothers <strong>in</strong> thepostpartum period dur<strong>in</strong>g 2006–2008.Women on public assistance (24.2%), whoexperience domestic violence (39.8%), whoare teens (26.2% among 15–17 year olds),or who are Native American (22.7%)experienced higher rates <strong>of</strong> postpartumdepression symptoms compared to all NMmothers.Infant MortalityFrom 2000 to 2009, the <strong>in</strong>fant mortalityrate for all <strong>of</strong> <strong>New</strong> <strong>Mexico</strong> was 5.9 <strong>in</strong>fantdeaths per 1,000 live births. <strong>The</strong> rate washighest for African American <strong>in</strong>fants at13.5/1,000, followed by American Indian<strong>in</strong>fants (7.6), Hispanic <strong>in</strong>fants (5.6), White<strong>in</strong>fants (5.3) and Asian <strong>in</strong>fants (2.1). Dur<strong>in</strong>gthat five year period, a total <strong>of</strong> 857 <strong>in</strong>fantsdied before the age <strong>of</strong> one year.8 NM <strong>State</strong> <strong>of</strong> <strong>Health</strong> <strong>2011</strong>
ealthy BabiesPrematurity andLow Birth WeightFrom 2006–2008, 5,341 low birth weightbabies (
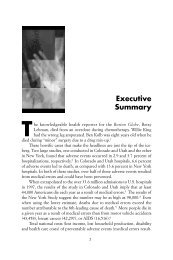
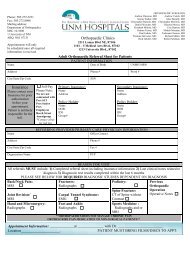
Figure 1Death Rates <strong>of</strong> Children Ages 1–14 byRace and Ethnicity, NM, 2000–2009Rate per 100,000 population4030201037.2 23.2 24.4 19.40American African- Hispanic WhiteIndian Americanor AlaskanNativeSource: NM Vital Records and <strong>Health</strong> Statistics. Asian/Pacific Islanderdata not <strong>in</strong>cluded because <strong>of</strong> small numbers.Figure 2Hospitalization Rates <strong>of</strong> ChildrenAges 1–14 by Race and EthnicityNM, 2000–2009Rate per 10,000 population1401301<strong>2011</strong>01009080706050403020100Endocr<strong>in</strong>eMetabolicImmuneMentalTableImpact <strong>of</strong> Children with Special <strong>Health</strong> CareNeeds on their Family, NM, 2005–2006Child’s Special NeedsImpact on FamilyRespiratoryPercentNorthwestNortheastBernalillo CountySoutheastSouthwestDigestive Injury &Poison<strong>in</strong>gSource: Hospital Inpatient Discharge Database, NM <strong>Health</strong> PolicyCommission. HIDD does not <strong>in</strong>clude data from Indian <strong>Health</strong> Service(IHS) facilities, which account for a large proportion <strong>of</strong> hospitalizationsfor NM’s American Indian population.EstimatedNumber <strong>of</strong>FamiliesFamilies pay $1,000 ormore out-<strong>of</strong>-pocket per 19.9 11,737year for careChild’s conditions causefamily f<strong>in</strong>ancial problems 20.4 12,053Families spend 11 ormore hours per week 13.0 7,671provid<strong>in</strong>g health careChild’s condition(s) causefamily members to cutback or stop work<strong>in</strong>g25.1 14,807Source: National Survey <strong>of</strong> Children with Special <strong>Health</strong> Care Needshttp://cshcndata.org/NM Makes Progress ImprIn 2009, there were 387,339 children ages1–14 years <strong>in</strong> <strong>New</strong> <strong>Mexico</strong>—18.4% <strong>of</strong> thetotal population. Results from the 2007National Survey <strong>of</strong> Children’s <strong>Health</strong>showed that 84.4% <strong>of</strong> <strong>New</strong> <strong>Mexico</strong>’schildren were <strong>in</strong> excellent or very goodhealth. Approximately 24% <strong>of</strong> <strong>New</strong> <strong>Mexico</strong>children live <strong>in</strong> poverty, and from2006–2008, 8.6% lived <strong>in</strong> families where noparent had full-time employment, whichwas down from 10.0% <strong>in</strong> 2005–2007. Closeto 33% <strong>of</strong> children are overweight or obese,and 14% <strong>of</strong> children ages 1–5 years engage<strong>in</strong> four or more hours <strong>of</strong> “screen time”every weekday, <strong>in</strong>clud<strong>in</strong>g TV and videos.In 2008, it was estimated that 12.8% <strong>of</strong> <strong>New</strong><strong>Mexico</strong> children did not have health<strong>in</strong>surance.Child DeathsFrom 2005–2009, there were 457 deaths to<strong>New</strong> <strong>Mexico</strong> children ages 1–14 years.Compared to Hispanic and Whitechildren, American Indian children hadthe highest death rate dur<strong>in</strong>g those years(Figure 1).<strong>The</strong> lead<strong>in</strong>g cause <strong>of</strong> death for allchildren <strong>in</strong> <strong>New</strong> <strong>Mexico</strong> wasun<strong>in</strong>tentional <strong>in</strong>jury, which accounted for174 deaths dur<strong>in</strong>g the five year period.Motor vehicle crash deaths, where thechild was either an occupant orpedestrian, were the lead<strong>in</strong>g cause <strong>of</strong>child un<strong>in</strong>tentional <strong>in</strong>jury death, followedby drown<strong>in</strong>g and fires.For younger children ages 1–4 years, thesecond and third lead<strong>in</strong>g causes <strong>of</strong> childdeaths were birth defects and homicide.<strong>The</strong> rates for birth defects dur<strong>in</strong>g theperiods 2000–2004 and 2005–2009 were2.5/100,000 and 2.6/100,000, respectively.Homicide rates for those same periodsdropped from 2.5 to 1.5/100,000. Forolder children ages 5–14 years, cancerand suicide were the second and thirdlead<strong>in</strong>g causes <strong>of</strong> death. From 2001–2009,the number <strong>of</strong> deaths <strong>of</strong> children fromcancer ranged from 3 (2005 and 2009) to11 (2004 and 2008). <strong>The</strong> number <strong>of</strong> <strong>New</strong><strong>Mexico</strong> children that committed suicideranged from 3 (2002 and 2006) to 10(2003).Childhood IllnessIn 2008, the vast majority <strong>of</strong> hospitaldischarge diagnoses for all children werefor respiratory disease (Figure 2). From2004–2008, children ages 1–4 years werehospitalized for respiratory disease at arate <strong>of</strong> 169/10,000, and those ages 5–14years at a rate <strong>of</strong> 30/10,000. In 2008, therewere 2,477 hospitalizations for respiratorydisease among children ages 1–14 years.For younger children, the next lead<strong>in</strong>gdiagnoses were <strong>in</strong>jury and poison<strong>in</strong>g (256hospitalizations) and endocr<strong>in</strong>e/nutritional& metabolic diseases/immunity disorders(265 hospitalizations.) For older children,mental disorders (976 hospitalizations) anddiseases <strong>of</strong> the digestive system (831hospitalizations) were the second and thirdlead<strong>in</strong>g diagnoses.Children with Special<strong>Health</strong> Care NeedsIn 2005–2006, the second national survey<strong>of</strong> Children with Special <strong>Health</strong> CareNeeds (CSHCN) estimated that 59,535(12.1%) <strong>of</strong> <strong>New</strong> <strong>Mexico</strong> children hadspecial health care needs, compared to13.9% nationally. N<strong>in</strong>e percent wereAmerican Indian, 10.7% were Hispanic, and15.2% were White. <strong>The</strong> most commondiagnosis for CSHCN <strong>in</strong> <strong>New</strong> <strong>Mexico</strong> isasthma. Fewer <strong>New</strong> <strong>Mexico</strong> special needschildren lived <strong>in</strong> poverty compared tonationally. About 5% <strong>of</strong> special needschildren did not have health <strong>in</strong>surance atthe time <strong>of</strong> the survey, and 36% had<strong>in</strong>surance that was <strong>in</strong>adequate. <strong>New</strong><strong>Mexico</strong> compares favorably with the nation<strong>in</strong> the percentage <strong>of</strong> CSHCN who arescreened early and cont<strong>in</strong>uously for specialhealth care needs at 64%.<strong>The</strong> health <strong>of</strong> <strong>New</strong> <strong>Mexico</strong>’s special needschildren improved <strong>in</strong> many areas from2001. Fewer families reported that theirchild’s condition affected their activities agreat deal, and the percent <strong>of</strong> CSHCNwithout health <strong>in</strong>surance at the time <strong>of</strong> thesurvey dropped from 8.9% <strong>in</strong> 2001 to 5.5% <strong>in</strong>2005–2006. <strong>The</strong> percent <strong>of</strong> children withouta usual source <strong>of</strong> care, or who relied on theemergency room for care, dropped from8.0% to 4.9%. Fewer families reported that10 NM <strong>State</strong> <strong>of</strong> <strong>Health</strong> <strong>2011</strong>
ov<strong>in</strong>g Children’s <strong>Health</strong>their child’s condition caused their familyf<strong>in</strong>ancial problems (Table), however thepercent <strong>of</strong> CSHCN whose families had topay $1,000 or more out-<strong>of</strong>-pocket for theirchild’s care more than doubled from 9% to20% between the two survey periods.Prevent<strong>in</strong>g Childhood InjuriesMost un<strong>in</strong>tentional <strong>in</strong>juries are preventable,and <strong>New</strong> <strong>Mexico</strong> has passed legislation thatprotects children, such as the child boosterseat law <strong>in</strong> 2005 and the 2007 child helmetlaw. In 2005, <strong>New</strong> <strong>Mexico</strong> began requir<strong>in</strong>gignition <strong>in</strong>terlock devices for all convicteddrunk drivers. <strong>The</strong> <strong>New</strong> <strong>Mexico</strong> SAFEKIDS state coalition, established <strong>in</strong> 1991now manages a network <strong>of</strong> 12 coalitionsand chapters statewide, with localsponsorship or active membership by theentire network <strong>of</strong> n<strong>in</strong>e trauma centers.Suicide and HomicideFamily, community, and school violencecontribute to child suicide and homicide.<strong>New</strong> <strong>Mexico</strong> Voices for Children works onyouth violence prevention through itsyouth leadership and policy developmentprogram. School districts <strong>in</strong> <strong>New</strong> <strong>Mexico</strong>develop and implement comprehensiveSafe School Plans that <strong>in</strong>clude violenceprevention activities such as mentor<strong>in</strong>g,mediation, and anti-bully<strong>in</strong>g programs andpolicies. <strong>The</strong> <strong>New</strong> <strong>Mexico</strong> Suicide CrisisL<strong>in</strong>e Network provides 24/7 toll-freecoverage, and the <strong>New</strong> <strong>Mexico</strong> Behavioral<strong>Health</strong> Collaborative works to address themental health needs <strong>of</strong> all <strong>New</strong> Mexicans.<strong>The</strong>re is greater awareness <strong>of</strong> positiveyouth development approach pr<strong>in</strong>ciplesand more people want practical steps onhow to implement and <strong>in</strong>corporate themwith<strong>in</strong> their work and daily lives. Best andpromis<strong>in</strong>g practices po<strong>in</strong>t toward youthengagement and youth-led projects forpositive youth development, but fund<strong>in</strong>gfor these types <strong>of</strong> activities is limited.community about reasons for and solutionsto the asthma problem. Regional differences<strong>in</strong> need, asthma triggers, resources, asthmaactivities, and access to care andtra<strong>in</strong><strong>in</strong>g/education were discovered. This<strong>in</strong>formation helped to tailor <strong>in</strong>terventionsthat could have the greatest chance <strong>of</strong>success <strong>in</strong> a given area. One importantpurpose <strong>of</strong> the asthma summits was tomobilize communities to be a crucial part<strong>of</strong> the solution to the problems they face.As a result <strong>of</strong> the statewide asthma summitsthere has been an <strong>in</strong>crease <strong>in</strong> the use <strong>of</strong>asthma action plans for children seen <strong>in</strong>asthma cl<strong>in</strong>ics, lead<strong>in</strong>g to improvedcollaboration between pediatric pulmonaryspecialists, school health nurses, primarycare practitioners, and families; extensivecommunity asthma education tra<strong>in</strong><strong>in</strong>gprovided by Project ECHO and AsthmaAllies; targeted outreach to thenorthwestern and southeastern parts <strong>of</strong> thestate where asthma rates are highest; andthe establishment <strong>of</strong> the Asthma Council, aprivate public partnership to addresspediatric asthma.<strong>The</strong> health <strong>of</strong> <strong>New</strong> <strong>Mexico</strong>’s children isdeterm<strong>in</strong>ed by a complex <strong>in</strong>teraction <strong>of</strong>physical, social, emotional, economic,educational, and environmental factors.<strong>New</strong> <strong>Mexico</strong> cont<strong>in</strong>ues to work to ensurethat children are fed, housed, educated,safe, and cared for with<strong>in</strong> healthy families.Because no s<strong>in</strong>gle agency orprogram can address every factorthat affects child health,improvement depends oncont<strong>in</strong>ued successful collaborationamong families, healthpr<strong>of</strong>essionals, educators, andadvocates from thegovernment andprivate sector.<strong>Health</strong>y ChildrenWhat is Be<strong>in</strong>g Done Early Childhood Action Network(ECAN) is a large network <strong>of</strong>early childhood advocatesthroughout the state who workon and promote early childissues. Family Leadership ActionNetwork (FLAN) is an <strong>in</strong>itiativedesigned to promote parent<strong>in</strong>volvement and build familyleadership <strong>in</strong> shap<strong>in</strong>g thesystem that impacts their livesand their children’s future. Children’s Medical Services workswith the UNM Center forDevelopment and Disability’sLEND Program to tra<strong>in</strong> futureleaders <strong>in</strong> health policy andprograms by enhanc<strong>in</strong>g educationabout children and youth withspecial health care needs.What Needs to Be Done Increase the number <strong>of</strong> childrencovered by <strong>New</strong> MexiKids(Children’s Medicaid and <strong>State</strong>Children’s <strong>Health</strong> InsuranceProgram). Promote Early PeriodicScreen<strong>in</strong>g, Diagnostic, andTreatment (EPSDT) services forall children. Increase coord<strong>in</strong>ated, familycentered,community-based carefor children and families. Encourage health care providersto practice <strong>in</strong> underserved areas<strong>of</strong> <strong>New</strong> <strong>Mexico</strong>. Support healthy food choices andphysical activity for children.Respiratory Disease<strong>New</strong> <strong>Mexico</strong> <strong>in</strong>itiated a series <strong>of</strong> sixpediatric asthma summits <strong>in</strong> five locationsaround the state, to seek <strong>in</strong>put from the<strong>Health</strong>y Children 11
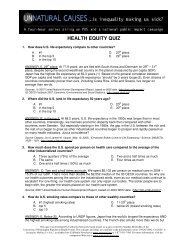
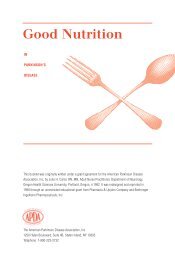
Figure 1Past 30-Day Drug Use Among YouthGrades 9–12, NM, 2009100<strong>Health</strong>y Youth Become HPercentPercent806040205.6 3.928.0 14.3 8.0 7.73.20Marijuana Pa<strong>in</strong> Ecstasy Inhalants Coca<strong>in</strong>e Meth-Hero<strong>in</strong>Killer toamphet-Get Higham<strong>in</strong>eSource: NM Youth Risk and Resiliency SurveyFigure 2Current Alcohol Use Among YouthGrades 6–12, NM, 200910080604020Middle SchoolHigh School10.2 14.7 23.6 33.1 41.2 44.0 45.406th 7th 8th 9th 10th 11th 12thSource: NM Youth Risk and Resiliency SurveyFigure 3Obesity Among Youth, Grades 9–12NM, 2001–2009Percent10080604020010.228.013.52001 2003 2005 2007 2009Source: NM Youth Risk and Resiliency Survey<strong>The</strong> behaviors <strong>of</strong> <strong>New</strong> <strong>Mexico</strong> youth have agreat impact on their health as youngpeople and later as adults. Risk behaviors<strong>in</strong>itiated dur<strong>in</strong>g adolescence are closelyassociated with disease, disability, anddeath among youth and older people.From 2007 to 2009, the three lead<strong>in</strong>gcauses <strong>of</strong> death among <strong>New</strong> <strong>Mexico</strong>adolescents ages 13–19 years were<strong>in</strong>juries—predom<strong>in</strong>antly motor vehiclecrashes, suicide, and homicide. 1 <strong>The</strong>secauses <strong>of</strong> death are associated withalcohol use, drug use, suicidal ideationand attempts, physical violence, and otherbehaviors. <strong>The</strong> chronic diseases that areamong the lead<strong>in</strong>g causes <strong>of</strong> death forolder <strong>New</strong> Mexicans, <strong>in</strong>clud<strong>in</strong>g heartdisease, cancer, respiratory disease,stroke, and diabetes, are associated withrisk behaviors that are <strong>of</strong>ten <strong>in</strong>itiateddur<strong>in</strong>g adolescence. <strong>The</strong>se behaviors<strong>in</strong>clude tobacco use, alcohol use,<strong>in</strong>adequate physical activity and poornutritional practices. Unsafe sexualbehaviors put young people at risk <strong>of</strong>unplanned pregnancy and sexuallytransmitted <strong>in</strong>fections <strong>in</strong>clud<strong>in</strong>gHIV/AIDS. All <strong>of</strong> these behaviors wereexam<strong>in</strong>ed among high school and middleschool students with the 2009 <strong>New</strong><strong>Mexico</strong> Youth Risk and Resiliency Survey(YRRS).Alcohol, Tobacco, andOther Drug UseAlcohol use at an early age is associatedwith adverse outcomes later <strong>in</strong> life, such asalcohol dependence and abuse and chronicliver disease. 2 Alcohol use is also highlyassociated with traffic-related fatalities andother <strong>in</strong>juries. Most alcohol relatedbehaviors have decreased <strong>in</strong> prevalence <strong>in</strong>recent years among <strong>New</strong> <strong>Mexico</strong> highschool students. Current dr<strong>in</strong>k<strong>in</strong>g (at leastone dr<strong>in</strong>k <strong>in</strong> the past 30 days) decreasedfrom 50.7% <strong>in</strong> 2003 to 40.5% <strong>in</strong> 2009. Overthe same years, b<strong>in</strong>ge dr<strong>in</strong>k<strong>in</strong>g decreasedfrom 35.4% to 25.0%, and dr<strong>in</strong>k<strong>in</strong>g anddriv<strong>in</strong>g decreased from 19.1% to 9.7%.Compared to the U.S., NM high schoolstudents had a very high rate <strong>of</strong> alcoholuse before the age <strong>of</strong> 13 years (NM 29.4%;U.S. 21.1%).Illicit drug use among adolescents isassociated with heavy alcohol and tobaccouse, 3 violence, and suicide. Drug useamong adolescents <strong>in</strong> NM rema<strong>in</strong>ed high<strong>in</strong> 2009 (Figure 1), although someimportant measures <strong>of</strong> drug use havedecreased <strong>in</strong> recent years. Among highschool students from 2003 to 2009, past30-day use <strong>of</strong> methamphetam<strong>in</strong>e andcoca<strong>in</strong>e both decreased(methamphetam<strong>in</strong>e from 7.3% to 3.9%;coca<strong>in</strong>e from 8.9% to 5.6%). 14.3% <strong>of</strong> highschool students used pa<strong>in</strong>killers to gethigh, a very risky behavior because <strong>of</strong>opiates present <strong>in</strong> these prescriptionmedications. <strong>New</strong> <strong>Mexico</strong> high schoolstudents had a higher rate than the rest <strong>of</strong>the U.S. for use <strong>of</strong> coca<strong>in</strong>e, hero<strong>in</strong>,methamphetam<strong>in</strong>e, ecstasy and <strong>in</strong>jection <strong>of</strong>illegal drugs. Among middle schoolstudents, 15.1% ever used marijuana, 14.2%ever used <strong>in</strong>halants, and 5.7% ever usedcoca<strong>in</strong>e.Cigarette smok<strong>in</strong>g <strong>in</strong>creases the risk <strong>of</strong>several chronic diseases, such as heartdisease, chronic obstructive pulmonarydisease, acute respiratory illness, stroke,and various cancers. 4 Spit tobacco, orsmokeless tobacco, is associated with oralcancer and other oral conditions, heartdisease, and stroke. In 2009, 24.0% <strong>of</strong> highschool students and 6.8% <strong>of</strong> middle schoolstudents were current smokers, def<strong>in</strong>ed ashav<strong>in</strong>g smoked cigarettes <strong>in</strong> the past 30days. While several measures <strong>of</strong> cigarettesmok<strong>in</strong>g have decreased <strong>in</strong> recent years,use <strong>of</strong> spit tobacco has <strong>in</strong>creased.For most measures, alcohol, tobacco anddrug use <strong>in</strong>creased dramatically by agegroup over grades 6–8, and <strong>in</strong>creasedmuch less markedly from grades 9–12(Figure 2).Mental <strong>Health</strong><strong>The</strong> past 12 month suicide attempt rate <strong>in</strong>2009 was 9.7% among high school students.While this was substantially lower than the2007 rate (14.3%), it was higher than theU.S. rate (6.3%). Suicidal ideation andpersistent feel<strong>in</strong>gs <strong>of</strong> sadness orhopelessness were more common amonggirls than boys. Among middle school12 NM <strong>State</strong> <strong>of</strong> <strong>Health</strong> <strong>2011</strong>
althy Adultsstudents, 6.8% ever tried to kill themselves.As with high school students, suicidalideation was more common among girlsthan boys.Sexual BehaviorsAdolescents who <strong>in</strong>itiate sexual <strong>in</strong>tercourseat an early age are less likely to usecontraception, are at higher risk forunplanned pregnancy, and are likely tohave a greater number <strong>of</strong> lifetime sexualpartners than those who wait until later toengage <strong>in</strong> sex. 5 In 2009, 48.0% <strong>of</strong> highschool students and 10.8% <strong>of</strong> middle schoolstudents ever had sexual <strong>in</strong>tercourse.Among middle school students, ever hav<strong>in</strong>gsexual <strong>in</strong>tercourse was more commonamong boys than girls (14.0% vs. 7.8%), butthere was no statistical difference betweenthe rates for boys and girls <strong>in</strong> high school.Middle school students had higher rates <strong>of</strong>condom use than high school students.Only 5.5% <strong>of</strong> sexually active high schoolstudents used both a condom and a highlyeffective form <strong>of</strong> birth control, such asbirth control pills or <strong>in</strong>jectable birth controllike Depo-Provera.ViolencePhysical fight<strong>in</strong>g was more commonamong <strong>New</strong> <strong>Mexico</strong> high school studentsthan U.S. students (37.3% vs. 31.5%).Among middle school students, half(50.4%) had ever been <strong>in</strong> a physical fight.Fight<strong>in</strong>g was more common among boysthan girls <strong>in</strong> both high school and middleschool. Teen dat<strong>in</strong>g violence <strong>in</strong> the last 12months decreased among high schoolstudents from 12.6% <strong>in</strong> 2007 to 9.8% <strong>in</strong> 2009.Be<strong>in</strong>g bullied on school property wasreported by 19.5% <strong>of</strong> high school studentsand 31.2% <strong>of</strong> middle school students.Body Weight, Nutrition, andPhysical ActivityObesity <strong>in</strong> adolescents is associated withdiseases such as type 2 diabetes andhypertension, negative psychological andsocial consequences, 6 and an <strong>in</strong>creasedrisk <strong>of</strong> adult obesity. Obesity among <strong>New</strong><strong>Mexico</strong> high school students has been<strong>in</strong>creas<strong>in</strong>g <strong>in</strong> recent years. In 2009, 13.5% <strong>of</strong><strong>New</strong> <strong>Mexico</strong> high school students wereobese, up from 10.2% <strong>in</strong> 2003 (Figure 3).An additional 14.6% were overweight, for atotal <strong>of</strong> 28.1% whose body weight wasabove the normal range. Boys were morethan two times as likely as girls to be obese(18.3% vs. 8.5%).Poor nutrition is associated with obesity,overweight, and other chronicconditions. 7,8 A diet high <strong>in</strong> fruits andvegetables may lead to a decreased risk <strong>of</strong>be<strong>in</strong>g obese or overweight, whileconsumption by children <strong>of</strong> sugarsweetened beverages is a risk factor foroverweight and obesity. In 2009, only 20.9%<strong>of</strong> high school students ate five or moreserv<strong>in</strong>gs <strong>of</strong> fruits or vegetables per day,and 30.4% drank at least one soda per day.Regular physical activity can reduce bodyfat, ma<strong>in</strong>ta<strong>in</strong> body weight, and reduce therisk <strong>of</strong> chronic diseases. 9 At least 60m<strong>in</strong>utes <strong>of</strong> daily physical activity isrecommended for children aged 6–17years. 23.4% <strong>of</strong> high school students and30.2% <strong>of</strong> middle school students achievedthis level <strong>of</strong> physical activity. In both highschool and middle school, boys were morelikely than girls to atta<strong>in</strong> recommendedlevels <strong>of</strong> physical activity (HS 29.4% vs.17.5%; MS 35.9% vs. 24.6%). About one-third<strong>of</strong> students <strong>in</strong> both middle school (33.2%)and high school (32.6%) watched televisionfor 3 or more hours per day on a typicalschool day.In recent years, <strong>New</strong> <strong>Mexico</strong> has seenimprov<strong>in</strong>g trends <strong>in</strong> rates <strong>of</strong> youth alcohol,tobacco, and drug use, and an <strong>in</strong>crease <strong>in</strong>the rate <strong>of</strong> youth obesity. Compared to therest <strong>of</strong> the United <strong>State</strong>s, <strong>New</strong> <strong>Mexico</strong>youth have high rates <strong>of</strong> suicide attemptsand ideation, behaviors associated withviolence, tobacco use, alcohol use, anddrug use. Many students <strong>in</strong>itiate riskbehaviors dur<strong>in</strong>g the middle school years.While prevention measures among highschool students should be ma<strong>in</strong>ta<strong>in</strong>ed, it isalso important to target prevention effortsamong younger students.<strong>Health</strong>y YouthWhat is Be<strong>in</strong>g Done Trends <strong>in</strong> youth health statisticsare be<strong>in</strong>g monitored with the NMYouth Risk and Resiliency Survey. Alcohol and drug preventionprograms at the local level. Seventy-n<strong>in</strong>e school basedhealth centers <strong>of</strong>fer services and<strong>in</strong>formation throughout thestate related to primary care,reproductive health, mentalhealth, and substance use. Suicide prevention programs. Peer-to-peer mentor<strong>in</strong>g.What Needs to Be Done Increase positive youthdevelopment and leadershipprograms, with mean<strong>in</strong>gfulengagement with youth todevelop, implement, andevaluate them. Increase and improve servicesavailable at school based healthcenters, <strong>in</strong>clud<strong>in</strong>g primary careand confidential health services,<strong>in</strong> areas such as reproductiveand behavioral health. Increase healthy nutrition andphysical activity <strong>in</strong>terventionstarget<strong>in</strong>g middle school agedyouth.<strong>Health</strong>y Youth 13
Figure 1Hospitalization Rates by Age andRace/Ethnicity, NM, 2009–2010Influenza SeasonRate per 100,000 populationFigure 2Pertussis Rates by Age, NM, 2007–2009Rate per 100,000 populationNumber <strong>of</strong> cases16014012010080604020153.0 51.0 37.8 47.5 46.1 106.1 35.8 45.8 60.2 32.200–4 5–24 25–49 50–64 65+ Amer. Asian/ African Hispanic WhiteIndian Pacific Amer.IslanderSource: Infectious Disease Epidemiology Bureau1101009080706050403020100Less than 1 Year1 to 4 Years5 to 9 Years10 to 19 Years20 Years and Older2007 2008 2009Source: NM Electronic Disease Surveillance SystemFigure 3HIV Diagnosis by Race/EthnicityNM, 2002–2009100908070605040302010020022003Age200420052006200720082009Hispanic African AmericanWhiteAsian/Pacific IslanderAmerican Indian/Alaskan NativeSource: Enhanced HIV/AIDS Report<strong>in</strong>g SystemRace/EthnicityOld Infections, <strong>New</strong> PrevInfluenzaInfluenza pandemics have been occurr<strong>in</strong>gfor at least 500 years, with the firstrecognized pandemic occurr<strong>in</strong>g <strong>in</strong> 1510throughout Africa and Europe. 1 Even beforedocumented <strong>in</strong>fluenza pandemics occurred,the term <strong>in</strong>fluenza was first used <strong>in</strong> Italy <strong>in</strong>1357. 2 Historical records reveal that<strong>in</strong>fluenza pandemics occur approximatelyevery 36 years, with the worst pandemicrecorded <strong>in</strong> history occurr<strong>in</strong>g <strong>in</strong> 1918. <strong>The</strong><strong>in</strong>fluenza virus itself was not isolated <strong>in</strong> alaboratory until the 1930s. 1<strong>The</strong> 2009–2010 pandemic <strong>in</strong>fluenza A(pH1N1) virus provided an opportunity tolearn more about pandemic <strong>in</strong>fluenza disease<strong>in</strong> <strong>New</strong> <strong>Mexico</strong>. Dur<strong>in</strong>g the 2009–2010pandemic <strong>in</strong> <strong>New</strong> <strong>Mexico</strong>, there were 1,056<strong>in</strong>fluenza hospitalizations identified fromApril 2009 to May 2010. Hospitalization rateswere highest among the 0–4 year age groupand lowest among the 25–49 year age group(Figure 1). Hospitalization rates were highestamong American Indians and lowest amongWhites. Hospitalization rates by geographicregion revealed that Bernalillo County hadthe lowest rate, and the southeastern regionhad the highest rate. Among hospitalized<strong>in</strong>dividuals, the most common medicalconditions were asthma and chronic lungdisease, chronic cardiovascular disease anddiabetes.In <strong>New</strong> <strong>Mexico</strong>, there were 58 <strong>in</strong>fluenzadeaths identified from April 2009 to May2010. Death rates were highest among the50–64 year age group and lowest amongthe 5–24 year age group. American Indianshad the highest death rate, while no deathswere identified among Asian/PacificIslanders or African-Americans. Deathrates by geographic region showed thatBernalillo County had the lowest rate andthe southeastern region had the highestrate. Among those who died, the mostcommon medical conditions were asthmaand chronic lung disease, chroniccardiovascular disease and diabetes.Prevention rema<strong>in</strong>s a key strategy formanag<strong>in</strong>g <strong>in</strong>fluenza. <strong>The</strong>re are 3 ma<strong>in</strong>recommended prevention strategies: 1) getthe <strong>in</strong>fluenza vacc<strong>in</strong>e every year, 2) stopthe spread <strong>of</strong> germs by wash<strong>in</strong>g yourhands, cover<strong>in</strong>g your cough/sneeze,avoid<strong>in</strong>g close contact with sick people,stay<strong>in</strong>g home if you are sick with <strong>in</strong>fluenzalikeillness until at least 24 hours after yourfever is gone, and 3) take <strong>in</strong>fluenza antiviraldrugs if your doctor prescribes them. 3PertussisPertussis or “whoop<strong>in</strong>g cough” is a highlycontagious respiratory illness caused bythe Bordetella pertussis bacteria which wasfirst isolated <strong>in</strong> 1906. However, outbreaks<strong>of</strong> the illness were first described as earlyas the 16th century. <strong>The</strong> World <strong>Health</strong>Organization estimated that 294,000children died from pertussis <strong>in</strong> 2002. S<strong>in</strong>cevacc<strong>in</strong>e-<strong>in</strong>duced immunity to Bordetellapertussis is <strong>of</strong> limited duration, generallyless than 12 years, most adults have littleor no residual immunity. Most reportedpertussis cases among adolescents andadults are thought to occur because <strong>of</strong> thisdecl<strong>in</strong>e <strong>in</strong> protective immunity. Young<strong>in</strong>fants who are too young to have beenfully vacc<strong>in</strong>ated are at high risk <strong>of</strong> severeand potentially life-threaten<strong>in</strong>g illness fromexposure to people with active disease.Whole cell pertussis vacc<strong>in</strong>e, comb<strong>in</strong>ed asdiphtheria, tetanus and pertussis or DTP,was <strong>in</strong>troduced <strong>in</strong> 1944. Cases <strong>of</strong> pertussiswere reduced by more than 90 percentfollow<strong>in</strong>g <strong>in</strong>troduction <strong>of</strong> DPT. However,pertussis disease rates have steadily<strong>in</strong>creased s<strong>in</strong>ce 1980. National epidemics <strong>of</strong>pertussis occur approximately every threeto four years. Improved acellular vacc<strong>in</strong>eswere licensed for the primary childhoodvacc<strong>in</strong>e series <strong>in</strong> 1996. In the U.S., threeacellular pediatric vacc<strong>in</strong>es (DTaP) hadbeen licensed until 2005 when adolescentand adult formulations (Tdap) were addedfor the first time. Tdap is recommended forchildren 11–18 years, adults 19–64 years,pregnant women, and healthcare workers.Pertussis is seen throughout <strong>New</strong> <strong>Mexico</strong>among <strong>in</strong>fants, children, adolescents andadults <strong>of</strong> all ages (Figure 2), as <strong>in</strong>dividualsporadic cases, family clusters andcommunity outbreaks. <strong>The</strong> last deathsreported due to pertussis <strong>in</strong> NM were <strong>in</strong>2004 and 2005 when four <strong>in</strong>fants died.14 NM <strong>State</strong> <strong>of</strong> <strong>Health</strong> <strong>2011</strong>
ention StrategiesIn 2008, the national Advisory Committeeon Immunization Practices (ACIP)published recommendations for theprevention <strong>of</strong> pertussis among pregnantand postpartum women and their <strong>in</strong>fants <strong>in</strong>order to help prevent such deaths. 4 <strong>The</strong>appropriate use <strong>of</strong> Tdap among women <strong>of</strong>childbear<strong>in</strong>g age who might becomepregnant and among postpartum women isstrongly recommended.In addition, parents can limit <strong>in</strong>fantexposures to persons who have respiratoryillness until they are determ<strong>in</strong>ed to benon<strong>in</strong>fectious. When pertussis exposureoccurs, antimicrobial medications canprevent illness among persons exposed topertussis thereby <strong>in</strong>terrupt<strong>in</strong>g transmission<strong>of</strong> disease. Parents should ensure that<strong>in</strong>fants beg<strong>in</strong> the pediatric DTaPvacc<strong>in</strong>ation series at the recommended age<strong>of</strong> 6–8 weeks for their protection and toreduce the severity <strong>of</strong> disease if it occurs. Itis known that adm<strong>in</strong>istration <strong>of</strong> two or threedoses <strong>of</strong> pediatric DTP or DTaP canprevent hospitalization for pertussis and itscomplications. In October 2010, ACIPrecommended fill<strong>in</strong>g gaps <strong>in</strong> pertussisvacc<strong>in</strong>ation to further protect babies withnew vacc<strong>in</strong>e recommendations for children7–10 years and adults greater than 64 years.Human ImmunodeficiencyVirus (HIV)In the spr<strong>in</strong>g <strong>of</strong> 1981, the Centers forDisease Control and Prevention Morbidityand Mortality Weekly Report <strong>in</strong>cluded thefirst report <strong>of</strong> gay men diagnosed with rarediseases. 5 With<strong>in</strong> months, other reports <strong>of</strong>rare conditions, and opportunistic<strong>in</strong>fections, occurr<strong>in</strong>g primarily among gaymen, were published. In 1982, reports <strong>of</strong>similar <strong>in</strong>fections among hemophiliacs and<strong>in</strong>jection drug users began to appear. <strong>The</strong>syndrome was named AcquiredImmunodeficiency Syndrome or AIDS. In1983, the virus responsible for AIDS wasidentified, and it came to be known as theHuman Immunodeficiency Virus or HIV.<strong>The</strong> number <strong>of</strong> diagnosed cases <strong>of</strong>HIV/AIDS and the number <strong>of</strong> deathsattributed to AIDS rose quickly <strong>in</strong> the United<strong>State</strong>s. By 1985, the number <strong>of</strong> deathsattributed to AIDS surpassed 10,000, and thenumber cont<strong>in</strong>ued to climb. In 1995, nearly50,000 Americans died <strong>of</strong> AIDS. 6 Relief wasfound <strong>in</strong> 1996 with the advent <strong>of</strong> HighlyActive Antiretroviral <strong>The</strong>rapy (HAART), andushered <strong>in</strong> a new era. HAART slowed theprogression <strong>of</strong> HIV to AIDS considerably,and the number <strong>of</strong> deaths attributable toAIDS began to decl<strong>in</strong>e.Between 1998 and 2002, the annual number<strong>of</strong> newly diagnosed HIV <strong>in</strong>fections <strong>in</strong> <strong>New</strong><strong>Mexico</strong> decl<strong>in</strong>ed from 160 to a little over 100.While the decl<strong>in</strong>e <strong>in</strong> new diagnosesoccurred <strong>in</strong> most segments <strong>of</strong> thepopulation, it was especially evident amongWhite and Hispanic persons. S<strong>in</strong>ce 2002,however, the trend has reversed, and morecases <strong>of</strong> HIV are be<strong>in</strong>g diagnosed each year.In 2009, 168 newly diagnosed cases—thehighest number ever—were reported. <strong>The</strong>number <strong>of</strong> new cases has <strong>in</strong>creased amongpersons <strong>of</strong> all racial/ethnic groups, withmarked disparities. Among Whites,<strong>in</strong>fections <strong>in</strong>creased 26 percent, while<strong>in</strong>fections <strong>in</strong> African-Americans <strong>in</strong>creased 63percent, <strong>in</strong>fections <strong>in</strong> Hispanics <strong>in</strong>creased 91percent, and <strong>in</strong>fections <strong>in</strong> American Indians<strong>in</strong>creased 170 percent (Figure 3).<strong>The</strong> recent rise <strong>in</strong> the number <strong>of</strong> new<strong>in</strong>fections re<strong>in</strong>forces the importance <strong>of</strong>prevention efforts. Dur<strong>in</strong>g the 2010session, the <strong>New</strong> <strong>Mexico</strong> Legislatureamended the HIV Test Act to allow the<strong>Department</strong> <strong>of</strong> <strong>Health</strong> to seamlesslyprovide test<strong>in</strong>g, counsel<strong>in</strong>g, and referralservices to sexual and needle-shar<strong>in</strong>gpartners <strong>of</strong> persons diagnosed with HIV<strong>in</strong>fection. In addition, culturally appropriatebest practices are be<strong>in</strong>g developed andimplemented throughout the state. <strong>The</strong>seeffective programs need to be madeavailable to populations with <strong>in</strong>creas<strong>in</strong>g<strong>in</strong>cidence rates, <strong>in</strong>clud<strong>in</strong>g AmericanIndians, African-Americans and Hispanics.Infectious DiseaseWhat is Be<strong>in</strong>g Done U.S. recommends <strong>in</strong>fluenzavacc<strong>in</strong>e for everyone > 6 monthswho does not have a medicalcontra<strong>in</strong>dication. Initiatives <strong>in</strong> <strong>New</strong> <strong>Mexico</strong>hospitals are vacc<strong>in</strong>at<strong>in</strong>g postpartummothers and others whowill be car<strong>in</strong>g for newborn<strong>in</strong>fants. <strong>The</strong> HIV Test Act was updatedby the <strong>New</strong> <strong>Mexico</strong> Legislatureto allow the provision <strong>of</strong>confidential and voluntarypartner services and HIV test<strong>in</strong>gto sexual or needle-shar<strong>in</strong>gpartners <strong>of</strong> persons newlydiagnosed and reported withHIV. Community-based providershave developed, and aredeliver<strong>in</strong>g, evidence-based HIVprevention programs that areculturally appropriate forAmerican Indian, AfricanAmerican and Hispaniccommunities.What Needs to Be Done Inform the public and conv<strong>in</strong>cethem <strong>of</strong> the value <strong>of</strong> <strong>in</strong>fluenzavacc<strong>in</strong>ation for all <strong>in</strong>dividuals >6 months without medicalcontra<strong>in</strong>dication. Decrease pertussis through theappropriate use <strong>of</strong> standardizedand improved laboratory tests,<strong>in</strong>creased use <strong>of</strong> age-specificvacc<strong>in</strong>ations, and correctapplication <strong>of</strong> treatment andprophylaxis guidel<strong>in</strong>es. Increase the availability <strong>of</strong>culturally appropriate andeffective HIV prevention<strong>in</strong>terventions specific forAmerican Indian, AfricanAmerican and Hispaniccommunities <strong>in</strong> <strong>New</strong> <strong>Mexico</strong>.Infectious Disease 15
Figure 1Current Smok<strong>in</strong>g Among AdultsNM, 2001–2009Percent25201510523.817.928.002001 2003 2005 2007 2009Source: NM Behavioral Risk Factor Surveillance SystemFigure 2Youth Tobacco Use <strong>in</strong> Past 30 DaysGrades 9–12, NM and U.S., 2009Scale?3020100U.S.NM19.5 24.0 8.9 11.8 14.0 18.1Cigarettes Spit or Chew CigarsSources: Sources: NM Youth Risk and Resiliency Survey and CDC YouthRisk and Behavior SurveillanceTableSmok<strong>in</strong>g by Selected Population GroupsNM, 2005–2008Population Group Percent WhoSmokeBisexual 39.1%Household <strong>in</strong>come
pact <strong>of</strong> Tobacco <strong>in</strong> NMprohibits the sale <strong>of</strong> tobacco products tom<strong>in</strong>ors, which is monitored and enforcedthrough the Synar Program. Work is alsounderway to ensure that school districtsare properly implement<strong>in</strong>g state-mandatedpolicies prohibit<strong>in</strong>g tobacco use on schoolproperty, <strong>in</strong>clud<strong>in</strong>g clear procedures forcommunicat<strong>in</strong>g and enforc<strong>in</strong>g the policies.School and community-based programs arefunded across the state to focus onreach<strong>in</strong>g, <strong>in</strong>volv<strong>in</strong>g, and mobiliz<strong>in</strong>g youthto reshape their environment to one wheretobacco-free is the norm. <strong>The</strong>se efforts arecoord<strong>in</strong>ated with a statewide mass mediacampaign that uses TV, the <strong>in</strong>ternet, andcutt<strong>in</strong>g-edge social media and market<strong>in</strong>g.Reduc<strong>in</strong>g Secondhand SmokeExposure<strong>The</strong> Dee Johnson Clean Indoor Air Act,which made most <strong>in</strong>door workplaces andpublic places <strong>in</strong> the state smoke-free, hasbeen <strong>in</strong> effect for three years. <strong>The</strong> lawapplies to all non-tribal bars, restaurants,workplaces, and public places <strong>in</strong> the state.About eight percent <strong>of</strong> people, those wholive, work or visit tribal lands, rema<strong>in</strong>unprotected from secondhand smoke.Several American Indian tribes andorganizations are funded to providesecondhand smoke education andtechnical assistance to tribes <strong>in</strong>terested <strong>in</strong>assess<strong>in</strong>g cas<strong>in</strong>o employee and patronattitudes and pursu<strong>in</strong>g the development <strong>of</strong>smoke-free policies. Other groups arework<strong>in</strong>g with owners and managers <strong>of</strong>multi-unit hous<strong>in</strong>g (i.e., apartments)complexes <strong>in</strong> the adoption <strong>of</strong> voluntarysmoke-free policies. About 85% <strong>of</strong> <strong>New</strong>Mexicans do not allow smok<strong>in</strong>ganywhere <strong>in</strong> their home,however, people who live <strong>in</strong>apartments may still beexposed to their neighbors’secondhand smoke.state funds media efforts, cessationservices, and a telephone l<strong>in</strong>e to helpsmokers quit. Over 12,000 <strong>New</strong> Mexicanscalled 1-800-QUIT NOW, the state’s freetobacco helpl<strong>in</strong>e, <strong>in</strong> fiscal year 2010. <strong>The</strong>helpl<strong>in</strong>e <strong>of</strong>fers a personalized quitt<strong>in</strong>g plan,a tra<strong>in</strong>ed quitt<strong>in</strong>g coach, multiple calls perenrollee, referral to local resources, andfree nicot<strong>in</strong>e patches or gum.<strong>Health</strong> care providers, <strong>in</strong>clud<strong>in</strong>g doctors,nurses, pharmacists, and dentists, arebe<strong>in</strong>g tra<strong>in</strong>ed to screen patients for tobaccouse and to provide brief <strong>in</strong>terventions forthose who smoke. In 2009, 79% <strong>of</strong> adultsmokers who saw a health care provider <strong>in</strong>the past year were advised to quit smok<strong>in</strong>g,compared to only 49% <strong>in</strong> 2001. <strong>The</strong> recent75-cent <strong>in</strong>crease <strong>in</strong> the cigarette excise taxmay also motivate some smokers to quit.Tobacco use <strong>in</strong> <strong>New</strong> <strong>Mexico</strong> and nationallycont<strong>in</strong>ues to be a significant public healthissue, as it rema<strong>in</strong>s the s<strong>in</strong>gle mostpreventable cause <strong>of</strong> death and disease.<strong>The</strong> health, social, and economic effects <strong>of</strong>tobacco use and secondhand smokeexposure require comprehensive policy,educational and cl<strong>in</strong>ical approaches forprevent<strong>in</strong>g use, support for quitt<strong>in</strong>gtobacco, and changes to social norms.<strong>New</strong> <strong>Mexico</strong> has made significant strides<strong>in</strong> reduc<strong>in</strong>g adult tobacco use andexposure to secondhand smoke <strong>in</strong> the pastdecade. Further reduc<strong>in</strong>g youth tobaccouse <strong>in</strong> the state should cont<strong>in</strong>ue to bea priority to prevent youth frombecom<strong>in</strong>g addicted andsuffer<strong>in</strong>g the negative healthconsequences <strong>of</strong> lifetimesmok<strong>in</strong>g.Tobacco UseWhat is Be<strong>in</strong>g Done <strong>New</strong> <strong>Mexico</strong>’s free tobaccohelpl<strong>in</strong>e, 1-800-QUIT NOW, isavailable to everyone, <strong>in</strong>cludesfree nicot<strong>in</strong>e patches or gum,and is primarily serv<strong>in</strong>g people<strong>in</strong> greatest need. <strong>Health</strong> care systems and healthcare providers have madesignificant progress <strong>in</strong> screen<strong>in</strong>gpatients for tobacco use and<strong>of</strong>fer<strong>in</strong>g quitt<strong>in</strong>g assistance. Youth are be<strong>in</strong>g reached withproven tobacco use preventionapproaches <strong>in</strong>clud<strong>in</strong>g youthadvocacy, media literacy, andcutt<strong>in</strong>g edge social media andmarket<strong>in</strong>g.What Needs to Be Done Increas<strong>in</strong>g the tax on othertobacco products, such as chew,snuff, and dip, to match theproportion <strong>of</strong> tax on cigarettesto encourage quitt<strong>in</strong>g <strong>in</strong>stead <strong>of</strong>switch<strong>in</strong>g to lower-pricedtobacco products. Protect<strong>in</strong>g people liv<strong>in</strong>g,work<strong>in</strong>g, and visit<strong>in</strong>g triballands from exposure tosecondhand smoke. Support<strong>in</strong>g policy <strong>in</strong>terventionsmade possible by the newFamily Smok<strong>in</strong>g Prevention andTobacco Control Act, such asprotect<strong>in</strong>g young people byregulat<strong>in</strong>g the time, place, andmanner <strong>in</strong> which tobacco can beadvertised and sold.Support<strong>in</strong>g People <strong>in</strong>Quitt<strong>in</strong>g TobaccoIn 2009, about half <strong>of</strong> <strong>New</strong><strong>Mexico</strong> adult and youth smokerstried quitt<strong>in</strong>g <strong>in</strong> the past year. <strong>The</strong>Tobacco Use 17
Figure 1Lead<strong>in</strong>g Causes <strong>of</strong> Death, Primary andSubstance Abuse-Related, NM, 2003–2007180.2 Heart Disease160.9 Malignant neoplasms69.563.247.836.332.718.2AccidentsSuicideChronic lower repsiratory diseaseCerebrvascular diseaseDiabetes mellitusSubstance abuse-related15.5 Chronic liver disease and cirrhosisSubstance Abuse-Related CauseOther Lead<strong>in</strong>g Causes0 20 40 60 80 100 120 140 160 180 200Rate per 100,000Source: NM Vital Records and <strong>Health</strong> Statistics; rates age-adjusted to the2000 U.S. Standard PopulationFigure 2Top Ten Causes <strong>of</strong> Alcohol-RelatedDeath, NM and U.S., 2007–200914.47.35.35.15.14.23.42.00.70.6Alcohol-related liver diseaseHomicideAlcohol poison<strong>in</strong>gHypertensionAlcohol abuseSuicideFall <strong>in</strong>juriesMotor-vehicle traffic crashesPoison<strong>in</strong>g (not alcohol)Alcohol dependenceAlcohol-RelatedChronic DiseaseAlcohol-RelatedInjury0 3 6 9 12 15Rate per 100,000Source: NM Vital Records and <strong>Health</strong> Statistics; rates age-adjusted to the2000 U.S. Standard PopulationFigure 3Un<strong>in</strong>tentional/Undeterm<strong>in</strong>ed OverdoseDeath Rates by County, NM, 2007–2009RIO ARRIBAGUADALUPE*TAOSEDDYBERNALILLOGRANTSAN MIGUELVALENCIAHIDALGO*SOCORROCHAVESNMCATRON*TORRANCESIERRASANTA FELEACOLFAXLINCOLNQUAY*DEBACA*OTEROSANDOVALDONA ANALOS ALAMOSCURRYSAN JUANCIBOLAMCKINLEYUS (2006)MORA*ROOSEVELT*UNION*LUNA*HARDING*0 10 20 30 40 50Rate per 100,000Source: Vital Records and <strong>Health</strong> Statistics; rates age-adjusted to the2000 U.S. Standard Population* Less than five deaths per 100,000 over three years; there were nodeaths <strong>in</strong> Hard<strong>in</strong>g CountySubstance Abuse Affects<strong>The</strong> consequences <strong>of</strong> substance abuse aresevere <strong>in</strong> <strong>New</strong> <strong>Mexico</strong>. Substance abuseis one <strong>of</strong> the state’s lead<strong>in</strong>g causes <strong>of</strong>death (Figure 1), and <strong>New</strong> <strong>Mexico</strong>consistently ranks among the worst <strong>in</strong> thenation for death from drugs and alcohol.<strong>The</strong> devastation caused by substanceabuse is also associated with domesticviolence, crime, poverty, motor vehiclecrashes, chronic liver disease, <strong>in</strong>fectiousdiseases, mental illness, and othermedical problems.<strong>The</strong> cost <strong>of</strong> substance abuse <strong>in</strong> the U.S. isestimated <strong>in</strong> the hundreds <strong>of</strong> billions <strong>of</strong>dollars per year, and <strong>in</strong>cludes the costs <strong>of</strong>medical care, treatment services, crim<strong>in</strong>aljustice, and lost productivity. 1 In 2006, theestimated cost <strong>of</strong> alcohol abuse <strong>in</strong> <strong>New</strong><strong>Mexico</strong> was more than $2.5 billion, or$1,250 per person. 2 This economic burdenfalls heavily on <strong>New</strong> <strong>Mexico</strong>, s<strong>in</strong>ce it isone <strong>of</strong> the nation’s poorest states—withthe third highest percentage <strong>of</strong> peopleliv<strong>in</strong>g <strong>in</strong> poverty <strong>in</strong> 2008–2009 (19.3%) 3 —and has among the highest rates <strong>of</strong> healthproblems associated with substanceabuse. Vulnerable populations whoexperience considerable negativeconsequences from substance abuse<strong>in</strong>clude youth, pregnant women, <strong>in</strong>jectiondrug users, and prison <strong>in</strong>mates.Higher Rates <strong>of</strong> SubstanceAbuse among Youth <strong>in</strong> <strong>New</strong><strong>Mexico</strong> Compared to U.S.Substance abuse prevention amongadolescents is critical consider<strong>in</strong>g thenegative long-term consequences <strong>of</strong> earlysubstance use. 4,5 In the 2009 <strong>New</strong> <strong>Mexico</strong>Youth Risk and Resiliency Survey, 41% <strong>of</strong>high school students reported that theyhad a dr<strong>in</strong>k <strong>of</strong> alcohol <strong>in</strong> the past monthwhile 26% reported hav<strong>in</strong>g at least fivedr<strong>in</strong>ks on one occasion, similar to U.S.rates (42% and 24%, respectively).However, a larger proportion <strong>of</strong> studentsreported hav<strong>in</strong>g their first dr<strong>in</strong>k beforeage 13 years (29%) compared to studentsnationwide (21%). Rates <strong>of</strong> illicit drug useamong <strong>New</strong> <strong>Mexico</strong> youth are alsorelatively high. Marijuana use <strong>in</strong> the pastmonth was reported by 28% <strong>of</strong> students,compared with 21% nationwide. <strong>New</strong><strong>Mexico</strong> students also reported higher use<strong>of</strong> coca<strong>in</strong>e, hero<strong>in</strong>, methamphetam<strong>in</strong>e andEcstasy than students nationally.Prescription drug abuse among youth hasemerged as a concern <strong>in</strong> <strong>New</strong> <strong>Mexico</strong>. In2007, 12% <strong>of</strong> <strong>New</strong> <strong>Mexico</strong> high schoolstudents reported current nonmedical use<strong>of</strong> prescription pa<strong>in</strong>killers, which roseslightly to 14% <strong>in</strong> 2009.Alcohol-Related Death RatesRema<strong>in</strong> High DespiteDecreases <strong>in</strong>DWI-Related DeathAlcohol-related health problems canresult from either chronic or acute abuse<strong>of</strong> alcohol. Chronic heavy dr<strong>in</strong>k<strong>in</strong>g,def<strong>in</strong>ed as dr<strong>in</strong>k<strong>in</strong>g more than two dr<strong>in</strong>ksper day for men and more than one dr<strong>in</strong>kper day for women, is <strong>of</strong>ten associatedwith alcoholism or alcohol dependence,and can cause or contribute to a number<strong>of</strong> diseases, <strong>in</strong>clud<strong>in</strong>g alcohol-relatedchronic liver disease (Figure 2). For thepast 15–20 years, <strong>New</strong> <strong>Mexico</strong>’s deathrate from these diseases has consistentlybeen first or second <strong>in</strong> the nation, and 1.5to 2 times the national rate. Furthermore,while the national death rate from alcoholrelatedchronic diseases fell dur<strong>in</strong>g thisperiod, <strong>New</strong> <strong>Mexico</strong>’s rate <strong>in</strong>creased. 6 RioArriba and McK<strong>in</strong>ley counties have deathrates for diseases associated with chronicalcohol abuse that are 4–5 times thenational rate.Acute or episodic heavy dr<strong>in</strong>k<strong>in</strong>g,def<strong>in</strong>ed as hav<strong>in</strong>g five dr<strong>in</strong>ks or more onan occasion for men and four dr<strong>in</strong>ks ormore on an occasion for women, issometimes called b<strong>in</strong>ge dr<strong>in</strong>k<strong>in</strong>g, and is ahigh-risk behavior associated withnumerous <strong>in</strong>jury outcomes, <strong>in</strong>clud<strong>in</strong>gmotor vehicle crash fatalities, homicide,and suicide (Figure 2). <strong>New</strong> <strong>Mexico</strong>’sdeath rate for alcohol-related <strong>in</strong>jury alsohas consistently been among the worst <strong>in</strong>the nation, rang<strong>in</strong>g from 1.4 to 1.8 timesthe national rate over the past 15–20 years.While <strong>New</strong> <strong>Mexico</strong>’s alcohol-impairedmotor vehicle crash death rate hasdecl<strong>in</strong>ed almost 70% dur<strong>in</strong>g this period,death rates from other alcohol-related<strong>in</strong>juries have rema<strong>in</strong>ed stable.18 NM <strong>State</strong> <strong>of</strong> <strong>Health</strong> <strong>2011</strong>
All <strong>New</strong> MexicansOverdose Death Rates fromIllicit and Prescription DrugsIncreaseIn 2008, the most common drug typescaus<strong>in</strong>g overdose death <strong>in</strong> <strong>New</strong> <strong>Mexico</strong>were prescription opioids (i.e., methadone,oxycodone), hero<strong>in</strong>, tranquilizers andmuscle relaxants (i.e., benzodiazep<strong>in</strong>es),coca<strong>in</strong>e and antidepressants. <strong>The</strong> overdosedeath rate from the comb<strong>in</strong>ation <strong>of</strong> illicitand prescription drugs <strong>in</strong>creased 150% <strong>in</strong>the past five years from 1.4 per 100,000 <strong>in</strong>2004 to 3.6 <strong>in</strong> 2008. <strong>The</strong> <strong>New</strong> <strong>Mexico</strong>counties with the highest drug overdosedeath rates dur<strong>in</strong>g 2007 to 2009 were RioArriba, Guadalupe and Taos (Figure 3).How Do We Tackle the Problem<strong>of</strong> Substance Abuse?Given the tremendous burden fromsubstance abuse problems, prevention andtreatment is <strong>of</strong> critical importance <strong>in</strong> <strong>New</strong><strong>Mexico</strong>. Primary prevention attempts to stopa problem before it starts. In <strong>New</strong> <strong>Mexico</strong>,primary prevention <strong>of</strong> alcohol-related healthproblems has focused on regulat<strong>in</strong>g accessto alcohol and alter<strong>in</strong>g the alcoholconsumption behavior <strong>of</strong> high-riskpopulations. Regulatory efforts have<strong>in</strong>cluded <strong>in</strong>creas<strong>in</strong>g the price <strong>of</strong> alcohol—which is effective <strong>in</strong> deterr<strong>in</strong>g alcoholabuse, 7 establish<strong>in</strong>g a m<strong>in</strong>imum legaldr<strong>in</strong>k<strong>in</strong>g age, regulat<strong>in</strong>g the density <strong>of</strong> liquoroutlets, and <strong>in</strong>creas<strong>in</strong>g penalties for buyersand servers <strong>of</strong> alcohol to m<strong>in</strong>ors. In addition,efforts to reduce drug overdose death<strong>in</strong>clude <strong>in</strong>novative drug legislation such asthe 911 Good Samaritan Law and statewideprograms to dispose <strong>of</strong> leftover medications.DWI-related law enforcement (e.g.,sobriety checkpo<strong>in</strong>ts) when accompaniedby media activity can be an important form<strong>of</strong> primary prevention, <strong>in</strong>creas<strong>in</strong>g theperceived risk <strong>of</strong> arrest after dr<strong>in</strong>k<strong>in</strong>g anddriv<strong>in</strong>g among the general population.Media is also used to raise awarenessabout methamphetam<strong>in</strong>e, and might beused to communicate the dangers <strong>of</strong>prescription medication abuse.Secondary prevention efforts try to detectand treat emergent cases before theycause harm. In <strong>New</strong> <strong>Mexico</strong>, brief cl<strong>in</strong>ical<strong>in</strong>terventions have targeted at-riskdr<strong>in</strong>kers to address problem dr<strong>in</strong>k<strong>in</strong>gbefore it causes serious harm. Evidence ismount<strong>in</strong>g for the effectiveness <strong>of</strong>screen<strong>in</strong>g and brief <strong>in</strong>tervention for drugabuse <strong>in</strong> the medical sett<strong>in</strong>g as well.Tertiary prevention <strong>in</strong>volves the treatment<strong>of</strong> <strong>in</strong>dividuals diagnosed with substanceuse disorders so they can recover to thehighest health while m<strong>in</strong>imiz<strong>in</strong>g the effects<strong>of</strong> the disease and prevent<strong>in</strong>gcomplications. <strong>The</strong>re are 145 facilities <strong>in</strong><strong>New</strong> <strong>Mexico</strong> that provide substance abusetreatment services, <strong>in</strong>clud<strong>in</strong>g eightfacilities that <strong>of</strong>fer substitution therapysuch as methadone and buprenorph<strong>in</strong>e. 8Roughly 160,000 <strong>New</strong> Mexicans areestimated to have a substance abuse ordependence problem, while just one <strong>in</strong> tenpeople <strong>in</strong> need <strong>of</strong> treatment receives it. 9Nationally, the most common reasons thatpeople who need treatment do not receiveit are because they are not ready to stopus<strong>in</strong>g, have no health <strong>in</strong>surance and can’tafford the cost, or are concerned about thepossible negative effect on their job. 10Proximity to <strong>Mexico</strong> and presence <strong>of</strong> twomajor <strong>in</strong>terstate highways makes drugtraffick<strong>in</strong>g a significant contributor to thedrug problem <strong>in</strong> <strong>New</strong> <strong>Mexico</strong>. Lawenforcement efforts reduce the supply <strong>of</strong>drugs, but reduc<strong>in</strong>g the demand for drugsrema<strong>in</strong>s an important priority. Treatment isthe primary approach to help drugdependentpersons, an estimated 33,000<strong>New</strong> Mexicans age 12 or older, 9 overcomedrug addiction thereby reduc<strong>in</strong>g demand.Harm reduction is another important part <strong>of</strong>the substance abuse prevention model.Syr<strong>in</strong>ge exchange, which prevents thetransmission <strong>of</strong> blood-borne pathogensamong <strong>in</strong>jection drug users, is one strategythat might be considered primary orsecondary prevention. A harm reductionapproach might also be used by practitionerstreat<strong>in</strong>g addiction. Harm reduction programs<strong>in</strong> <strong>New</strong> <strong>Mexico</strong> deliver disease and overdoseprevention education, acu-detox, healthpromotion, social service and treatmentreferral, and, <strong>in</strong> some locations, primarymedical care to <strong>in</strong>jection drug users.Substance AbuseWhat is Be<strong>in</strong>g Done A comprehensive driv<strong>in</strong>g whileimpaired (DWI) preventionprogram contributed to a 39%decrease <strong>in</strong> <strong>New</strong> <strong>Mexico</strong>’salcohol-impaired motor vehicletraffic crash fatality rate from2004 to 2008. More than $15 million is spenteach year to help fund localDWI programs. Roughly 15,000 people wereenrolled <strong>in</strong> substance abusetreatment <strong>in</strong> 2009, <strong>in</strong>clud<strong>in</strong>g amix <strong>of</strong> mental health services <strong>in</strong>outpatient, <strong>in</strong>patient andresidential sett<strong>in</strong>gs. Harm reduction programs areprovid<strong>in</strong>g education on diseaseand overdose prevention, referralsto treatment, and naloxonetra<strong>in</strong><strong>in</strong>g to drug users and theirfamily members and friends. Tra<strong>in</strong><strong>in</strong>gs on guidel<strong>in</strong>es foreffective and safe opioidprescrib<strong>in</strong>g among pa<strong>in</strong> patientsand those who are opioiddependent.What Needs to Be Done Increase the price <strong>of</strong> alcoholicbeverages, which decreasesexcessive alcohol consumption. Increase support <strong>in</strong> adult primarycare sett<strong>in</strong>gs for screen<strong>in</strong>g andbrief <strong>in</strong>terventions to addresspotential alcohol-relatedproblems. Make medication-assistedtreatment more widely availableand ideally, “upon demand.” Educate the general populationabout the importance <strong>of</strong> safemedication use, secure storage<strong>in</strong> the home and proper disposal<strong>of</strong> leftover medic<strong>in</strong>e. Support ongo<strong>in</strong>g and newevidence-based programs forsubstance abuse prevention,treatment and recovery, ensur<strong>in</strong>gthorough program evaluation.Substance Abuse 19
TableLead<strong>in</strong>g Causes <strong>of</strong> DeathNM and U.S., 2007Cause <strong>of</strong>DeathRankNumber <strong>of</strong>DeathsDeathRatesNM U.S. NM U.S. NM U.S.Heart 1 1 3,305 616,067 159.2 190.9Disease*Cancer* 2 2 3,238 562,875 157.3 178.4Accidents 3 5 1,329 123,706 66.7 40.0Chronic 4 4 884 127,706 43.6 40.8LungDisease*Stroke 5 3 804 135,952 39.2 42.2Diabetes* 6 6 673 71,382 32.7 22.5*Denotes a chronic diseaseSource: National Center for <strong>Health</strong> Statistics, 2010. Rates per 100,000population; rates age-adjusted to the 2000 U.S. Standard PopulationFigure 1Adult <strong>Health</strong> Status by Income, NM, 2009PercentPercent1009080706050403020100Figure 2Percent <strong>of</strong> Adults Who Are Up-to-Datewith Recommended Cancer Screen<strong>in</strong>gs by<strong>Health</strong> Insurance Status, NM, 2006–20081009080706050403020100Excellent Very GoodGoodLess than $15,000$15,000–$24,999$25,000–$34,999$35,000–$49,999$50,000+FairSource: NM Behavioral Risk Factor Surveillance SystemPoorInsuredUn<strong>in</strong>sured74.4 44.3 78.3 72.9 59.1 23.4BreastCancerCervicalCancerColorectalCancerBreast cancer data: Women age 40 and older who have had a mammogram<strong>in</strong> the past 2 years. Cervical cancer data: Women ages 18+ who have hada Pap test with<strong>in</strong> the past 3 years. Colorectal cancer data: Women andmen ages 50+ who have had a fecal occult blood test <strong>in</strong> the past yearand/or endoscopy <strong>of</strong> the colon <strong>in</strong> the past 10 yearsSource: NM Behavioral Risk Factor Surveillance SystemThree Stages <strong>of</strong> Chronic DWhat is Chronic Disease?Chronic disease refers to a group <strong>of</strong>illnesses that are not contagious, areprolonged <strong>in</strong> duration, and are rarely curedcompletely. Examples <strong>of</strong> chronic diseases<strong>in</strong>clude heart disease, cancer, stroke,emphysema, diabetes, obesity, asthma, andarthritis. Chronic diseases make up five <strong>of</strong>the six lead<strong>in</strong>g causes <strong>of</strong> death <strong>in</strong> the U.S.and NM (Table), and are responsible forover 60% <strong>of</strong> all deaths <strong>in</strong> our state. 1 Heartdisease is the lead<strong>in</strong>g cause <strong>of</strong> death forboth women and men, followed by cancer.Although chronic diseases are morecommon among older adults, they affectpeople <strong>of</strong> all ages. In addition to escalat<strong>in</strong>gmedical costs, chronic diseases generatesignificant costs due to absenteeism anddecreased productivity <strong>in</strong> the workplace.Arthritis is the top cause <strong>of</strong> disability for<strong>New</strong> Mexican adults, <strong>in</strong>clud<strong>in</strong>g those whoare <strong>of</strong> work<strong>in</strong>g age. Many <strong>New</strong> Mexicanssuffer from multiple chronic diseases, andas the population ages this trend isexpected to <strong>in</strong>crease.Stage 1—Primary PreventionPrimary prevention means keep<strong>in</strong>g healthyso that chronic diseases don’t develop <strong>in</strong>the first place. Although some chronicdiseases are unavoidable, it has beenrecognized for many years that the lead<strong>in</strong>gpreventable behavioral causes <strong>of</strong> chronicdisease <strong>in</strong>clude tobacco use, lack <strong>of</strong>adequate physical activity, and poornutrition. 2,3 Given that most people areaware <strong>of</strong> these risks, why don’t all <strong>New</strong>Mexicans lead a healthy lifestyle?Because the choices we make are shapedby the choices we have. 4 Mak<strong>in</strong>g healthychoices isn’t just about awareness or selfdiscipl<strong>in</strong>e.Many factors affect an<strong>in</strong>dividual’s ability to adopt healthylifestyles, such as access to recreationalareas, affordable healthy foods, clean air,and work, and educational opportunities.Some neighborhoods have easy access t<strong>of</strong>resh, affordable produce; others have onlyfast food, liquor outlets and conveniencestores. 5 Some neighborhoods have cleanparks and safe places to walk, jog, bike orplay, while others don’t. And it isn’t easy toget exercise if you have to work multiplejobs just to get by, or if you can’t easily getaffordable day care for your kids. Adultshave a myriad <strong>of</strong> responsibilities to balanceand prioritize, and those with the fewestresources are most likely to put the needsand demands <strong>of</strong> family and jobs ahead <strong>of</strong>their own health.In our society, wealth is the strongestpredictor <strong>of</strong> health and longevity. 6 A recentstudy found that liv<strong>in</strong>g at less than 200% <strong>of</strong>the federal poverty level imposes a greatersocietal health burden <strong>in</strong> the U.S. thaneither tobacco use or obesity. 7 However, itisn’t just a question <strong>of</strong> “the rich” versus“the poor.” On average, middle classAmericans live shorter lives and are lesslikely to report good health than those whoare wealthy. 6,8 Recent data for NM 9 confirma strong association between <strong>in</strong>come andself-reported health status for adults(Figure 1), much <strong>of</strong> which is driven by thepresence or absence <strong>of</strong> chronic disease.Chronic stressors such as racism anddiscrim<strong>in</strong>ation impose additional healthburdens that cannot be completely <strong>of</strong>fsetby higher <strong>in</strong>come or education. 6Popular conceptions l<strong>in</strong>k health primarilyto medical care, lifestyle, and genes. Whilethese factors play a role, keep<strong>in</strong>g peoplehealthy will only happen on a large scale byimprov<strong>in</strong>g the social conditions <strong>in</strong> which all<strong>New</strong> Mexicans are born, live, learn, work,and play. It’s time we expand the way weth<strong>in</strong>k about health to <strong>in</strong>clude how to keepit, not just how to get it back. 10Stage 2—Secondary Prevention<strong>The</strong> goal <strong>of</strong> secondary prevention is todetect chronic disease <strong>in</strong> its earliest stages,before noticeable symptoms develop, whenit is most likely to be treated successfully.This generally takes the form <strong>of</strong> screen<strong>in</strong>gprograms for persons who feel f<strong>in</strong>e but areat-risk for a condition due to their age, sex,occupation, or other factors. Screen<strong>in</strong>gonly makes sense for those diseases forwhich early detection and treatment havebeen shown to result <strong>in</strong> improved healthoutcomes. Examples <strong>of</strong> effective screen<strong>in</strong>gtests <strong>in</strong>clude Pap smears for early cervicalcancer, rout<strong>in</strong>e mammography for early20 NM <strong>State</strong> <strong>of</strong> <strong>Health</strong> <strong>2011</strong>
isease Preventionbreast cancer, and take-home fecal bloodtest<strong>in</strong>g kits for early colorectal cancer. 11 If ascreen<strong>in</strong>g test is abnormal, it is generally a“first step” that requires additional test<strong>in</strong>gto confirm the diagnosis, followed bytimely and appropriate treatment, whennecessary. Early detection and treatment <strong>of</strong>these cancers leads to large improvements<strong>in</strong> survival. Five-year survival rates forbreast, cervical and colorectal cancers are88–98% if they are discovered at an earlystage, but only 9–25% if diagnosed afterspread<strong>in</strong>g far from the orig<strong>in</strong>al site. 12 In thecases <strong>of</strong> cervical and colorectal cancerscreen<strong>in</strong>g, pre-cancerous conditions canalso be detected which, when treated, canactually result <strong>in</strong> the prevention <strong>of</strong> thesecancers develop<strong>in</strong>g. Unfortunately, many<strong>New</strong> Mexicans are not up-to-date withrecommended cancer screen<strong>in</strong>gs. Lack <strong>of</strong>health <strong>in</strong>surance is a major barrier toaccess<strong>in</strong>g secondary preventive servicesfor breast and colorectal cancer (Figure2). 13 However, even many persons withhealth <strong>in</strong>surance are not be<strong>in</strong>g screened asrecommended. <strong>The</strong> result is that too many<strong>New</strong> Mexicans are diagnosed with, and diefrom, later-stage cancers that might havebeen detected and treated earlier, orpossibly prevented altogether.Appropriate screen<strong>in</strong>g for cardiovasculardisease risk factors, such as high bloodpressure, cholesterol, obesity, and diabetes,is also important. This screen<strong>in</strong>g is bestconducted at a person’s medical home,where consideration <strong>of</strong> <strong>in</strong>dividual riskfactors, mean<strong>in</strong>gful follow-up <strong>of</strong> results, andtimely re-screen<strong>in</strong>g are most likely.Stage 3—Tertiary PreventionTertiary prevention means avoid<strong>in</strong>g orpostpon<strong>in</strong>g disease progression andcomplications once chronic diseasesymptoms are apparent and a diagnosishas been made. <strong>The</strong> same positive socialfactors that allow people to stay healthybecome even more important for personstry<strong>in</strong>g to manage heart disease, diabetes,and other chronic conditions. A personwho is try<strong>in</strong>g to control high blood sugar,high blood pressure, excess weight,and/or high cholesterol needs adequatetime, <strong>in</strong>come, and access to healthy foodsand places to be physically active. This is<strong>of</strong>ten beyond the reach <strong>of</strong> persons withlimited resources. Similarly, avoid<strong>in</strong>g airpollution or second hand smoke that cantrigger a heart attack is more challeng<strong>in</strong>gfor a low <strong>in</strong>come person with diabetes wholives <strong>in</strong> an <strong>in</strong>dustrialized neighborhood orwhose best employment option is at acas<strong>in</strong>o that permits smok<strong>in</strong>g.In addition to liv<strong>in</strong>g and work<strong>in</strong>g <strong>in</strong> healthpromot<strong>in</strong>genvironments, persons withchronic disease can benefit by learn<strong>in</strong>gskills to manage their symptoms, tocommunicate effectively with their healthcare team, and to manage their fear, angerand frustration. 14 Hav<strong>in</strong>g access to chronicdisease self-management programs thatprovide opportunities to learn and practicethese skills help people lead lives that areless limited by their illness.Despite the importance <strong>of</strong> healthy lifestyleand self-management skills, these arerarely sufficient for adequate treatmentand control <strong>of</strong> a chronic disease over thelong term. Chronic diseases are generallyprogressive by nature, and most willrequire ongo<strong>in</strong>g medical management forthe prevention or early detection <strong>of</strong>complications. Tertiary prevention relieson the ability to access and afford visits tohealthcare providers, prescription and nonprescriptiondrugs, medical supplies, andmonitor<strong>in</strong>g tests. Examples <strong>in</strong>clude rout<strong>in</strong>escreen<strong>in</strong>g for and management <strong>of</strong> earlykidney, eye, and foot problems amongpeople with diabetes, and prevent<strong>in</strong>grecurrence <strong>of</strong> heart attack with anticlott<strong>in</strong>gmedications. As the provisions <strong>of</strong>the Patient Protection and Affordable CareAct <strong>of</strong> 2010 are implemented over the nextseveral years, it is anticipated that<strong>in</strong>creased coverage for affordable primarycare and cl<strong>in</strong>ical preventive services will berealized for many more <strong>New</strong> Mexicans.<strong>Health</strong>care coverage does not guaranteehealth care access, however, and <strong>New</strong><strong>Mexico</strong>’s rural character and shortage <strong>of</strong>healthcare providers may cont<strong>in</strong>ue topresent barriers to care.Chronic DiseaseWhat is Be<strong>in</strong>g Done Step Into Cuba is an example <strong>of</strong>a creative rural communityeffort which promotes walk<strong>in</strong>gthrough trail enhancement andwalk<strong>in</strong>g groups. <strong>The</strong> DOH Breast & Cervical CancerEarly Detection Program and newColorectal Cancer Programprovide cancer screen<strong>in</strong>g forun<strong>in</strong>sured and under<strong>in</strong>sured low<strong>in</strong>come<strong>New</strong> Mexicans. <strong>New</strong> <strong>Mexico</strong> Area <strong>Health</strong>Education Centers and the City<strong>of</strong> Albuquerque’s <strong>Department</strong> <strong>of</strong>Senior Affairs are deliver<strong>in</strong>gevidence-based Chronic DiseaseSelf-Management Programs <strong>in</strong>their communities. <strong>The</strong> Southwest Tribal TobaccoCoalition is work<strong>in</strong>g withAmerican Indian communities toraise awareness <strong>of</strong> the <strong>in</strong>creasedrisk for heart attacks experiencedby people with diabetes who areexposed to commercialsecondhand tobacco smoke.What Needs to Be Done Use community plann<strong>in</strong>g todesignate zon<strong>in</strong>g areas thatencourage walk<strong>in</strong>g and bik<strong>in</strong>g <strong>in</strong>the course <strong>of</strong> everydayactivities. Create economic<strong>in</strong>centives that encourage thedevelopment <strong>of</strong> retail grocery<strong>in</strong>vestments <strong>in</strong> low <strong>in</strong>comecommunities. Provide resources and <strong>in</strong>centivesto bus<strong>in</strong>esses, such as taxbreaks, to encourage thedevelopment <strong>of</strong> healthy worksiteenvironments and effectivehealth promotion activities. Reduce the poverty rate, whichwill provide more <strong>New</strong> Mexicanswith the time and <strong>in</strong>come topurchase and prepare healthyfoods and to be more physicallyactive.Chronic Disease 21
Figure 1Lead<strong>in</strong>g Causes <strong>of</strong> Un<strong>in</strong>tentional InjuryDeath, NM, 2005–2009Injury HurtsRate per 100,000Poison<strong>in</strong>g31%Motor Vehicle Crash30%FallsOther25%10%Drown<strong>in</strong>g 2%Suffocation on 2%Source: NM Vital Records and <strong>Health</strong> StatisticsFigure 2Motor Vehicle Crash Death RatesNM, 1990–2009Rate per 100,000 population302520151053,5002,8002,1001,400700029.228.001990 1995 2000 2005 2009Figure 3Hospitalization Rates Due to Fallsby Age, NM, 2005–200938.4 56.70–14 15–64266.265–74717.575–84Source: Hospital Inpatient Discharge Database, NM <strong>Health</strong> PolicyCommission15.2Source: NM Vital Records and <strong>Health</strong> Statistics; rates are age-adjusted tothe 2000 U.S. Standard Population3,211.285+Un<strong>in</strong>tentional <strong>in</strong>jury is the lead<strong>in</strong>g cause <strong>of</strong>death among 1 to 44 year olds <strong>in</strong> <strong>New</strong><strong>Mexico</strong> and <strong>in</strong> the United <strong>State</strong>s. In <strong>New</strong><strong>Mexico</strong>, un<strong>in</strong>tentional <strong>in</strong>jury is the thirdlead<strong>in</strong>g cause <strong>of</strong> death among the totalpopulation, account<strong>in</strong>g for two-thirds <strong>of</strong> all<strong>in</strong>jury deaths. <strong>The</strong>se are <strong>of</strong>ten called“accidents” although most are predictableand <strong>of</strong>ten preventable. <strong>New</strong> <strong>Mexico</strong>’sun<strong>in</strong>tentional <strong>in</strong>jury death rate at 65.6 per100,000 population <strong>in</strong> 2007 was 1.7 timeshigher than the national rate. Poison<strong>in</strong>g,largely drug overdose, was the lead<strong>in</strong>gcause <strong>of</strong> un<strong>in</strong>tentional <strong>in</strong>jury death <strong>in</strong> <strong>New</strong><strong>Mexico</strong> from 2005 through 2009. <strong>The</strong>second and third lead<strong>in</strong>g causes <strong>of</strong>un<strong>in</strong>tentional <strong>in</strong>jury death were motorvehicle crashes and falls, respectively(Figure 1). From 2005 through 2009 thesethree causes accounted for 85.4% <strong>of</strong> allun<strong>in</strong>tentional <strong>in</strong>jury deaths. However, thelead<strong>in</strong>g causes <strong>of</strong> un<strong>in</strong>tentional <strong>in</strong>jurydeath varied by age group. Motor vehiclecrashes and drown<strong>in</strong>g led among children0–4 years <strong>of</strong> age. Motor vehicle crasheswere the ma<strong>in</strong> cause <strong>of</strong> death among the5–24 year age group. Poison<strong>in</strong>g led amongthe 25–64 year age group. Falls were thelead<strong>in</strong>g cause among persons 65 years <strong>of</strong>age and older.<strong>The</strong> un<strong>in</strong>tentional <strong>in</strong>jury death rate amongmales (86.2/100,000 population) was doublethe rate among females (43.5/100,000population) from 2005 through 2009.Poison<strong>in</strong>g (1,347 deaths) was the lead<strong>in</strong>gcause <strong>of</strong> un<strong>in</strong>tentional <strong>in</strong>jury death amongmales dur<strong>in</strong>g this 5-year period, followed bymotor vehicle traffic crashes (1,296) andfalls (731). For females, falls (807 deaths)were the lead<strong>in</strong>g cause <strong>of</strong> un<strong>in</strong>tentional<strong>in</strong>jury death, followed by motor vehicletraffic crashes (586) and poison<strong>in</strong>g (578).American Indians had the highestun<strong>in</strong>tentional <strong>in</strong>jury death rate at83.5/100,000 population, followed byHispanics (65.5/100,000 population) andWhites (58.4/100,000 population). African-Americans and Asians had the lowestun<strong>in</strong>tentional <strong>in</strong>jury death rates(36.6/100,000 population and 26.7/100,000population, respectively). <strong>The</strong> lead<strong>in</strong>gcauses <strong>of</strong> un<strong>in</strong>tentional <strong>in</strong>jury death variedby race/ethnicity. Motor vehicle crasheswere the lead<strong>in</strong>g cause <strong>of</strong> un<strong>in</strong>tentional<strong>in</strong>jury death among American Indians andAsian/Pacific Islanders. Poison<strong>in</strong>g was thelead<strong>in</strong>g cause <strong>of</strong> un<strong>in</strong>tentional <strong>in</strong>jury deathamong Hispanics and African Americans.<strong>The</strong> lead<strong>in</strong>g cause <strong>of</strong> un<strong>in</strong>tentional <strong>in</strong>jurydeath among Whites was falls.Falls were the lead<strong>in</strong>g cause <strong>of</strong>un<strong>in</strong>tentional <strong>in</strong>jury hospitalizations <strong>in</strong> <strong>New</strong><strong>Mexico</strong> from 2005 to 2009. Fall-relatedhospitalizations <strong>in</strong>creased dramatically withage (Figure 2). Hip fracture is the mostcommon type <strong>of</strong> <strong>in</strong>jury experienced byolder adults who fall and requirehospitalization. In 2009, hip fracture wasthe primary diagnosis for 47 percent <strong>of</strong> fallrelatedhospitalizations for people ages 65years or older <strong>in</strong> <strong>New</strong> <strong>Mexico</strong>.Transportation<strong>The</strong> big success story <strong>in</strong> un<strong>in</strong>tentional <strong>in</strong>juryprevention over the last 25 years has beenthe reduction <strong>in</strong> deaths and <strong>in</strong>juries frommotor vehicle crashes. <strong>The</strong> state has<strong>in</strong>vested <strong>in</strong> seat belt and child safety seatlaws, enacted a child helmet use law, settighter penalties aga<strong>in</strong>st dr<strong>in</strong>k<strong>in</strong>g whiledriv<strong>in</strong>g, and improved roadway design andsafety features. From 1990 through 2009, theNM motor vehicle crash death rate decl<strong>in</strong>ed48% (Figure 2). <strong>The</strong> state’s seat belt use ratehas been at or over 90% s<strong>in</strong>ce 2004. Still,motor vehicle crashes were the cause <strong>of</strong>30.1% <strong>of</strong> all un<strong>in</strong>tentional <strong>in</strong>jury deaths from2005 through 2009. In 2008, alcohol was<strong>in</strong>volved <strong>in</strong> 39% <strong>of</strong> all fatal crashes.22 NM <strong>State</strong> <strong>of</strong> <strong>Health</strong> <strong>2011</strong>
Traumatic Bra<strong>in</strong> InjuryTraumatic bra<strong>in</strong> <strong>in</strong>juries (TBI) are amongthe most disabl<strong>in</strong>g <strong>of</strong> <strong>in</strong>juries, as they canlead to loss <strong>of</strong> <strong>in</strong>dependence and create theneed for costly caregiver and supportservices. Death rates due to TBI vary bygender and age. In <strong>New</strong> <strong>Mexico</strong>, the TBIrelateddeath rate from 2004 through 2008was highest among persons 85 years <strong>of</strong> ageand older with an average annual rate <strong>of</strong>119.3 deaths/100,000 population. <strong>The</strong>average annual TBI-related death rate formales was 3.6 times higher than that forfemales. Males were more likely to die fromTBI due to firearms, while women weremore likely to die from a TBI due to a fall.Poison<strong>in</strong>gPoison<strong>in</strong>g deaths, largely due to drugoverdose, became the lead<strong>in</strong>g cause <strong>of</strong>un<strong>in</strong>tentional <strong>in</strong>jury death <strong>in</strong> NM <strong>in</strong> 2006,with a rate <strong>of</strong> 17.9 deaths/100,000population and have cont<strong>in</strong>ued to rise to arate <strong>of</strong> 19.2/100,000 population <strong>in</strong> 2009.Prior to 2006, motor vehicle crashes werethe lead<strong>in</strong>g cause <strong>of</strong> un<strong>in</strong>tentional <strong>in</strong>jurydeath. <strong>The</strong> highest un<strong>in</strong>tentional poison<strong>in</strong>gdeath rate occurred among people 45–54years <strong>of</strong> age (37.1/100,000 population).Un<strong>in</strong>tentional drug poison<strong>in</strong>g <strong>in</strong>cludesdrug overdoses result<strong>in</strong>g from drugmisuse, drug abuse and tak<strong>in</strong>g too much <strong>of</strong>a drug for medical reasons.FallsFall <strong>in</strong>jury is the third lead<strong>in</strong>g cause <strong>of</strong>un<strong>in</strong>tentional <strong>in</strong>jury death and the lead<strong>in</strong>gcause <strong>of</strong> <strong>in</strong>jury hospitalization <strong>in</strong> <strong>New</strong><strong>Mexico</strong>. <strong>The</strong>se <strong>in</strong>juries particularly impactolder adults (Figure 3). From 2005 through2009, over 13,500 <strong>New</strong> Mexicans werehospitalized due to a fall. Of thosehospitalized, approximately 70% were ages65 years and older. Dur<strong>in</strong>g this same timeperiod, 1,343 <strong>New</strong> Mexicans 65 years <strong>of</strong>age and older died due to a fall. For manyolder persons, <strong>in</strong>juries due to falls, such asa hip fracture or traumatic bra<strong>in</strong> <strong>in</strong>jury, areso disabl<strong>in</strong>g that they never return to<strong>in</strong>dependent liv<strong>in</strong>g <strong>in</strong> the community. Fallsalso have psychological consequences.Many people who fall, even those who arenot seriously <strong>in</strong>jured, develop a fear <strong>of</strong>fall<strong>in</strong>g. This fear can result <strong>in</strong> depression,isolation and reduced mobility, which leadto a decl<strong>in</strong>e <strong>in</strong> physical function and an<strong>in</strong>creased risk <strong>of</strong> fall<strong>in</strong>g. <strong>The</strong> most effectivestrategies for prevention <strong>of</strong> older adult falls<strong>in</strong>clude home safety, physical activity thatfocuses on ma<strong>in</strong>tenance <strong>of</strong> strength andbalance, and medication safety.Un<strong>in</strong>tentional <strong>in</strong>juries, like <strong>in</strong>tentional<strong>in</strong>juries, are very costly to the state andfamilies. <strong>The</strong> harm caused by car crashes,drug overdose and falls is expensive whenone considers the cost <strong>of</strong> hospitalizationand emergency medical services, <strong>in</strong>abilityto work, support for those disabled, lawenforcement and the judicial process, andloss <strong>of</strong> tax <strong>in</strong>come from those no longerable to work. <strong>The</strong> emotional costs t<strong>of</strong>amilies cannot be measured. Sciencebasedprevention strategies provide thebest hope for reduc<strong>in</strong>g the burden <strong>of</strong> <strong>in</strong>juryand promot<strong>in</strong>g an <strong>in</strong>jury-free environmentfor all <strong>New</strong> Mexicans.Un<strong>in</strong>tentional InjuryWhat is Be<strong>in</strong>g Done Provision <strong>of</strong> home safetytra<strong>in</strong><strong>in</strong>g to child daycareproviders throughout <strong>New</strong><strong>Mexico</strong> s<strong>in</strong>ce 2001. Development <strong>of</strong> a web-based<strong>in</strong>jury prevention curriculumcover<strong>in</strong>g core <strong>in</strong>jury preventionapproaches and <strong>in</strong>juryprevention topics areas <strong>of</strong>concern to all <strong>New</strong> Mexicans. Implementation <strong>of</strong> a statewidecapacity development projectwith regional and communitybasedpartners to enhancecommunity-level <strong>in</strong>juryprevention programs and to<strong>in</strong>itiate new ones. Initiation <strong>of</strong> statewide sexualassault and violence primaryprevention tra<strong>in</strong><strong>in</strong>g programsus<strong>in</strong>g evidence-based models. Tra<strong>in</strong><strong>in</strong>g to prevent falls amongolder adults.What’s Needs to Be Done Incorporate older adult fallsprevention <strong>in</strong>to cl<strong>in</strong>ical sett<strong>in</strong>gs. Increase appropriate use <strong>of</strong>helmets and <strong>in</strong>fant and childsafety seats. Establish a program to ensurethat cribs are available for allNM <strong>in</strong>fants and to educateparents to place their <strong>in</strong>fants <strong>in</strong>cribs to sleep. Expand home visit<strong>in</strong>g programsfor new parents, cont<strong>in</strong>u<strong>in</strong>g toimprove and ref<strong>in</strong>e the <strong>in</strong>juryprevention tra<strong>in</strong><strong>in</strong>gs for thehome visitors. Distribute <strong>in</strong>formation statewideregard<strong>in</strong>g the duty <strong>of</strong> the publicto report suspected child abuseand neglect and how to do so.Un<strong>in</strong>tentional Injury 23
Figure 1Suicide Rates by YearNM and U.S., 1995–2009Rate per 100,000 population25201511.81018.711.317.4<strong>New</strong> <strong>Mexico</strong>5United <strong>State</strong>s28.001995 1997 1999 2001 2003 2005 2007 2009Sources: NM Vital Records and <strong>Health</strong> Statistics, CDC, National Centerfor <strong>Health</strong> Statistics; rates are age-adjusted to the 2000 U.S. StandardPopulationFigure 2Suicide Rates by Race/Ethnicityand Age, NM, 2005–2009Rate per 100,000 population50403020100American IndianWhiteHispanic5–14 15–24 25–34 35–44 45–54 55–64 65–74 75–84Sources: NM Vital Records and <strong>Health</strong> Statistics; rates are age-adjustedto the 2000 U.S. Standard PopulationFigure 3Homicide Rates by Sex andRace/Ethnicity, NM, 2007–2009Rate per 100,0002520151050MaleFemaleTotal85+20.1 6.1 12.9 20.4 2.6 11.9 14.9 4.2 9.6 5.8 2.7 4.2AmericanIndianBlack Hispanic WhiteSources: NM Vital Records and <strong>Health</strong> Statistics; rates are age-adjustedto the 2000 U.S. Standard PopulationBurden <strong>of</strong> Violence <strong>in</strong> N<strong>The</strong> World <strong>Health</strong> Organization def<strong>in</strong>esviolence as “the <strong>in</strong>tentional use <strong>of</strong>physical force or power, threatened oractual, aga<strong>in</strong>st oneself, another person, oraga<strong>in</strong>st a group or community, that eitherresults <strong>in</strong> or has a high likelihood <strong>of</strong>result<strong>in</strong>g <strong>in</strong> <strong>in</strong>jury, death, psychologicalharm, maldevelopment or deprivation.” 1Intentional, violent <strong>in</strong>juries <strong>in</strong>clude selfdirected<strong>in</strong>juries due to suicidalbehaviors, as well as <strong>in</strong>terpersonalviolence, such as <strong>in</strong>timate partnerviolence, child maltreatment, and sexualassault.Violence is a significant public healthproblem <strong>in</strong> <strong>New</strong> <strong>Mexico</strong>. In 2007, the totalviolence-related death rate <strong>in</strong> NM was29.1 per 100,000, 66% higher than thenational rate <strong>of</strong> 17.5 per 100,000. <strong>New</strong><strong>Mexico</strong> had the second highest violencerelateddeath rate among states. 2 Suicidewas the second lead<strong>in</strong>g cause <strong>of</strong> death forpersons ages 10–44 years and homicidewas the third lead<strong>in</strong>g cause <strong>of</strong> death forchildren, adolescents, and young adultsages 1–34 years. 3Mortality data are the most collected andavailable source <strong>of</strong> violence-related data;however, deaths represent only a fraction<strong>of</strong> the health and societal impact <strong>of</strong>violence. <strong>The</strong> health effects <strong>of</strong> violencemay last for years follow<strong>in</strong>g the <strong>in</strong>itial<strong>in</strong>jury, account<strong>in</strong>g for significant,permanent disabilities such as sp<strong>in</strong>al cordand bra<strong>in</strong> <strong>in</strong>juries, and limb loss. Victims<strong>of</strong> violence are also at an <strong>in</strong>creased riskfor psychological and behavioralproblems, such as depression, anxiety,post-traumatic stress disorder, substanceuse disorders, and suicidal behaviors; andreproductive health problems, such asunwanted pregnancy and sexuallytransmitted <strong>in</strong>fections.Accord<strong>in</strong>g to a 2007 study, the annualestimated cost <strong>of</strong> violence <strong>in</strong> the U.S. was$70 billion; the vast majority <strong>of</strong> the costswere associated with lost productivity,followed by medical care expenditures. 4Sixty-eight percent <strong>of</strong> the costs fromassaults and 63% <strong>of</strong> the costs from self<strong>in</strong>flicted<strong>in</strong>juries were <strong>in</strong>curred by youngmales ages 15–44 years.SuicideSuicide was the n<strong>in</strong>th lead<strong>in</strong>g cause <strong>of</strong>death <strong>in</strong> <strong>New</strong> <strong>Mexico</strong>, account<strong>in</strong>g for atotal <strong>of</strong> 372 deaths <strong>in</strong> 2009. <strong>The</strong> suicide ratewas 17.4 per 100,000. Over the past 15years, the NM suicide rate has consistentlybeen 1.5 to 2 times the U.S. rate (Figure 1).Males have a higher risk <strong>of</strong> suicide thanfemales. From 2007–2009, the suicide ratefor NM males (29.9 per 100,000) wasalmost four times that for females (8.1 per100,000). Male suicide rates ranged from32.6 to 39.8 per 100,000 among men ages15–74 years, <strong>in</strong>creas<strong>in</strong>g sharply <strong>in</strong> men 75years and over. Female suicide ratespeaked at 15.1 per 100,000 among womenages 45–54 years.Overall suicide death rates weresignificantly higher among Whites (20.8per 100,000) and American Indians (20.1per 100,000) compared to Hispanics (14.9per 100,000). However, suicide ratesdiffered by racial/ethnic background andage group. Among persons less than 35years <strong>of</strong> age from 2005–2009, AmericanIndian youth 15–24 years (29.7 per100,000) and young adults 25–34 years(35.8 per 100,000) had the highest suiciderates. In contrast, adult suicide rates <strong>in</strong>persons 35 years and older were highestamong Whites, rang<strong>in</strong>g from 27.3 per100,000 among persons ages 35–44 yearsto 48.3 per 100,000 among adults 85 yearsand older (Figure 2).Accord<strong>in</strong>g to results from the 2007 <strong>New</strong><strong>Mexico</strong> Violent Death Report<strong>in</strong>g System,the majority <strong>of</strong> male suicide decedents diedfrom a firearm <strong>in</strong>jury (51%), whereas themajority <strong>of</strong> females died by poison<strong>in</strong>g(58%). <strong>The</strong> most common circumstancerelated to suicide deaths among males wasa current depressed mood (40.2%); amongfemales, it was a current mental healthproblem (50.7%).Current suicidal thoughts and a previoussuicide attempt are the best predictors <strong>of</strong>suicidal behavior. 5 Accord<strong>in</strong>g to the 2006NM Behavioral Risk Factor SurveillanceSystem (BRFSS), 5.8% <strong>of</strong> adults reportedthat they felt so low at times dur<strong>in</strong>g the past24 NM <strong>State</strong> <strong>of</strong> <strong>Health</strong> <strong>2011</strong>
M Affects Everyoneyear that they thought about committ<strong>in</strong>gsuicide, and 5.2% reported ever attempt<strong>in</strong>gsuicide <strong>in</strong> their lifetimes. <strong>New</strong> <strong>Mexico</strong>adults with major depression reportedsuicidal thoughts (29.0%) more <strong>of</strong>ten thanadults without depression (3.3%). <strong>The</strong>ywere also more likely to report ever hav<strong>in</strong>gattempted suicide (19.5%) compared to nondepressedadults (3.9%).Suicidal behaviors were also commonamong NM high school and middleschool youth. Accord<strong>in</strong>g to results fromthe 2009 NM Youth Risk and ResiliencySurvey, 15.9% <strong>of</strong> NM high school youthreported that they seriously consideredattempt<strong>in</strong>g suicide and 9.7% reportedattempt<strong>in</strong>g suicide <strong>in</strong> the previous year.Females were more likely to reportsymptoms <strong>of</strong> depression (37.3%) and toseriously consider committ<strong>in</strong>g suicide(20.0%) than males (22.3% and 11.9%,respectively). American Indian youth(19.9%) reported attempt<strong>in</strong>g suicide morefrequently than Hispanic (7.6%) and Whiteyouth (7.3%). Almost seven percent (6.8%)<strong>of</strong> middle school students reported evertry<strong>in</strong>g to kill themselves; this behaviorwas more common among females (9.0%)than males (4.7%).AssaultIn 2009, there were 173 assault deaths <strong>in</strong><strong>New</strong> <strong>Mexico</strong>, result<strong>in</strong>g <strong>in</strong> a homicide rate<strong>of</strong> 8.4 per 100,000. From 2007–2009, themale homicide rate (12.0 per 100,000) wasmore than 3 times that <strong>of</strong> females (3.8 per100,000). African-American (20.4 per100,000) and American Indian (20.1 per100,000) males had the highest homiciderates (Figure 3). Homicide was morecommon among young adult males; malesages 25–34 years (20.5 per 100,000) hadthe highest rate.A subcategory <strong>of</strong> homicide deaths <strong>in</strong>cludesdeaths secondary to child maltreatment. In<strong>New</strong> <strong>Mexico</strong>, there were 80 homicide deathsamong children 0–17 years from 2005–2009;among these, the underly<strong>in</strong>g cause <strong>of</strong> deathwas listed specifically as neglect,abandonment, and other maltreatmentsyndromes for six (7.5%) decedents.Firearms were the most commonmechanism <strong>of</strong> <strong>in</strong>jury for both male (47%)and female (46%) homicide decedents <strong>in</strong>2007. <strong>The</strong> most common circumstancerelated to homicide death among males wasan <strong>in</strong>terpersonal conflict (41.1%), whereasamong females, the circumstances weremost likely to be related to <strong>in</strong>timate partnerviolence (35.9%).Accord<strong>in</strong>g to results from the Survey <strong>of</strong>Violence Victimization <strong>in</strong> <strong>New</strong> <strong>Mexico</strong>, one<strong>in</strong> four females (24%) and one <strong>in</strong> twentymales (5%) aged 18 years and olderreported be<strong>in</strong>g the victim <strong>of</strong> rape orattempted rape <strong>in</strong> their lifetimes, comparedto national rates <strong>of</strong> 18% and 3%, respectively. 6In 2005, the <strong>in</strong>cidence rate <strong>of</strong> completedrape was 5.7 per 1,000 among adult womenand 1.7 per 1,000 among adult men. Morefemale victims <strong>of</strong> rape reported be<strong>in</strong>gphysically attacked compared to males; andtwice as many female rape victims reportedthat their attackers threatened to kill themor someone close to them. Both male andfemale rape victims were twice as likely asnon-victims to suffer from a seriousdisabl<strong>in</strong>g <strong>in</strong>jury <strong>in</strong> their lives, and more than6 times more likely to suffer from one ormore chronic mental health conditions.<strong>The</strong> lifetime prevalence <strong>of</strong> domesticviolence among NM adults 18 years andolder was 24% 6 . On average, victims <strong>of</strong>domestic violence reported 5.5victimizations each by their <strong>of</strong>fender <strong>in</strong> thepast year. In 2008, 72% <strong>of</strong> the victimsidentified by law enforcement werefemales; most <strong>of</strong> the victims were betweenthe ages <strong>of</strong> 19 and 35 years (51%); half wereHispanic, and 15% were American Indian. 7Both self-directed and <strong>in</strong>terpersonalviolence affect many people <strong>in</strong> <strong>New</strong><strong>Mexico</strong>. Comprehensive public healthapproaches to the prevention <strong>of</strong> suicidalbehaviors and assault are necessary tohave an impact on the health and wellbe<strong>in</strong>g<strong>of</strong> <strong>New</strong> Mexicans.What is Be<strong>in</strong>g DoneViolence <strong>The</strong> NM Injury PreventionStrategic Plan promotescollaboration, capacity-build<strong>in</strong>g,and resource shar<strong>in</strong>g to reduce<strong>in</strong>tentional <strong>in</strong>jury. <strong>The</strong> NM Behavioral <strong>Health</strong>Collaborative established aworkgroup to coord<strong>in</strong>ateAmerican Indian youth suicideprevention efforts among tribes,the state, the Indian <strong>Health</strong>Service and other partners. <strong>The</strong> NM Coalition Aga<strong>in</strong>stDomestic Violence advocates forvictims <strong>of</strong> domestic violence andtheir families by provid<strong>in</strong>gtra<strong>in</strong><strong>in</strong>gs, build<strong>in</strong>g alliances,secur<strong>in</strong>g resources, anddevelop<strong>in</strong>g policies to elim<strong>in</strong>atedomestic violence. <strong>The</strong> NM <strong>Department</strong> <strong>of</strong> <strong>Health</strong>,the NM Coalition <strong>of</strong> SexualAssault Programs, and the UNMPrevention Research Centerdeveloped a 3-year strategicplan for the primary prevention<strong>of</strong> sexual violence.What Needs to Be Done Broadly implement the U.S.Preventive Services Task Forcerecommendations to screenadolescents 12–18 years and alladults for major depressivedisorders <strong>in</strong> primary care, schoolbased,and other sett<strong>in</strong>gs. Ensure systems are <strong>in</strong> place foraccurate diagnosis,psychotherapy, and follow-up byform<strong>in</strong>g partnerships betweenprimary care sett<strong>in</strong>gs andbehavioral health core serviceagencies. Develop and evaluate effective,culturally-based <strong>in</strong>itiatives forAmerican Indian youth suicideprevention. Target suicide preventionprograms to high risk adultpopulations, especially White men45 years and older and veterans.Violence 25
Figure 1Serious Psychological Distress by Socio-Demographic Characteristics, NM, 20071.3 $50,000+3.5 $20,000–$49,999Household8.2$10,000–$19,999Income21.3 Under $10,00023.1 Unable to work3.2 Retired2.8 Homemaker/studentEmploymentStatus12.7 Unemployed2.3 Employed1.9 College/tech school graduate3.7 Some college/tech school EducationLevel4.8 High school graduate8.4Some high school0 5 10 15 20 25PercentSource: NM Behavioral Risk Factor Surveillance SystemFigure 2Chronic Conditions by SeriousPsychological Distress Status, NM, 2009PercentFigure 3High School Youth Violence Behaviorby Symptoms <strong>of</strong> Depression, NM, 2009Percent5040302010050403020100YesNo48.3 32.5 17.5 6.5 15.9 5.6PhysicalfightVictim <strong>of</strong><strong>in</strong>timate partnerviolenceVictim <strong>of</strong>sexualviolenceSource: NM Youth Risk and Resiliency SurveySPDNo SPD42.9 26.3 16.4 13.9 39.3 24.5 15.9 7.3 11.4 5.1 7.5 2.2Arthritis Asthma Hypertension Diabetes CHD StrokeSource: NM Behavioral Risk Factor Surveillance System; prevalencerates age-adjusted to the 2000 U.S. Standard PopulationMental <strong>Health</strong> MattersMental illness, a term referr<strong>in</strong>g to alldiagnosable mental disorders, is commonaround the world and <strong>in</strong> the United <strong>State</strong>s.Accord<strong>in</strong>g to the U.S. Surgeon General,mental disorders are health conditionscharacterized by “alterations <strong>in</strong> th<strong>in</strong>k<strong>in</strong>g,mood, or behavior (or some comb<strong>in</strong>ationthere<strong>of</strong>) associated with distress and/orimpaired function<strong>in</strong>g.” 1Approximately one out <strong>of</strong> every 4 adults <strong>in</strong>the U.S. has a mental disorder <strong>in</strong> a givenyear; 13 million or 5.8% suffer from serious,debilitat<strong>in</strong>g disorders that are associatedwith suicide attempts, significant roleimpairment, or lost work productivity. 2Mental disorders are common <strong>in</strong> childhoodand adolescence too; approximately oneout <strong>of</strong> every five children have a mentalhealth diagnosis associated with someimpairment. 1 Adult mental illness iscommonly preceded by psychiatricconditions that beg<strong>in</strong> dur<strong>in</strong>g childhood.Mental illness affects not only the mentaland physical health and well-be<strong>in</strong>g <strong>of</strong><strong>in</strong>dividuals, but also has a tremendousimpact on families and societies. Accord<strong>in</strong>gto the 2004 update <strong>of</strong> the Global Burden <strong>of</strong>Disease report, unipolar depression wasthe third lead<strong>in</strong>g cause <strong>of</strong> disease burdenglobally, and the number one cause <strong>of</strong>years <strong>of</strong> healthy life lost as a result <strong>of</strong>disability (YLD). 3 In addition, depressionaccounted for 65.5 million disabilityadjustedlife years (DALYs), or 4.3% <strong>of</strong> thetotal DALYs. <strong>The</strong> DALY is a summarymeasure <strong>of</strong> population health thatcomb<strong>in</strong>es years <strong>of</strong> life lost from prematuredeath and years <strong>of</strong> life lived <strong>in</strong> less thanoptimal health due to disease and <strong>in</strong>jury.Although depression was the lead<strong>in</strong>g cause<strong>of</strong> YLD for males and females, the burdenamong females was 50% higher thanmales. 3 Other psychiatric conditionscontribut<strong>in</strong>g to a higher burden <strong>in</strong> femaleswere anxiety disorders and seniledementias. In contrast, one quarter <strong>of</strong> themale burden was due to alcohol and druguse disorders, six times higher than theburden <strong>of</strong> these conditions among females.Individuals with serious mental illness havehigher mortality rates than the generalpopulation. <strong>The</strong>y also tend to die earlierthan persons without a mental disorder.Treatment <strong>of</strong> mental illness can reducemorbidity and improve quality <strong>of</strong> life.However, only 41.1% <strong>of</strong> U.S. adults with a 12-month Diagnostic and Statistical Manual <strong>of</strong>Mental Disorders, Fourth Edition (DSM-IV)disorder used mental health services <strong>in</strong> theprior year. 4 Accord<strong>in</strong>g to the NationalSurvey on Drug Use and <strong>Health</strong> (NSDUH),4.7% <strong>of</strong> NM adults perceived an unmet needfor treatment or counsel<strong>in</strong>g for mentalhealth problems <strong>in</strong> the past year. 5 Barriersto receiv<strong>in</strong>g treatment for mental healthproblems <strong>in</strong>clude cost and <strong>in</strong>surance issues,not feel<strong>in</strong>g a need for treatment or th<strong>in</strong>k<strong>in</strong>gthat it could be handled without treatment,and stigma associated with mental illness.Accord<strong>in</strong>g to results from the 2007 NMBehavioral Risk Factor Surveillance System(BRFSS), about two-thirds (66.2%) <strong>of</strong> adultsagreed strongly with the statement,“Treatment can help people with mentalillness lead normal lives.” Another quarter(25.4%) <strong>of</strong> adults agreed slightly. However,only about a quarter <strong>of</strong> adults (26.7%)agreed strongly that “People are generallycar<strong>in</strong>g and sympathetic to people withmental illness.” Another third <strong>of</strong> adults(32.9%) agreed slightly with this statement.Mental <strong>Health</strong>Physicians and researchers <strong>of</strong>ten use a14-day m<strong>in</strong>imum to def<strong>in</strong>e cl<strong>in</strong>icaldepression and anxiety; thus a BRFSSmeasure <strong>of</strong> frequent mental distress (FMD)was def<strong>in</strong>ed us<strong>in</strong>g this time period. 6 In 2008,11.5% <strong>of</strong> adults reported FMD, i.e. that theirmental health was not good for 14 or moredays dur<strong>in</strong>g the past 30 days. Conversely,most NM adults (88.5%) reported less than14 days <strong>of</strong> poor mental health, <strong>in</strong>clud<strong>in</strong>g“stress, depression, and problems withemotions.” Although the number <strong>of</strong> days <strong>of</strong>poor mental health dur<strong>in</strong>g the past 30 daysranged from 0 to 30 days, the averagenumber reported was 3.8 days.Mental DisordersEstimates <strong>of</strong> the prevalence <strong>of</strong> mentaldisorders <strong>in</strong> the general population comefrom both national and state surveys that26 NM <strong>State</strong> <strong>of</strong> <strong>Health</strong> <strong>2011</strong>
use both screen<strong>in</strong>g and diagnosticmeasures to quantify mental illness.Accord<strong>in</strong>g to results from the 2006–2007NSDUH, 9.1% <strong>of</strong> NM youth 12–17 years hadat least one major depressive episode(MDE) <strong>in</strong> the past 12 months; 9.3% <strong>of</strong>young adults 18–25 years and 7.4% <strong>of</strong> adults26 years and older also met the DSM-IVcriteria for MDE <strong>in</strong> the past year. 7 <strong>The</strong>prevalence <strong>of</strong> serious psychological distress<strong>in</strong> the past 12 months among adults 18–25years was 9.3% compared to 7.4% for adults26 years and older. 7 Serious psychologicaldistress (SPD) is a population-basedmeasure used to identify adults that have ahigh likelihood <strong>of</strong> a mental illness andassociated functional limitations.Results from the 2007 BRFSS showed nosignificant differences <strong>in</strong> the frequency <strong>of</strong>past month SPD by gender, age group, orrace/ethnicity. However, the frequency <strong>of</strong>SPD was significantly and <strong>in</strong>versely relatedto household <strong>in</strong>come (Figure 1). Twentyonepercent <strong>of</strong> adults with annualhousehold <strong>in</strong>comes
Figure 1Teen Birth Rates, Age 15–17, by Mother’sRace/Ethnicity, NM, 2002–2009Births per 1,000 teen girls60504030201002002–2004 2003–2005 2004–2006 2005–2007 2006–2008 2007–2009HispanicAfrican-AmericanAmerican IndianWhiteor Alaska NativeAsian or Pacific IslanderSources: NM Vital Records and <strong>Health</strong> Statistics, National Center for<strong>Health</strong> StatisticsFigure 2Infant Mortality Rates by Race/EthnicityNM, 2002–2009Deaths per 1,000 births16128402002–2004 2003–2005 2004–2006 2005–2007 2006–2008 2007–2009HispanicAfrican-AmericanAmerican IndianWhiteor Alaska NativeAsian or Pacific IslanderSources: NM Vital Records and <strong>Health</strong> Statistics, National Center for<strong>Health</strong> StatisticsFigure 3Motor Vehicle Crash Death Rates byRace/Ethnicity, NM, 2002–2009Rate per 100,000 population60504030201002002–2004 2003–2005 2004–2006 2005–2007 2006–2008 2007–2009HispanicAfrican-AmericanAmerican IndianWhiteor Alaska NativeAsian or Pacific IslanderSources: NM Vital Records and <strong>Health</strong> Statistics, National Center for<strong>Health</strong> Statistics; rates age-adjusted to 2000 U.S. Standard PopulationReduc<strong>in</strong>g the Burden <strong>of</strong>Population groups def<strong>in</strong>ed by race orethnicity, gender, sexual orientation,geographic area, country <strong>of</strong> orig<strong>in</strong> orsocioeconomic characteristic may havepoorer or better health than other populationgroups. <strong>The</strong>se differences are called healthdisparities and have been def<strong>in</strong>ed <strong>in</strong> variousways: “differences <strong>in</strong> the <strong>in</strong>cidence,prevalence, mortality and burden <strong>of</strong> diseaseand other adverse health conditions betweenspecific population groups” or moresucc<strong>in</strong>ctly as “population-specific differences<strong>in</strong> the presence <strong>of</strong> disease, health outcomesor access to health care.” Although healthdisparities exist across gender,socioeconomic and other strata, some <strong>of</strong> themost visible differences <strong>in</strong> health arebetween racial and ethnic groups.Many factors contribute to health disparities<strong>in</strong>clud<strong>in</strong>g access to health care, behavioralchoices, the ability to understand and usehealth <strong>in</strong>formation (health literacy), poverty,environmental conditions, language barriersand other social and cultural factors. Ashealth disparities result from many factors,reduc<strong>in</strong>g health disparities will <strong>in</strong>volvemulti-faceted approaches <strong>in</strong>volv<strong>in</strong>g multiplesectors.<strong>New</strong> <strong>Mexico</strong>’s Population and<strong>Health</strong> Disparities<strong>New</strong> <strong>Mexico</strong> is considered a “majoritym<strong>in</strong>ority”state where m<strong>in</strong>ority groupsconstitute a majority <strong>of</strong> the population.Accord<strong>in</strong>g to the <strong>New</strong> <strong>Mexico</strong> Quickfacts,<strong>in</strong> 2009 Hispanics constituted 45.6% <strong>of</strong> thepopulation. Whites were the second largestgroup at 40.9% <strong>of</strong> the population followedby American Indian and Alaska Natives at9.7%, African-Americans at 3.1% andAsians/Pacific Islanders at 1.7%. Althoughsmall <strong>in</strong> comparison to the three largerpopulations, the number <strong>of</strong> African-Americans and Asian/Pacific Islanders isgrow<strong>in</strong>g <strong>in</strong> <strong>New</strong> <strong>Mexico</strong>.Given <strong>New</strong> <strong>Mexico</strong>’s racial and ethnicdiversity, it should not be a surprise to learnthat these populations exhibit differences <strong>in</strong>the burden <strong>of</strong> disease. S<strong>in</strong>ce 2003 the<strong>Department</strong> <strong>of</strong> <strong>Health</strong> has documentedvarious health disparities, and <strong>in</strong> 2006 beganproduc<strong>in</strong>g an annual report, the Racial andEthnic <strong>Health</strong> Disparities Report Card, topresent <strong>in</strong>formation on the differences <strong>in</strong>the health <strong>of</strong> the different racial and ethnicgroups <strong>in</strong> <strong>New</strong> <strong>Mexico</strong>. Of the 20 <strong>in</strong>dicators<strong>in</strong> the Report Card, there were eight <strong>in</strong> the2010 report card for which one populationgroup had rates at least three times higherthan that <strong>of</strong> the group with the lowest rate(the disparity ratio). Three <strong>of</strong> these rateswith large disparities relate to <strong>in</strong>fectiousdisease (hepatitis B, chlamydia andHIV/AIDS), two to maternal and childhealth (teen birth and <strong>in</strong>fant mortality), twoto substance abuse (alcohol-related death,drug-<strong>in</strong>duced death), and one to chronicdisease (diabetes death).Reduc<strong>in</strong>g <strong>Health</strong> Disparities <strong>in</strong><strong>New</strong> <strong>Mexico</strong>It is important to remember that disparitymeans difference and is comparative. To<strong>in</strong>dicate that health disparities exist <strong>in</strong> <strong>New</strong><strong>Mexico</strong> does not mean that the health <strong>of</strong><strong>New</strong> Mexicans is not improv<strong>in</strong>g. A disparitymay persist or even <strong>in</strong>crease despiteimprovements <strong>in</strong> health if there aredifferences between populations <strong>in</strong> the rate<strong>of</strong> improvement. Unfortunately as the Racialand Ethnic <strong>Health</strong> Disparities Report Carddemonstrates, health disparities <strong>in</strong> <strong>New</strong><strong>Mexico</strong> are persist<strong>in</strong>g and even <strong>in</strong>creas<strong>in</strong>gdespite improv<strong>in</strong>g rates <strong>in</strong> some cases.Three health status <strong>in</strong>dicators affect<strong>in</strong>g aconsiderable proportion <strong>of</strong> the population forwhich <strong>New</strong> <strong>Mexico</strong> cont<strong>in</strong>ues to experiencelarge disparities are teen birth, diabetesdeath and alcohol-related death. Teen birthrates are an example <strong>of</strong> improv<strong>in</strong>g rates butcont<strong>in</strong>u<strong>in</strong>g disparity. Although the overallteen birth rate <strong>in</strong> <strong>New</strong> <strong>Mexico</strong> hasdecreased from be<strong>in</strong>g 60% higher than thenational rate to be<strong>in</strong>g 45% higher, thedisparity between populations <strong>in</strong> NMrema<strong>in</strong>s strik<strong>in</strong>g. <strong>The</strong> Hispanic teen birthrate was almost four times the White rateand was five times greater than theAsian/Pacific Islander teen birth rate(Figure 1). <strong>The</strong> rates translate to thefollow<strong>in</strong>g comparison: out <strong>of</strong> every thousandHispanic girls ages 15 to 17 years <strong>in</strong> <strong>New</strong><strong>Mexico</strong>, 47 gave birth compared to 9 out <strong>of</strong> athousand Asian/Pacific Islander females and12 out <strong>of</strong> a thousand White girls. Dur<strong>in</strong>g the28 NM <strong>State</strong> <strong>of</strong> <strong>Health</strong> <strong>2011</strong>
<strong>Health</strong> Disparities <strong>in</strong> NM2007–2009 time period out <strong>of</strong> theapproximately 4,600 births to females ages15–17 years, 69% were to Hispanic girls.Deaths due to diabetes serve as an example<strong>of</strong> a persist<strong>in</strong>g disparity with worsen<strong>in</strong>g rates.All populations <strong>in</strong> <strong>New</strong> <strong>Mexico</strong> showed an<strong>in</strong>crease <strong>in</strong> rates dur<strong>in</strong>g 2007–2009 and allnon-White populations exhibited higher ratesthan Whites. American Indians had thehighest rate <strong>of</strong> deaths due to diabetes, whichwas three times higher than that <strong>of</strong> Whites.For every 100,000 American Indians therewere 73 deaths due to diabetes compared to22 deaths due to diabetes for every 100,000Whites.Alcohol-related deaths rema<strong>in</strong> a seriousproblem <strong>in</strong> <strong>New</strong> <strong>Mexico</strong> and anotherexample <strong>of</strong> <strong>in</strong>creas<strong>in</strong>g rates and persist<strong>in</strong>gdisparity. <strong>The</strong> <strong>New</strong> <strong>Mexico</strong> rate was 88%higher than the national rate. Alcoholrelateddeath rates <strong>in</strong>creased <strong>in</strong> all racialand ethnic groups except for African-Americans, who had the lowest rate.American Indians had the highest rate foralcohol-related deaths, three times that <strong>of</strong>African-Americans, twice that <strong>of</strong> Whitesand 1.7 times that <strong>of</strong> Hispanics. Nearly 200deaths per year among American Indianswere classified as alcohol-related.Infant mortality is an <strong>in</strong>dicator which<strong>in</strong>volves a smaller number <strong>of</strong> cases andexhibits the paradox <strong>of</strong> improv<strong>in</strong>g rates but<strong>in</strong>creas<strong>in</strong>g disparities,. <strong>The</strong>re are less than200 total <strong>in</strong>fant deaths each year <strong>in</strong> <strong>New</strong><strong>Mexico</strong>. <strong>New</strong> <strong>Mexico</strong>’s <strong>in</strong>fant mortality rateimproved so that it was lower than thenational rate. However the disparity betweenAfrican-Americans and Whites <strong>in</strong>creaseds<strong>in</strong>ce the White rate decl<strong>in</strong>ed more rapidlythan the African-American rate. For every1,000 births to White mothers there wereonly 4 deaths while for African-Americansthere were 13 deaths for every 1,000 birthsor three times as many (Figure 2). S<strong>in</strong>ce2003, White <strong>in</strong>fant mortality has decreased24% compared to an 8% decrease for African-American <strong>in</strong>fant mortality.<strong>The</strong> motor vehicle crash death rate is an<strong>in</strong>dicator for which the rates have improvedand the disparity has decreased. <strong>The</strong> overalldeath rate from motor vehicle crashes hasdecl<strong>in</strong>ed such that the <strong>New</strong> <strong>Mexico</strong> rate hasimproved s<strong>in</strong>ce 2003 from 45% higher thanthe national rate to 15% higher. In addition,the rates for American Indians, Hispanicsand Whites have all improved with AmericanIndians hav<strong>in</strong>g improved the most,decreas<strong>in</strong>g from 47.5 deaths per 100,000 to30.3 deaths per 100,000 (Figure 3). Althoughthis is a significant improvement, theAmerican Indian death rate from motorvehicle crashes rema<strong>in</strong>ed 1.8 times that <strong>of</strong>Hispanics and 2.3 times that <strong>of</strong> Whites.Reduc<strong>in</strong>g or elim<strong>in</strong>at<strong>in</strong>g health disparities<strong>in</strong>volves focus<strong>in</strong>g on specific healthdisparities and assess<strong>in</strong>g the contributions<strong>of</strong> multiple factors <strong>in</strong>clud<strong>in</strong>g cultural,economic and environmental <strong>in</strong>fluences tothe disparity. Resources and <strong>in</strong>terventionsneed to be targeted toward the populationgroup at the wrong end <strong>of</strong> the disparity. <strong>The</strong>decl<strong>in</strong>e <strong>in</strong> motor vehicle deaths required amulti-faceted approach suggest<strong>in</strong>g thatreduc<strong>in</strong>g disparities requires efforts <strong>in</strong>many arenas. Coord<strong>in</strong>ated efforts <strong>in</strong>volv<strong>in</strong>gresources and strategies from multiplepublic and private agencies need to bedeveloped to address the multiple<strong>in</strong>fluences contribut<strong>in</strong>g to disparities.<strong>Health</strong> DisparitiesWhat is Be<strong>in</strong>g Done Improved report<strong>in</strong>g anddissem<strong>in</strong>ation <strong>of</strong> health data byrace and ethnicity to aid <strong>in</strong><strong>in</strong>formed decisionmak<strong>in</strong>g. Improv<strong>in</strong>g the capacity <strong>of</strong> publicand private health care agenciesto provide culturally appropriateservices <strong>in</strong>clud<strong>in</strong>g tra<strong>in</strong>edmedical <strong>in</strong>terpretation,programs, and materials toclients with limited Englishpr<strong>of</strong>iciency. Development <strong>of</strong> <strong>in</strong>novativeoutreach strategies <strong>in</strong>clud<strong>in</strong>gculturally appropriate mediastrategies such as fotonovelasand films to reach underservedpopulations. In 2010, a report on health dataand disparities among thelesbian, gay, bisexual andtransgender community <strong>in</strong> NMwas published.What Needs to Be Done Develop<strong>in</strong>g more <strong>in</strong>tegratedcross-agency approaches<strong>in</strong>clud<strong>in</strong>g public-privatepartnerships to address themultiple factors contribut<strong>in</strong>g tospecific disparities. Increased efforts by both publicand private health agencies toreach underserved communitiesthrough the use <strong>of</strong> allied healthpr<strong>of</strong>essionals outside <strong>of</strong> thecl<strong>in</strong>ical sett<strong>in</strong>g. Development <strong>of</strong> patient<strong>in</strong>formation materials for lowliteracypopulations <strong>in</strong> order tobetter dissem<strong>in</strong>ate <strong>in</strong>formationto the public on both theprevention and optimalmanagement <strong>of</strong> adverse healthconditions. Target<strong>in</strong>g resources and<strong>in</strong>terventions toward populationgroups with higher rates <strong>of</strong>death and disease.<strong>Health</strong> Disparities 29
Figure 1Heart Attack Death Rates byRace/Ethnicity, NM, 2006–200930A <strong>Health</strong>y Environment iRate per 100,000252015105022.4 15.2 27.8 23.7 26.1American Asian or Black or Hispanic White,Indian or Pacific AfricanNon-HispanicAlaska Native Islander AmericanSource: NM Vital Records and <strong>Health</strong> Statistics; rates age-adjusted to2000 U.S. Standard PopulationFigure 3Elevated Blood Lead Rates AmongChildren Under 6 Years, NM, 2006–2009Rate per 1,000 children testedFigure 2Asthma Hospitalization Rates AmongChildren 1–14 Years, NM, 2008Rate per 10,00060504030201019.2 15.4 12.3 16.4 51.7 9.60<strong>New</strong> NW NM NE NM Bernalillo SE NM SW NM<strong>Mexico</strong>CountySource: Hospital Inpatient Discharge Database, NM <strong>Health</strong> PolicyCommission<strong>The</strong>se data are hospital <strong>in</strong>patient discharges where asthma is the firstlisteddiagnosis. <strong>The</strong>y <strong>in</strong>clude state residents who were discharged fromNM non-federal hospitals. Because many American Indians are admittedto federal IHS hospitals, they are not <strong>in</strong>cluded <strong>in</strong> these rates.4.54.03.53.02.52.01.51.00.50.04.0 3.5 3.0 1.92006 2007 2008 2009Source: NM Lead Poison<strong>in</strong>g Surveillance and Prevention ProgramA healthy environment is essential to thehealth <strong>of</strong> <strong>New</strong> Mexicans. Environmentalhealth addresses the <strong>in</strong>teraction betweenhuman health and the chemical, physical,and biological agents found <strong>in</strong> both ournatural and human-made surround<strong>in</strong>gs.<strong>The</strong> environment can <strong>in</strong>clude the <strong>in</strong>doorand outdoor air we breathe; water we usefor dr<strong>in</strong>k<strong>in</strong>g, cook<strong>in</strong>g, and bath<strong>in</strong>g; food weeat; products we use; build<strong>in</strong>gs we live andwork <strong>in</strong>; designs <strong>of</strong> our cities and towns;and recreational areas we use.How Air Quality CanAffect <strong>Health</strong><strong>The</strong> air we breathe contributes to ourrespiratory and cardiovascular health.Particle pollution, or particulate matter,consists <strong>of</strong> particles that are <strong>in</strong> the air,such as dust, dirt, soot and smoke, andlittle drops <strong>of</strong> liquid. Some particles arelarge or dark enough and can be seen, likesoot or smoke. Other particles are toosmall to be seen. Short-term exposure toelevated particle pollution significantlycontributes to <strong>in</strong>creased mortality as aresult <strong>of</strong> cardiovascular events and alsocan result <strong>in</strong> <strong>in</strong>creased hospital admissionsfor several cardiovascular and pulmonarydiseases. Regional differences <strong>in</strong> heartattack death rates, therefore, may be<strong>in</strong>fluenced by particle pollution. In <strong>New</strong><strong>Mexico</strong>, the heart attack death rate isgreatest <strong>in</strong> the northwestern andsoutheastern regions <strong>of</strong> the state andparticle pollution may play a role. Longtermexposure to high levels <strong>of</strong> particlepollution can reduce overall lifeexpectancy by a few years. 1 Research also<strong>in</strong>dicates that exposure to air pollution can<strong>in</strong>crease the risk <strong>of</strong> <strong>in</strong>fant mortality. 2Known risk factors for heart disease, suchas race/ethnicity, also play a role <strong>in</strong> <strong>New</strong><strong>Mexico</strong> (Figure 1). Air quality for the stateis generally good, but some areas (e.g.,parts <strong>of</strong> southern <strong>New</strong> <strong>Mexico</strong> and SanJuan County) have relatively high levels <strong>of</strong>air pollutants. Industries that adverselyaffect air quality <strong>in</strong>clude power plants, oiland gas development, aggregate crush<strong>in</strong>goperations, and conf<strong>in</strong>ed animal feed<strong>in</strong>goperations. Because there are few airquality monitors <strong>in</strong> the state, methods arebe<strong>in</strong>g developed to forecast episodes <strong>of</strong>poor air quality <strong>in</strong>clud<strong>in</strong>g high ozone anddust concentrations. Air quality healthadvisories can then be developed forpotentially affected communities.How Water Quality CanAffect <strong>Health</strong>Clean water is essential to a healthypopulation. Unclean and unhealthy watercan contribute to gastro<strong>in</strong>test<strong>in</strong>al diseases,various cancers, birth defects, anddevelopmental problems <strong>in</strong> children.Rout<strong>in</strong>e sampl<strong>in</strong>g and analysis <strong>of</strong> the state’swater reveals that the quality is generallygood, but problems can occur.One such problem arises frombacteriological contam<strong>in</strong>ation, which maylead to boil-water advisories. When a boilwateradvisory is issued, the <strong>Department</strong><strong>of</strong> <strong>Health</strong> provides educational materialsfor the public and advises regional publichealth <strong>of</strong>ficials to be on alert for cases <strong>of</strong>gastro<strong>in</strong>test<strong>in</strong>al illness. Nitrates fromfertilizers, animal waste, or improperlyma<strong>in</strong>ta<strong>in</strong>ed septic tanks can alsocontam<strong>in</strong>ate dr<strong>in</strong>k<strong>in</strong>g water sources.<strong>New</strong> <strong>Mexico</strong> has relatively high levels <strong>of</strong>uranium <strong>in</strong> groundwater from naturallyoccurr<strong>in</strong>g deposits as well as from m<strong>in</strong><strong>in</strong>gand mill<strong>in</strong>g <strong>of</strong> uranium ore. Arsenic isanother naturally-occurr<strong>in</strong>g contam<strong>in</strong>ant<strong>of</strong> <strong>New</strong> <strong>Mexico</strong> groundwater. Exposure torelatively high arsenic levels <strong>in</strong> dr<strong>in</strong>k<strong>in</strong>gwater is associated with bladder cancer.Compliance with the new EnvironmentalProtection Agency (EPA) dr<strong>in</strong>k<strong>in</strong>g waterstandard for arsenic <strong>of</strong> 10 ug/L has beena challenge for nearly 100 water systemsserv<strong>in</strong>g about 40% <strong>of</strong> the state population.This standard requires that watersystems modify their source watersupplies and/or <strong>in</strong>stall arsenic-removaltreatment technology, such as reverseosmosis. In addition, many <strong>New</strong>Mexicans get their water from untestedprivate wells. Exposure control measuressuch as removal <strong>of</strong> uranium and arsenicfrom sources <strong>of</strong> dr<strong>in</strong>k<strong>in</strong>g water cont<strong>in</strong>ueto be promoted by creat<strong>in</strong>g anddissem<strong>in</strong>at<strong>in</strong>g fact sheets and othereducational materials among potentiallyexposed <strong>New</strong> Mexicans.30 NM <strong>State</strong> <strong>of</strong> <strong>Health</strong> <strong>2011</strong>
s Essential to NMAsthmaIt is estimated that about 125,000 adults and39,000 children <strong>in</strong> <strong>New</strong> <strong>Mexico</strong> had asthma<strong>in</strong> 2008. Work be<strong>in</strong>g done to reduce theburden <strong>of</strong> asthma <strong>in</strong>cludes collect<strong>in</strong>g andanalyz<strong>in</strong>g health surveillance data andwork<strong>in</strong>g with partners throughout <strong>New</strong><strong>Mexico</strong> to develop effective and susta<strong>in</strong>able<strong>in</strong>terventions. One primary goal <strong>of</strong> state andlocal agencies, physician groups, and nonpr<strong>of</strong>itorganizations is to reduce the rates <strong>of</strong>asthma emergency room visits, asthmahospitalization, and asthma deaths <strong>in</strong>southeastern <strong>New</strong> <strong>Mexico</strong> where the ratesare highest. In 2008, the state asthmahospitalization rate for those under age 15was 19.2 per 10,000 population, while the rate<strong>in</strong> the southeastern region was 51.7 (Figure2). Three additional areas <strong>of</strong> focus <strong>in</strong>clude: 1)<strong>in</strong>creas<strong>in</strong>g health care provider tra<strong>in</strong><strong>in</strong>g onthe latest National Heart, Lung, and BloodInstitute asthma guidel<strong>in</strong>es, 2) <strong>in</strong>creas<strong>in</strong>gasthma education <strong>in</strong> elementary schools, and3) promot<strong>in</strong>g <strong>in</strong>door air quality assessments<strong>in</strong> public schools with the goal <strong>of</strong> reduc<strong>in</strong>gasthma triggers on school campuses.Assess<strong>in</strong>g EnvironmentalExposureExposure to many toxic substances can bedeterm<strong>in</strong>ed through test<strong>in</strong>g <strong>of</strong> biologicalsamples, such as blood, hair, or ur<strong>in</strong>e. Aspart <strong>of</strong> <strong>New</strong> <strong>Mexico</strong>’s notifiable diseasesurveillance, laboratory results that <strong>in</strong>dicateexposure to mercury, arsenic, uranium, lead,pesticides, and nitrates are collected and<strong>in</strong>vestigated. Lead exposure, for example,can be determ<strong>in</strong>ed through blood test<strong>in</strong>g.Lead comes from a variety <strong>of</strong> sources <strong>in</strong> theenvironment, <strong>in</strong>clud<strong>in</strong>g older lead-basedpa<strong>in</strong>ts, ceramics with lead-based glazes,some imported toys and jewelry, fish<strong>in</strong>gweights and bullets. In recent years, thepercent <strong>of</strong> children tested for lead has<strong>in</strong>creased while the proportion <strong>of</strong> childrenfound to have high blood lead levels hasfallen (Figure 3). In 2006, four <strong>of</strong> every 1,000children tested under the age <strong>of</strong> 6 years hadelevated lead levels, but <strong>in</strong> 2009, only two <strong>of</strong>every 1,000 children had elevated lead levels.<strong>The</strong> northwestern and southeastern regions<strong>of</strong> the state had the highest rates <strong>of</strong> elevatedlead levels <strong>in</strong> young children. Even smallamounts <strong>of</strong> lead can affect bra<strong>in</strong> development<strong>in</strong> fetuses, <strong>in</strong>fants, and children. <strong>The</strong> centralfocus <strong>of</strong> health efforts <strong>in</strong>cludes the collectionand analysis <strong>of</strong> lead-test<strong>in</strong>g data comb<strong>in</strong>edwith case management for lead-poisonedchildren, and educational outreach to preventexcessive lead exposure.Exposure to mercury also is an ongo<strong>in</strong>gconcern. Mercury can affect the nervoussystem, especially <strong>in</strong> fetuses, <strong>in</strong>fants, andchildren. Accord<strong>in</strong>g to the EPA, coal-firedpower plants are the largest s<strong>in</strong>gle source <strong>of</strong>U.S. mercury emissions. Because mercuryconcentrates <strong>in</strong> the bodies <strong>of</strong> certa<strong>in</strong> fish,fish consumption guidel<strong>in</strong>es for selectedrivers and lakes are issued periodically.Track<strong>in</strong>g Environmentally-Related DiseaseL<strong>in</strong>k<strong>in</strong>g environmental hazard or humanexposure data with health data is needed todeterm<strong>in</strong>e how the environment may affecthealth. Examples <strong>of</strong> this type <strong>of</strong> analysis<strong>in</strong>clude the connections between air qualityand asthma emergency room visits, orbetween arsenic levels <strong>in</strong> dr<strong>in</strong>k<strong>in</strong>g waterand bladder cancer. <strong>The</strong> EnvironmentalPublic <strong>Health</strong> Track<strong>in</strong>g website has beendeveloped to dissem<strong>in</strong>ate this type <strong>of</strong><strong>in</strong>formation to <strong>New</strong> Mexicans. This<strong>in</strong>formation can help residents avoidpotentially harmful exposures and become<strong>in</strong>formed about environmental health.Environmental <strong>Health</strong>What is Be<strong>in</strong>g Done Asthma education for patientsand health care providertra<strong>in</strong><strong>in</strong>g are be<strong>in</strong>g focused <strong>in</strong>the southeast where rates arehighest. A web data query systemavailable to the public has beendeveloped to provide <strong>New</strong><strong>Mexico</strong> environmental andhealth data. Lead exposure is be<strong>in</strong>g assessed,and <strong>in</strong>dividuals with high bloodlead levels receive site visitswith the goal <strong>of</strong> elim<strong>in</strong>at<strong>in</strong>g thesource <strong>of</strong> exposure.What Needs to Be Done Increase appropriate asthmaself-management education <strong>in</strong>order to reduce hospitaladmissions. Educate communities at risk foradverse environmentalexposures so that they canprotect themselves. Develop additionalenvironmental health advisories,such as when <strong>in</strong>creased ozoneconcentrations occur.Environmental <strong>Health</strong> 31
Figure 1Adults Who Have Changed or Quit a JobBecause Chemicals, Smoke, Fumes or DustCaused <strong>The</strong>ir Asthma or Made It WorseNM, 2007–2008PercentFigure 2Occupational Injury Death RatesNM and U.S., 1998–2008Rate per 100,0008765432<strong>New</strong> <strong>Mexico</strong>U.S.101998 1999 2000 2001 2002 2003 2004 2005 2006 2007 2008Source: BLS Census <strong>of</strong> Fatal Occupational InjuryRate per 100,0003025201510528.5 9.519.00Both Sexes Male FemaleSource: <strong>New</strong> <strong>Mexico</strong> Poison & Drug Information CenterFigure 3Work-related Pesticide-Associated Calls toNMPDIC by Region, NM, 2001–2006543214.7 3.9 3.0 2.40Southwestern Central Eastern NorthernSource: NM Poison and Drug Information Center (NMPDIC)<strong>Health</strong>y Workplaces AreInjuries and illnesses due to work arecostly to workers, employers and society,both economically and <strong>in</strong> terms <strong>of</strong> humansuffer<strong>in</strong>g. In <strong>New</strong> <strong>Mexico</strong> almost $272million or $354 for each covered workerwas paid out <strong>in</strong> benefits for workers’compensation <strong>in</strong>surance <strong>in</strong> 2008. 1 Thislikely represents a fraction <strong>of</strong> the costs <strong>of</strong>work-related illness and <strong>in</strong>jury as costs areshifted to <strong>in</strong>surance systems other thanworkers’ compensation. Furthermore, notall employees are covered by Workers’Compensation. Laws <strong>in</strong> <strong>New</strong> <strong>Mexico</strong>exclude employers with fewer than threeemployees, domestic workers, farm andranch laborers, and real estatesalespersons from mandatory workers’compensation coverage.How the Workplace CanAffect <strong>Health</strong>Work can expose people to many factorsthat affect their health. In 1970 the United<strong>State</strong>s Congress passed the OccupationalSafety and <strong>Health</strong> Act (OSH Act) “toassure so far as possible every work<strong>in</strong>gman and woman <strong>in</strong> the Nation safe andhealthful work<strong>in</strong>g conditions and topreserve our human resources.” 2Many toxic substances such as lead andother heavy metals, cancer-caus<strong>in</strong>gsubstances such as benzene and asbestos,and physical hazards <strong>in</strong> the workplacesuch as noise and vibration frommach<strong>in</strong>ery are required to be monitoredunder the OSH Act.As the epidemiology <strong>of</strong> occupational illnessand <strong>in</strong>jury progresses, a broaden<strong>in</strong>g range<strong>of</strong> effects due to hazardous exposures arebe<strong>in</strong>g observed at ever lower doses. For<strong>in</strong>stance, recent associations have beenmade between chronic, low-doseexposures to lead and neurological effects<strong>in</strong> workers that may lead to memory loss. 3For this reason, <strong>New</strong> <strong>Mexico</strong> now reportsadult blood lead levels between 10 and 24µg/dl to the National Institute forOccupational Safety and <strong>Health</strong> (NIOSH).Aside from physical and pathologicaleffects, there is evidence l<strong>in</strong>k<strong>in</strong>goccupational <strong>in</strong>jury to psychologicaldistress. Analysis <strong>of</strong> the National <strong>Health</strong>Interview Survey found that workers withpsychological distress had a significantlyhigher risk <strong>of</strong> be<strong>in</strong>g <strong>in</strong>jured on the jobthan workers without distress. 4 Anotherstudy <strong>of</strong> workers with work-related <strong>in</strong>juriesfound impacts <strong>of</strong> the <strong>in</strong>jury on mentalhealth. 5 <strong>The</strong> Whitehall studies from GreatBrita<strong>in</strong> have provided evidence for theassociation between hold<strong>in</strong>g a job that haslow reward for high effort and elevatedrisks for coronary heart disease,psychiatric disorders, fatigue,musculoskeletal and gastro<strong>in</strong>test<strong>in</strong>alsymptoms, and sleep disturbances. 6Work-related asthma is an underrecognizedand under-diagnosed condition.NM adult survey data from 2007–2008<strong>in</strong>dicated that, while up to 70% <strong>of</strong> peoplewith asthma felt that their asthma waseither caused or made worse by theirworkplace, only 8% had ever discussed anassociation between work and asthma withtheir doctors. Work-related asthma canpermanently affect career paths if a workerbecomes sensitized to substances that canbe <strong>in</strong>haled at the workplace. Almost 29% <strong>of</strong><strong>New</strong> Mexicans who had asthma <strong>in</strong> theirlifetime stated that they had changed orquit a job because chemicals, smoke,fumes or dust caused their asthma or madetheir asthma worse (Figure 1). Although<strong>New</strong> <strong>Mexico</strong> does not have many <strong>of</strong> theheavy manufactur<strong>in</strong>g <strong>in</strong>dustries frequentlyassociated with asthma aggravat<strong>in</strong>g or<strong>in</strong>duc<strong>in</strong>g agents, workers may still beexposed to substances such as wood dustor weld<strong>in</strong>g fumes <strong>in</strong> construction,dis<strong>in</strong>fectants used <strong>in</strong> health care, animaldander and gra<strong>in</strong> dust <strong>in</strong> agriculture, orclean<strong>in</strong>g agents used <strong>in</strong> service <strong>in</strong>dustries.<strong>The</strong>se are but a few agents on theextensive list <strong>of</strong> known workplaceasthmagens.<strong>New</strong> <strong>Mexico</strong> has consistently had higherrates <strong>of</strong> work-related <strong>in</strong>jury fatalities thanthe nation as a whole (Figure 2) and ishome to several high-hazard <strong>in</strong>dustries forwork-related <strong>in</strong>jury fatality, such astransportation, m<strong>in</strong><strong>in</strong>g, agriculture andconstruction. Other contribut<strong>in</strong>g riskfactors for occupational <strong>in</strong>jury fatality <strong>in</strong>our state <strong>in</strong>clude be<strong>in</strong>g a non-United<strong>State</strong>s citizen, age 65 years and older,32 NM <strong>State</strong> <strong>of</strong> <strong>Health</strong> <strong>2011</strong>
Good for Bus<strong>in</strong>ess<strong>in</strong>jury occurrence <strong>in</strong> rural counties, andself-employment. 7<strong>New</strong> <strong>Mexico</strong> also has consistently highrates <strong>of</strong> acute work-related pesticideassociatedillnesses and <strong>in</strong>juries reportedto poison control centers. 8 <strong>The</strong>southwestern region <strong>of</strong> NM had thehighest rate <strong>of</strong> calls per 100,000 workers(Figure 3). Insecticides, dom<strong>in</strong>ated byorganophosphates, are the most frequentlyreported pesticides with 63% <strong>of</strong> all callsbe<strong>in</strong>g <strong>in</strong>secticide-related. 9 This promptedfurther study <strong>of</strong> agricultural exposures <strong>in</strong>the southwestern NM. A survey <strong>of</strong>farmworkers <strong>in</strong> 2008 showed that tra<strong>in</strong><strong>in</strong>gwas effective at <strong>in</strong>creas<strong>in</strong>g their knowledgeabout pesticides and at <strong>in</strong>creas<strong>in</strong>g certa<strong>in</strong>self-reported behaviors that are protectiveaga<strong>in</strong>st pesticide exposures. However, onlyhalf <strong>of</strong> workers had ever had any k<strong>in</strong>d <strong>of</strong>tra<strong>in</strong><strong>in</strong>g, much less the EnvironmentalProtection Agency’s mandated WorkerProtection Standard (WPS) tra<strong>in</strong><strong>in</strong>g, andwomen had significantly less tra<strong>in</strong><strong>in</strong>g thanmen. 10 Tra<strong>in</strong><strong>in</strong>g gaps were addressed <strong>in</strong>2010 by compil<strong>in</strong>g an <strong>in</strong>ventory <strong>of</strong> pesticideexposure prevention tra<strong>in</strong><strong>in</strong>g providers <strong>in</strong>southwestern NM and survey<strong>in</strong>gemployers on factors around tra<strong>in</strong><strong>in</strong>g. <strong>The</strong><strong>in</strong>ventory is distributed to employers andfarmworker advocate groups.Workplace Investigations<strong>The</strong> NM <strong>Department</strong> <strong>of</strong> <strong>Health</strong> and theNM Environment <strong>Department</strong> respond toreports <strong>of</strong> occupational illness and <strong>in</strong>jury.One recent <strong>in</strong>vestigation was <strong>in</strong> responseto reported cases <strong>of</strong> Mycobacterium aviumComplex (MAC) <strong>in</strong>fection <strong>in</strong> spama<strong>in</strong>tenance workers. Workers hadsymptoms <strong>in</strong>dicative <strong>of</strong> “hot-tub lung”, ahypersensitivity pneumonitis-like lungdisease that can arise from exposure toMAC-conta<strong>in</strong><strong>in</strong>g aerosols dur<strong>in</strong>g the use orclean<strong>in</strong>g <strong>of</strong> spa tubs. <strong>The</strong> <strong>in</strong>vestigationrequired coord<strong>in</strong>ation <strong>of</strong> several programswith<strong>in</strong> DOH, the NM Environment<strong>Department</strong>, as well as experts with<strong>in</strong>NIOSH and the Centers for DiseaseControl and Prevention Laboratories.production, oil and gas extraction is animportant <strong>in</strong>dustry for the <strong>State</strong>. 11 Basedon occupational <strong>in</strong>jury and illness data,the <strong>New</strong> <strong>Mexico</strong> Occupational <strong>Health</strong> andSafety Bureau (NM-OSHA) has madeboth oil and gas drill<strong>in</strong>g and petroleumref<strong>in</strong><strong>in</strong>g priorities <strong>in</strong> both theirenforcement and cooperative <strong>in</strong>itiatives.Local emphasis programs (LEPs) havebeen established by NM-OSHA to addresshealth and safety hazards <strong>in</strong> these<strong>in</strong>dustries. Additionally, the NM “Oil andGas Safe Site” program has beenestablished to help companies objectivelyevaluate their health and safety programs,and to acknowledge those companies whohave met or exceeded established criteriafor implement<strong>in</strong>g those programs.Another area <strong>of</strong> concern for NM-OSHA isthe <strong>in</strong>creas<strong>in</strong>g rate <strong>of</strong> ergonomic-related<strong>in</strong>juries <strong>in</strong> health care and social assistance<strong>in</strong>dustries. Much <strong>of</strong> the associated <strong>in</strong>juriesare attributable to tasks <strong>in</strong>volv<strong>in</strong>g lift<strong>in</strong>gand reposition<strong>in</strong>g patients.<strong>The</strong> effect <strong>of</strong> work exposures on <strong>in</strong>jury anddisease has been recognized for centuries.As the nature <strong>of</strong> work grows more complex<strong>in</strong> our society, our understand<strong>in</strong>g <strong>of</strong> the<strong>in</strong>teractions between health and theworkplace also <strong>in</strong>creases <strong>in</strong> complexity. Inorder to implement effective occupationalillness and <strong>in</strong>jury prevention strategies,everyone <strong>in</strong>clud<strong>in</strong>g workers, employers,physicians and regulators need to be aware<strong>of</strong> both the positive and detrimental effects<strong>of</strong> work on health.Occupational <strong>Health</strong>What is Be<strong>in</strong>g Done Increas<strong>in</strong>g report<strong>in</strong>g <strong>of</strong>occupational illnesses and<strong>in</strong>juries by health care providers. Promot<strong>in</strong>g pesticide exposureprevention tra<strong>in</strong><strong>in</strong>g forfarmworkers. Provid<strong>in</strong>g <strong>in</strong>formation andeducation on currentoccupational health concernsto health care providersthroughout the state throughProject ECHO’s OccupationalTelemedic<strong>in</strong>e program.What Needs to Be Done Focus surveillance <strong>in</strong> <strong>in</strong>dustriesthat national and state data<strong>in</strong>dicate to be high hazard, suchas oil and gas extraction andhealth care. Improve awareness andrecognition <strong>of</strong> occupationallyrelated conditions among nonoccupationalhealth careproviders. F<strong>in</strong>d ways to collect data onunderserved worker populations,such as workers on tribal lands,migrant workers and the selfemployed. Collect respondents’ occupationand <strong>in</strong>dustry <strong>in</strong> <strong>New</strong> <strong>Mexico</strong>adult survey data to shed lighton associations betweenoccupation, risk behaviors andadverse health outcomes.Rank<strong>in</strong>g 4th for marketed natural gasproduction and 7th for crude oilOccupational <strong>Health</strong> 33
Figure 1Lack <strong>of</strong> Adult <strong>Health</strong> Care CoverageNM and U.S., 2000–2009Percent30252015105068.340.079.342.660.017.777.342.071.842.653.832.320002001200220032004NM 18–64U.S. 18–64NM 65+U.S. 65+20052006Source: NM Behavioral Risk Factor Surveillance SystemFigure 2Adults Receiv<strong>in</strong>g <strong>Health</strong> Screen<strong>in</strong>g orPrevention by <strong>Health</strong> Care CoverageNM, 2008–2009CoverageNo coverage20072008200965+ withpneumoniavacc<strong>in</strong>ationCholesterolcheck with<strong>in</strong>past 5 years50+ andhave hadendoscopy50+ andhave hadmammogramOral healthvisit with<strong>in</strong>past yearAdult diabetic received allrecommended preventitiveservices <strong>in</strong> past year0 10 20 30 40 50 60 70 80 90 100PercentSource: NM Behavioral Risk Factor Surveillance SystemFigure 3Adults Experienc<strong>in</strong>g Barriers to <strong>Health</strong>careby Disability Status, NM, 200814.624.87.120.414.72.913.313.417.54.6No disabilityDisabilityCost asbarrierDistanceTransportationDesign <strong>of</strong>facilityAttitude <strong>of</strong>healthcarepr<strong>of</strong>essionals0 10 20 30 40 50 60 70 80 90 100PercentSource: NM Behavioral Risk Factor Surveillance SystemCoverage Improves; BarrIn 1978, nearly all nations <strong>of</strong> the worldsigned the World <strong>Health</strong> OrganizationDeclaration <strong>of</strong> Alma Ata, 1 proclaim<strong>in</strong>g theright <strong>of</strong> all people to primary care. Primarycare is def<strong>in</strong>ed as basic or general healthcare focused on the po<strong>in</strong>t at which a patientideally first seeks assistance from themedical care system. In 2007, 36% <strong>of</strong> thetotal <strong>New</strong> <strong>Mexico</strong> population resided <strong>in</strong>designated primary care <strong>Health</strong>Pr<strong>of</strong>essional Shortage Areas (HPSA). Allor part <strong>of</strong> thirty-one <strong>of</strong> the thirty-threecounties were designated a primarymedical HPSA.<strong>The</strong> ability to access health care is centralto ma<strong>in</strong>ta<strong>in</strong><strong>in</strong>g one’s health. Importanthealth ma<strong>in</strong>tenance <strong>in</strong>formation and tools,such as mammograms, PAP tests,measurements <strong>of</strong> blood pressure and bloodcholesterol, and many others, are onlyavailable through health care providers.For most <strong>in</strong>dividuals and families, the highcost associated with access<strong>in</strong>g health carecan only be managed through some form <strong>of</strong>health care plan, be it private health<strong>in</strong>surance, employer-provided <strong>in</strong>surance, orsome form <strong>of</strong> public sponsored coverage.Lack <strong>of</strong> health care coverage has beenassociated with delayed access to healthcare and <strong>in</strong>creased risk <strong>of</strong> late stagediagnosis <strong>of</strong> chronic disease and mortality. 2Individuals without health care coverage aremuch less likely than those with coverage toreceive recommended preventive services,are less likely to have access to regular careby a personal physician, and are less able toobta<strong>in</strong> needed medication or health careservices. Consequently, the un<strong>in</strong>sured aremore likely to succumb to preventableillnesses, more likely to suffer complicationsfrom those illnesses, and are more likely todie prematurely. 2,3<strong>The</strong> <strong>New</strong> <strong>Mexico</strong> <strong>Department</strong> <strong>of</strong> <strong>Health</strong>rout<strong>in</strong>ely monitors health care coverage asan important measure <strong>of</strong> the ability <strong>of</strong> thestate’s population to obta<strong>in</strong> importanthealth <strong>in</strong>formation and medical care.Throughout the past decade, <strong>New</strong>Mexicans were less likely than those liv<strong>in</strong>g<strong>in</strong> the rest <strong>of</strong> the country to have any form<strong>of</strong> health care coverage. However, whilelack <strong>of</strong> coverage has rema<strong>in</strong>ed stableacross the country it has decl<strong>in</strong>ed <strong>in</strong> <strong>New</strong><strong>Mexico</strong> <strong>in</strong> recent years, with more<strong>in</strong>dividuals possess<strong>in</strong>g some form <strong>of</strong>coverage (Figure 1). Adults 65 years <strong>of</strong> ageor older qualify for federally sponsoredMedicare. Nearly all adults <strong>in</strong> this agegroup have access to health care.Accord<strong>in</strong>g to the American CommunitySurvey, coverage <strong>of</strong> <strong>New</strong> <strong>Mexico</strong> childrenunder the age <strong>of</strong> 19 years was lower thanthe national percentage but improved from86.2% <strong>in</strong> 2008 to 87.7% <strong>in</strong> 2009. 4<strong>Health</strong> care coverage impacts an<strong>in</strong>dividual’s ability to access recommendedhealth screen<strong>in</strong>g tools and preventivehealth care. For each preventive measureor health screen, Figure 2 presents thepercentage <strong>of</strong> adults who have received thegiven service by health care coveragestatus. For example, nearly 68.3% <strong>of</strong> adultsage 65 or older who have coverage havereceived the recommended pneumococcalvacc<strong>in</strong>ation while only 40.0% <strong>of</strong> thosewithout coverage have received thevacc<strong>in</strong>ation. Adults who are covered by ahealth plan are significantly more likely tohave received these potentially life-sav<strong>in</strong>gservices by the recommended age andwith<strong>in</strong> the recommended timeframe.In 2009, 46.5% <strong>of</strong> adults without coverageexperienced a time <strong>in</strong> the previous 12months <strong>in</strong> which they needed medicalcare but could not get it because <strong>of</strong> thecost, while cost prevented 9.5% <strong>of</strong> adultswith coverage from obta<strong>in</strong><strong>in</strong>g neededmedical care.Barriers to Access<strong>in</strong>g<strong>Health</strong> Care<strong>The</strong> 2008 <strong>New</strong> <strong>Mexico</strong> BRFSS Survey<strong>in</strong>cluded a set <strong>of</strong> supplemental questionsabout barriers to health care. Amongadults who did not have any form <strong>of</strong>coverage, 60% reported that the cost <strong>of</strong>premiums was the primary reason for nothav<strong>in</strong>g coverage, and an additional 22%percent lost coverage when they lost orchanged their job. Other reasons for lack<strong>of</strong> coverage <strong>in</strong>cluded ag<strong>in</strong>g out <strong>of</strong> eligibilityfor Medicaid, rejection by a health<strong>in</strong>surance company, or lack <strong>of</strong> U.S.residency status.34 NM <strong>State</strong> <strong>of</strong> <strong>Health</strong> <strong>2011</strong>
iers to Access PersistIn addition to lack <strong>of</strong> health care coverage,there are other barriers to access<strong>in</strong>g healthcare. Distance to health care providers,transportation issues, the design <strong>of</strong> theprovider’s <strong>of</strong>fice, and for some, the attitude<strong>of</strong> the health care provider or their staff,may serve as barriers to care (Figure 3). In<strong>New</strong> <strong>Mexico</strong>, many communities have fewhealth care providers and distances toneighbor<strong>in</strong>g communities are great forthose liv<strong>in</strong>g <strong>in</strong> rural areas. In 2008, adultsresid<strong>in</strong>g <strong>in</strong> rural areas were more likelythan those liv<strong>in</strong>g <strong>in</strong> metropolitan areas toreport that distance and transportationwere sometimes, <strong>of</strong>ten, or always aproblem <strong>in</strong> seek<strong>in</strong>g care.Disability and Access to CareDisability is also an important factorregard<strong>in</strong>g access to care. In 2008, adultswith a disability were five times more likelythan adults without disability to report<strong>of</strong>fice design as a barrier, nearly four timesmore likely to report transportation as abarrier, three times more likely to reportdistance as a barrier, and over one and ahalf times more likely to report negativeattitude <strong>of</strong> medical or <strong>of</strong>fice staff as abarrier.Community-BasedPrimary CareFor more than 20 years, there has been aneffort to build a system <strong>of</strong> community-basedprimary care centers for <strong>New</strong> <strong>Mexico</strong>’sunderserved. This has been a collaborativeeffort, l<strong>in</strong>k<strong>in</strong>g federal, state, and localprograms with community groups and nonpr<strong>of</strong>itagencies. <strong>The</strong> impact has beenconsiderable; there are primary care centers<strong>in</strong> 95 communities serv<strong>in</strong>g more than300,000 patients through more than 1 millionvisits each year. Roughly 88% <strong>of</strong> thesepatients have annual <strong>in</strong>comes below 200% <strong>of</strong>the Federal Poverty Level and 43% arewithout any form <strong>of</strong> health care coverage.Improv<strong>in</strong>g AccessPrimary care centers are serv<strong>in</strong>g asignificant portion <strong>of</strong> the unmet need <strong>in</strong><strong>New</strong> <strong>Mexico</strong>, mak<strong>in</strong>g clear the necessity <strong>of</strong>cont<strong>in</strong>u<strong>in</strong>g to build the primary care centersector. Under the Federal Primary CareCooperative Agreement, NMDOH willcont<strong>in</strong>ue its work facilitat<strong>in</strong>g the expansion<strong>of</strong> primary care centers.While the focus <strong>of</strong> these centers is onmedical services, there is an <strong>in</strong>creasedemphasis on expansion <strong>of</strong> dental services<strong>in</strong> the primary care sett<strong>in</strong>g. Fewer thanhalf <strong>of</strong> primary care cl<strong>in</strong>ic sites have dentalservice capacity. But even with this limitedcapacity, primary care centers providemore than 20% <strong>of</strong> all Medicaid dentalservices <strong>in</strong> <strong>New</strong> <strong>Mexico</strong>.<strong>The</strong> community-based primary care sector<strong>in</strong> <strong>New</strong> <strong>Mexico</strong> is a major public healthsuccess story. Few other states have aswidespread a system car<strong>in</strong>g for such alarge percentage <strong>of</strong> the state’s underservedpopulation. <strong>The</strong> sector has been built uponlocal <strong>in</strong>itiative, community governance,federal, state, and local f<strong>in</strong>ancial support,and staff<strong>in</strong>g by government healthpr<strong>of</strong>essional programs.Access to <strong>Health</strong> CareWhat is Be<strong>in</strong>g Done Preparations are underway forthe <strong>in</strong>itiation <strong>of</strong> the new federal<strong>Health</strong> Care Reform. <strong>Health</strong> <strong>in</strong>surance has been madeavailable to qualified familieswith children. Low-<strong>in</strong>terest loans are be<strong>in</strong>ggranted for community-basedprimary care center facilitiesand equipment. Plann<strong>in</strong>g assistance is be<strong>in</strong>ggiven to community groups andagencies develop<strong>in</strong>g orexpand<strong>in</strong>g community-basedprimary care centers. Tax <strong>in</strong>centives and educationloan repayment programsencourage medical pr<strong>of</strong>essionalsto settle and work <strong>in</strong> underservedareas.What Needs to Be Done Careful study <strong>of</strong> and <strong>in</strong>tegrationwith federal <strong>Health</strong> Care Reform<strong>of</strong> <strong>New</strong> <strong>Mexico</strong> primary care andother medical resources. Expansion <strong>of</strong> primary carecenters to meet the needs <strong>of</strong>more underserved people. Expansion <strong>of</strong> dental services forprimary care center clients. Expansion <strong>of</strong> basic behavioralhealth services with<strong>in</strong> theprimary care sett<strong>in</strong>g. Expansion <strong>of</strong> health promotionand disease prevention servicesand chronic diseasemanagement capacity <strong>in</strong> theprimary care centers.Access to <strong>Health</strong> Care 35
References<strong>Health</strong>y Youth (pages 12–13)1. Lead<strong>in</strong>g Causes <strong>of</strong> Death, Ages 13–19. Retrievedon October 25, 2010 from <strong>New</strong> <strong>Mexico</strong> <strong>Department</strong><strong>of</strong> <strong>Health</strong>, Indicator-Based Information System forPublic <strong>Health</strong> website: http://ibis.health.state.nm.us/.2. Substance Abuse and Mental <strong>Health</strong> ServicesAdm<strong>in</strong>istration. Alcohol dependence or abuse andage at first use. <strong>The</strong> NSDUH Report October 22,2004. Available at http://oas.samhsa.gov/2k4/ageDependence/ageDependence.cfm. Accessed May19, 2010.3. Substance Abuse and Mental <strong>Health</strong> ServicesAdm<strong>in</strong>istration. Results from the 2008 NationalSurvey on Drug Use and <strong>Health</strong>: National F<strong>in</strong>d<strong>in</strong>gs.Rockville, MD: Substance Abuse and Mental <strong>Health</strong>Services Adm<strong>in</strong>istration, Office <strong>of</strong> Applied Studies;2009. NSDUH Series H-36, DHHS Publication No.SMA 09-4434.4. U.S. <strong>Department</strong> <strong>of</strong> <strong>Health</strong> and Human Services.<strong>The</strong> <strong>Health</strong> Consequences <strong>of</strong> Smok<strong>in</strong>g: A Report <strong>of</strong>the Surgeon General. U.S. <strong>Department</strong> <strong>of</strong> <strong>Health</strong>and Human Services; Centers for Disease Controland Prevention; National Center for Chronic DiseasePrevention and <strong>Health</strong> Promotion; Office onSmok<strong>in</strong>g and <strong>Health</strong>; 2004.5. Santelli JS, Kaiser J, Hirsch L, Radosh A, Simk<strong>in</strong>L, Middlestadt S. Initiation <strong>of</strong> sexual <strong>in</strong>tercourseamong middle school adolescents: the <strong>in</strong>fluence <strong>of</strong>psychosocial factors. Journal <strong>of</strong> Adolescent <strong>Health</strong>2004;34(3):200-208.6. Daniels SR, Arnett DK, Eckel RH, et. al.Overweight <strong>in</strong> children and adolescents:Pathophysiology, consequences, prevention, andtreatment. Circulation 2005;111:1999-2012.7. Key T, Schatzk<strong>in</strong> A, Willet WC, Allen NE, SpencerEA, Travis RC. Diet, nutrition, and the prevention <strong>of</strong>cancer. Public <strong>Health</strong> Nutrition 2004;7(1A):187–200.8. Vartanian LR, Schwartz MB, Brownell KD. Effects<strong>of</strong> s<strong>of</strong>t dr<strong>in</strong>k consumption on nutrition and health:a systematic review and meta-analysis. AmericanJournal <strong>of</strong> Public <strong>Health</strong> 2007;97(4):667–675.9. U.S. <strong>Department</strong> <strong>of</strong> <strong>Health</strong> and Human Services.2008 Physical Activity Guidel<strong>in</strong>es for Americans.Wash<strong>in</strong>gton, DC, U.S. <strong>Department</strong> <strong>of</strong> <strong>Health</strong> andHuman Services; 2008. Available athttp://www.health.gov/PAguidel<strong>in</strong>es/pdf/paguide.pdf. Accessed September 27, 2010.Infectious Disease (pages 14–15)1. Taubenberger, JK and Morens, DM. Influenza: <strong>The</strong>once and future pandemic. Public <strong>Health</strong> Reports.2010;125 Suppl 3:16–26.2. Taubenberger, JK and Morens, DM. Pandemic<strong>in</strong>fluenza—<strong>in</strong>clud<strong>in</strong>g a risk assessment <strong>of</strong> H5N1.Rev Sci Tech. 2009;28(1):187-202.3. Centers for Disease Control and Prevention. CDCsays “take 3” actions to fight the flu. Available athttp://www.cdc.gov/flu/protect/prevent<strong>in</strong>g.htm.Accessed on September 21, 2010.4. Morbidity and Mortality Weekly Report. May 30,2008/Vol. 57/No. RR-4.5. Centers for Disease Control and Prevention.Pneumocystis Pneumonia—Los Angeles. MMWR1981;30(21):1–3.6. AIDS Education Global Information System.So Little Time . . . An AIDS History.http://www.aegis.com/topics/timel<strong>in</strong>e. RetrievedSeptember 23, 2010.Tobacco (pages 16–17)1. Cigarette Smok<strong>in</strong>g-Attributable Morbidity, United<strong>State</strong>s, 2000. MMWR, 2003/52(35); 842-844.2. 2004 Surgeon General’s Report on the <strong>Health</strong>Consequences <strong>of</strong> Smok<strong>in</strong>g.3. <strong>New</strong> <strong>Mexico</strong> Substance Abuse EpidemiologyPr<strong>of</strong>ile, October, 2010.4. Centers for Disease Control and Prevention. <strong>State</strong>Tobacco Activities Track<strong>in</strong>g and Evaluation (STATE)System, http://www.cdc.gov/tobacco/statesystem.5. Susta<strong>in</strong><strong>in</strong>g <strong>State</strong> Programs for Tobacco Control:Data Highlights 2006, CDC and Orzechowski &Walker, Tax Burden on Tobacco, 2009,http://www.tobacc<strong>of</strong>reekids.org/research/factsheets/pdf/0099.pdf.Substance Abuse (pages 18–19)1. National Institute on Drug Abuse (1998) <strong>The</strong>Economic Costs <strong>of</strong> Alcohol and Drug Abuse <strong>in</strong> theUnited <strong>State</strong>s, 1992. NIH Publication No. 98-4327.Available at: http://archives.drugabuse.gov/economiccosts/ Index.html.2. <strong>New</strong> <strong>Mexico</strong> <strong>Department</strong> <strong>of</strong> <strong>Health</strong> (2009) <strong>The</strong>Human and Economic Cost <strong>of</strong> Alcohol Abuse <strong>in</strong> <strong>New</strong><strong>Mexico</strong>. Available at: http://nmhealth.org/ERD/<strong>Health</strong>Data/SubstanceAbuse/ER%20Alcohol%20related%20costs%<strong>2011</strong>2309.pdf.3. U.S. Census Bureau (2010) Percentage <strong>of</strong> People<strong>in</strong> Poverty by <strong>State</strong> Us<strong>in</strong>g 2- and 3-Year Averages:2006–2007 and 2008–2009, Current PopulationSurvey, 2007 to 2010 Annual Social and EconomicSupplements. Available at: http://www.census.gov/hhes/www/poverty/data/<strong>in</strong>cpovhlth/2009/state.xls.4. Substance Abuse and Mental <strong>Health</strong> ServicesAdm<strong>in</strong>istration (2004). <strong>The</strong> NSDUH [NationalSurvey on Drug Use and <strong>Health</strong>] Report: AlcoholDependence or Abuse and Age at First Use.Available at: http://oas.samhsa.gov/2k4/ageDependence/ageDependence.htm.5. Swendsen J, Conway KP, Degenhardt L, et al.(2009) Socio-demographic risk factors for alcoholand drug dependence: the 10-year follow-up <strong>of</strong> thenational comorbidity survey. Addiction, 104(8),1346-1355.6. <strong>New</strong> <strong>Mexico</strong> <strong>Department</strong> <strong>of</strong> <strong>Health</strong> (2007)Chronic Liver Disease Mortality, <strong>New</strong> <strong>Mexico</strong>,1981–2004, Part 1. Available at:http://www.health.state.nm.us/pdf/ER%20CLD%20part%201.pdf.7. Laixuthai A, Chaloupka F. (1993).Youth alcoholuse and public policy. Contemporary Policy Issues,11(4), 70-81.8. Substance Abuse and Mental <strong>Health</strong> ServicesAdm<strong>in</strong>istration (2009) National Survey <strong>of</strong> SubstanceAbuse Treatment Services, 2009 <strong>New</strong> <strong>Mexico</strong> <strong>State</strong>Pr<strong>of</strong>ile. Available at: http://wwwdasis.samhsa.gov/webt/state_data/NM09.pdf.9. Substance Abuse and Mental <strong>Health</strong> ServicesAdm<strong>in</strong>istration (2009) National Survey on Drug Useand <strong>Health</strong>, 2006 and 2007. Available at:http://oas.samhsa.gov/2k7<strong>State</strong>/<strong>New</strong><strong>Mexico</strong>.htm.10. Substance Abuse and Mental <strong>Health</strong> ServicesAdm<strong>in</strong>istration (2010) Results from the 2009National Survey on Drug Use and <strong>Health</strong>: Volume I.Summary <strong>of</strong> National F<strong>in</strong>d<strong>in</strong>gs. Available at:http://oas.samhsa.gov/NSDUH/2k9NSDUH/2k9Results.htm#7.3.Chronic Disease (pages 20–21)1. Xu JQ, Kochanek KD, Murphy SL, Tejada-Vera B.Deaths: F<strong>in</strong>al data for 2007. National vital statisticsreports; vol 58 no 19. Hyattsville, MD: NationalCenter for <strong>Health</strong> Statistics. 2010.2. Mokdad AH, Marks JS, Stroup JL, Gerberd<strong>in</strong>g JL.Actual causes <strong>of</strong> death <strong>in</strong> the United <strong>State</strong>s, 2000.JAMA. 2004;291:1238-1245.3. Mokdad AH, Marks JS, Stroup JL, Gerberd<strong>in</strong>g JL.Correction: Actual causes <strong>of</strong> death <strong>in</strong> the United<strong>State</strong>s, 2000. JAMA. 2005;293:293.4. Taken from the UNNATURAL CAUSES DiscussionGuide, a project <strong>of</strong> California <strong>New</strong>sreel. Copyright ©2008 California <strong>New</strong>sreel. www.unnaturalcauses.org.5. Taken from the UNNATURAL CAUSES ActionToolkit, a project <strong>of</strong> California <strong>New</strong>sreel. Copyright© 2008 California <strong>New</strong>sreel. www.unnaturalcauses.org.6. MacArthur Research Network on SES and <strong>Health</strong>.Reach<strong>in</strong>g for a <strong>Health</strong>ier Life: Facts onSocioeconomic Status and <strong>Health</strong> <strong>in</strong> the U.S. N.D.http://www.macses.ucsf.edu/downloads/Reach<strong>in</strong>g_for_a_<strong>Health</strong>ier_Life.pdf.7. Muennig P, Fiscella K, Tancredi F, Franks P. <strong>The</strong>Relative <strong>Health</strong> Burden <strong>of</strong> Selected Social andBehavioral Risk Factors <strong>in</strong> the United <strong>State</strong>s:Implications for Policy. AJPH. 2010; 100: 1758-1764.8. Braveman, Paula and Susan Egerter. Overcom<strong>in</strong>gObstacles to <strong>Health</strong>: Report from the RobertWoodJohnson Foundation to the Commission toBuild a <strong>Health</strong>y America. Robert Wood JohnsonFoundation,2008.www.commissiononhealth.org/Report.aspx?Publication=26244.9. Centers for Disease Control and Prevention(CDC). Behavioral Risk Factor Surveillance SystemSurvey Data. Atlanta, Georgia: U.S. <strong>Department</strong> <strong>of</strong><strong>Health</strong> and Human Services, Centers for DiseaseControl and Prevention, 2009.36 NM <strong>State</strong> <strong>of</strong> <strong>Health</strong> <strong>2011</strong>
10. Taken from A <strong>New</strong> Way to Talk About the SocialDeterm<strong>in</strong>ants <strong>of</strong> <strong>Health</strong>. Copyright 2010 RobertWood Johnson Foundation. www.rwjf.org/vulnerablepopulations.11. Guide to Cl<strong>in</strong>ical Preventive Services, 2010-<strong>2011</strong>. AHRQ Publication No. 10-05145, September2010. Agency for <strong>Health</strong>care Research and Quality,Rockville, MD. http://www.ahrq.gov/cl<strong>in</strong>ic/pocketgd.htm.12. <strong>New</strong> <strong>Mexico</strong> Cancer Facts & Figures, 2007. <strong>New</strong><strong>Mexico</strong> <strong>Department</strong> <strong>of</strong> <strong>Health</strong>.http://www.cancernm.org/cancercouncil/pdf/NMCFF_FINAL_8-28-07_reduced%20size.pdf.13. Centers for Disease Control and Prevention(CDC). Behavioral Risk Factor Surveillance SystemSurvey Data. Atlanta, Georgia: U.S. <strong>Department</strong> <strong>of</strong><strong>Health</strong> and Human Services, Centers for DiseaseControl and Prevention, comb<strong>in</strong>ed <strong>New</strong> <strong>Mexico</strong>datasets 2006 and 2008.14. Stanford Self-Management Programs. StanfordSchool <strong>of</strong> Medic<strong>in</strong>e. http://patienteducation.stanford.edu/programs/ TakenCopyright 2010Robert Wood Johnson Foundation Copyright 2010Robert Wood Johnson Foundation.Violence (pages 24–25)1. World report on violence and health: summary.Geneva, World <strong>Health</strong> Organization, 2002.2. Centers for Disease Control and Prevention,National Center for Injury Prevention and Control.Web-based Injury Statistics Query and Report<strong>in</strong>gSystem (WISQARS) [onl<strong>in</strong>e]. (2007) [cited 2010 Oct05]. Available from URL: http://www.cdc.gov/<strong>in</strong>jury/wisqars/<strong>in</strong>dex.html.3. Centers for Disease Control and Prevention,National Center for Injury Prevention and Control.Web-based Injury Statistics Query and Report<strong>in</strong>gSystem (WISQARS) [onl<strong>in</strong>e]. (2007) [cited 2010Sept 30]. Available from URL: http://www.cdc.gov/<strong>in</strong>jury/wisqars/<strong>in</strong>dex.html.4. Corso PS, Mercy JA, Simon TR, F<strong>in</strong>kelste<strong>in</strong> TA,Miller TR. Medical costs and productivity losses dueto <strong>in</strong>terpersonal and self-directed violence <strong>in</strong> theUnited <strong>State</strong>s. American Journal <strong>of</strong> PreventiveMedic<strong>in</strong>e. 2007,32(6): 474–482.5. Mann, JJ. A current perspective <strong>of</strong> suicide andattempted suicide. Annals <strong>of</strong> Internal Medic<strong>in</strong>e.2002, 136(4): 302-311.6. Caponera, B. Sex crimes <strong>in</strong> <strong>New</strong> <strong>Mexico</strong> V: Ananalysis <strong>of</strong> data from the Survey <strong>of</strong> ViolenceVictimization <strong>in</strong> <strong>New</strong> <strong>Mexico</strong> and the <strong>New</strong> <strong>Mexico</strong>Interpersonal Violence Data Central Repository,2002-2005. Albuquerque, NM: <strong>The</strong> <strong>New</strong> <strong>Mexico</strong><strong>Department</strong> <strong>of</strong> <strong>Health</strong>. January 2007.7. Caponera, B. Incidence and nature <strong>of</strong> domesticviolence <strong>in</strong> <strong>New</strong> <strong>Mexico</strong> IX: An analysis <strong>of</strong> 2008data from the <strong>New</strong> <strong>Mexico</strong> Interpersonal ViolenceData Central Repository. Albuquerque, NM: <strong>The</strong> <strong>New</strong><strong>Mexico</strong> <strong>Department</strong> <strong>of</strong> <strong>Health</strong>. September 2009.Mental Disorders (pages 26–27)1. U.S. <strong>Department</strong> <strong>of</strong> <strong>Health</strong> and Human Services.Mental <strong>Health</strong>: A Report <strong>of</strong> the Surgeon General.Rockville, MD: U.S. <strong>Department</strong> <strong>of</strong> <strong>Health</strong> andHuman Services, Substance Abuse and Mental<strong>Health</strong> Services Adm<strong>in</strong>istration, Center for Mental<strong>Health</strong> Services, National Institutes <strong>of</strong> <strong>Health</strong>,National Institute <strong>of</strong> Mental <strong>Health</strong>, 1999.2. Kessler, RC, Chiu, WT, Demler, O, Walters, EE.Prevalence, severity, and comorbidity <strong>of</strong> 12-monthDSM-IV disorders <strong>in</strong> the National ComorbiditySurvey Replication. June 2005. Archives <strong>of</strong> GeneralPsychiatry, 62: 617–627.3. CD Mathers, AD Lopez, CJL Murray. <strong>The</strong> burden <strong>of</strong>disease and mortality by condition: data, methods,and results for 2001. [cited 2010 Sept 24].Available from URL: http://www.ncbi.nlm.nih.gov/bookshelf/br.fcgi?book=gbd&part=A176.4. Wang, PS, Lane, M, Olfson, M, P<strong>in</strong>cus, HA, Wells,KB, Kessler, RC. Twelve-month use <strong>of</strong> mental healthservices <strong>in</strong> the United <strong>State</strong>s. June 2005. Archives<strong>of</strong> General Psychiatry, 62: 629–640.5. Substance Abuse and Mental <strong>Health</strong> ServicesAdm<strong>in</strong>istration, Office <strong>of</strong> Applied Studies, NationalSurvey on Drug Use and <strong>Health</strong>, 2006–2008.6. Centers for Disease Control and Prevention.Self-reported frequent mental distress amongadults—United <strong>State</strong>s, 1993–2001. MMWR2004;53:963–966.7. Substance Abuse and Mental <strong>Health</strong> ServicesAdm<strong>in</strong>istration, Office <strong>of</strong> Applied Studies, NationalSurvey on Drug Use and <strong>Health</strong>, 2006-2007.Environmental <strong>Health</strong> (pages 30–31)1. Brook, R.D. et al. (2004). Air Pollution andCardiovascular Disease: A <strong>State</strong>ment for <strong>Health</strong>carePr<strong>of</strong>essionals from the Expert Panel on Populationand Prevention Science <strong>of</strong> the American HeartAssociation. Circulation; 109: 2655–2671.2. Srám, R.J. et al. (2005). Air Pollution andPregnancy Outcomes: A Review <strong>of</strong> the Literature.Environmental <strong>Health</strong> Perspectives; 113(4); 375–382.Occupational <strong>Health</strong> (pages 32–33)1. Sengupta I, Reno V, Burton J. Workers’Compensation: Benefits, Coverage, and Costs, 2008.Wash<strong>in</strong>gton, D.C.: National Academy <strong>of</strong> SocialInsurance, 2010.2. U.S. <strong>Department</strong> <strong>of</strong> Labor. “Occupational Safetyand <strong>Health</strong> Act.” 1970.3Hsieh TJ, Chen YC, Li CW,Liu GC, Chiu YW, Chuang HY. A proton magneticresonance spectroscopy study <strong>of</strong> the chronic leadeffect on the Basal ganglion and frontal andoccipital lobes <strong>in</strong> middle-age adults. Environmental<strong>Health</strong> Perspectives (2009): 941–5.4. Kim. Psychological distress and occupational<strong>in</strong>jury: f<strong>in</strong>d<strong>in</strong>gs from the National <strong>Health</strong> InterviewSurvey 2000-2003. Journal Preventive Medic<strong>in</strong>e andPublic <strong>Health</strong> (2008): 200–7.5. Lax M, Kle<strong>in</strong> R. More than meets the eye: social,economic and emotional impacts <strong>of</strong> work-related<strong>in</strong>jury and illness . <strong>New</strong> Solutions (2008): 343–60.6. Marmot M. Siegrist J. <strong>The</strong>orell T. Feeney A.<strong>Health</strong> and the psychosocial environment at work.In: Social Determ<strong>in</strong>ants <strong>of</strong> <strong>Health</strong>. Oxford; <strong>New</strong>York: Oxford University Press, 2005.7. Mulloy K, Moraga-McHaley S, Crandall C, Kesler O.Occupational <strong>in</strong>jury mortality: <strong>New</strong> <strong>Mexico</strong>1998–2002. American Journal <strong>of</strong> IndustrialMedic<strong>in</strong>e (2007): 910-20.8. CSTE. Occupational <strong>Health</strong> Indicators Indicator 11:Acute Work-Related Pesticide Poison<strong>in</strong>gs Reported toPoison Control Centers . May 2010. 12 10 2010http://www.cste.org/dnn/ProgramsandActivities/Occupational<strong>Health</strong>/Occupational<strong>Health</strong>Indicators/Indicator11/tabid/107/Default.aspx.9. Moraga-McHaley S, Kesler D. Work-RelatedPesticide-Associated Illness and Injury: <strong>New</strong><strong>Mexico</strong>, 2001–2006. <strong>New</strong> <strong>Mexico</strong> EpidemiologyReport. 2007.10. Hagan J, Moraga-McHlaey S. Pesticide Exposure<strong>of</strong> Farmworkers <strong>in</strong> Doña Ana, Hidalgo, and LunaCounties <strong>of</strong> <strong>New</strong> <strong>Mexico</strong>. June 2009. <strong>New</strong> <strong>Mexico</strong>Occupational <strong>Health</strong> Surveillance. 23 August 2009http://nmhealth.org/eheb/documents/Farmworker_pest_surv2009.pdf.11. U.S. Energy Information Adm<strong>in</strong>istration. <strong>State</strong>Engergy Pr<strong>of</strong>iles—<strong>State</strong> Rank<strong>in</strong>gs, 2008. 14 102010. 20 10 2010 http://www.eia.gov/state/state_energy_rank<strong>in</strong>gs.cfm.Access to <strong>Health</strong> Care (pages 34–35)1. World <strong>Health</strong> Organization, http://www.who.<strong>in</strong>t/hpr/NPH/docs/declaration_almaata.pdf.2. Ayanian JZ, Weissman JS, Schneider EC, G<strong>in</strong>sburgJA, Zaslavsky AM. Unmet health needs <strong>of</strong> un<strong>in</strong>suredadults <strong>in</strong> the United <strong>State</strong>s. JAMA.2000;284:2061–9. [PMID: 11042754.3. McWilliams JM, Meara E, Zaslavsky AM, AyanianJZ. Use <strong>of</strong> health services by previously un<strong>in</strong>suredMedicare beneficiaries. N Engl J Med. 2007;357:143–53.4. Mach A, Blumenthal L. <strong>Health</strong> <strong>in</strong>surancecoverage <strong>of</strong> children under age 19: 2008 and 2009.U.S. Census Bureau, American Community Surveys,2008 and 2009. September 2010, ACSBR/09-11.References 37
<strong>The</strong> <strong>State</strong> <strong>of</strong> <strong>Health</strong><strong>in</strong> <strong>New</strong> <strong>Mexico</strong> <strong>2011</strong><strong>New</strong> <strong>Mexico</strong> <strong>Department</strong> <strong>of</strong> <strong>Health</strong>