Eco Audit White Paper. - Granta Design
Eco Audit White Paper. - Granta Design
Eco Audit White Paper. - Granta Design

You also want an ePaper? Increase the reach of your titles
YUMPU automatically turns print PDFs into web optimized ePapers that Google loves.
Contents1. Introduction ..............................................................................................................................12. Life cycle analysis and its difficulties ........................................................................................13. The approach ...........................................................................................................................31. Adopt simple measures of environmental stress. .................................................................32. Distinguish the phases of life. ...............................................................................................33. Base the subsequent action on the energy or carbon breakdown. ......................................44. The <strong>Eco</strong> <strong>Audit</strong> Tool ..................................................................................................................45. Case studies ............................................................................................................................8Bottled water ............................................................................................................................8Electric jug kettle ....................................................................................................................11Family car—comparing material embodied energy with use energy ......................................12Auto bumpers—exploring substitution ....................................................................................13A portable space heater .........................................................................................................146. Summary and conclusions .....................................................................................................16References .................................................................................................................................17Appendix: An <strong>Eco</strong> <strong>Audit</strong> Report .................................................................................................17
1. IntroductionAll human activity has some impact on theenvironment in which we live. Theenvironment has some capacity to cope withthis, so that a certain level of impact can beabsorbed without lasting damage. But it isclear that current human activities exceed thisthreshold with increasing frequency,diminishing quality of life and threatening thewell being of future generations. Part, at least,of this impact derives from the manufacture,use, and disposal of products, and products,without exception, are made from materials.Materials consumption in the United Statesnow exceeds 10 tonnes per person per year.The average level of global consumption isabout 8 times smaller than this but is growingtwice as fast. The materials and the energyneeded to make and shape them are drawnfrom natural resources: ore bodies, mineraldeposits, fossil hydrocarbons. The earth’sresources are not infinite, but until recently,they have seemed so: the demands made onthem by manufacture throughout the 18 th , 19 th ,and early 20 th century appeared infinitesimal,the rate of new discoveries always outpacingthe rate of consumption. This perception hasnow changed: warning flags are flying, dangersignals flashing.To develop tools to analyze the problem andrespond to it, we must first examine thematerials life cycle and consider how to applylife cycle analysis. The materials life cycle issketched in Figure 1. Ore and feedstock aremined and processed to yield materials.These are manufactured into products that areused and at the end of life, discarded,recycled or (less commonly) refurbished andreused. Energy and materials are consumedin each phase of life, generating waste heatand solid, liquid, and gaseous emissions.2. Life cycle analysis and its difficultiesThe environmental impact caused by aproduct is assessed by environmental lifecycle assessment (LCA).Life cycle assessment techniques, nowdocumented in standards (ISO 14040, 1997,1998), analyze the eco impact of productsonce they are in service. They have acquireda degree of rigor, and now deliver essentialdata documenting the way materials influencethe flows of energy and emissions of Figure 1.It is standard practice to process these data toassess their contributions to a number ofknown environmental impacts: ozonedepletion, global warming, acidification of soiland water, human toxicity, and more (ninecategories in all), giving output that looks likeFigure 1. The material life-cycle: material creation, product manufacture, product use, and a number of options forproduct disposal at end of life. Transport is involved between the stages.The CES EduPack <strong>Eco</strong> <strong>Audit</strong> Tool 1 © 2012, <strong>Granta</strong> <strong>Design</strong>
Figure 2.Despite the formalism that attaches to LCAmethods, the results are subject toconsiderable uncertainty. Resource andenergy inputs can be monitored in astraightforward and reasonably precise way.The emissions rely more heavily onsophisticated monitoring equipment—few areknown to better than 10%. Assessments ofimpacts depend on values for the marginaleffect of each emission on each impactcategory; many of these have much greateruncertainties. Moreover, a full LCA is timeconsuming,expensive, and requires muchdetail, and it cannot cope with the problemthat 80% of the environmental burden of aproduct is determined in the early stages ofdesign when many decisions are still fluid.LCA is a product assessment tool, not adesign tool.And there is a further difficulty: what is adesigner supposed to do with these numbers?The designer, seeking to cope with the manyinterdependent decisions that any designinvolves, inevitably finds it hard to know howbest to use data of this type. How are CO 2 andSO x productions to be balanced againstresource depletion, energy consumption,global warming potential, or human toxicity?This perception has led to efforts to condensethe eco information about a material’sproduction into a single measure or indicator,normalizing and weighting each source ofstress to give the designer a simple, numericranking. The use of a single-valued indicator iscriticized by some on the grounds that there isno agreement on normalization or weightingfactors and that the method is opaque sincethe indicator value has no simple physicalsignificance.On one point, however, there is a degree ofinternational agreement: a commitment to aprogressive reduction in carbon emissions,generally interpreted as meaning CO 2 . At thenational level the focus is more on reducingenergy consumption, but since this and CO 2production are closely related, reducing onegenerally reduces the other. Thus there is acertain logic in basing design decisions onenergy consumption or CO 2 generation; theycarry more conviction than the use of a moreobscure indicator, as evidenced by the nowstandardreporting of both energy efficiencyand the CO 2 emissions of cars, and theenergy rating and ranking of appliances. Weshall follow this route.The need, then, is for a product-assessmentstrategy that addresses current concerns andcombines acceptable cost burden withsufficient precision to guide decision-making.It should be flexible enough to accommodatefuture refinement and simple enough to allowrapid “What-if” exploration of alternatives. Toachieve this it is necessary to strip-off much ofthe detail, multiple targeting, and complexitythat makes standard LCA methods socumbersome.Figure 2. Typical LCA output showing three categories:resource consumption, emission inventory, and impactassessment (data in part from reference (4)).The CES EduPack <strong>Eco</strong> <strong>Audit</strong> Tool 2 © 2012, <strong>Granta</strong> <strong>Design</strong>
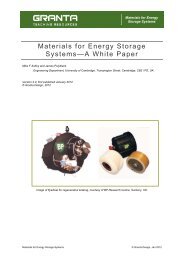
3. The approachThe approach developed here has threecomponents.1. Adopt simple measures ofenvironmental stress.Section 2 points to the use of energy or CO 2footprint as logical choices for measuringenvironmental stress, rather than combinedindicators. If we wanted to pick just one ofthese, energy has the merit that it is theeasiest to monitor, can be measured withrelative precision and, with appropriateprecautions, can when needed be used as aproxy for CO 2 .2. Distinguish the phases of life.Figure 3 suggests the breakdown, assigning afraction of the total life-energy demands of aproduct to material creation, productmanufacture, transport, and product use anddisposal. Product disposal can take manydifferent forms, some carrying an energypenalty, some allowing energy recycling orrecovery. When this distinction is made, it isfrequently found that one of phases ofFigure 3. Breakdown of energy into that associated witheach life-phase.Figure 1 dominates the picture. Figure 4presents the evidence. The upper row showsan approximate energy breakdown for threeclasses of energy-using products: a civilaircraft, a family car, and an appliance: for allthree the use-phase consumes more energythan the sum of all the others. The lower rowshows products that require energy during theuse-phase of life, but not as intensively asthose of the upper row. For these, theembodied energies of the materials of whichthey are made often dominate the picture.Two conclusions can be drawn. The first: onephase frequently dominates, accounting forFigure 4. Approximate values for the energy consumed at each phase of Figure 1 for a range of products (data fromrefs. (5) and (6)). The disposal phase is not shown because there are many alternatives for each product.The CES EduPack <strong>Eco</strong> <strong>Audit</strong> Tool 3 © 2012, <strong>Granta</strong> <strong>Design</strong>
60% or more of the energy—often much more.If large energy savings are to be achieved, it isthe dominant phase that becomes the firsttarget since it is here that a given fractionalreduction makes the biggest contribution. Thesecond: when differences are as great asthose of Figure 4, great precision is notnecessary—modest changes to the input dataleave the ranking unchanged. It is the natureof people who measure things to wish to do sowith precision, and precise data must be theultimate goal. But it is possible to moveforward without it: precise judgments can bedrawn from imprecise data.3. Base the subsequent action on theenergy or carbon breakdown.Figure 5 suggests how the strategy can beimplemented. If material production is thedominant phase, then minimizing the mass ofmaterial used and choosing materials with lowembodied energy are logical ways forward. Ifmanufacture is an important energy-usingphase of life, reducing processing energiesbecomes the prime target. If transport makesa large contribution, then seeking a moreefficient transport mode or reducing distancebecomes the first priority. When the usephasedominates the strategy is that ofminimizing mass (if the product is part of asystem that moves), or increasing thermalefficiency (if a thermal or thermo-mechanicalsystem), or reducing electrical losses (if anelectro-mechanical system). In general thebest material choice to minimize one phasewill not be the one that minimizes the others,requiring trade-off methods to guide thechoice. A full description of these and othermethods for materials selection can be foundin reference (2).Implementation requires tools. Two sets areneeded, one to perform the eco auditsketched in the upper part of Figure 5, theother to enable the analysis and selectionsketched in the lower part. The purpose of thiswhite paper is to describe the first: the <strong>Eco</strong><strong>Audit</strong> Tool.4. The <strong>Eco</strong> <strong>Audit</strong> ToolFigure 6 shows the structure of the tool. Theinputs are of two types. The first are drawnfrom a user-entered bill of materials, processchoice, transport requirements and duty cycleFigure 5. Rational approaches to the eco design of products start with an analysis of the phase of lifeto be targeted. Its results guide redesign and materials selection to minimize environmental impact.The CES EduPack <strong>Eco</strong> <strong>Audit</strong> Tool 4 © 2012, <strong>Granta</strong> <strong>Design</strong>
(the details of the energy and intensity of use),and disposal route. Data for embodiedenergies and process energies are drawnfrom a database of material properties; thosefor the energy and carbon intensity oftransport and the energy sources associatedwith use are drawn from look-up tables. Theoutputs are the energy or carbon footprint ofeach phase of life, presented as bar chartsand in tabular form.Figure 6. The <strong>Eco</strong> <strong>Audit</strong> Tool. The model combinesuser-defined inputs with data drawn from databases ofembodied energy of materials, processing energies, andtransport type to create the energy breakdown. Thesame tool can be used for an assessment of CO 2footprint.The tool in detail. The tool is opened fromthe “Tools” menu of the CES EduPacksoftware toolbar by clicking on “<strong>Eco</strong> <strong>Audit</strong>”.Figure 7 (overleaf) is a schematic of the userinterface that shows the user actions and theconsequences. There are four steps, labeled1, 2, 3, and 4. Actions and inputs are shown inred.Step 1, material and manufacture allowsentry of the mass, the material and primaryshaping process for each component. Thecomponent name is entered in the first box.The material is chosen from the pull-downmenu of box 2, opening the database ofmaterials properties 1 . Selecting a materialfrom the tree-like hierarchy of materialscauses the tool to retrieve and store itsembodied energy and CO 2 footprint per kg.The primary shaping process is chosen fromthe pull-down menu of box 3, which lists theprocesses relevant for the chosen material;the tool again retrieves energy and carbonfootprint per kg. The last box allows thecomponent weight to be entered in kg. Oncompleting a row-entry a new row appears forthe next component.On a first appraisal of the product it isfrequently sufficient to enter data for thecomponents with the greatest mass,accounting for perhaps 95% of the total. Theresidue is included by adding an entry for“residual components” giving it the massrequired to bring the total to 100% andselecting a proxy material and process:“polycarbonate” and “molding” are goodchoices because their energies and CO 2 lie inthe mid range of those for commoditymaterials.The tool multiplies the energy and CO 2 per kgof each component by its mass, and totalsthem. In its present form the data for materialsare comprehensive. Those for processes arerudimentary.Dealing with end of life. There are fiveoptions for disposal at the end of life: landfill,combustion for energy recovery, recycling, reengineer,and reuse. A product at end of firstlife (Figure 8) has the ability to return part orall of its embodied energy. This at first soundswrong—much of the “embodied” energy wasnot embodied at all but was lost as low-gradeheat via the inefficiencies of the processingplant, and even when it is still there, it is, formetals and ceramics, inaccessible since theonly easy way to recover energy directly is by1 One of the CES EduPack Materials databases,depending on which was chosen when the software wasopened.The CES EduPack <strong>Eco</strong> <strong>Audit</strong> Tool 5 © 2012, <strong>Granta</strong> <strong>Design</strong>
combustion, not an option for steel, concrete,or brick. But think of it another way. If thematerials of the product are recycled or theproduct itself is re-engineered or reused, aneed is filled without drawing on virginmaterial, thereby saving energy. Carbonrelease works in the same way, with one littletwist: one end-of-life option, combustion,recovers some energy but in doing so itreleases CO 2 .Recycling passes material from one life-cycleto the next. In general it takes less energy andreleases less carbon to recycle a unit ofmaterial than it takes to create the samequantity of virgin material from ores andfeedstock—it is this that makes recyclingattractive. But is the saved energy and CO 2 tobe credited to the first life-cycle or thesecond? It can’t be credited to both, since thatwould be to count it twice. This difficulty isanalyzed in depth in references (2) and (3).Here we describe the way the <strong>Eco</strong> <strong>Audit</strong> Tooldeals with the problem.Recycling at end of life is a future benefit, onethat may not be realized for many years or,indeed, at all. If the concern is for presentresources, energy demands and climatechangingemissions, then it does not makesense to use the substitution method. Wetherefore assign a credit to the use ofmaterials with recycle content at the start oflife, and give no credit for recycling at the endThis focuses attention on the present, not thefuture, it avoids double counting and itconforms to the European guide-lines onassessing carbon footprint known asPAS 2050 and BSI 2008.But this choice still leaves us with a difficulty.One purpose of an eco-audit is to guidedesign decisions. <strong>Design</strong>ers that strive todesign products using recycled materials willwish the eco-audit to reflect this, as therecycled content method does. On the otherhand, designers that strive to makedisassembly easy and to use materials thatrecycle well would also want the audit toreflect that, and the recycled content methodfails to do so. To overcome this we show barsfor the energy and carbon contributions to thefirst life as bars of solid colors, and show thepotential energy and carbon saving (orpenalty) arising from the end-of-life (EoL)choice as a separate, cross-hatched bar as inFigure 8.Step 2, transport allows for transportation ofthe product from manufacturing site to point ofsale. The tool allows multi-stage transport(e.g., shipping then delivery by truck). To useit, the stage is given a name, a transport typeis selected from the pull-down “transport type”menu and a distance is entered in km ormiles. The tool retrieves the energy / tonne.kmand the CO 2 / tonne.km for the chosentransport type from a look-up table andmultiplies them by the product weight and thedistance travelled, finally summing the stages.Step 3, the use phase requires a littleexplanation. There are two different classes ofcontribution.Some products are (normally) static butrequire energy to function: electricallypowered household or industrial products likehairdryers, electric kettles, refrigerators, powertools, and space heaters are examples. Evenapparently non-powered products, likehousehold furnishings or unheated buildings,still consume some energy in cleaning,lighting, and maintenance. The first class ofcontribution, then, relates to the powerconsumed by, or on behalf of, the productitself.The second class is associated with transport.Products that form part of a transport systemadd to its mass and so augment its energyconsumption and CO 2 burden.The user-defined inputs of step 3 enable theanalysis of both. Ticking the “static mode” boxopens an input window. The primary sourcesof energy are taken to be fossil fuels (oil, gas).The energy consumption and CO 2 burdendepend on a number of efficiency factors.When energy is converted from one form toanother, some energy may be lost.The CES EduPack <strong>Eco</strong> <strong>Audit</strong> Tool 6 © 2012, <strong>Granta</strong> <strong>Design</strong>
Figure 7. The <strong>Eco</strong> <strong>Audit</strong> Tool.
Figure 8. The 1 st -life energy and carbon emissions, compared with potential end-of-life credit.When fossil fuel or electricity are convertedinto heat, there are no losses—the efficiencyis 100%. But when energy in the form of fossilfuel is converted to electrical energy theconversion efficiency is, on average 2 , about33%. The direct conversion of primary energyto mechanical power depends on the input: forelectricity it is between 85 and 90%; for fossilfuel it is, at best, 40%. Selecting an energyconversion mode causes the tool to retrievethe efficiency and multiply it by the power andthe duty cycle—the usage over the productlife—calculated from the life in years times thedays per year times the hours per day.Products that are part of a transport systemcarry an additional energy and CO 2 penalty bycontributing to its weight. The mobile modepart of step 3 gives a pull-down menu to selectthe fuel and mobility type. On entering theusage and daily distance the tool calculatesthe necessary energy.Step 4, the final step, clicking “report”completes the calculation. The Appendixshows example output.5. Case studiesAn eco audit is a fast initial assessment. Itidentifies the phases of life—material,manufacture, transport, and use—that carrythe highest demand for energy or create the2 Modern dual-cycle power stations achieve anefficiency around 40%, but averaged over all stations,some of them old, the efficiency is less.greatest burden of emissions. It points thefinger, so to speak, identifying where thegreatest gains might be made. Often, onephase of life is, in eco terms, overwhelminglydominant, accounting for 60% or more of theenergy and carbon totals. This difference is solarge that the imprecision in the data and theambiguities in the modeling are not an issue;the dominance remains even when the mostextreme values are used. It then makes senseto focus first on this dominant phase, since itis here that the potential innovative materialchoice to reduce energy and carbon aregreatest. As we shall see later, materialsubstitution has more complex aspects—thereare trade-offs to be considered—but for nowwe focus on the simple audit.This section outlines case studies that bringout the strengths and weaknesses of the <strong>Eco</strong><strong>Audit</strong> Tool. Its use is best illustrated by a casestudy of extreme simplicity—that of a PETdrink bottle—since this allows the inputs andoutputs to be shown in detail. The casestudies that follow it are presented in lessdetail.Bottled waterOne brand of bottled water is sold in 1 literPET bottles with polypropylene caps (similarto that in Figure 9). A bottle weighs 40 grams;the cap 1 gram. Bottles and caps are molded,filled, transported 550km from the French Alpsto London, England, by 14 tonne truck,refrigerated for 2 days requiring 1 m 3 ofrefrigerated space at 4 o C and then sold.The CES EduPack <strong>Eco</strong> <strong>Audit</strong> Tool 8 © 2012, <strong>Granta</strong> <strong>Design</strong>
Table 1 shows the data entered in the <strong>Eco</strong><strong>Audit</strong> Tool.Table 1. The inputs.Product name: PET bottle, bill of materials.Life: 1 year.Step 1: Materials and manufacture: 100 unitsComponentnameMaterial Process Mass(kg)Bottle, 100 units PET Molded 4Cap, 100 units PP Molded 0.1Dead weight(100 liters ofwater)Water 100Step 2: TransportStage nameTransport of filledbottlesTransport Distance (km)type14 tonne truck 550Step 3: Use phase: static mode – refrigeration iEnergy inputand outputElectric tomechanicalPowerrating(kw)Usage(hr / day)Usage(days /year)0.12 24 2i The energy requirements for refrigeration, based on A-ratedappliances are 10.5 MJ/m 3 .day for refrigeration at 4 o C and13.5 MJ/m 3 .day for freezing at -5 o C. The use energy is chosento give the value for refrigeration.What has the tool done? For step 1 itretrieved from the database the energies andCO 2 profiles of the materials and theprocesses 3 . What it found there are ranges forthe values. It created the (geometric) mean ofthe range, storing the values shown below:Material and primarymanufacturingprocessEmbodiedenergy(MJ/kg)CO 2footprint(kg/kg)PET, material 84 2.3PP, material 95 2.7Polymer molding 6.8 0.53It then multiplied these by the mass of eachmaterial, summing the results to give totalenergy and carbon.For step 2 it retrieved the energy and CO 2profile of the selected transport mode from alook-up table, finding:TransporttypeEnergy(MJ / tonne.km)CO 2 footprint(kg CO 2 /tonne.km)14 tonne truck 0.87 0.062It then multiplies these by the total weight ofthe product and the distance traveled. If morethan one transport stage is entered, the toolsums them, storing the sum. For step 3 thetool retrieves an efficiency factor for thechosen energy conversion mode (here electricto mechanical because the refrigeration unit isa mechanical pump driven by an electricmotor), finding in its look-up table:Energy input andoutputElectric to mechanical 0.28Efficiency factor relative tooilThe tool uses this and the user-entered valuesfor power and usage to calculate the energyand CO 2 profile of the use phase. For the finalstep 4 the tool retrieved (if asked to do so) theFigure 9. A 1 liter PET water bottle.The calculation is for 100 units.3 Data are drawn from the CES EduPack Level 2 or 3database, according to choice.The CES EduPack <strong>Eco</strong> <strong>Audit</strong> Tool 9 © 2012, <strong>Granta</strong> <strong>Design</strong>
ecycle energy and recycle fraction in currentsupply for each material and replaced theenergy and CO 2 profiles for virgin materials(the default) with values for materials madewith this fraction of recycled content.Finally it created a bar chart and summary ofenergy or CO 2 according to user choice and areport detailing the results of each step of thecalculation. The bar charts are shown inFigure 10. Table 2 shows the summary.PhaseTable 2. PET bottle, energy, andcarbon summary, 100 units.Energy(MJ)Figure 10. The energy and the carbon footprint bar-charts generatedby the <strong>Eco</strong> <strong>Audit</strong> Tool for the bottles.Energy(%)CO 2(kg)CO 2(%)Material 344 68 9.6 48Manufacture 36 7 3.2 16Transport 48 10 3.4 17Use 74. 15 3.7 19Total 503 100 19.9 100What do we learn from these outputs? Thegreatest contributions to energy consumptionand CO 2 generation derive from production ofthe polymers used to make the bottle. (Thecarbon footprint of manufacture, transport,and use is proportionally larger than theirenergy burden, because of the inefficienciesof the energy conversions they involve). Thesecond largest is the short, two-day,refrigeration energy. The seeminglyextravagant part of the life cycle—that oftransporting water, 1 kg per bottle, 550 kmfrom the French Alps to the diner’s table inLondon—in fact contributes 10% of the totalenergy and 17% of the total carbon. If genuineconcern is felt about the eco impact of drinkingwater which has been transported overhundreds of miles, then (short of giving it up) itis the bottle that is the primary target. Could itbe made thinner, using less PET? (Suchbottles are 30% lighter today than they were15 years ago). Is there a polymer that is lessenergy intensive than PET? Could the bottlesbe made reusable (and of sufficientlyattractive design that people would wish toreuse them)? Could recycling of the bottles bemade easier? These are design questions, thefocus of the lower part of Figure 5. Methodsfor approaching them are detailed inreferences (1) and (2).The CES EduPack <strong>Eco</strong> <strong>Audit</strong> Tool 10 © 2012, <strong>Granta</strong> <strong>Design</strong>
An overall reassessment of the eco impact ofthe bottles should, of course, explore ways ofreducing energy and carbon in all four phasesof life, seeking the most efficient moldingmethods, the least energy intensive transportmode (32 tonne truck, barge), and minimizingthe refrigeration time.Electric jug kettleFigure 11 shows a typical kettle. The bill ofmaterials is listed in Table 3. The kettle ismanufactured in South East Asia andtransported to Europe by air freight, a distanceof 11,000 km, then distributed by 24 tonnetruck over a further 250 km. The power ratingis 2 kW, and the volume 1.7 liters.Table 3. Jug kettle, bill of materials. Life: 3 years.Component Material ProcessKettle bodyHeatingelementCasing,heatingelementCablesheath,1 meterCable core,1 meterPlug bodyPlug pinsPackaging,paddingPackaging,boxPolypropylene(PP)NickelchromiumalloysStainlesssteelNaturalRubber (NR)CopperPhenolicBrassRigid polymerfoam, MDPolymermoldingForging,rollingForging,rollingPolymermoldingForging,rollingPolymermoldingForging,rollingPolymermoldingMass(kg)0.860.0260.090.060.0150.0370.030.015Cardboard Construction 0.125Despite only using it for 9 minutes per day, theelectric power (or, rather, the oil equivalent ofthe electric power, since conversionefficiencies are included in the calculation)accounts for 95% of the total. Improving ecoperformance here has to focus on this useenergy—even a large change, 50% reduction,say, in any of the others makes insignificantdifference. So thermal efficiency must be thetarget. Heat is lost through the kettle wall—selecting a polymer with lower thermalconductivity, or using a double wall withinsulation in the gap, could help here—itwould increase the embodied energy of thematerial column, but even doubling this leavesit small. A full vacuum insulation would be theultimate answer—the water not used when thekettle is boiled would then remain close toboiling point for long enough to be useful thenext time hot water is needed. The energyextravagance of air-freight makes only 3% ofthe total. Using sea freight instead increasesthe distance to 17,000 km, but reduces thetransport energy per kettle to 2.8 MJ, a mere1% of the total.Table 4. The energy analysis of the jug kettle.Phase Life energy (MJ) Energy (%)Material 107 2.8Manufacture 6.9 0.18Transport 115 3.0Use 3583 93.9Total 3813 100The kettle boils 1 liter of water in 3 minutes. Itis used, on average, 3 times per day over alife of 3 years.The bar chart in Figure 12 shows the energybreakdown delivered by the tool. Table 4shows the summary.Here, too, one phase of life consumes farmore energy than all the others put together.Figure 11. A 2 kW jug kettle.The CES EduPack <strong>Eco</strong> <strong>Audit</strong> Tool 11 © 2012, <strong>Granta</strong> <strong>Design</strong>
Figure 12. The energy and carbon bar-charts generated by the <strong>Eco</strong> <strong>Audit</strong> Tool for the jug kettle.Family car—comparing material embodiedenergy with use energyIn this example, we use the <strong>Eco</strong> <strong>Audit</strong> Tool tocompare material embodied energy with useenergy. Table 5 lists one automaker’ssummary of the material content of a midsizedfamily car (Figure 13). There is enoughinformation here to allow a rough comparisonof embodied energy with use energy using the<strong>Eco</strong> <strong>Audit</strong> Tool. We ignore manufacture andtransport, focusing only on material and use.Material proxies for the vague materialdescriptions are given in brackets.A plausible use-phase scenario is that of aproduct life of 10 years, driving 25,000 km(15,000 miles) per year, using gasoline power.Table 5. Material content of an 1800 kg family car.Material contentSteel (Low alloy steel) 850Aluminum (Cast aluminum alloy) 438Thermoplastic polymers (PU, PVC) 148Thermosetting polymers (Polyester) 93Elastomers (Butyl rubber) 40Glass (Borosilicate glass) 40Other metals (Copper) 61Textiles (Polyester) 47Mass (kg)The bar chart of Figure 14 shows thecomparison, plotting the data in the tablebelow the figure (energies converted to GJ).The input data are of the most approximatenature, but it would take very largediscrepancies to change the conclusion: theenergy consumed in the use phase (here84%) greatly exceeds that embodied in thematerials of the vehicle.Figure 13. A mid size family car weighting 1800kgFigure 14. <strong>Eco</strong> <strong>Audit</strong> Tool output for the car detailed inTable 5, comparing embodied energy and use energybased on a life-distance of 250,000 km.Phase Energy (GJ) Energy (%)Material 162 16Use 884 84Total 1046 100The CES EduPack <strong>Eco</strong> <strong>Audit</strong> Tool 12 © 2012, <strong>Granta</strong> <strong>Design</strong>
Figure 15. The comparison of the energy audits of a steel and an aluminum fender for a family car.Auto bumpers—exploring substitutionThe bumpers of a car are heavy; making themlighter can save fuel. Here we explore thereplacement of a steel bumper with one ofequal performance made from aluminum(Figure 16). The steel bumper weighs 14 kg;the aluminum substitute weighs 10, areduction in weight of 28%. But the embodiedenergy of aluminum is much higher than thatof steel. Is there a net saving?The bar charts on the left of Figure 15(overleaf) compare the material and useenergy, assuming the use of virgin materialand that the bumper is mounted on agasoline-powered family car with a life“mileage” of 250,000 km (150,000 miles). Thesubstitution results in a large increase inmaterial energy and a drop in use energy. Thetwo left-hand columns of table 6 below list thetotals: the aluminum substitute wins (it has alower total) but not by much—the break-evencomes at about 200,000 km. And it costsmore.But this is not quite fair. A product like thiswould, if possible, incorporate recycled as wellas virgin material. Clicking the box for “Includerecycle fraction” in the tool recalculates thematerial energies using the recycle content incurrent supply with the recycle energy for thisfraction 4 . The columns of the table list the newvalues. The aluminum bumper loses abouthalf of its embodied energy. The steel bumperloses a little too, but not as much. The energysaving at a life of 250,000 km is considerablylarger, and the break-even (found by runningthe tool for progressively shorter mileage untilthe total energy for aluminum and steelbecome equal) is below 100,000 km.Table 6. Material energies and use energies for steeland aluminum bumpers.SteelVirgin materialEnergy(MJ)Fraction(%)With recyclecontentEnergy(MJ)Fraction(%)Material: steel 446 6 314 4(14 kg)Use:7210 94 7210 96250,000 kmTotal 7691 100 7567 100AluminumMaterial: 2088 29 1063 17aluminum(10 kg)Use:5150 71 5150 83250,000 kmTotal 7275 100 6250 1004 Caution is needed here: the recycle fraction ofaluminum in current supply is 55%, but not all alloygrades can accept as much recycled material as this.Figure 16. An automobile bumper.The CES EduPack <strong>Eco</strong> <strong>Audit</strong> Tool 13 © 2012, <strong>Granta</strong> <strong>Design</strong>
A portable space heaterThe space heater in Figure 17 is carried asequipment on a light goods vehicle used forrailway repair work. A bill of materials for thespace heater is shown in Table 7 (overleaf). Itburns 0.66 kg of LPG per hour, delivering anoutput of 9.3 kW (32,000 BTU). The air flow isdriven by a 38 W electric fan. The heaterweighs 7 kg. The (approximate) bill of principalmaterials is listed in the table. The product ismanufactured in South Korea, and shipped tothe US by sea freight (10,000 km) then carriedby 32 tonne truck for a further 600 km to thepoint of sale. It is anticipated that the vehiclecarrying it will travel, on average, 420 km perweek, over a 3-year life, and that the heateritself will be used for 2 hours per day for20 days per year. This is a product that usesenergy during its life in two distinct ways. Firstthere is the electricity and LPG required tomake it function. Second, there is the energypenalty that arises because it increases theweight of the vehicle that carries it by 7 kg.What does the overall energy and CO 2 lifeprofile of the heater look like?The tool, at present, allows only one type ofstatic-use energy. The power consumed byburning LPG for heat (9.3 kW) far outweighsthat used to drive the small electric fan-motor(38 W), so we neglect this secondcontribution. It is less obvious how this staticuseenergy, drawn for only 40 hours per year,compares with the extra fuel-energyconsumed by the vehicle because of theproduct weight—remembering that, as part ofthe equipment, it is lugged over 22,000 km peryear. The <strong>Eco</strong> <strong>Audit</strong> Tool can resolve thisquestion.Table 7: Space heater, bill of materials. Life: 3 years.Component Material ProcessHeater casingFanAir flowenclosure(heat shield)Motor, rotor andstatorMotor, wiring:conductorsMotor, wiring:insulationConnectinghose, 2 meterHose connectorOthercomponentsLow carbonsteelLow carbonsteelStainlesssteelIronCopperPolyethyleneNaturalRubber (NR)BrassProxymaterial -polycarbonateForging,rollingForging,rollingForging,rollingForging,rollingForging,rollingPolymermoldingPolymermoldingForging,rollingProxy—polymermoldingMass(kg)5.40.250.40.130.080.080.350.090.22Figure 17. A space heater powered by liquid propanegas (LPG).Figure 18. The energy breakdown for the space heater.The use phase dominates.The CES EduPack <strong>Eco</strong> <strong>Audit</strong> Tool 14 © 2012, <strong>Granta</strong> <strong>Design</strong>
Figure 18 shows the summary bar-chart. Theuse energy (as with most energy-usingproducts) outweighs all other contributions,accounting for 94% of the total. The detailedreport (Appendix) gives a breakdown of eachcontribution to each phase of life. One of eighttables it contains is reproduced here(Table 8)—it is a summary of the relativecontributions of the two types of energyconsumption during use. The consumption ofenergy as LPG greatly exceeds that oftransport, despite the relatively short time overwhich it is used.Table 8. Relative contributions of static / mobile modes.Mode Energy (MJ) Energy (%)Static 4.5 x 10 3 87.4Mobile 6.4 x 10 2 12.6Total 5.1 x 10 3 100The CES EduPack <strong>Eco</strong> <strong>Audit</strong> Tool 15 © 2012, <strong>Granta</strong> <strong>Design</strong>
6. Summary and conclusions<strong>Eco</strong> aware product design has many aspects,one of which is the choice of materials.Materials are energy intensive, with highembodied energies and associated carbonfootprints. Seeking to use low-energymaterials might appear to be one way forward,but this can be misleading. Material choiceimpacts manufacturing, it influences theweight of the product and its thermal andelectrical characteristics and thus the energy itconsumes during use, and it influences thepotential for recycling or energy recovery atthe end of life. It is full-life energy that we seekto minimize.Doing so requires a two-part strategy outlinedin this <strong>White</strong> <strong>Paper</strong>. The first part is an ecoaudit: a quick, approximate assessment of thedistribution of energy demand and carbonemission over life. This provides inputs toguide the second part: that of materialselection to minimize the energy and carbonover the full life, balancing the influences ofthe choice over each phase of life. This <strong>White</strong><strong>Paper</strong> describes an <strong>Eco</strong> <strong>Audit</strong> Tool thatenables the first part. It is fast and easy touse, and although approximate, it deliversinformation with sufficient precision to enablethe second part of the strategy to beperformed, drawing on the same databases(available with CES EduPack). The use of thetool is illustrated with diverse case studies.The <strong>Eco</strong> <strong>Audit</strong> Tool does not provide a fullLCA, as such detail would come at a penaltyof complexity and difficulty of use that wouldrender it impractical as a design tool. Theversion available in CES EduPack wasdesigned for educational use, with somefurther simplifications relative to the Enhanced<strong>Eco</strong> <strong>Audit</strong> Tool available for industry andresearch; simplicity, in teaching, is itself avaluable feature.<strong>Granta</strong> plans to develop the tool further andwelcomes ideas, criticisms, and commentsfrom users 5 .5 Comments can be sent on-line by using the “Featurerequest” option in the CES EduPack software toolbar.The CES EduPack <strong>Eco</strong> <strong>Audit</strong> Tool 16 © 2012, <strong>Granta</strong> <strong>Design</strong>
References(1) Ashby, M.F. (2012) “Materials and theEnvironment—eco-informed material choice”,2 nd edition, Butterworth Heinemann, Oxford,UK.(2) Ashby, M.F. Miller, A. Rutter, F. Seymour,C. and Wegst U.G.K. “CES EduPack for <strong>Eco</strong><strong>Design</strong>—A <strong>White</strong> <strong>Paper</strong>” 5 th edition, <strong>Granta</strong><strong>Design</strong> Limited, Cambridge, (2011)(www.grantadesign.com)(2) Ashby, M.F. (2011) “Materials Selection inMechanical <strong>Design</strong>”, 4 th edition, Butterworth-Heinemann, Oxford, UK , Chapter 15(4) Boustead Model 4 (1999), BousteadConsulting, Black Cottage, West Grinstead,Horsham, West Sussex, RH13 7BD, Tel: +441403 864 561, Fax: +44 1403 865 284,(www.boustead-consulting.co.uk)(5) Bey, N. (2000) “The Oil Point Method: atool for indicative environmental evaluation inmaterial and process selection” PhD thesis,Department of Manufacturing Engineering,IPT Technical University of Denmark,Copenhagen, Denmark.(6) Allwood, J.M., Laursen, S.E., deRodriguez, C.M. and Bocken, N.M.P. (2006)“Well dressed? The present and futuresustainability of clothing and textiles in theUnited Kingdom”, University of Cambridge,Institute for Manufacturing, Mill Lane,Cambridge CB2 1RX, UKISBN 1-902546-52-0.Appendix: An <strong>Eco</strong> <strong>Audit</strong> ReportOn the following pages, we reproduce the<strong>Eco</strong> <strong>Audit</strong> Report generated by the <strong>Eco</strong> <strong>Audit</strong>Tool for the water bottle case study describedin the text.The CES EduPack <strong>Eco</strong> <strong>Audit</strong> Tool 17 © 2012, <strong>Granta</strong> <strong>Design</strong>
<strong>Eco</strong> <strong>Audit</strong> ReportProduct NameBottled mineral water (100 units)Product Life (years) 1Energy and CO2 Footprint Summary:Energy Details...CO2 Details...Phase Energy (MJ) Energy (%) CO2 (kg) CO2 (%)Material 344 65.5 9.58 43.2Manufacture 78.6 15.0 5.89 26.6Transport 48.7 9.3 3.46 15.6Use 50.8 9.7 3.05 13.8Disposal 2.82 0.5 0.197 0.9Total (for first life) 525 100 22.2 100End of life potential -194 -5.4Bottled mineral water(Levels 1&2).prdNOTE: Differences of less than 20% are not usually significant. Page 1 of 3See notes on precision and data sources. 12 October 2011
<strong>Eco</strong> <strong>Audit</strong> ReportEnergy AnalysisEnergy and CO2 SummaryEnergy (MJ)/yearEquivalent annual environmental burden (averaged over 1 year product life): 523Detailed breakdown of individual life phasesMaterial:Energy and CO2 SummaryComponentBottles (100 units)MaterialPolyethylene terephthalate(PET)Recycledcontent* (%)Partmass(kg)Qty.Total massEnergy(MJ)Virgin (0%) 4 1 4 3.3e+02 97.3%Caps(100 units) Polypropylene (PP) Virgin (0%) 0.1 1 0.1 9.4 2.7Dead weight (100 litres ofwater)1e+02 1 1e+02 0 0.0Total 3 1e+02 3.4e+02 100*Typic: Includes 'recycle fraction in current supply'Manufacture:Energy and CO2 SummaryComponent Process Amount processed Energy (MJ) %Bottles (100 units) Polymer molding 4 kg 77 97.3Caps(100 units) Polymer molding 0.1 kg 2.1 2.7Total 79 100Transport:Energy and CO2 SummaryBreakdown by transport stage Total product mass = 1e+02 kgStage name Transport type Distance (km) Energy (MJ) %Filling plant - Point of sale 14 tonne truck 5.5e+02 49 100.0Total 5.5e+02 49 100Breakdown by componentsComponent Component mass (kg) Energy (MJ) %Bottles (100 units) 4 1.9 3.8Caps(100 units) 0.1 0.047 0.1Dead weight (100 litres of water) 1e+02 47 96.1Total 1e+02 49 100Bottled mineral water(Levels 1&2).prdNOTE: Differences of less than 20% are not usually significant. Page 2 of 5See notes on precision and data sources. 12 October 2011
Use:Energy and CO2 SummaryStatic modeEnergy input and output typeUse locationElectric to mechanical(electric motors)WorldPower rating (kW) 0.12Usage (hours per day) 24Usage (days per year) 2Product life (years) 1Relative contribution of static and mobile modesMode Energy (MJ) %Static 51 100.0Mobile 0Total 51 100Disposal:Energy and CO2 SummaryComponentEnd of lifeoptionEnergy(MJ)%Bottles (100 units) Recycle 2.8 99.3Caps(100 units) Landfill 0.02 0.7Dead weight (100 litres of water) None 0 0.0Total 2.8 100EoL potential:ComponentEnd of lifeoptionEnergy(MJ)%Bottles (100 units) Recycle -1.9e+02 100.0Caps(100 units) Landfill 0 0.0Dead weight (100 litres of water) None 0 0.0Total -1.9e+02 100Notes:Energy and CO2 SummaryStatic Mode: Energy used to refrigerate product at point of saleEnergy required to refrigerate 100 bottles at 4°C = 0.12kWBottled mineral water(Levels 1&2).prdNOTE: Differences of less than 20% are not usually significant. Page 3 of 5See notes on precision and data sources. 12 October 2011
<strong>Eco</strong> <strong>Audit</strong> ReportCO2 Footprint AnalysisEnergy and CO2 SummaryCO2 (kg)/yearEquivalent annual environmental burden (averaged over 1 year product life): 22.2Detailed breakdown of individual life phasesMaterial:Energy and CO2 SummaryComponentBottles (100 units)MaterialPolyethylene terephthalate(PET)Recycledcontent* (%)Partmass(kg)Qty.Total massCO2footprint(kg)Virgin (0%) 4 1 4 9.3 97.2%Caps(100 units) Polypropylene (PP) Virgin (0%) 0.1 1 0.1 0.27 2.8Dead weight (100 litres ofwater)1e+02 1 1e+02 0 0.0Total 3 1e+02 9.6 100*Typic: Includes 'recycle fraction in current supply'Manufacture:Energy and CO2 SummaryComponent Process Amount processedCO2footprint(kg)%Bottles (100 units) Polymer molding 4 kg 5.7 97.3Caps(100 units) Polymer molding 0.1 kg 0.16 2.7Total 5.9 100Transport:Energy and CO2 SummaryBreakdown by transport stageTotal product mass = 1e+02 kgStage name Transport type Distance (km)CO2 footprint(kg)%Filling plant - Point of sale 14 tonne truck 5.5e+02 3.5 100.0Total 5.5e+02 3.5 100Breakdown by componentsComponentComponent mass (kg)CO2 footprint(kg)%Bottles (100 units) 4 0.13 3.8Caps(100 units) 0.1 0.0033 0.1Bottled mineral water(Levels 1&2).prdNOTE: Differences of less than 20% are not usually significant. Page 4 of 5See notes on precision and data sources. 12 October 2011
Dead weight (100 litres of water) 1e+02 3.3 96.1Total 1e+02 3.5 100Use:Energy and CO2 SummaryStatic modeEnergy input and output typeUse locationElectric to mechanical(electric motors)WorldPower rating (kW) 0.12Usage (hours per day) 24Usage (days per year) 2Product life (years) 1Relative contribution of static and mobile modesMode CO2 footprint (kg) %Static 3.1 100.0Mobile 0Total 3.1 100Disposal:Energy and CO2 SummaryComponentEnd of lifeoptionCO2footprint(kg)%Bottles (100 units) Recycle 0.2 99.3Caps(100 units) Landfill 0.0014 0.7Dead weight (100 litres of water) None 0 0.0Total 0.2 100EoL potential:ComponentEnd of lifeoptionCO2footprint(kg)%Bottles (100 units) Recycle -5.4 100.0Caps(100 units) Landfill 0 0.0Dead weight (100 litres of water) None 0 0.0Total -5.4 100Notes:Static Mode: Energy used to refrigerate product at point of saleEnergy required to refrigerate 100 bottles at 4°C = 0.12kWEnergy and CO2 SummaryBottled mineral water(Levels 1&2).prdNOTE: Differences of less than 20% are not usually significant. Page 5 of 5See notes on precision and data sources. 12 October 2011