Sampling comparison among Hirst spore traps of the same model
Sampling comparison among Hirst spore traps of the same model
Sampling comparison among Hirst spore traps of the same model
Create successful ePaper yourself
Turn your PDF publications into a flip-book with our unique Google optimized e-Paper software.
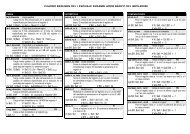
Daily data <strong>comparison</strong>sTotal Cupresaceae Ulmust df sig. t df sig. t df sig.ST1-ST2 1,999 19 0,060 0,834 19 0,415 0,983 19 0,338ST1-ST4 1,908 19 0,072 -0,969 19 0,345 -1,057 19 0,304ST1-STT 3,096 19 0,006 1,743 19 0,097 2,581 19 0,018ST2-ST3 -0,197 13 0,847 0,159 13 0,876 -0,567 13 0,580ST2-ST4 0,359 33 0,722 -0,910 33 0,370 0,193 33 0,848ST2-STT 2,204 33 0,035 1,893 33 0,067 2,472 33 0,019ST3-ST4 1,382 30 0,177 0,852 30 0,401 1,615 30 0,117ST3-STT 2,155 30 0,039 2,141 30 0,040 3,412 30 0,002ST4-STT 2,827 50 0,007 3,562 50 0,001 3,534 50 0,001T-test paired <strong>comparison</strong>s after data normalization using logarithmic transformation,In bold statistically significant differences. Degree <strong>of</strong> freedom: df=n-1.ST1-4: Spore <strong>traps</strong> at ground levelSTT: Spore trap over <strong>the</strong> terrace<strong>Sampling</strong> <strong>comparison</strong> <strong>Hirst</strong> <strong>spore</strong> <strong>traps</strong> 12


