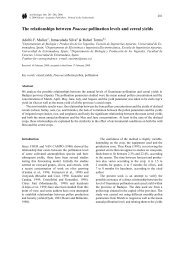
Sampling comparison among Hirst spore traps of the same model
Sampling comparison among Hirst spore traps of the same model
Sampling comparison among Hirst spore traps of the same model

Create successful ePaper yourself
Turn your PDF publications into a flip-book with our unique Google optimized e-Paper software.
Average concentrationNum days 20 34 31 51 51ST1 ST2 ST3 ST4 STTTotal 81,3 93,1 98,1 64,6 59,1Cupressaceae 41,5 58,7 67,8 41,0 34,1Ulmus 26,8 21,7 12,8 12,5 10,9Fraxinus-Phillyrea 3,6 3,5 2,5 0,6 1,0O<strong>the</strong>rs 3,3 3,2 3,0 3,0 3,7Alnus glutinosa 3,3 2,0 0,5 0,9 1,5Alternaria 2,1 4,6 4,5 2,7 1,6Urticaceae pp. 1,0 1,3 0,9 0,3 1,3Poaceae 0,8 1,0 1,7 1,3 1,6Urtica membranacea 0,6 0,5 2,0 2,5 1,7Rumex 0,3 1,0 1,6 0,6 1,1An<strong>the</strong>mideae 0,1 0,0 0,0 0,1 0,0Pinaceae 0,0 0,1 1,4 0,5 0,6Plantago 0,0 0,0 0,0 0,1 0,0Platanus hispanica 0,0 0,0 0,4 0,4 0,7Quercus 0,0 0,0 3,5 0,5 0,7Average pollen and Alternaria <strong>spore</strong> concentration per cubicmeter sorted according concentration <strong>of</strong> each typeSpore Traps: ST1-4 ground level, STT terrace<strong>Sampling</strong> <strong>comparison</strong> <strong>Hirst</strong> <strong>spore</strong> <strong>traps</strong> 10