Sampling comparison among Hirst spore traps of the same model
Sampling comparison among Hirst spore traps of the same model
Sampling comparison among Hirst spore traps of the same model

Create successful ePaper yourself
Turn your PDF publications into a flip-book with our unique Google optimized e-Paper software.
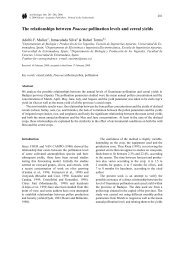
<strong>Sampling</strong> <strong>comparison</strong> <strong>among</strong> <strong>Hirst</strong><strong>spore</strong> <strong>traps</strong> <strong>of</strong> <strong>the</strong> <strong>same</strong> <strong>model</strong>José María Maya Manzano 1 , Santiago Fermández Rodríguez 1 ,Angela Gonzalo Garijo 2 , Inmaculada Silva Palacios 1 ,Rafael Tormo Molina 11University <strong>of</strong> Extremadura (Spain)2Hospital Infanta Cristina <strong>of</strong> Badajoz (Spain)
Introduction• Sampler <strong>comparison</strong>s usually donebetween different types <strong>of</strong> sampler• Those <strong>comparison</strong> made with <strong>the</strong> aim toasses <strong>the</strong> most suitable type <strong>of</strong> sampler• Comparisons using <strong>the</strong> <strong>same</strong> samplerusually comparing different places• Variability inside <strong>the</strong> <strong>same</strong> type <strong>of</strong> sampleris needed to asses its accuracy<strong>Sampling</strong> <strong>comparison</strong> <strong>Hirst</strong> <strong>spore</strong> <strong>traps</strong> 2
Objectives• The aims is to evaluate variability inside<strong>the</strong> <strong>Hirst</strong> sampler Burkard seven-day– Daily variability– Hourly variability• Comparisons made at <strong>the</strong> sample place• To asses <strong>the</strong> <strong>spore</strong> <strong>traps</strong> used forExtremadura Aerobiological Networkbefore put <strong>the</strong>m in a definitive location<strong>Sampling</strong> <strong>comparison</strong> <strong>Hirst</strong> <strong>spore</strong> <strong>traps</strong> 3
Material and methodsSTT• 5 seven-day Burkardsamplers at <strong>the</strong> <strong>same</strong>place– 1 sampler at 15 m over aterrace: STT– 4 samplers at ground levelseparated 2 m each o<strong>the</strong>r:ST1, ST2, ST3, ST4– At least 3 samplers atground level were workingsimultaneously– 1 automatic meteorologicalstation at ground level: MetMet ST1 ST2 ST3 ST4Faculty <strong>of</strong>ScienceUniversity <strong>of</strong>Extremadura10 mST1-4 MetSTTExperimentalGarden<strong>Sampling</strong> <strong>comparison</strong> <strong>Hirst</strong> <strong>spore</strong> <strong>traps</strong> 4
SamplersMet ST1 ST2 ST4 ST3Meteorological station on <strong>the</strong> left and <strong>the</strong> four <strong>spore</strong><strong>traps</strong> at <strong>the</strong> experimental garden on <strong>the</strong> right<strong>Sampling</strong> <strong>comparison</strong> <strong>Hirst</strong> <strong>spore</strong> <strong>traps</strong> 5
Material and methods• Place <strong>of</strong> sampling: Faculty <strong>of</strong> Science inBadajoz, University <strong>of</strong> Extremadura, Spain• Time <strong>of</strong> sampling: 51 days– from 27 th January to 18 th March 2011• Adhesive: White Petrolatum– petroleum jelly, s<strong>of</strong>t paraffin, vaseline,CAS number 8009-03-8• Four longitudinal scansat 400x LM magnification• Spore <strong>traps</strong> were calibrated at<strong>the</strong> beginning <strong>of</strong> <strong>the</strong> samplingBadajoz *<strong>Sampling</strong> <strong>comparison</strong> <strong>Hirst</strong> <strong>spore</strong> <strong>traps</strong> 6
ºC Tempmm RainPeriod studied<strong>Sampling</strong> period <strong>of</strong> Spore Traps (ST)ST1ST2ST3ST4ST-T27-1 6-2 16-2 26-2 8-3 18-3|------ 27/1-15/2:20 days ------| |- 16/2-1/3: 14 days -| |---- 2/3-18/3:17 days ------|30253025202015101551005-5027-1 6-2 16-2 26-2 8-3 18-3Rain Temp Tmax Tmin<strong>Sampling</strong> period studied and meteorology.Badajoz 2011<strong>Sampling</strong> <strong>comparison</strong> <strong>Hirst</strong> <strong>spore</strong> <strong>traps</strong> 7
m/s Wind Vel.m/s Wind Vel.Gardes Wind DirDaily and hourly wind1,61,2Badajoz 20113602700,80,418090027-1 6-2 16-2 26-2 8-3 18-30Wind Vel.Wind Dir.0,8Badajoz, 27/1-18/3 2011270W0,6225SW0,4180S0,2135SE0,01 2 3 4 5 6 7 8 9 10 11 12 13 14 15 16 17 18 19 20 21 22 23 24Solar Hours90EWind Dir.Wind Vel.Wind speed and direction, daily and hourly average<strong>Sampling</strong> <strong>comparison</strong> <strong>Hirst</strong> <strong>spore</strong> <strong>traps</strong> 8
Spore <strong>traps</strong> locationNUniversity <strong>of</strong> Extremadura(Badajoz)100 mCupressus sempervirensCupressus macrocarpaCupressus arizonicaPlatycladus orientalisUlmus minorSpore Trap<strong>Sampling</strong> <strong>comparison</strong> <strong>Hirst</strong> <strong>spore</strong> <strong>traps</strong> 9
Average concentrationNum days 20 34 31 51 51ST1 ST2 ST3 ST4 STTTotal 81,3 93,1 98,1 64,6 59,1Cupressaceae 41,5 58,7 67,8 41,0 34,1Ulmus 26,8 21,7 12,8 12,5 10,9Fraxinus-Phillyrea 3,6 3,5 2,5 0,6 1,0O<strong>the</strong>rs 3,3 3,2 3,0 3,0 3,7Alnus glutinosa 3,3 2,0 0,5 0,9 1,5Alternaria 2,1 4,6 4,5 2,7 1,6Urticaceae pp. 1,0 1,3 0,9 0,3 1,3Poaceae 0,8 1,0 1,7 1,3 1,6Urtica membranacea 0,6 0,5 2,0 2,5 1,7Rumex 0,3 1,0 1,6 0,6 1,1An<strong>the</strong>mideae 0,1 0,0 0,0 0,1 0,0Pinaceae 0,0 0,1 1,4 0,5 0,6Plantago 0,0 0,0 0,0 0,1 0,0Platanus hispanica 0,0 0,0 0,4 0,4 0,7Quercus 0,0 0,0 3,5 0,5 0,7Average pollen and Alternaria <strong>spore</strong> concentration per cubicmeter sorted according concentration <strong>of</strong> each typeSpore Traps: ST1-4 ground level, STT terrace<strong>Sampling</strong> <strong>comparison</strong> <strong>Hirst</strong> <strong>spore</strong> <strong>traps</strong> 10
grains/m3grains/m3grains/m3grains/m3grains/m3grains/m3grains/m3grains/m3grains/m3Daily data <strong>comparison</strong>sTotal Pollen 27/1-15/2Total Pollen 16/2-1/3Total Pollen 2/3-18/3150100502001501005015010050000ST1 ST2 ST3 ST4 ST-TST1 ST2 ST3 ST4 ST-TST1 ST2 ST3 ST4 ST-TCupressaceae Pollen 27/1-15/2Cupressaceae Pollen 16/2-1/3Cupressaceae Pollen 2/3-18/36015080402010050604020000ST1 ST2 ST3 ST4 ST-TST1 ST2 ST3 ST4 ST-TST1 ST2 ST3 ST4 ST-TUlmus Pollen 27/1-15/2Ulmus Pollen 16/2-1/3Ulmus Pollen 2/3-18/3403020100ST1 ST2 ST3 ST4 ST-T403020100ST1 ST2 ST3 ST4 ST-TAverage pollen concentration with standards error in bars<strong>Sampling</strong> <strong>comparison</strong> <strong>Hirst</strong> <strong>spore</strong> <strong>traps</strong> 116420ST1 ST2 ST3 ST4 ST-T
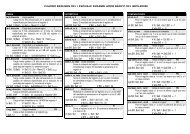
Daily data <strong>comparison</strong>sTotal Cupresaceae Ulmust df sig. t df sig. t df sig.ST1-ST2 1,999 19 0,060 0,834 19 0,415 0,983 19 0,338ST1-ST4 1,908 19 0,072 -0,969 19 0,345 -1,057 19 0,304ST1-STT 3,096 19 0,006 1,743 19 0,097 2,581 19 0,018ST2-ST3 -0,197 13 0,847 0,159 13 0,876 -0,567 13 0,580ST2-ST4 0,359 33 0,722 -0,910 33 0,370 0,193 33 0,848ST2-STT 2,204 33 0,035 1,893 33 0,067 2,472 33 0,019ST3-ST4 1,382 30 0,177 0,852 30 0,401 1,615 30 0,117ST3-STT 2,155 30 0,039 2,141 30 0,040 3,412 30 0,002ST4-STT 2,827 50 0,007 3,562 50 0,001 3,534 50 0,001T-test paired <strong>comparison</strong>s after data normalization using logarithmic transformation,In bold statistically significant differences. Degree <strong>of</strong> freedom: df=n-1.ST1-4: Spore <strong>traps</strong> at ground levelSTT: Spore trap over <strong>the</strong> terrace<strong>Sampling</strong> <strong>comparison</strong> <strong>Hirst</strong> <strong>spore</strong> <strong>traps</strong> 12
grains/m3mm RainTotal daily pollen variationTotal Pollen50045040035030025020015010050027-1 30-1 2-2 5-2 8-2 11-2 14-2 17-2 20-2 23-2 26-2 1-3 4-3 7-3 10-3 13-3 16-3302520151050Rain ST1 ST2 ST3 ST4 ST-TTotal daily pollen concentration for <strong>the</strong> period studied including all <strong>the</strong> <strong>spore</strong> <strong>traps</strong>daily rain appears scaled in <strong>the</strong> right side<strong>Sampling</strong> <strong>comparison</strong> <strong>Hirst</strong> <strong>spore</strong> <strong>traps</strong> 13
grains/m3grains/m3Cupressaceae and UlmusCupressaceae Pollen500400300200100027-1 30-1 2-2 5-2 8-2 11-2 14-2 17-2 20-2 23-2 26-2 1-3 4-3 7-3 10-3 13-3 16-3ST1 ST2 ST3 ST4 ST-TUlmus Pollen15010050027-1 30-1 2-2 5-2 8-2 11-2 14-2 17-2 20-2 23-2 26-2 1-3 4-3 7-3 10-3 13-3 16-3ST1 ST2 ST3 ST4 ST-TDaily pollen concentration for Cupressaceae and Ulmus pollen types<strong>Sampling</strong> <strong>comparison</strong> <strong>Hirst</strong> <strong>spore</strong> <strong>traps</strong> 14
Hourly <strong>comparison</strong>sCupressaceae 10-13/2 4 days 20-22/2 3 days 7-9/03 3 dayst df sig. t df sig. t df sig.ST1-ST2 1,203 95 0,232ST1-ST4 -0,839 95 0,404ST1-STT 2,559 95 0,012ST2-ST3 1,918 71 0,059ST2-ST4 -2,041 95 0,044 4,178 71 0,000ST2-STT 0,877 95 0,383 2,742 71 0,008ST3-ST4 1,104 71 0,273 1,496 71 0,139ST3-STT 0,424 71 0,673 3,297 71 0,002ST4-STT 3,864 95 0,000 -0,766 71 0,446 2,965 71 0,004Ulmus 7-12/2 6 days 18-27/2 10 dayst df sig. t df sig.ST1-ST2 0,543 143 0,588ST1-ST4 -0,004 143 0,996ST1-STT 2,110 143 0,037ST2-ST3 0,626 239 0,532ST2-ST4 -0,760 143 0,448 4,438 239 0,000ST2-STT 2,561 143 0,011 2,384 239 0,018ST3-ST4 2,987 239 0,003ST3-STT 1,232 239 0,219ST4-STT 3,369 143 0,001 -2,421 239 0,016T-test paired <strong>comparison</strong>s after data normalization using logarithmic transformation,In bold statistically significant differences. Degree <strong>of</strong> freedom: df (n-1).<strong>Sampling</strong> <strong>comparison</strong> <strong>Hirst</strong> <strong>spore</strong> <strong>traps</strong> 15
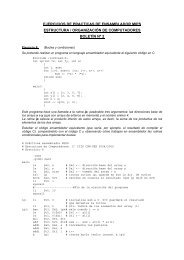
m/s Wind Vel.ºC Temp.Grades % Rel. Wind Hum. Dir.grains/m3Cupressaceae3500300025002000150010005000Cupressaceae10/Feb 7h 13h 19h 11/Feb 7h 13h 19h 12/Feb 7h 13h 19h 13/Feb 7h 13h 19hST1 ST2 ST4 ST-T10/2 ST1 ST2 ST4 STT17h 2074 891 2506 27018h 384 1213 1987 286212/2 ST1 ST2 ST4 STT16h 2550 399 1134 48617h 707 584 1296 28118h 952 2918 540 745Badajoz 20110,8 200,6 150,4 100,250,0010/2 7 13 19 11/2 7 13 19 12/2 7 13 19 13/2 7 13 19360 10027080601804090200Wind Temp Vel.Rel. Wind Hum. Dir.Hourly pollen data for some days, hourly meteorological parameters for <strong>the</strong> <strong>same</strong> period.Table with hourly peak concentrations data in grains per cubic meter for each <strong>spore</strong> trap<strong>Sampling</strong> <strong>comparison</strong> <strong>Hirst</strong> <strong>spore</strong> <strong>traps</strong> 16
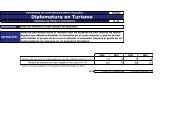
m/s Wind Vel.Grades Wind Dir.grains/m3CupressaceaeCupressaceae30002500200015001000500020/Feb 7h 13h 19h 21/Feb 7h 13h 19h 22/Feb 7h 13h 19h20/2 ST2 ST3 ST4 STT11h 660 737 192 17312h 1183 169 343 20513h 1644 15 655 25914h 1044 0 706 61615h 261 0 302 7882,01,5ST2 ST3 ST4 ST-TBadajoz 201136027021/2 ST2 ST3 ST4 STT9h 492 2196 10 010h 1828 1705 1018 13011h 1091 660 131 45412h 307 108 131 11231,01800,50,020/2 7 13 19 21/2 7 13 19 22/2 7 13 19900Wind Vel.Wind Dir.Hourly pollen data for some days, hourly meteorological parameters for <strong>the</strong> <strong>same</strong> period.Table with hourly peak concentrations data in grains per cubic meter for each <strong>spore</strong> trap<strong>Sampling</strong> <strong>comparison</strong> <strong>Hirst</strong> <strong>spore</strong> <strong>traps</strong> 17
m/s Wind Vel.Grades Wind Dir.grains/m3Cupressaceae200015001000Cupressaceae7/23 ST3 ST4 STT10h 311555 8611h 77 756 63712h 123 302 58313h 338 335 1735001,61,20,80,40,007/Mar 7h 13h 19h 8/Mar 7h 13h 19h 9/Mar 7h 13h 19hST3 ST4 ST-TBadajoz 20117/3 7 13 19 8/3 7 13 19 9/3 7 13 19Wind Vel.Wind Dir.Hourly pollen data for some days, hourly meteorological parametersfor <strong>the</strong> <strong>same</strong> period. Table with hourly peak concentrations data ingrains per cubic meter for each <strong>spore</strong> trap<strong>Sampling</strong> <strong>comparison</strong> <strong>Hirst</strong> <strong>spore</strong> <strong>traps</strong> 183602701809008/23 ST3 ST4 STT4h 0 616 1195h 0 346 546h 15 302 547h 0 130 868h 61 54 229h 108 0 3210h 645 0 011h 1444 11 09/23 ST3 ST4 STT7h 1106 11 08h 722 0 119h 169 11 010h 31 54 2211h 61 43 3212h 0 32 5413h 31 173 54
m/s Wind Vel.Grades Wind Dir.grains/m3Ulmus7006005004003002001000Ulmus7/Feb 7h 13h 19h 8/Feb 7h 13h 19h 9/Feb 7h 13h 19h7/2 ST1 ST2 ST4 STT15h 0 246 54 64816h 31 323 205 38917h 46 522 367 18418h 169 215 76 5419h 292 123 22 020h 507 46 32 00,60,50,3ST1 ST2 ST4 ST-TBadajoz 20113602701808/2 ST1 ST2 ST4 STT15h 0 108 313 5416h 0 445 313 32417h 15 461 151 31318h 430 323 184 16219h 369 92 76 1120h 538 61 65 00,2900,07/2 7 13 19 8/2 7 13 19 9/2 7 13 190Wind Vel.Wind Dir.Hourly pollen data for some days, hourly meteorological parameters for <strong>the</strong> <strong>same</strong> period.Table with hourly peak concentrations data in grains per cubic meter for each <strong>spore</strong> trap<strong>Sampling</strong> <strong>comparison</strong> <strong>Hirst</strong> <strong>spore</strong> <strong>traps</strong> 19
m/s Wind Vel.Grades Wind Dir.grains/m3UlmusUlmus12001000800600400200010/Feb 7h 13h 19h 11/Feb 7h 13h 19h 12/Feb 7h 13h 19hST1 ST2 ST4 ST-TBadajoz 20110,80,636027011/2 ST1 ST2 ST4 STT15h 660 353 745 29216h 538 584 778 71317h 461 829 281 64812/2 ST1 ST2 ST4 STT15h 1091 108 248 8616h 829 307 713 17317h 215 276 702 25918h 77 876 130 760,40,20,010/2 7 13 19 11/2 7 13 19 12/2 7 13 19180900Wind Vel.Wind Dir.Hourly pollen data for some days, hourly meteorological parameters for <strong>the</strong> <strong>same</strong> period.Table with hourly peak concentrations data in grains per cubic meter for each <strong>spore</strong> trap<strong>Sampling</strong> <strong>comparison</strong> <strong>Hirst</strong> <strong>spore</strong> <strong>traps</strong> 20
m/s Wind Vel.Grades Wind Dir.grains/m3Ulmus3503002502001501005002,01,51,00,5Ulmus23/Feb 24/Feb 25/Feb 26/Feb 27/FebST2 ST3 ST4 ST-TBadajoz 20113602701809023/2 ST2 ST3 ST4 STT12h 15 123 11 013h 154 15 22 1114h 323 61 97 5415h 46 15 54 18427/2 ST2 ST3 ST4 STT12h 0 123 0 013h 15 92 0 014h 0 46 43 015h 15 92 22 016h 108 31 22 5417h 138 31 184 7618h 77 15 86 1620,023/2 7 13 19 24/2 7 13 19 25/2 7 13 19 26/2 7 13 19 27/2 7 13 190Wind Vel.Wind Dir.Hourly pollen data for some days, hourly meteorological parameters for <strong>the</strong> <strong>same</strong> period.Table with hourly peak concentrations data in grains per cubic meter for each <strong>spore</strong> trap<strong>Sampling</strong> <strong>comparison</strong> <strong>Hirst</strong> <strong>spore</strong> <strong>traps</strong> 21
Conclusions• There are no statistically significant differences <strong>among</strong><strong>spore</strong> <strong>traps</strong> at ground level using daily data,never<strong>the</strong>less, with hourly data differences have beenfound.• At 15 m height statistically significant differences inpollen capture have been observed.• Hourly peaks concentration rarely have been recordedat <strong>the</strong> <strong>same</strong> time in all <strong>spore</strong> <strong>traps</strong>, differences up to 7hours have been found.• Pollen concentration at hourly peaks showeddifferences <strong>of</strong> double or triple <strong>among</strong> <strong>spore</strong> <strong>traps</strong>.• Spatial distribution <strong>of</strong> pollen and <strong>spore</strong>s is far fromhomogeneous even within two meters away.<strong>Sampling</strong> <strong>comparison</strong> <strong>Hirst</strong> <strong>spore</strong> <strong>traps</strong> 22
<strong>Sampling</strong> <strong>comparison</strong> <strong>among</strong> <strong>Hirst</strong><strong>spore</strong> <strong>traps</strong> <strong>of</strong> <strong>the</strong> <strong>same</strong> <strong>model</strong>José María Maya Manzano 1 , Santiago Fermández Rodríguez 1 ,Angela Gonzalo Garijo 2 , Inmaculada Silva Palacios 1 ,Rafael Tormo Molina 11University <strong>of</strong> Extremadura (Spain)2Hospital Infanta Cristina <strong>of</strong> Badajoz (Spain)
Previous worksPlace Km Sampler ReferencePittsburgh (USA) Irdi G, Jones JR, White CM 0,001 2 Burkard Grana (2002) 21:44-47Kansas (USA) Merle G. Eversmeyer MG, Kramer CL 0,001 15 Rotorod Grana (1987) 26:109-112Padua (Italy) Giorato M, Bordin A, Gemignani C, Turatello F, Marcer G 0,002 2 Lanzoni Aerobiologia (2003) 19:129-131Copenhagen (Denmark) Pedersen BV, Moseholm L 0,003 2 Burkard Aerobiologia (1993) 9:15- 26Geoa (Italy) 3 2 Burkard Aerobiologia (2000) 16:233-243St. Paul, Minnesota (USA) 5,6 2 Rotorod Aerobiologia (1997) 13:205-208Manhattan (USA) 10 2 Burkard Grana (1984) 23:117-122Huddinge and Stockholm (Sweden) 15 2 Burkard Aerobiologia (1993) 9:53-67Trento and S. Michele all'Adige (Italy) 20 2 Burkard Aerobiologia (1997) 13:199-204Copenhagen, Malmö (Denmark) 31 2 Burkard Grana (1981) 20:187-189Cagliari, Sanluri (Italy) 43 2 Burkard Grana (1990) 29:87-95Málaga, Estepona (Spain) 90 2 Burkard Grana (2000) 39:252-258Trieste, Lozzo di Cadore (Italy) 141 2 Burkard Aerobiologia (1992) 8:385-391Basel, Davos (Switzerland) 189 2 Burkard Grana (1981) 20:161-16Toulouse, Bordeaux, Montpellier (France) 191-380 3 Burkard Grana (1988) 27:183-201Stockholm, Trondheim, Turku and Vienna 262-1722 4 Burkard Grana (1996) 35:171-178Erfurt, Hamburg (Germany) 293 2 Burkard Allergy (2000)55:176-180Turku, Kuopio, Oulu (Finland), Tartu (Estonia) 340-741 4 Burkard Aerobiologia (1989) 5:94-103Louvain-la-Neuve (Belgium), Basel (Switzerland) 410 2 Burkard Grana (1983) 22:59-64Torino-Perugia (Italy) 438 2 Burkard Aerobiologia (1985) 1:39-45Tartu (Estonia), Roma/Gotland and Stockholm (Sweden) 490-507 3 Burkard Grana (1997) 36:366-372Lublin (Poland), Skien (Norway) 1204 2 Burkard Ann Agric Environ Med (2004)11:205-208Derby (UK), Poznan (Poland). 1237 2 Burkard Aerobiologia (2002) 18:45-53Córdoba (Spain), London (UK) 1563 2 Burkard Grana (1995) 34:189-198Córdoba (Spain), Poznan (Poland) 2334 2 Burkard Aerobiologia (2009) 25:55-63<strong>Sampling</strong> <strong>comparison</strong> <strong>Hirst</strong> <strong>spore</strong> <strong>traps</strong> 24