Biodiversity GIS (BGIS) Internet Map Tutorial - Biodiversity GIS - SANBI
Biodiversity GIS (BGIS) Internet Map Tutorial - Biodiversity GIS - SANBI
Biodiversity GIS (BGIS) Internet Map Tutorial - Biodiversity GIS - SANBI

You also want an ePaper? Increase the reach of your titles
YUMPU automatically turns print PDFs into web optimized ePapers that Google loves.
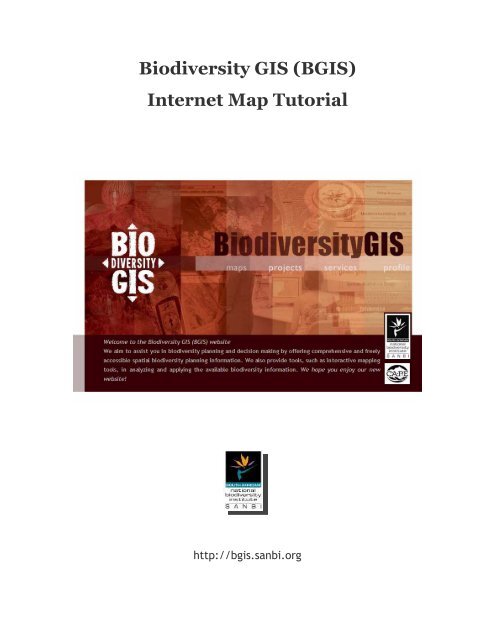
<strong>Biodiversity</strong> <strong>GIS</strong> (B<strong>GIS</strong>)<strong>Internet</strong> <strong>Map</strong> <strong>Tutorial</strong>http://bgis.sanbi.org
OperaNo Known IssuesSafariNo Known IssuesKonquerorFor Konqueror to work the Browsersneeds to set as it is recognized as aMozilla Browsers (e.g. 1.6)Introduction to <strong>Internet</strong> <strong>Map</strong>s<strong>Internet</strong> maps have much in common with traditional paper maps, with a few importantdifferences.This tutorial will show you how to use interactive <strong>Internet</strong> based maps. After this tutorial youshould be able to use B<strong>GIS</strong> Online <strong>Map</strong>s successfully; even if you have no prior knowledge of<strong>GIS</strong>. The basic tutorial will probably take about fifteen minutes. However, in less than fiveminutes you can have the background required to successfully navigate a B<strong>GIS</strong> map.First, we'll cover two basic <strong>GIS</strong> concepts you need to know. Then we'll introduce you to thetools and methods that you'll use to navigate around the map and make some enquiries.This section covers the two basic <strong>GIS</strong> concepts you need to know to effectively use B<strong>GIS</strong> maps.<strong>GIS</strong> Concept # 1: Features have attributes associated with them.Images and text for this section <strong>GIS</strong> Concept # 1 and # 2 are courtesy of Geocortex CompassImagine a tree. How would you keep track of and communicateinformation about this tree to other people who need to know allabout it?Image: Courtesy ofGeocortex Compass<strong>Biodiversity</strong> <strong>GIS</strong> (B<strong>GIS</strong>) <strong>Internet</strong> <strong>Map</strong> <strong>Tutorial</strong>2
You might use a database to keep track of what species it is, how oldit is, how tall it is, how healthy it is, and any other attributes that areimportant. This tree is one record in a database. We call eachcategory (i.e. tree height) a field.Now imagine a grove oftrees that you need tokeep track of attributesfor.Because we are nowdealing with more thanone tree, it becomesrelevant where each treeis so we know whatinformation relates towhich tree.We map the location of each tree and identify whichattributes belong to which tree. This is the foundation of<strong>GIS</strong>. A <strong>GIS</strong> tells us where something is? and what it is?Computers are synonymous with <strong>GIS</strong>, and using a computerwe can have hundreds of fields (different attributes) formillions of records (trees).<strong>GIS</strong> Concept # 2: Information is separated into layers.We can also have other layers of information in our <strong>GIS</strong>. Our information on trees wouldconstitute one layer of information. We could also have a layer with rivers and a layer with soiltypes. Any information can be represented as a layer.<strong>Biodiversity</strong> <strong>GIS</strong> (B<strong>GIS</strong>) <strong>Internet</strong> <strong>Map</strong> <strong>Tutorial</strong>3
A map represents the landscapein an artificial way. Vectorlayers represent features in oneof several ways:Points:A point is good for representinginformation in which it isnecessary to show where afeature is, but its physicalshape is not important (i.e.trees in the old growth treelayer).Lines:A line is suitable to representmany real world features (i.e.the rivers in the river layer).Polygons:Don't be intimidated by thename. It is really just a solidmulti-sided shape. When yousee a polygon, remember thateverything inside the boundaryhas the attributes associatedwith the record. (i.e. soil typesin the soils layer)You might hear people talk about coverages, themes, or shapefiles. All these terms are othernames for layers of information.With individual layers we can conduct analysis between layers and only display layers ofinterest.<strong>Biodiversity</strong> <strong>GIS</strong> (B<strong>GIS</strong>) <strong>Internet</strong> <strong>Map</strong> <strong>Tutorial</strong>4
As you work with B<strong>GIS</strong> maps you will be able to turn different layers on and off as you desire.Getting Familiar with the B<strong>GIS</strong> Online <strong>Map</strong>sIn this section you can learn about;• how to navigate the B<strong>GIS</strong> website• where to find information on the B<strong>GIS</strong> website• how to open online maps• the basic layout of the online map browser window.PLEASE NOTE: you must disable you popup blocker in order to view the B<strong>GIS</strong> online maps.The B<strong>GIS</strong> website consists of two parts - pages of textual information and online mapsThe B<strong>GIS</strong> websiteThe B<strong>GIS</strong> website consists of two parts - pages of textual information and online maps.The text pagesThe online mapsOn opening the B<strong>GIS</strong> website you can choose one of four buttons. These buttons are repeatedon all the text pages of the website.<strong>Biodiversity</strong> <strong>GIS</strong> (B<strong>GIS</strong>) <strong>Internet</strong> <strong>Map</strong> <strong>Tutorial</strong>5
The four buttons will take you to different sections of the website.Here you can find a map and open it directly. See Choosing a mapfor more details.Here you can find information on projects included on the B<strong>GIS</strong>website. The projects section is described in greater detail below.<strong>Biodiversity</strong> <strong>GIS</strong> (B<strong>GIS</strong>) <strong>Internet</strong> <strong>Map</strong> <strong>Tutorial</strong>6
Here you can find information and links to the services providedon the B<strong>GIS</strong> website. These services include;• A municipal biodiversity planning index• A species mapping tool• A land use decision support tool Training manuals• A glossary of terms• Useful inksHere you can find out more about B<strong>GIS</strong> and its staff.<strong>Biodiversity</strong> <strong>GIS</strong> (B<strong>GIS</strong>) <strong>Internet</strong> <strong>Map</strong> <strong>Tutorial</strong>7
The Projects sectionWhen you click on thebutton you are presented with a list of South Africa'sprovinces. Clicking on a province will reveal the project information available for that provincein chronological order of the publication.Clicking on a project in the menu will open the project page. The project page containsbackground information about the project, links to reports, contact information and a list ofmaps.<strong>Biodiversity</strong> <strong>GIS</strong> (B<strong>GIS</strong>) <strong>Internet</strong> <strong>Map</strong> <strong>Tutorial</strong>8
Clicking on one of the maps listed opens the maps page. This page contains backgroundinformation about the map, a link to view the online map - "view this map", links to themetadata, ESRI shape files for download and an image of the map when viewed online.The section Choosing a map explains how to view the B<strong>GIS</strong> online maps.Layout of the B<strong>GIS</strong> online map browser<strong>Biodiversity</strong> <strong>GIS</strong> (B<strong>GIS</strong>) <strong>Internet</strong> <strong>Map</strong> <strong>Tutorial</strong>9
Open the B<strong>GIS</strong> online maps using the instructions above. With the online maps open you will beable to follow the rest of this tutorial.Please note that this is a Generic <strong>Tutorial</strong> not all B<strong>GIS</strong> maps will have all features enabled.Each B<strong>GIS</strong> map does have a dynamically generated help that is specific to that particular Web<strong>Map</strong> Service and is accessible from the Function Tab Bar (top right).When you open a B<strong>GIS</strong> <strong>Map</strong> Viewer through your <strong>Internet</strong> Explorer browser (although <strong>Internet</strong>Explorer is the preferred web-browser, most Java-enabled browser including Linux and Applebasedmachines) you will see a new window that looks similar to the example you see here.The main window is the <strong>Map</strong> Window. This is where the map is displayed (on the right handside). Beside it is the Information Panel (on the left hand side) , which displays informationabout the map and lets you work with map layers. Specifically, the Information Panel displaysthe legend, visible and active layers, and provides information about the map. You will seethat this is essentially your workspace and for each activity step-by-step instructions areprovided in this area.<strong>Biodiversity</strong> <strong>GIS</strong> (B<strong>GIS</strong>) <strong>Internet</strong> <strong>Map</strong> <strong>Tutorial</strong>10
At the top of the viewer you can see the Function Tab Bar and the Toolbox. You will use theFunction Tab bar, the Toolbox, and the Expanded Toolbox to navigate around the map, askquestions of it, and otherwise interact with the information.Exact scale, active tool and active layer information are all found in the Status Bar below theMain <strong>Map</strong> Window.If you are feeling lost already... don't worry. Everything will be described in depth in the nextfew pages.Function Tab BarBelow are the Function Tab Bar optionsPlease click on any of the options in the above function tool bar for a pop-up explanation ofthat particular function. (You will need to ensure that you have enable pop-ups in yourbrowser)ToolboxPlease click on any of the options in the above default toolbox for a pop-up explanation of thatparticular function. (You will need to ensure that you have enable pop-ups in your browser). Atthe onset please note that the Zoom in tool is the default tool and is automatically set andthis is indicated by the redbox that is drawn around it. All tools that require another input likeclicking on the map to zoom in, will have a red box drawn around them.Expanded toolboxPlease click on any of the options in the above expanded toolbox for a pop-up explanation ofthat particular function. (You will need to ensure that you have enable pop-ups in your<strong>Biodiversity</strong> <strong>GIS</strong> (B<strong>GIS</strong>) <strong>Internet</strong> <strong>Map</strong> <strong>Tutorial</strong>11
owser). This toolbox can be closed at at anytime by simply clicking on the open red tool boxthese tools will disappear and the icon is replaced with the closed toolbox .Choosing a mapThere are two ways to access online maps from the text pages of the B<strong>GIS</strong> website. Using thebuttons and using thebutton. Using the projects button to find amap is described in the section "The B<strong>GIS</strong> website". In this section we describe how to open anonline map directly using the maps button and the procedure to follow if you have not viewedthe B<strong>GIS</strong> online maps before.When clicking on thebutton you are presented a list of all South Africa'sprovinces. Clicking on a province will reveal the projects which fall under that province.Clicking on a project will reveal all the maps for that project.One of two things may appear when you click on a map (this also applies to the "view this map"link on the maps page see the section "The B<strong>GIS</strong> website").• If you have viewed the B<strong>GIS</strong> online maps before and filled in the registration form theonline maps will open in a popup window and the browser window will automaticallynavigate to the background information page for that online map.• If you have not viewed an online maps before or if the cookie on your machine hasbeen deleted you will be taken to the registration form (see below).PLEASE NOTE You must disable your popup blocker in order to view the maps!<strong>Biodiversity</strong> <strong>GIS</strong> (B<strong>GIS</strong>) <strong>Internet</strong> <strong>Map</strong> <strong>Tutorial</strong>12
If you are taken to the registration form and you have not viewed the B<strong>GIS</strong> online maps beforeyou should in the form. Please read the terms and conditions statement and tick the box nextto the "term and conditions" link to make the "register me" button active.If you have viewed the B<strong>GIS</strong> online maps before, the cookie on your machine has probably beendeleted. Fill in your email address to renew the cookie and the map will open. The next timeyou want to view an online map it will open directly.<strong>Biodiversity</strong> <strong>GIS</strong> (B<strong>GIS</strong>) <strong>Internet</strong> <strong>Map</strong> <strong>Tutorial</strong>13
Navigating Around the <strong>Map</strong>sWithin a B<strong>GIS</strong> Online <strong>Map</strong> you can look at a specific area of interest.You can move around the map using the pan tooldifferent parts of the map.. The Pan tool lets you slide around toSuppose you want to go north (up the map). Take the Pan tool and grab (press and holddown the mouse button) onto the map pulling it down. Whatever part of the map you grab withthe little hand will end up where you let go of the mouse button. Just like in real life. Thisworks for moving in any direction on the map.The Zoom tools are unique to digital maps. They are very much like using an actual magnifyingglass, as the icon implies.The magnifying glass with the little plus sign lets you 'zoom in' , while the one with the littleminus sign lets you 'zoom out' . There are a couple of ways to use these tools.First, click on one of them to select it, then go somewhere on the map and press the leftmouse button. If it is the Zoom In tool the map zooms in. The center of the new map iswherever on the map you clicked the mouse button. The Zoom Out tool zooms out the sameway.Secondly, you can zoom in more precisely by pressing the mouse button somewhere on themap, holding it down, and dragging a box. When you let go of the mouse button the new mapextent will be the area defined by the box. Zooming out cannot be defined by drawing a zoombox and is undertaken using a pre-set zoom out scale.You may also navigate north, south, east or west by clicking on the green line around the map.This will move the map one frame in the direction of the side that you clicked.Click here for a relevant, but non essential, discussion of scale<strong>Biodiversity</strong> <strong>GIS</strong> (B<strong>GIS</strong>) <strong>Internet</strong> <strong>Map</strong> <strong>Tutorial</strong>14
To open a closed folder , click on it to open it . A list of all layers contained within thefolder will be shown.In this example a folder called "Terrestrial" has been opened and three layers are present oneof which has been selected.Similarly, you can click on an open folder to close it. Notice that opening and closing foldersdoesn't turn layers on or off; it simply helps you stay organized.Next to the folder icon you will see a small coloured rectangle and a small grey and whiterectangle .To display all available layers in a folder, click the small coloured rectangle . Clicking on thegrey and white rectangle turns off all layers in the folder. It doesn't matter if a folder is openor closed when you do these operations.You can turn an individual layer on or off by clicking on the adjacent tickbox .A layer is 'on' (displayed on the map) when there is a tick in its tickbox .Some layers are only available at certain scales. Layers that are available at the current scalewill be shown with a tickbox that is open and can be selected . Layers that are not availableare nevertheless listed but the tickbox has been greyed out .To illustrate thisthis layer is available and has been switched on.this layer is not available at this scale to be switched on for viewing.Note that layers that are not available will also have a red asterisk next to them Clicking thered asterisk next to the name of an unavailable layer zooms you to the closest scale at whichthe layer is available. (Note although it will zoom to the scale there is no guarantee that thatthe object will be seen since it might now fall outside the geographical extends of the mapwindow).All B<strong>GIS</strong> maps have a similar file structure for opening different layers of information.<strong>Biodiversity</strong> <strong>GIS</strong> (B<strong>GIS</strong>) <strong>Internet</strong> <strong>Map</strong> <strong>Tutorial</strong>16
Let's open the "NSBA: layers" folder and the "Terrestrial" folder so it looks like the following<strong>Biodiversity</strong> <strong>GIS</strong> (B<strong>GIS</strong>) <strong>Internet</strong> <strong>Map</strong> <strong>Tutorial</strong>17
Now click on the "NSBA Terrestrial Ecosystem Status" Layer - if you have the AutomaticallyRefresh <strong>Map</strong> ticked the layer will load and the <strong>Map</strong> will refresh itself. If the AutomaticallyRefresh <strong>Map</strong> is not ticked you will need to tick the "NSBA Terrestrial Ecosystem Status" LayerAND "Refresh <strong>Map</strong>" buttonA layer is made 'Active' by clicking on the icon adjacent to a layer name . A light grey iconindicates that it is not active whereas a black icon denotes that it has been made activelayer, and its name is displayed in the area below the map window. You can only have ONElayer active at a time.<strong>Biodiversity</strong> <strong>GIS</strong> (B<strong>GIS</strong>) <strong>Internet</strong> <strong>Map</strong> <strong>Tutorial</strong>18
In the above case "NSBA Terrestrial Ecosystem Status" has been made the ACTIVE LAYER.So what does being an active layer mean? It means that the spotlight is on this layer. In otherwords, this is our way of telling the computer that this is the layer in which we are.Accessing Metadata for <strong>Map</strong> LayersWhat is Metadata? Metadata is data about data. In the case to the layers which make up theB<strong>GIS</strong> maps the metadata for layer may include details like• Who made the layer• When the layer was made or the data collected• A what scale it was digitised if it was digitised• For what purpose the layer was made• Contact details of the layers makers• And many other details.Thus it is very important to consult the metadata for a layer when making decisions based onthe information in the layer as it will help to inform you as to whether the conclusion you adrawing based on the information are indeed valid.Accessing the metadata for any of the B<strong>GIS</strong> layers is very easy. Let us for example access themetadata for the layer NSBA Terrestrial Ecosystem Status.If you have left the previous map you can open it by choosing the and opening "<strong>Map</strong> 1NSBA Terrestrial Ecosystem Status" under "National Spatial <strong>Biodiversity</strong> Assessment (NSBA)".After the map has loaded choose the . Now click on the text "Terrestrial EcosystemStatus. The text of the name of each layer is a link to its metatdata file either as a HTML or MSWord file. After clicking on the text the metadata for the layer will appear in a pop window(Remember you must have your popup blocker disabled).<strong>Biodiversity</strong> <strong>GIS</strong> (B<strong>GIS</strong>) <strong>Internet</strong> <strong>Map</strong> <strong>Tutorial</strong>19
Notice that the originator of this layer is <strong>SANBI</strong>.You can also access the metadata for the layers in a map from the text page for a specific map.See section Choosing a map to see how to access the text page for "NSBA <strong>Map</strong> 1 TerrestrialEcosystem Status" from the main B<strong>GIS</strong> text website.Use the metadata link to access the metadata for the layer.<strong>Biodiversity</strong> <strong>GIS</strong> (B<strong>GIS</strong>) <strong>Internet</strong> <strong>Map</strong> <strong>Tutorial</strong>20
Using Find LocationThe find Location tabyour maps.on the top tab bar can help you quickly move to areas onLets look at the Ecosystem Status for the area around Tzaneen in Limpopo Province. Use themap you had open in the previous section or click on the , choosing "National Spatial<strong>Biodiversity</strong> Assessment (NSBA)" and then choosing "NSBA <strong>Map</strong> 1 Terrestrial Ecosystem Status."After the map has loaded click on thelocations will appear. Choose Municipalities towns.. A list of feature you can use to find<strong>Biodiversity</strong> <strong>GIS</strong> (B<strong>GIS</strong>) <strong>Internet</strong> <strong>Map</strong> <strong>Tutorial</strong>21
Using the dropdown box choose Greater Tzaneen Municipality and click OK. The map will nowzoom into the area around Tzaneen. If you wish to see where the town of Tzaneen and themunicipality are, click on the and turn on the Towns and Municipalities layers which arein the "Base Layers" folder.Identifying Features' Attributes for an Active LayerThe introduction to <strong>GIS</strong> Concepts section discussed layers and how features have attributes in a<strong>GIS</strong>.<strong>Biodiversity</strong> <strong>GIS</strong> (B<strong>GIS</strong>) <strong>Internet</strong> <strong>Map</strong> <strong>Tutorial</strong>22
Suppose you are interested in the ecosystem status of a section of remnant piece ofrenosterveld. You can open the relevant map by clicking on the , choosing "CapeLowlands Renosterveld" and then choosing "<strong>Map</strong> 3 Renosterveld Ecosystem Status". By nowchoosing the layers tab, the layer list will look as follows...Click on theto .next to "Renosterveld Ecosystem Status" to make the layer active the changesZoom into Cape Town and the move northwards to Wellington. You will need to use the pantool quite a few times until you find a stretch of renosterveld that interests you. Note you canremove the background map to increase speed by clicking thetickbox next to background maplayer.<strong>Biodiversity</strong> <strong>GIS</strong> (B<strong>GIS</strong>) <strong>Internet</strong> <strong>Map</strong> <strong>Tutorial</strong>23
Now click on the tool and then click on the map anywhere in the coloured areas, e.g. thelarge red area near Wellington. The attributes for that feature are displayed in a new windowwhich will be similar but not necessarily the same as below (layers get revised and new fieldscan get added). If the window does not appear, make sure that the feature you are clicking onis part of the layer that is active.Now select thefrom the Tab Bar and you should get a legend similar which shows themeaning of the symbols and colours shown on the map.<strong>Biodiversity</strong> <strong>GIS</strong> (B<strong>GIS</strong>) <strong>Internet</strong> <strong>Map</strong> <strong>Tutorial</strong>24
Please note that even if you have all of the legends turned off, the legend will displayautomatically in any PDF maps that you generate. When you print a map, this legend isautomatically added to the map.To get back to you layers section just click on the Layers Tab Function Bar. Most of the timewhen working with B<strong>GIS</strong> <strong>Map</strong>s you will toggling between the Layer and Legend settings.You might ask why not combine Legend/Layer into one system? The answer lies in the dynamicnature of the B<strong>GIS</strong> maps - depending on both the scale and which layers you have selected thelegend needs to continually be changing. Further since you can actually customize the B<strong>GIS</strong>maps with your own colour renderings and symbols this becomes even more difficult to keep atrack of. Consequently the Legend is actually "rendered" that is to say produced as an image atthe same time each map is "rendered".NOTE:You can also use thebased on the form below.on the layer list to provide us with you comments,Display or Remove a Index <strong>Map</strong>An Index <strong>Map</strong> Tool gives the main map context by showing where the map fits into thebroader scheme of things. For instance, if we were making viewing the "Cape LowlandRenosterveld" maps the Index <strong>Map</strong> showing where in South Africa you are may look like this.<strong>Biodiversity</strong> <strong>GIS</strong> (B<strong>GIS</strong>) <strong>Internet</strong> <strong>Map</strong> <strong>Tutorial</strong>25
An Index <strong>Map</strong> may also cover the same area as the map itself when it first opens. In ourexample we are looking at an Index <strong>Map</strong>, which accompanies a map of South Africa. The redrectangle reflects the current extent of the map viewer. As you zoom in and out, the Index <strong>Map</strong>can be a useful tool, as it helps you to stay oriented.When you have zoomed in greatly the red box is replaced with a red star indicating the relativeposition.You can display the Index <strong>Map</strong> by pressing the Index <strong>Map</strong> tool from the toolbox. Choose anothermap function, and it will disappear from the Information Panel.Using Bookmarks<strong>Biodiversity</strong> <strong>GIS</strong> (B<strong>GIS</strong>) <strong>Internet</strong> <strong>Map</strong> <strong>Tutorial</strong>26
Bookmarks are simply the present map's location, which will Zoom you to a location but notalter layer display. By clicking the on the function bar, available bookmarks display inthe information panel.In the above example we have no personal bookmarks. You can create your own PersonalBookmarks providing your browser accepts cookies. To add a Personal Bookmark for a particularlocation click Add Current Extent. You will then be asked to type a name for the newbookmark. Your extent will be stored for a year under whatever name you choose.Just type in a name like "Cape Town" in the box if that is where you have zoomed in and clickOK and you will see that "Cape Town" is now listedClick on your personal bookmark at a later date, and the map will jump to that location.To remove a bookmark, click the red cross beside the bookmark name.REMEMBER if you delete cookies from you browser you will loose your list of Bookmarks as well.Also the bookmark will not remember all the layers you had switched on at the time youcreated it, so it works only on the currently selected and viewable layers.Printing a <strong>Map</strong><strong>Biodiversity</strong> <strong>GIS</strong> (B<strong>GIS</strong>) <strong>Internet</strong> <strong>Map</strong> <strong>Tutorial</strong>27
Now you want to print your map.VERY IMPORTANT BEFORE PRINTING to make sure that the layer "world map" from the isunchecked and the map has been refreshed (an Automatically Refresh <strong>Map</strong> is fine) - NOW checkthat this layer is actually not displayed in the map window.After switching of the world map you are ready to start printing.Choose Print <strong>Map</strong>document, which you can print or save.from the toolbox at the top of the map to create a map as a PDFThe following dialogue box will appear<strong>Biodiversity</strong> <strong>GIS</strong> (B<strong>GIS</strong>) <strong>Internet</strong> <strong>Map</strong> <strong>Tutorial</strong>28
Select your paper size from the drop down menu listed as Template: Note that you now have achoice of several print options both landscape or portrait and with single or double columns forthe legend and up to 17x22 page. Please note that the paper size option still have to beincorporated in the B<strong>GIS</strong> online maps.However, due to LOW BANDWIDTH that generally operates in South Africa we recommend usingonly 8.5 x 11 page atleast initially. Pages larger THAN THIS WILL TAKE A CONSIDERABLE TIMETO RENDER! A 17X22 page with a LANDSAT image backdrop will take a couple of minutes togenerate even on our Intranet!<strong>Biodiversity</strong> <strong>GIS</strong> (B<strong>GIS</strong>) <strong>Internet</strong> <strong>Map</strong> <strong>Tutorial</strong>29
The next step is to set the scale at which you would like your map to be printed. If you selectnothing, the map will print at the current scale that is seen in the viewer.We generally recommend that you select nothing (default) since changing the scale will changethe "Area of Interest" of the map and also can change which layers are viewable - so you willget a map that looks quite different to your view.If you wish to print at a specific scale we would recommend that your first view the map atthat scale using the Scale box in the Status frame (at the bottom). To set a scale for printing,you must choose a scale from the drop-down listImportant Note! Due to the issue of Scale Error on Monitors and that not allmonitors use the same size screen and resolution it is strongly advised thatyou view the map at one of the following scales on the left and then alsoselect this scale from the drop down menu. If you do not do this it couldhappen that not quite the same layers that you viewed are printed.CAUTION: <strong>Map</strong>s obtained using our sites are not designed to assist innavigation nor are to be used in any legal action or land issue dispute.These maps are generalized and may not reflect current conditions.Uncharted hazards may exist which were unknown to us.<strong>Biodiversity</strong> <strong>GIS</strong> (B<strong>GIS</strong>) <strong>Internet</strong> <strong>Map</strong> <strong>Tutorial</strong>30
DO NOT USE THIS MAP FOR NAVIGATIONAL PURPOSES.Next add a title and notes for your map.Once you have finished setting up your map for printing, click the OK button to generate a NEW<strong>Map</strong> dialogue window which will look similar to the one below.Open the map or right click and choose save as.Because B<strong>GIS</strong> prints maps to Adobe PDF format you must have the free Adobe Acrobat Readerinstalled on your computer (if you do not we have provided you with a link to Adobe so thatyou can install it before viewing). Depending on the nature of your request, it can takeanywhere from 10 seconds to a minute or two to generate your map. Since the PDF file may belarge (up to 1MB) it may take additional time to download to your machine depending on thespeed of your <strong>Internet</strong> connection.When you get your <strong>Map</strong> it has the following basic structure - there are of course quite a fewvariations on this theme and you will need to experiment a little to see which one suits yourpurpose best.<strong>Biodiversity</strong> <strong>GIS</strong> (B<strong>GIS</strong>) <strong>Internet</strong> <strong>Map</strong> <strong>Tutorial</strong>31
Email a map imageUse the Email buttonto send your current map view as a PDF map or as a JPEG image.Firstly specify the address you wish to "email to" in the E-mail To: field in the informationpanel (to specify multiple email recipients separate each email address using a comma).Next enter "your email address" in the E-mail From field. The E-mail From field is not onlyused to inform a recipient who sent the attachment, but also used to email an alert if theemail is undeliverable to the recipient.You are also asked to specify the attachment format in the Information Panel. Select eitherAdobe Acrobat (.PDF) or Source Image (.jpg) format from the drop-down menu. You mayinclude any comments that you would like to accompany the email in the Comments: field andclickto send to am email with the attached map image.<strong>Biodiversity</strong> <strong>GIS</strong> (B<strong>GIS</strong>) <strong>Internet</strong> <strong>Map</strong> <strong>Tutorial</strong>32
If you wish send an image rather than a PDF document forsomebody else to insert in a report you can change theAttachment format: to reflect an image document. Depending onwhich Web <strong>Map</strong> Service you are using it will be either PNG, JPG orGIF formats. For all Web <strong>Map</strong> Services that use an OGC layerindicated by the availability of the World <strong>Map</strong> folder (see right)this will be a PNG file.<strong>Biodiversity</strong> <strong>GIS</strong> (B<strong>GIS</strong>) <strong>Internet</strong> <strong>Map</strong> <strong>Tutorial</strong>33
Drill DownThe Identify Tool displays attributes for the active layer only and is one of the mostcommonly used tools. However, if you were interested in finding out everything you can abouta particular location on the map, it would be frustrating to have to make active and identifyeach layer idividually. We don't want you to get frustratedFor this reason, we offer you the Multiple Layer Identify tool .It is simple and powerful. When you click on a point on the map, it drills down through the dataand gives you information for all the layers turned on at that location.To try this open the "Renosterveld <strong>Map</strong> 3 Ecosystem Status" and zoom into an area nearWellington again.Choose the layers tab and click on the switch on all layers icon . nest to the "EcologicalProcess" folder within the "Renosterveld layers" folder. Notice that all the layers within thisfolder will be ticked and will now appear on the map.<strong>Biodiversity</strong> <strong>GIS</strong> (B<strong>GIS</strong>) <strong>Internet</strong> <strong>Map</strong> <strong>Tutorial</strong>34
Selecting theand move your mouse over an area near Wellington where several layersappear to intersect. On release of the mouse a report is generated in the Information Panel.Repeat the above exercise by adding visible layers to report upon.<strong>Biodiversity</strong> <strong>GIS</strong> (B<strong>GIS</strong>) <strong>Internet</strong> <strong>Map</strong> <strong>Tutorial</strong>35
Caution: The drill down is a useful tool, but it can take some time if you have a lot of layersvisible so you may need to be fairly patient when using it.Identify RadiusThe Identify by Radius tooldefined circle.allows users to get attribute information from a layer within aSelect the Identify by RadiusA menu will open in the Information Panel.tool and click on a location on the map to mark a central point.Select a layer from the dropdown menu from which you want to identify features (availablelayers are those visible and are potentially selectable. You can select any of these layers). Nextenter a distance and units and click OK. In the example below we want to identify all featuresfrom the layer "Renosterveld River Corridors" within 5 km of the point of selection (nearWellington).The results will be displayed in the information window, and a circle will mark the defined areaon the map.<strong>Biodiversity</strong> <strong>GIS</strong> (B<strong>GIS</strong>) <strong>Internet</strong> <strong>Map</strong> <strong>Tutorial</strong>36
XY locationYou can add an XY location to any map using the XY location tool . Open any map using the. Here we opened the "Formally Protected Areas - South African National Parks" mapand zoomed into the Cape Peninsula. Choose the and click on the map. We clicked on CapePoint. The XY location is shown on the map. It will also appear on the map if it is printed.If you have been following this tutorial, CONGRATULATIONS. You have finished the reallyimportant section of learning to use these maps. Pretty painless, wasn't it?<strong>Biodiversity</strong> <strong>GIS</strong> (B<strong>GIS</strong>) <strong>Internet</strong> <strong>Map</strong> <strong>Tutorial</strong>37
At this point you can go look at a map and use what you just learned or you cancontinue on with the next section of the tutorial. This intermediate section will guide youthrough tasks like finding particular locations, go to other map services, performing someselections, extracting coordinates and emailing your map to another person.Using Intermediate Features of the B<strong>GIS</strong> <strong>Map</strong> ViewerThis section looks at the slightly more advanced <strong>GIS</strong> functionality that is possible with B<strong>GIS</strong><strong>Internet</strong> maps. Specifically, it shows you how to ask questions of the information (and getuseful answers).In the "Navigating the <strong>Map</strong>s" section we dealt with the Opening a map, Legends, Layers, Refresh<strong>Map</strong>, Find Location and Bookmarks, now we will deal with the Select options.All B<strong>GIS</strong> <strong>Map</strong>s open with thedisplayed.The Expanded Toolbox<strong>Biodiversity</strong> <strong>GIS</strong> (B<strong>GIS</strong>) <strong>Internet</strong> <strong>Map</strong> <strong>Tutorial</strong>38
By default, the map opens with the Expanded Toolbox closed . There are a number of toolswithin the Expanded Toolbox that allow you to perform more advanced tasks. Please notethat the contents of the Expanded Toolbox may vary from application to application.Clicking this graphicopens the Expanded Toolbox.Clicking this graphiccloses the Expanded Toolbox.The tools you will read about on this page are found within the Expanded Toolbox.Selecting Features SpatiallyIn the example below we use the "STEP <strong>Map</strong> 3 Protected Areas". Open this map by using the<strong>Map</strong>s tab and use the Find location tab to zoom to the "Blue Crane Route Municipality", zoominto the Area around Sommerset East.You can select specific spatial features and look at their attributes. This is essentially asking,what are the attributes of these specific features?To do this, you must pick the Select tool from the Expanded Toolbox and ensure that isthe selected tool (See Status Bar to confirm)Using the Layers tab make sure the layer "STEP Protected Areas (Type 1, 2 and 3)" is VISIBLE, ACTIVE layer and SELECTED<strong>Biodiversity</strong> <strong>GIS</strong> (B<strong>GIS</strong>) <strong>Internet</strong> <strong>Map</strong> <strong>Tutorial</strong>39
NOTE you may need to refresh you Layers by using thewith the selection toolas shown in the layer list above.tab bar so as to update the layersIf you examine the Status Bar at the bottom it will show something similar to this where STEPProtected Areas (Type 1, 2 and 3) is the selected layer.Now click on the <strong>Map</strong> on the Dark Blue Reserve just north of Sommerset East. The <strong>Map</strong> willrefresh and the Reserve is shown in yellow indicating it is now selected. The attributes thatbecame selected are listed in the Information Panel.<strong>Biodiversity</strong> <strong>GIS</strong> (B<strong>GIS</strong>) <strong>Internet</strong> <strong>Map</strong> <strong>Tutorial</strong>40
In the example above we clicked on a single feature however if you are not zoomed insufficiently you may select more than one feature. Essentially when you put your mouse over aparticular area it selects more than just one pixel - in fact it selects 5 by 5 pixels (since that isthe resolution we have set our <strong>GIS</strong> to work under). If we made it too fine (high resolution) itwould be difficult to place you cursor on the feature you wish to identify and make selectionfar too sensitive. Thus sometimes more than one feature may be selected. In order to separateeach record when multiple records are identified each alternative record has a beigebackground. You can click on the blueto see more detail.You can do far more complicated "Selection" from the Tab Function Bar use thewill provide you with the follow selection tools.. ThisClear SelectionsBefore you try this function you must have attributes from a table selected (in other wordshighlighted in yellow.From the Tab Function Bar choose theappear and click on Clear Selections.and the following selection dialogue box willYour selection will be cleared from the map and you will receive a notification in theinformation Panel.<strong>Biodiversity</strong> <strong>GIS</strong> (B<strong>GIS</strong>) <strong>Internet</strong> <strong>Map</strong> <strong>Tutorial</strong>41
If you have more than one feature from different layers selected on the map you will be ableto choose which layer's selections you wish to remove.Please note You Cannot Undo a Clear Selection.This function can also be executed using thefrom the toolboxRecommendation: unless you want to print a map with features selected (they usually appearshaded yellow but could be usefully deployed to highlight a particular attribute/feature thatyou wish to emphasise) it is a good idea to hit this button before you create a print page.Select by bufferSelect by buffer requires that you have already selected attribute/attributes and that you wishto select more using a distance buffer. You may use the same map you used in the previoussection (Selecting Features Spatially) with the "Bosberg Local Nature Reserve" selected. Click<strong>Biodiversity</strong> <strong>GIS</strong> (B<strong>GIS</strong>) <strong>Internet</strong> <strong>Map</strong> <strong>Tutorial</strong>42
on the and choose Select by buffer (Check that you are using the in the expandedtoolbox).The following form in the Information Panel will help you with the selection. Choose STEPProtected Areas (Type 1, 2 and 3) from the top drop down box and a 70 kilometer buffer. Noteyou do not necessarily have to select from the same layer that you did the first selection.After clicking OK the attributes of all STEP Protected Areas (type 1, 2 and 3) that are within 5kilometers of Bosberg Local Nature Reserve are show in the Information Panel. These featuresare indicated in yellow on the map and the buffer area shaded with grey lines.<strong>Biodiversity</strong> <strong>GIS</strong> (B<strong>GIS</strong>) <strong>Internet</strong> <strong>Map</strong> <strong>Tutorial</strong>43
Select using Query BuilderThe Query Builder has not yet been set up to do complicated queries. The JSP programs existsto execute both a simple SQL type query such as below which is to find a Protected Area withthe name Blouberg (Malebocho). You can also make nested queries using "AND", "OR", "NOT" aswell as use brackets. It is case of "Watch this Space" as we will be extending functionality ofthe Select functions.<strong>Biodiversity</strong> <strong>GIS</strong> (B<strong>GIS</strong>) <strong>Internet</strong> <strong>Map</strong> <strong>Tutorial</strong>44
Select by LayerSelect by layer requires that you have already selected attribute/attributes and that you wishto select more using a distance buffer. You may use the same map you used in the section(Select by buffer) with the Bosberg Local Nature Reserve selected. Check that you are usingthe in the expanded toolbox.Click on the an turn on the layer "STEP: Vegetation - Thicket Solid" in the vegetationfolder of the STEP Layers folder Click on the and choose Select by layer. In the top<strong>Biodiversity</strong> <strong>GIS</strong> (B<strong>GIS</strong>) <strong>Internet</strong> <strong>Map</strong> <strong>Tutorial</strong>45
dropdown box choose "STEP: Vegetation - Thicket Solid" and click OK.The attributes of all features of the layer "STEP Vegetation - Thicket Solid" which intersect withthe selected feature in the layer "STEP Protected Areas (type 1, 2, and 3)" (Bosberg Lacalnature Reserve) are shown in the Information Panel (Escarpment thicket). The map refreshes toindicate this feature in yellow.If you attempted to select for feature that does not intersect with the selected feature thesystem will return with a dialogue box report that no features were found. In the examplebelow we tried an interception of "Bosberg Local nature Reserve" and "South African NationalParks".<strong>Biodiversity</strong> <strong>GIS</strong> (B<strong>GIS</strong>) <strong>Internet</strong> <strong>Map</strong> <strong>Tutorial</strong>46
Select by AttributeThe Selected by Attribute has not yet been set up in the B<strong>GIS</strong>. The JSP programs exists toexecute this type of query which is a simpler form of the SQL type query using the QueryBuilder. Other <strong>Map</strong> Service have had this enabled and you may use the following link to open upa window with Protected Areas represented by their full cadastral boundaries.http://mapserver.uwc.ac.za/imf-aims50/imf.jsp?session=58889Once you have open up the above site you need to click on theattribute from the following menu.and then Select byIn this example you will selected smaller (less than 1352 ha) Protected Areas. The Layer Namewill be Protected Areas and from the Field you need to select Total Area. You either put in avalue or use theto identify a reasonable value to enter into the AttributeValue field. In the example below we used the Example values and selected 1352 - so we willselect all Protected Areas smaller than 1352 ha. At this point you either select all ProtectedAreas with in the layer or only Protected Areas that are visible within you current map view.<strong>Biodiversity</strong> <strong>GIS</strong> (B<strong>GIS</strong>) <strong>Internet</strong> <strong>Map</strong> <strong>Tutorial</strong>47
Try doing this selection with theun-ticked and ticked to seewhat happens. Using the un-ticked option will return the following results and you can thenpan around to see all of the Protected Areas that were selected.If you had ticked theof map window above would have been selected.only Protected Areas with the extentsSelect by PointYou need ensure that layer you wish to select from is selectable e.g.point.then choose theand then choose Select byNow you can click on a feature on the map to select it. In essence the Select by point from theis identical to using the from the toolbox.Selection by BoxIn the example below we use "STEP <strong>Map</strong> 2 Vegetation." Open this map by using theuse theto zoom to the Great Kei Municipality.and<strong>Biodiversity</strong> <strong>GIS</strong> (B<strong>GIS</strong>) <strong>Internet</strong> <strong>Map</strong> <strong>Tutorial</strong>48
Make sure that you have clicked on the in the Expanded toolbox. Now choose the layers taband make the layer "STEP Vegetation - Thick mosaic" in the vegetation folder of the STEP layersfolder selectable.Click on theand choose Select by box. A dialogue box will to tell you that you can nowyou your mouse to select features by specifying a box on the map.Click OK to close this window and draw a box around Komga on the Main <strong>Map</strong> Window. Whenyou release the mouse all the attributes of all the features within the STEP Vegetation - thicketMosaic layer that fall within your box will appear in the Information Panel. The features will beindicated in yellow on the map when it refreshes.<strong>Biodiversity</strong> <strong>GIS</strong> (B<strong>GIS</strong>) <strong>Internet</strong> <strong>Map</strong> <strong>Tutorial</strong>49
You can use theto go to each attribute that was selected.Select by PolygonSet up the map as you did in the previous example or you can clear the selection (See Clearselection).Click on the and choose Select by polygon. A dialogue box will to tell you that you cannow you your mouse to select features by specifying your polygon on the map.Click OK to close the dialogue box. You can now start to digitize your polygon by clicking on themap around Komga. As you click on the map the points will be recorded in the left andInformation Panel. When you are finished you can click submit to process the selection or clearif you made a mistake like drawing a polygon with cross lines that cannot be processed.<strong>Biodiversity</strong> <strong>GIS</strong> (B<strong>GIS</strong>) <strong>Internet</strong> <strong>Map</strong> <strong>Tutorial</strong>50
All the attributes of all the features within the "STEP Vegetation - thicket Mosaic" layer thatfall within your polygon will be shown in the Information Panel. The features will be indicatedin yellow on the map when it refreshes.<strong>Biodiversity</strong> <strong>GIS</strong> (B<strong>GIS</strong>) <strong>Internet</strong> <strong>Map</strong> <strong>Tutorial</strong>51
You can use theto go to each attribute that was selectedIt is Very Important to Note that while digitizing this particular feature that at one stage youwill getIn this case you can actually ignore and continue, as long as your final polygon has no crossoversit will be fine.If you have continued following this tutorial, your are well onto the way to understandinghow useful a <strong>GIS</strong> is and how convenient our Web <strong>Map</strong> Services are.At this point you can find particular locations, perform some selections, extractcoordinates and print and email your map. Now the fun begins with our advance features youcan really share and generate your own spatial data. Collaboration is the name of the game andwith the B<strong>GIS</strong> Web <strong>Map</strong> Service it couldn't be easier.Using Advanced Features of the B<strong>GIS</strong> Online <strong>Map</strong>sAdvanced features are available in the B<strong>GIS</strong> Online <strong>Map</strong>s that even allow you to share your datawith our Web <strong>Map</strong> Service, create Shape files and Layers.<strong>Biodiversity</strong> <strong>GIS</strong> (B<strong>GIS</strong>) <strong>Internet</strong> <strong>Map</strong> <strong>Tutorial</strong>52
"CLIP, ZIP n' SHIP" essentially allows you to clip a subset of the B<strong>GIS</strong> Online <strong>Map</strong>s data anddownload for use on your desktop using either a free <strong>GIS</strong> Viewer (Arc Explorer) or your own <strong>GIS</strong>package ArcView 3.3 or Arc<strong>GIS</strong>. The files once unzipped are in ESRI Shape format which isalmost universally read by desktop <strong>GIS</strong> packages."SHAPE n' SHARE"You can mark-up the B<strong>GIS</strong> Online <strong>Map</strong>s with point, polylines and polygons, store these as eithersession files (to store on your computer) or store on our server as handy bookmarks which canbe distributed to your colleagues as a convenient email link. You can even download all of yourmark-ups as zipped shape files to use on your desktop <strong>GIS</strong>."SECURE VIEW"Got sensitive data that you do not want other people to use but do want to view it with ourWeb <strong>Map</strong> Services. Well it is now easy simply upload your Shape (.shp) and (*.dbf) and our Web<strong>Map</strong> Service will add it as an extra layer of information. It does have to be in the sameprojection system which in the case of the B<strong>GIS</strong> Online <strong>Map</strong>s is unprojected geographic coordinates(Latitudes and Longitudes based on decimal degrees). Once you have finished you canclose your browser and you data is safe with you. You can even save the view of your data asour session certificate files but for security these can only be viewed on your PC."WAYPOINT PLOT"Got lots of waypoints stored on your GPS? We think we have the easiest way to plot these in a<strong>GIS</strong>, that's right directly onto our the B<strong>GIS</strong> Online <strong>Map</strong>s. Save your GPS points with one row forheader of information and three columns representing your ID and Latitude (Y) and Longitude(X). In Excel save as Comma Separated Value file (*.csv) and upload this file onto our Web <strong>Map</strong>Services for easy viewing.OGC COMPLIANTWhat is OGC, well it's a big thing in <strong>GIS</strong> it stands for Open <strong>GIS</strong> Consortium and has beendeveloped to ensure interoperability between different <strong>GIS</strong> users - in brief to be able toexchange Geographical data using a common format known as Geographic Mark Up Language(GML). The B<strong>GIS</strong> Online <strong>Map</strong>s allow other OGC Web <strong>Map</strong> Services to be added to our own layersof information. We have even gone a step further and given you the ability to clip out datafrom our <strong>Map</strong> layers and to download it as zipped GML files.<strong>Biodiversity</strong> <strong>GIS</strong> (B<strong>GIS</strong>) <strong>Internet</strong> <strong>Map</strong> <strong>Tutorial</strong>53
In order to get access to all of these neat new feature plus some old favourites you must usethe expanded toolbox ( red toolbox).In the next sections we use an exercise which takes advantage of these featuresExercise using advanced featuresIn the next sections we are going to complete an exercise which uses the advanced features ofthe B<strong>GIS</strong> online maps. These include1. Measuring distances2. Extracting to Excel and GML3. Uploading Shape files4. Uploading GPS Way Points5. Using Markup tools6. Saving aand opening projects7. Saving and sharing a session8. Downloading markup to a shape file9. Extracting to Shape file10. Downloading the zipped layer informationSetting up a map for the exercise.We are going to look at an imaginary example of a farmer who needs help in deciding where toplough a new field on his farm near Genadendal which we know has remnant patches ofrenosterveld containing a rare geophyte.Using the open the "Base <strong>Map</strong>". Use the and Municipalities towns to zoominto the Theewaterskloof Municipality. In order to orientate yourself use theto turn onthe "Towns" layer in the "Towns" folder of the "Base layers" folder. Zoom into the area aroundGenadendal. (We have turned off the World <strong>Map</strong> layer which is not useful at this zoom level.)Measuring DistancesPerhaps you want to measure the length of a section of a River or Road.. You can measuredistance on maps using the Measure Distance tool which is located in the expanded toolbox.After you have made the tool active, click on the desired start location. The latitude andlongitude coordinates of your starting point are automatically registered in the Information<strong>Biodiversity</strong> <strong>GIS</strong> (B<strong>GIS</strong>) <strong>Internet</strong> <strong>Map</strong> <strong>Tutorial</strong>54
Panel. By adding another node you complete one line, and the position of the second node andthe distance between the two nodes is given.ExerciseWhile doing the project you will be staying in Greyton you would like use the map to measurethe distance to the farm near Genadendal. Using the you can measure this distance.If you make a mistake and wish to erase the points, use the Clear Points button found in theinformation panel. Once you have drawn the route, you can even print the map.You can see that the distance to the farm from Greyton is 5.6 kilometers.You can remove the distance measurement line drawn on your map by clicking on the<strong>Biodiversity</strong> <strong>GIS</strong> (B<strong>GIS</strong>) <strong>Internet</strong> <strong>Map</strong> <strong>Tutorial</strong>55
Measure AreaThe Measure Area tool is another handy tool that lets you calculate the area inside a polygon.This tool is not available on the B<strong>GIS</strong> Online <strong>Map</strong>s as it requires projected <strong>GIS</strong> layers ofinformation. The layers of information on the B<strong>GIS</strong> Online <strong>Map</strong>s are unprojected in dregreeslatiude, longitude.By selecting the Measure Area button from the Expanded Toolbox you are able to define thevertices (corners) of a polygon by clicking on the map. The Measure Area tool requires that youspecify a minimum of three vertices before the Geocortex servers are able to calculate anarea. The Measure Area tool allows you produce an accurate estimation of any polygon's area,as you are able to add as many vertices as you deem necessary to represent the area to becalculated. The calculated area is returned in the Information Panel with a record of the allthe vertices' coordinates.To clear the points use the Clear Points button, in the Information Panel.Upload Shape filesUpload Shape Files Tool will allow you to upload a ESRI Shape file that is unprojected(Geographic Lat/Longs using the WGS84 ellipsoid) onto the map service and view it. The shapefile needs to be 1 MB or less.ExerciseWe are going to up load the boundary of thefarm near Genadendal to the map.First you need the farms boundary. You can download a copy of the zipped copy of the shapefile from the following URL http://bgis.sanbi.org/maptutorial/downloads/farmboundary.zipWhen the file has downloaded unzip it to a location on you computer.Now click on the . A form will appear in the Information Panel. Browse to find the shapeattribute file (dbf) - farmboundary.dbf and the shape spatial file (shp) - farmboundary.shpwhere you unzipped these on you computer. Fill in a title for the new uploaded layer and acolour.<strong>Biodiversity</strong> <strong>GIS</strong> (B<strong>GIS</strong>) <strong>Internet</strong> <strong>Map</strong> <strong>Tutorial</strong>56
Click OK and the file will be uploaded. You will receive a notification that in order to see thenew layer you must turn in on using the .Make the layer visible.<strong>Biodiversity</strong> <strong>GIS</strong> (B<strong>GIS</strong>) <strong>Internet</strong> <strong>Map</strong> <strong>Tutorial</strong>57
Extract to ExcelUse the Extract to Excel Toolto output a listing of layer information into an Excel file.Clicking the will allow you to select the layer from which you would like to download, theextent of the data and whether you are only interested in downloading selected features. Onceyou have specified the Extract Layer parameters, click OK. You are able to download theextracted information as a zip file, or open the Excel file directly by clicking on theappropriate hyperlinks found in the Information Panel.ExerciseWe would now like to extract the threatened vegetation present on the farm to an Excelspreadsheet for reference. First we have to select the farm using select by polygon.<strong>Biodiversity</strong> <strong>GIS</strong> (B<strong>GIS</strong>) <strong>Internet</strong> <strong>Map</strong> <strong>Tutorial</strong>58
Choose the and make the "Renosterveld Ecosystem Status" and "Renosterveld PriorityClusters" layers visible in the "Renosterveld Layers" folder. Also make the layer "RenosterveldEcosystem Status" selectable.Choose the and choose Select by polygon in the Information Panel. You will receive anotice that you can now start drawing you polygon. Digitise the farm boundary, the pointswhere you click will appear in the Information Panel. You can zoom into the farm to helpyou with your digitising. When you are finished click OK.<strong>Biodiversity</strong> <strong>GIS</strong> (B<strong>GIS</strong>) <strong>Internet</strong> <strong>Map</strong> <strong>Tutorial</strong>59
The attributes of all the selected features of the layer "Renosterveld Ecosystem Status" withinthe polygon will appear in the Information Panel and the polygon and the features will appearin yellow on the map.<strong>Biodiversity</strong> <strong>GIS</strong> (B<strong>GIS</strong>) <strong>Internet</strong> <strong>Map</strong> <strong>Tutorial</strong>60
You are now ready to extract the attributes of these features to an Excel spreadsheet. Click onthe a form will appear in the Information Panel. Choose the layer "Renosterveld EcosystemStatus". Please note that some layers are not available for extract and only the layers that areavailable will be listed. Set Within visible extendsonly to No and Within selected featuresonly to yes.Click OK and you will receive another dialogue box informing you that 73 features were writtento the file and asking whether you wish to download the zipped Excel file or open the file.<strong>Biodiversity</strong> <strong>GIS</strong> (B<strong>GIS</strong>) <strong>Internet</strong> <strong>Map</strong> <strong>Tutorial</strong>61
You can choose either of these options. Open the file if you chose the first option to view thedata. You can see all the patches of vegetation which intersect with the boundary of the farmand their Ecosystem Status either V- Vulnerable or CE Critically Endangered.Extract GMLUse the Extract GML Toolto extract features to a GML file.To use the extract tool click the tool, located in the expanded toolbox. A listing of options willbe displayed in the information panel. Select the map layer that you are interested in from the<strong>Biodiversity</strong> <strong>GIS</strong> (B<strong>GIS</strong>) <strong>Internet</strong> <strong>Map</strong> <strong>Tutorial</strong>62
drop down menu. Please note that some layers are not available for extract and only the layersthat are available will be listed. Next select whether you are interested in selecting onlyfeatures that are within your current extent. Finally specify whether to extract selectedfeatures only. Once you are satisfied with your selection click OK.Once the extract is complete, you are able to download a zip file containing the extracted dataor you are able to open the GML file directly to view or save. If you do not receive the totalnumber of features that you expected to extract it may be because there are limits set on thenumber of features that can be exported at one time. Simply select another feature set andagain extract the layer to GML.Extracting to GML is similar to extraction to Excel describe in the previous section and is notincluded in the exercise.Upload GPS waypointsUpload GPS Waypoints Tool will allow you to upload waypoints obtained from your GPS ontothe <strong>Map</strong> Service. The GPS data need to be a Comma Separated Value (CSV) that can begenerated from Excel. The file must have three columns one for identifying the point and theother two columns for Latitude (Y) and Longitude (X). Please note the X and Y coordinates mustbe in Decimal Degrees so for southern Africa Y will be negative and X positive. The order of thecolumns makes no difference.ExerciseA colleague collected GPS points of where the rare geophyte in found on the Genadendal farm.He entered these into an Excel spreadheet as follows.<strong>Biodiversity</strong> <strong>GIS</strong> (B<strong>GIS</strong>) <strong>Internet</strong> <strong>Map</strong> <strong>Tutorial</strong>63
In order to upload these points we need to save the file as a comma delimited file or CSV file.This can be done in Excel using Save as and choosing CSV. Or you can simply make a file likethe one below in Notepad and change the file extension to .cvsOnce saved as CSV the above table will look like the following ASCII filewaypoint ID,X,Y1,19.544619,-34.0496252,19.545694,-34.0506173,19.543217,-34.0487174,19.534592,-34.0525975,19.543711,-34.0528476,19.552467,-34.0513587,19.550981,-34.0484698,19.548006,-34.0490479,19.550403,-34.048810,19.5561,-34.05045Go to the following URL to download a copy of this CSV file.http://bgis.sanbi.org/maptutorial/downloads/geophytes.csvClick on and a form will appear in the Information Panel. You can now find your copy of thegeophytes.csv file and and click Upload CVS file.<strong>Biodiversity</strong> <strong>GIS</strong> (B<strong>GIS</strong>) <strong>Internet</strong> <strong>Map</strong> <strong>Tutorial</strong>64
Once you have uploaded your CSV the following dialogue box will appear to direct whichcolumns to use for X and Y and the name for the layer you are adding.On submitting you will get the following screen<strong>Biodiversity</strong> <strong>GIS</strong> (B<strong>GIS</strong>) <strong>Internet</strong> <strong>Map</strong> <strong>Tutorial</strong>65
You can now go to your layers function Tab Bar and can view the layer which has been added.In the case below it was "Geophytes". The areas with geophytes appear as red squares on themap.If you cannot see you uploaded points we suggest that you zoom out to see entire world andturn on the World map layer. This will highlight any possible mistakes like transposing of the Xand Y axis and allocating of negative values to southern and western hemispheres.The Markup ToolsThe Markup tools are those that allow you to add your own information to maps. You can addpoints, lines, rectangles, polygons, labels, latitude and longitude coordinates, and custom textto your maps for printing. The following Mark up tools are available.• The Add Point Markup Ttool allows you to draw points on the map. To add a point,make the Add Point to <strong>Map</strong> tool active, click on the desired map location and a pointwill be added. Use the tool to add multiple points to your map viewer.• The Add Line Markup Tool allows users to draw lines on the map. Make the AddLine to <strong>Map</strong> tool active and click on the map to mark a starting point for your line.Click a second point on the map to draw the line. Add as many segments to the line as<strong>Biodiversity</strong> <strong>GIS</strong> (B<strong>GIS</strong>) <strong>Internet</strong> <strong>Map</strong> <strong>Tutorial</strong>66
you desire and when you are satisfied with your map click OK to add the line to themap. Click the Clear button at anytime to erase your line.• The Add Rectangle Markup Tool allows you to draw a semi-transparent rectangle onthe map. After making the Add Rectangle to <strong>Map</strong> tool active, click and hold the mousebutton down, dragging a box to the desired size of your rectangle, release the mousebutton to add the graphic to your view.• The Add Polygon Markup Tool allows users more flexibility than the rectanglemarkup tool. Please note that a polygon has to have at least 3 points. Users can drawpolygons on the map by clicking once on the map to mark a start/end point for thepolygon. Next add at least 2 more points by clicking on the map in the desired location.Once you have finished adding points to your polygon, click the OK button to add it tothe map. Click the Clear button at anytime to erase your polygon.• The Add Text Markup Tool allows users to add text directly to the map. Make theAdd Text to <strong>Map</strong> tool active, and click on your desired location on the map. Type in thetext as you want it to appear on the map in the text box, and then click OK to add it tothe map. Note that you have the option of selecting the font colour and size for yourlabel.• The Add Label Markup Tool allows you to automatically label features on the map.Select the Add Label to <strong>Map</strong> tool and click on a feature that you want to label. A newwindow will appear in the Information Panel. Select the layer that you want to labeland the field from which the text will be taken, then click OK. Note that you have theoption of selecting the font colour and size for your label.• The Add Grid Markup Tool places a grid on the map. Select the tool, and theInformation Panel prompts you to specify the number of horizontal and vertical gridcells (up to 10). The grid covers the area of the present map extent, even as you zoom,pan or otherwise navigate around the map.• The XY Location Markup Tool places a longitude and latitude coordinate on themap. Multiple locations can be added to your map view, and each location is markedwith a star.• The Erase Markup Tool allows you to delete selective markup that you have madeon the map. Select the tool and click once on any added text or graphic to erase the<strong>Biodiversity</strong> <strong>GIS</strong> (B<strong>GIS</strong>) <strong>Internet</strong> <strong>Map</strong> <strong>Tutorial</strong>67
Exerciseselected markup. Click, holding down the mouse, and drag a box around added text orgraphics to erase multiple graphics at one time. To erase all of the text and graphics ina map view choose the Clear Selection Tool .In our exercise we now want to draw a suitable area for the new ploughed field on the map.This area must not be on any of the rare geophytes and not in critically endangeredrenosterveld vegetation or in any of the Renosterveld priority clusters which cover most of thefarm. It should also be near a road so that we don't have to disturb vegetation by building anaccess road.Choose thetool and digitise on the map where you think the new field should be located.When you are finished digitising click OK.You can now choose from various options how you wish the polygon to appear on the map.<strong>Biodiversity</strong> <strong>GIS</strong> (B<strong>GIS</strong>) <strong>Internet</strong> <strong>Map</strong> <strong>Tutorial</strong>68
When you click OK, the polygon appears on the map.<strong>Biodiversity</strong> <strong>GIS</strong> (B<strong>GIS</strong>) <strong>Internet</strong> <strong>Map</strong> <strong>Tutorial</strong>69
We can now draw an access road to the field using the . Digitise on the map a suitableaccess road. When you are finish click OK and fill in the options for how you want the symbol toappear on the map and click OK.<strong>Biodiversity</strong> <strong>GIS</strong> (B<strong>GIS</strong>) <strong>Internet</strong> <strong>Map</strong> <strong>Tutorial</strong>70
You map now looks like this.Now we can add some text to our map using theto appear and fill in the option and click OK.. Click on the map where you want the text<strong>Biodiversity</strong> <strong>GIS</strong> (B<strong>GIS</strong>) <strong>Internet</strong> <strong>Map</strong> <strong>Tutorial</strong>71
<strong>Biodiversity</strong> <strong>GIS</strong> (B<strong>GIS</strong>) <strong>Internet</strong> <strong>Map</strong> <strong>Tutorial</strong>72
We now would like to label a feature on the map i.e. the type of vegetation where the newfield will be. We can use the . Click on the map where you wish the label to be. Fill in theoption in dialogue box the information Panel choosing the layer "Renosterveld EcosystemStatus" and the field VEGNAME. On clicking okay the label appears on the map.<strong>Biodiversity</strong> <strong>GIS</strong> (B<strong>GIS</strong>) <strong>Internet</strong> <strong>Map</strong> <strong>Tutorial</strong>73
Working with ProjectsSave ProjectThe Save Project Tool allows you to save the changes that you have made to the map. Tosave your project, click on the Save Project tool and a dialogue box will appear in theinformation panel. Click the link to download a project session file (.ssn) and save it to yourcomputer for later use.ExerciseYou can now save all the additions you have made to your map. This will not only save themarkup and uploaded files you have added to your map but also the open layers and the zoomparameters. Click on the and choose Save session now. You can then choose where to savethe session file for later use.<strong>Biodiversity</strong> <strong>GIS</strong> (B<strong>GIS</strong>) <strong>Internet</strong> <strong>Map</strong> <strong>Tutorial</strong>74
Open ProjectThe Open Project Tool allows you to open a previously saved project. To reopen a project,select the Open Project tool and locate the project session file (.ssn) on your computer.Save SessionThe Save Session Tool allows you to save a snap shot of your <strong>Internet</strong> mapping view. Clickthe Save Session tool to save your current map viewer extent, layer configuration, and anyadded mark-up to be accessed at a later date. The Save Session tool outputs a URL, which youcan email or add to your map browser favorites.<strong>Biodiversity</strong> <strong>GIS</strong> (B<strong>GIS</strong>) <strong>Internet</strong> <strong>Map</strong> <strong>Tutorial</strong>75
ExerciseYou can use the save session tool to send the map link of the map you have created to acolleague, the farmer or other interested parties for comments. They will receive the link in anemail. On clicking on the link the system will open up exactly as you saved it.Click on theand choose Email this link.Fill in the E-mail to, Email from and Message fields and click send to send the email.<strong>Biodiversity</strong> <strong>GIS</strong> (B<strong>GIS</strong>) <strong>Internet</strong> <strong>Map</strong> <strong>Tutorial</strong>76
Save Markups to Shape FileUse the Save Markups to Shape File Tool to generate simple Shape files (Point, Polyline orPolygon) that are zipped and shipped back to your desktop. Note these files will have notattribute data.ExerciseA colleague with a desktop <strong>GIS</strong> system would like to view and manipulate the information onthe map that you have made. You can download the mark ups on your map to a shape files onyour computer and send these to your colleague.Click on theand choose download shape file. You can enter where you would like to savethe generated files on you computer.<strong>Biodiversity</strong> <strong>GIS</strong> (B<strong>GIS</strong>) <strong>Internet</strong> <strong>Map</strong> <strong>Tutorial</strong>77
You can send the saved files to your colleague.Extract LayerUse the Extract layer toolto extract a shape file of a selected layer.When you click Extract layer a listing of all layers, which you are able to extract, are displayedin the Information Panel. Select a layer from the drop-down list and click OK to extract thelayer.ExerciseYou would also like to send the information for some of the other layers on your map to yourcolleague e.g. the "Renosterveld Ecosystem Status" and "Renosterveld Priority Clusters"Click on theand Click OK.choose the layer you wish to extract from e.g. Renosterveld Ecosystem Status<strong>Biodiversity</strong> <strong>GIS</strong> (B<strong>GIS</strong>) <strong>Internet</strong> <strong>Map</strong> <strong>Tutorial</strong>78
Choose where you would like to save the files on your computer. You can now send theextracted file for the layer to your colleague. Note that only the polygons that fall within thezoomed in area in the map viewer will be included in this file. If you would like to receive thatentire layer you will have to download it using the . This is explained in the nextsection.Downloading a layerYou can use the download tab to download the <strong>GIS</strong> information for an entire layer onthe B<strong>GIS</strong> online maps. The layer is in the form of a zipped ESRI shape file together with itsmetadata either as a MS Word document or an HTML file.<strong>Biodiversity</strong> <strong>GIS</strong> (B<strong>GIS</strong>) <strong>Internet</strong> <strong>Map</strong> <strong>Tutorial</strong>79
ExerciseYou would like to use the entire "Renosterveld Ecosystem Status" layer in your desktop <strong>GIS</strong>. Youcan download the layer by choosing the . The system will open a background map inthe main map window and a list of open folders with all the layers available for download inthe information panel. You can tick the tickbox next to a layer to view it before you downloadit. Note you can only view one layer within each of the folders at a time.Click on the "Renosterveld Ecosystem Status" in the Renosterveld layers folder to view on themap whether this is the layer you wish to download. The layer will appear on the map. If it isthe correct layer to click on the text "Renosterveld Ecosystem Status" to download the layer.You will be able to choose where on your computer you wish to save the downloaded zippedlayer.Select by BufferUse the Select by Buffer toolto generate a listing of features based on a selection.Before activating the Select by Buffer tool, ensure that you have a feature set selected.With a feature set selected click the Select by Buffer tool and choose from the drop-downmenu from which layer set you would like to select features. Next specify the buffer distance.If you have multiple layers with selected features you will be required to choose which layers<strong>Biodiversity</strong> <strong>GIS</strong> (B<strong>GIS</strong>) <strong>Internet</strong> <strong>Map</strong> <strong>Tutorial</strong>80
you would like to select features from in the drop-down menu. Click OK to execute yourbuffered selection.The number of selected features will be returned to you in the information panel. Click theExtent link to zoom to all features, or Clear to unselect the features. To view a listing of allselected features click Execute report for this set.Have you worked right through this tutorial? If you have well done you are wellonto yourway to be a <strong>GIS</strong> practitioner and you didn't even realize it. your are well onto the way tounderstanding how useful a <strong>GIS</strong> is and how convenient our Web <strong>Map</strong> Services are.At this point using your data and our Web <strong>Map</strong> Service should be part of your everydayoffice duties. We really hope you enjoyed using our Web <strong>Map</strong> Services - and to quote acorporate phrase "Saving you Time, Saving you Money" that's how we see our Web <strong>Map</strong> Services.Summary of built in functionality of the B<strong>GIS</strong> Web <strong>Map</strong> ServiceThe B<strong>GIS</strong> Web <strong>Map</strong> Service is configured using XML based on Java Server Pages.It uses FOUR servers, a MS SQL Database and SDE server, an ARC IMS server running JSP codeunder a Java Servlet container (Servlet Exec) which coordinates activities and a download ZIPserver. Various help facilities and metadata reside on our Content server.The following is a general list of pre-built functionality on the B<strong>GIS</strong> website. Note that this isnot a complete or final list of the capability of the site. New features are regularly added tothe source code based on enhancement requests from the user community.1. Geoprocessing capability (buffer, intersect, contains, etc.)2. Projection capabilities (coordinate conversion routines).3. Save and restore a user's session.4. Support for multiple toolsets.5. Button and tool bar with built-in tools that can be included in your sitea. Zoom to full extentb. Zoom to previous extentc. Display index map. Index map refreshes automatically when extent changesand can be clicked to reposition the map.d. Create printable map at specific scale in Adobe PDF format.e. Send the map to yourself or someone by e-mail.f. Drill-down identify tool to display information from all visible layers.<strong>Biodiversity</strong> <strong>GIS</strong> (B<strong>GIS</strong>) <strong>Internet</strong> <strong>Map</strong> <strong>Tutorial</strong>81
g. Identify tool to display information about active layer.h. Buffer identify tool to display information within a distance of a point.i. Zoom in using mouse click or rectangle.j. Zoom out by mouse click.k. Pan (recenter) by mouse click or dragging the map.l. Measure distance tool drawing multiple segment lines.m. Measure area tool drawing a polygon.n. Location tool adding marker and geographic position text to the map.o. User markup tools. Draw a point, line, polygon, box or add a grid or text to themap.p. Clear tool to remove user markup.q. Extract tool for saving features to a local shapefile, GML file, or Excelspreadsheet.r. Upload routines to display data in local shapefiles or GML files.6. Auto-generated help from XML text associated with tools and tabs.7. Feedback link to send an e-mail message to the site administrator.8. Advanced layer control.a. Layers grouped into nested folders.b. Legend graphics in layer list.c. Independently controlled visibility of a layer's labels.d. Display order independent of drawing order.e. Folder controls, all on, all off.f. Support for radio folders where only one layer can be on at a time.g. Layers can be hidden from user control.h. Virtual layers, layers organized into a group that appears as one layer.i. Metadata for layers or layer groups.j. Scale dependent layers.k. User restrictions preventing the user from changing visibility of a layer.l. Automatically refresh option.9. Advanced identify and selection routines.a. Automatic default report for queryable layers.b. Acetate layers are queryable like any other.c. Drill down identify report to show information from all visible layers.d. Field aliases or alternate display titles.e. Fields can be hidden from default reports.f. Fields containing URLs automatically hyperlinked.g. Extract selected records to shapefile, GML or Excel format.<strong>Biodiversity</strong> <strong>GIS</strong> (B<strong>GIS</strong>) <strong>Internet</strong> <strong>Map</strong> <strong>Tutorial</strong>82
10. <strong>Map</strong> limits can be set (maximum extent, minimum scale, etc.)11. Real-time coordinate display when user moves mouse over the map.12. North arrow on map, automatically angled.13. Scalebar on map, configurable units.14. <strong>Map</strong> centre coordinates printed on map in desired coordinate system.15. Scale display in status bar.16. Zoom to user-entered scale.17. Copyright message on map.18. Display legend information19. Extensible find location routines.a. Zoom to latitude / longitude position.b. Zoom to UTM position.c. Bookmarks, save and restore a location extent.d. Zoom to place name from extents saved in database.e. Find by a layer's attribute value.f. Easy to add more, defined in XML.Glossary of TermsHere is a glossary of terms that were used in the Help and <strong>Tutorial</strong>.A to BAcetate layer:An acetate layer is a custom layer to which a user can add objects for example. points or drawobjects such as polygons or lines, these objects may then be annotated by the user. The layerlist does not add an acetate layer to the layer collection and the acetate layer does notrepresent any data set (http://www.jot.fm/issues/issue_2004_04/article12).Active Layer:This is the <strong>GIS</strong> data layer from which features can be identified, queried, searched for orselected. Image layers cannot be activated and only one layer can be activated at a time. Tomake a layer active, the name of the layer in the layer list must be selected (clicked on)(http://sonris-gis.dnr.state.la.us/instruct_files_ext/tutslide6.htm).Apple (Macintosh):<strong>Biodiversity</strong> <strong>GIS</strong> (B<strong>GIS</strong>) <strong>Internet</strong> <strong>Map</strong> <strong>Tutorial</strong>83
Apple Macintosh is a family of personal computers manufactured by Apple Computer, Inc. TheMacintosh, (commonly called the "Mac") was the first successful implementation of thegraphical user interface, which is now an industry standard. Apple is known for its innovative,well-designed hardware, such as the iPod and iMac, as well as software such as iTunes, part ofthe iLife suite, and Mac OS X, its current operating system(en.wikipedia.org/wiki/Apple_Macintosh).ARC IMS:ARC IMS is a solution for delivering dynamic maps and services and <strong>GIS</strong> data via the web. ARCIMS provides a highly scalable framework for <strong>GIS</strong> web publishing that is needed by corporateIntranets and meets the demands of worldwide <strong>Internet</strong> access. A wide range of clients andcustom web applications can use it(http://www.esri.com/library/brochure/pdfs/arcims_bro.pdf).ASP:Active Server Pages (ASP) is Microsoft's server-side technology for dynamically-generated webpages that is marketed as an add-on to <strong>Internet</strong> Information Services (IIS)(http://en.wikipedia.org/wiki/Active_Server_Pages).Attribute:An attribute is information about a geographic feature in a <strong>GIS</strong> and is normally stored in a tableand linked to the feature by an identifier. Information in the attribute tables can be accessedwith the Identify, Search and Select tools (http://sonrisgis.dnr.state.la.us/instruct_files_ext/tutslide6.htm).Annotation:In a <strong>GIS</strong> an annotation is descriptive text, which is used to label coverage features(http://volusia.org/gis/glossary.htm).BandwidthBandwidth is the maximum data-carrying capability of a point-to-point telecommunicationsconnection as a result of the range of frequencies available to be occupied by signals, usuallyexpressed in terms of Hertz (Hz) in analogue systems and as the number of bits per second indigital systems.<strong>Biodiversity</strong> <strong>GIS</strong> (B<strong>GIS</strong>) <strong>Internet</strong> <strong>Map</strong> <strong>Tutorial</strong>84
(http://www.crtc.gc.ca/dcs/eng/glossary.htm)Bookmark:An electronic bookmark is similar to a paper bookmark and is used to remind the user withwhich page they were busy. An electronic bookmark is used to bring the user back to aparticular website or place on a page of text when they wish to return there(http://www.cheap-56k.com/glossary/bookmark.html).Broadband:Broadband in general refers to data transmission where multiple pieces of data are sentsimultaneously to increase the effective rate of transmission. In network engineering this termis used for methods where two or more signals share a medium. While many lower rate formsof data transmission, such as analog modems above 600 bit/s, are broadband, broadband hasbeen more closely associated with higher data rate forms of broadband data transmission suchas T-carrier and Digital Subscriber Lines. Therefore, the word "broadband" has also come tomean a relatively high rate, while the term "narrowband" is used to mean a relatively low rate(http://en.wikipedia.org/wiki/Broadband).Browser:An <strong>Internet</strong> Browser interprets HTML, which is the programming language of the World WideWeb into words and graphics when the user views a web page. Microsoft's <strong>Internet</strong> browser isthe most common browser, which controls 80% of the market. Other browsers include MozillaFireFox, Opera, Konqueror, Safari and Netscape(http://www.definethat.com/define/1336.htm).Buffer:A buffer is a polygon enclosing a point, line, or another polygon at a specified distance.Buttons:A button is a graphical representation of an electrical push-button appearing as part of aGraphical User Interface of a software application. Clicking on a button starts some softwareaction (http://www.definethat.com/define/1336.htm).C to DCSS:<strong>Biodiversity</strong> <strong>GIS</strong> (B<strong>GIS</strong>) <strong>Internet</strong> <strong>Map</strong> <strong>Tutorial</strong>85
In computing, Cascading Style Sheets (CSS) is a stylesheet language used to describe thepresentation of a document written in a markup language. Its most common application is tostyle web pages written in HTML and XHTML, but the language can be applied to any kind ofXML document (http://en.wikipedia.org/wiki/Cascading_Style_Sheets ).Client-side:In computer networking, the term client-side refers to operations that are performed by theclient in a client-server relationship. Typically, a client is a software program, such as a webbrowser, that runs on a user's local computer or workstation and connects to a server asnecessary. Operations may be performed client-side because they require access to informationor functionality that is available on the client but not on the server, because the user needs toobserve them or provide input, or because the server lacks the processing power to performthe operations in a timely manner for all of the clients it serves. Additionally, if the client canperform operations without sending data over the network, they may take less time, use lessbandwidth, and incur a lesser security risk (http://en.wikipedia.org/wiki/Client-side ).Context-sensitive:Context-sensitive refers to an application software feature that changes depending on what theuser is doing within the software. For example, context-sensitive help provides documentationfor the particular feature that the user is in the process of using(http://www.webopedia.com/TERM/C/context_sensitive.html).Coordinates:Coordinates indicate where a particular point is on a map in relation to the surface of theearth. They are expressed by the longitudinal extent (indicated as either north or south of theEquator) in relation to the latitudinal extent (indicated as either east or west of the GreenwichMeridian). Coordinates may be expressed in various formats including degrees, minute andseconds, decimal degrees and degrees and decimal minutes.Coverage:A <strong>GIS</strong> coverage stores features making up a map as primary features e.g. nodes, polygons, arcsand label points, and secondary features e.g. map extent, links, tics and annotations. A featureattribute table is associated with the coverage and describes and stores attributes of the mapfeatures. A coverage usually represents a single theme, or layer, such as soils, roads, or landuse. (http://volusia.org/gis/glossary.htm).<strong>Biodiversity</strong> <strong>GIS</strong> (B<strong>GIS</strong>) <strong>Internet</strong> <strong>Map</strong> <strong>Tutorial</strong>86
Database:A database is a collection of interrelated data, managed and stored as a unit. A <strong>GIS</strong> databaseincludes data about the spatial location and shape of geographic features recorded as points,lines, and polygons as well as their attributes (http://volusia.org/gis/glossary.htm).Datum:A datum is a set of parameters and control points used to accurately define the threedimensional shape of the Earth. The corresponding datum is the basis for a planar coordinatesystem (http://volusia.org/gis/glossary.htm).DBF (File format):DBF is the extension for files in the dBASE format, the first widely used database managementsystem or DBMS for microcomputers. Although dBASE never successfully managed the transitionto Microsoft Windows its underlying file format, the dbf file, is widely used in many otherapplications needing a simple format to store structured data(http://en.wikipedia.org/wiki/DBase).Decimal Degrees:Decimal degrees are a geographic coordinate system used for mapping the Earth's surface usingdegrees of latitude and longitude where each degree is divided into decimal fractions ratherthan minutes and seconds.Degrees, Minutes, Seconds:Degrees, minutes and seconds are a geographic coordinate system used for mapping the Earth'ssurface. The globe is divided into 180 degrees of latitude (90 on each side of the Equator); and360 degrees of longitude (starting at the Greenwich Meridian and counting up to 180 degrees toboth the East and West). Each degree is divided into 60 minutes and each minute into sixtyseconds.DNS:The Domain Name System (DNS) is an information system that stores the information associatedwith domain names in a distributed database on networks, such as the <strong>Internet</strong>. The domainname system associates many types of information with domain names, but most importantly,it provides the IP address associated with the domain name. It also lists mail exchange serversaccepting e-mail for each domain. The DNS makes it possible to attach hard-to-remember IP<strong>Biodiversity</strong> <strong>GIS</strong> (B<strong>GIS</strong>) <strong>Internet</strong> <strong>Map</strong> <strong>Tutorial</strong>87
addresses (such as 207.142.131.206) to easy-to-remember domain names (such as"wikipedia.org"). Humans take advantage of this when they recite URLs and e-mail addresses(http://en.wikipedia.org/wiki/Domain_Name_System).Drill down:In information technology drill down refers to moving from summary information to detaileddata by focusing in on something. In a <strong>GIS</strong> a drill down identify generates information from theattribute tables not only for the geographical point on the layer which is active but also for allother layers at that point which may be hidden(www.google.co.za/search?hl=en&q=define%3Adrill+down&meta=).Dynamically generated:Dynamically generated in computing refers to an output that is made at runtime by theinvocation of scripts or programs that are ultimately requested by a user, or theprogrammed/scheduled events supported by the Web server(www.google.co.za/search?hl=en&q=define%3Adynamically+generated&meta=).E to FEmail:Electronic mail, abbreviated e-mail or email, is a method of composing, sending, and receivingmessages over electronic communication systems. The term e-mail applies both to the <strong>Internet</strong>e-mail system based on the Simple Mail Transfer Protocol (SMTP) and to intranet systemsallowing users within one company or organization to send messages to each other. Often theseworkgroup collaboration systems natively use non-standard protocols but have some form ofgateway to allow them to send and receive <strong>Internet</strong> e-mail.(http://en.wikipedia.org/wiki/Email)ESRI:ESRI (Environmental Science Research Institute) is a leading company in <strong>GIS</strong> technology. Itprovides desktop to <strong>GIS</strong> server solutions and data management systems. Software productsfrom ESRI include ArcView, Arc<strong>GIS</strong>, ArcCAD, <strong>Map</strong>Objects, ArcIMS and ArcSDE"(www.webgis.net/cms.php/glossary.html).Excel (Microsoft):<strong>Biodiversity</strong> <strong>GIS</strong> (B<strong>GIS</strong>) <strong>Internet</strong> <strong>Map</strong> <strong>Tutorial</strong>88
Excel is a spreadsheet application developed by Microsoft. Excel creates spreadsheets, in whichmathematical calculations can be performed. It also allows the creation of graphs and doessome basic sorting (www.ucsf.edu/y2k/toolkit/gloss.html).Extract:In <strong>GIS</strong> to extract means to select relevant rows data from a source such as an attribute tableand write these to another source such as an excel file or GML.Features:In <strong>GIS</strong> a feature comprises an entity with a geographic location, typically describable by (forexample) points, arcs, or polygons (http://en.wikipedia.org/wiki/Feature_data).Find:Find is a command that allows for the request of information, usually in the form of a searchfunction within text, documents, programmes and websites, or in the form of a search enginethat searches the web for matches to the search word(s).Firefox (Mozilla):A free, graphical web browser developed by the Mozilla Foundation. It was originally calledPhoenix. It is now one of the most widely used web browsers(http://www.google.co.za/search?hl=en&lr=&oi=defmore&q=define:Firefox).Flash:Macromedia Flash, or simply Flash, refers to both the Macromedia Flash Player and to amultimedia authoring program used to create content for it. The Flash Player, developed anddistributed by Adobe Systems (formerly by Macromedia), is a client application available inmost web browsers. It features support for vector and raster graphics, a native scriptinglanguage called ActionScript and bidirectional streaming of audio and video(http://en.wikipedia.org/wiki/Macromedia_Flash).Folder (directory):In computing, a directory, catalog, or folder, is an entity in a file system, which contains agroup of files and other directories. A typical file system contains thousands of files, anddirectories help organize them by keeping related files together. A directory contained inside<strong>Biodiversity</strong> <strong>GIS</strong> (B<strong>GIS</strong>) <strong>Internet</strong> <strong>Map</strong> <strong>Tutorial</strong>89
another directory is called a subdirectory of that directory. Together, the directories form ahierarchy, or tree structure.The name folder, presenting an analogy to the file folder used in offices, is common on someoperating systems such as Mac OS and Microsoft Windows(http://en.wikipedia.org/wiki/Directory).Frames:These divide parts of a single web page into two or more independent rectangular parts eachcalled a frame. Each frame displays a separate HTML file which may be from the same orseparate website (www.website2go.com/p78.html).Function Tabs:Function tabs are generally found on software applications. These tabs provide functions,which are relevant to the software application on which one is working. They are usually foundon the top of the active screen, or sometimes along its edges. They often display a drop-downmenu of functions related to the wording on the tab when the mouse is moved over them orclicks them.G to HGIF (image file format):Graphical Interchange Format, GIF, is a bitmap image compression format, which wasdeveloped by CompuServe to show images over the <strong>Internet</strong>. GIF uses indexed colour, which islimited to a palette of 256 colours (http://en.wikipedia.org/wiki/GIF).<strong>GIS</strong>:A Geographic Information System (<strong>GIS</strong>) is a system for creating and managing spatial data andassociated attributes. In the strictest sense, it is a computer system capable of integrating,storing, editing, analyzing, and displaying geographically-referenced information. In a moregeneric sense, <strong>GIS</strong> is a "smart map" tool that allows users to create interactive queries (usercreated searches), analyze the spatial information, and edit data(http://en.wikipedia.org/wiki/Geographic_information_system).GML:<strong>Biodiversity</strong> <strong>GIS</strong> (B<strong>GIS</strong>) <strong>Internet</strong> <strong>Map</strong> <strong>Tutorial</strong>90
The Geography Markup Language (GML) is the XML grammar defined by the Open GeospatialConsortium (OGC) to express geographical features. GML serves as a modeling language forgeographic systems as well as an open interchange format for geographic transactions on the<strong>Internet</strong>. (http://en.wikipedia.org/wiki/Geography_Markup_Language).GPS:The GPS or Global Positioning System is a system for navigation and position that uses satelliteinformation that relays coordinates to a hand held device used in the field. Apart from positionand elevation, distances moved and speed can be determined between two points ().Graphic files:A file that contains only graphic images such as line drawings, scanned images, photographs ortype designs within a graphics file format. Though it may contain type, the type in a graphicsfile is often presented as pictures and cannot be edited with text editing programmes.(http://www.computeruser.com/resources/dictionary/definition.html?lookup=2424)HTML:In computing, HyperText Markup Language (HTML) is a markup language designed for thecreation of web pages and other information viewable in a web browser. HTML is used tostructure information, denoting certain text as headings, paragraphs, lists and so on, and canbe used to describe, to some degree, the appearance and semantics of a document.(http://en.wikipedia.org/wiki/HTML)Hyperlinks:A hyperlink is a direct link that sends a users' web browser from one web page to another atthe same or different websites. Often inserted as a highlighted address or word or 'click here'sign within a web page or text document.I to JIndex map:An index map in a <strong>GIS</strong> is a small map covering the entire possible geographical area of thespatial information being examined. On this map the area being examined in detail (zoomedinto) is indicated.<strong>Biodiversity</strong> <strong>GIS</strong> (B<strong>GIS</strong>) <strong>Internet</strong> <strong>Map</strong> <strong>Tutorial</strong>91
Icons:Small images used in the Graphical User Interface or GUI of a software application that areused to represent utility functions. These utility functions can include files, folders, proceduresetc. within the application. A mouse or track ball, is usually used activate the icons by clickingon them (http://www.google.co.za/search?hl=en&q=define%3A+icons&meta=).Identify:In a <strong>GIS</strong>, to identify, is to find information about a spatial feature by pointing to it interactivelyon a map with a mouse. The information is extracted from the attributes table for the activelayer.Images:An image, also known as a picture, is an artefact used to represent some object, or a likenessthereof (http://www.google.co.za/search?hl=en&q=define%3A+Images&meta=).IMF:IMF stands for '<strong>Internet</strong> <strong>Map</strong>ping Framework' and is a software application produced by MoxiMedia Inc. that deploys powerful, high quality, customised web mapping applications(http://www.moximedia.com/).Information panel:The information panel is a window in a <strong>GIS</strong> that displays textual information about the mapbeing used such as the list of layers, the map legend or the identity of map objects.Intranet:An intranet is a restricted-access network that works like the <strong>Internet</strong> but is not accessible toit. It is usually owned and managed by a company, institution or government department andenables the sharing of its resources with its employees without confidential information beingmade available to everyone with <strong>Internet</strong> access (whttp://www.hscgroup.co.uk/i.html).<strong>Internet</strong>:The <strong>Internet</strong>, or simply the Net is the publicly accessible worldwide system of interconnectedcomputer networks that transmit data by packet switching using a standardized <strong>Internet</strong>Protocol (IP). It is made up of thousands of smaller commercial, academic, domestic and<strong>Biodiversity</strong> <strong>GIS</strong> (B<strong>GIS</strong>) <strong>Internet</strong> <strong>Map</strong> <strong>Tutorial</strong>92
government networks. It carries various information and services, such as electronic mail,online chat, and the interlinked web pages and other documents of the World Wide Web.Contrary to some common usage, the <strong>Internet</strong> and the World Wide Web are not synonymous:the <strong>Internet</strong> is a collection of interconnected computer networks, linked by copper wires,fibre-optic cables etc; the Web is a collection of interconnected documents, linked byhyperlinks and URLs (http://en.wikipedia.org/wiki/<strong>Internet</strong>).<strong>Internet</strong> Explorer:Microsoft <strong>Internet</strong> Explorer, abbreviated IE or MSIE, is a proprietary graphical web browsermade by Microsoft and currently available as part of Microsoft Windows. <strong>Internet</strong> Explorer isthe most widely used web browser today, IE's usage share is about 85%(http://en.wikipedia.org/wiki/<strong>Internet</strong>_explorer).IP (address):An IP address (<strong>Internet</strong> Protocol address) is a unique number that devices use in order toidentify and communicate with each other on a network utilizing the <strong>Internet</strong> Protocolstandard. Any participating device, including routers, computers, time-servers, internet FAXmachines, and some telephones, must have its own unique address. This allows informationpassed onwards on behalf of the sender to indicate where to send it next, and for the receiverof the information to know that it is the intended destination. IP addresses are conceptuallysimilar to phone numbers, except they are used in LANs (Local Area Network), WANs (WideArea Network), or the <strong>Internet</strong>. Because the numbers are not easy for humans to remember,the Domain Name System provides a service analogous to an address book lookup called"domain name resolution" or "name resolution". Special DNS servers on the internet arededicated to performing the translation from a domain name to an IP address and vice versa(http://en.wikipedia.org/wiki/IP_address).Java:Java is an object-oriented programming language developed by Sun Microsystems in the early1990s. The language, which was designed to be platform independent, is a derivative of C++with a simpler syntax, a more robust runtime environment and simplified memory management(http://en.wikipedia.org/wiki/Java_programming_language).Javascripts:<strong>Biodiversity</strong> <strong>GIS</strong> (B<strong>GIS</strong>) <strong>Internet</strong> <strong>Map</strong> <strong>Tutorial</strong>93
JavaScript is system of programming codes created by Netscape that can be imbedded intoHTML to create additional functionality not supported by HTML. JavaScript programming codesallow Web developers to insert functions into Web sites such as animation and interactivity(http://www.website2go.com/p78.html).JPEG:In computing, JPEG (pronounced jay-peg) stands for Joint Photographic Experts Group and is acommonly used standard method of lossy compression for photographic images. The file formatwhich employs this compression is commonly also called JPEG; the most common fileextensions for this format are .jpeg, .jfif, .jpg, .JPG, or .JPE although .jpg is the most commonon all platforms (http://en.wikipedia.org/wiki/Jpeg).JRE:A program targeting the Java platform needs two components to be present on its host: a Javavirtual machine, and a set of class libraries providing any services on which it depends. Sun'sdistribution of their JVM and their implementation of the standard classes is known as the JavaRuntime Environment (JRE) (http://en.wikipedia.org/wiki/JRE)JSP:JSP or JavaServer Pages, known to some as the Java Scripting Preprocessor, is a Javatechnology that allows developers to dynamically generate HTML, XML or some other type ofweb page. The technology allows Java code and certain pre-defined actions to be embeddedinto static content(http://en.wikipedia.org/wiki/JavaServer_Pages).K to MLayers:Layers are map overlay displays of spatial information that represent themes of data that canbe switched on and off as the user desires. Layers may include spatial information such as soil,rock, populations, rainfall etc. ().Legend:A legend is an explanation of the symbols, codes, names given to variables and otherinformation appearing on a map drawing or chart. It includes a sample of each symbol, line<strong>Biodiversity</strong> <strong>GIS</strong> (B<strong>GIS</strong>) <strong>Internet</strong> <strong>Map</strong> <strong>Tutorial</strong>94
pattern, shading, or hatching appearing on the map along with annotations describing themeaning of each (http://www.kam.to/kam/services/gisdictionary.cfm).Linux:Linux is a computer operating system and its kernel. It is one of the most prominent examplesof free software and of open-source development and all of its underlying source code isavailable to the public to use, modify, improve, and redistribute it. In the narrowest sense, theterm Linux refers to the Linux kernel, but it is commonly used to describe entire Unix-likeoperating systems (also known as GNU/Linux) that are based on the Linux kernel combined withlibraries and tools from the GNU Project and other sources(http://en.wikipedia.org/wiki/Linux)<strong>Map</strong>:A graphic representation of features of the earth's surface or other geographically distributedphenomena ().<strong>Map</strong> Window:The map window is the active window used for viewing various map features and images in a<strong>GIS</strong>. In IMF the map window is also used to view the North arrow and the scale bar.Markup:A Markup is a sequence of characters, often called tags, inserted at various places within aparticular text, or word processing file e.g. a HTML web page. These characters are used toshow what the file would look like if it were to be printed out or displayed(http://www.google.co.za/search?hl=en&q=define%3A+Markup&meta=).Metadata:Metadata literally means "data about data" and is information that describes another set ofdata. A common example is a library catalogue card, which contains data about the contentsand location of a book: It is data about the data in the book referred to by the card. In a <strong>GIS</strong>metadata is data about the data that makes up the spatial features in a coverage(http://en.wikipedia.org/wiki/Metadata).Microsoft:<strong>Biodiversity</strong> <strong>GIS</strong> (B<strong>GIS</strong>) <strong>Internet</strong> <strong>Map</strong> <strong>Tutorial</strong>95
Microsoft Corporation is the world's largest software company and develops, manufactures,licenses, and supports a wide range of software products for computing devices. Its mostpopular products are the Microsoft Windows operating system and the Microsoft Office suite ofproductivity software, each of which has achieved near ubiquity in the desktop computermarket (http://en.wikipedia.org/wiki/Microsoft).N to ONetscape:Netscape is the general name for a series of web browsers originally produced by NetscapeCommunications Corporation, but now developed by AOL. The original browser was once thedominant browser in terms of usage share, but it now has only a relatively small number ofusers (http://en.wikipedia.org/wiki/Netscape).Open <strong>GIS</strong>:Open <strong>GIS</strong> refers to free, legal access and use of <strong>GIS</strong> data and information i.e. within the publicdomain.Opera:Opera is a cross-platform internet software suite developed by Opera Software consisting of aweb browser, e-mail/news client, address book, newsfeed reader, IRC chat client, anddownload manager. Today Opera is a widely used <strong>Internet</strong> browser(http://en.wikipedia.org/wiki/Opera_%28web_browser%29).OGC:The Open Geospatial Consortium, or OGC, is an international voluntary consensus standardsorganization. In the OGC, more than 280 commercial, governmental, nonprofit and researchorganisations worldwide, collaborate in an open consensus process encouraging developmentand implementation of standards for geospatial content and services, <strong>GIS</strong> data processing andexchange. It was previously known as Open <strong>GIS</strong> Consortium(http://en.wikipedia.org/wiki/Open_<strong>GIS</strong>_Consortium).Operating system:In computing, an operating system (OS) is the system software responsible for the directcontrol and management of hardware and basic system operations. Additionally, it provides a<strong>Biodiversity</strong> <strong>GIS</strong> (B<strong>GIS</strong>) <strong>Internet</strong> <strong>Map</strong> <strong>Tutorial</strong>96
foundation upon which to run application software such as word processing programs and webbrowsers. (http://en.wikipedia.org/wiki/Operating_system).P to QPDF:Portable Document Format (PDF) is a file format developed by Adobe Systems, and is used tocapture files containing many desktop publishing applications, such as Word and Corel Draw,making the viewing of these files possible within the PDF file reader - Adobe Acrobat(http://www.google.co.za/search?hl=en&q=define%3APDF&meta=).Plug in:A plug in is defined as an extension of a particular software application, which provides theapplication with added capabilities. For example in <strong>Internet</strong> browsers plug ins add capabilitiesto aid in the viewing, hearing, or saving of specially formatted files(http://www.google.co.za/search?hl=en&q=define%3A+%22Plug+in%22&meta=).PNG:PNG (Portable Network Graphics) is a losslessly compressed bitmap image format. PNG wascreated to both improve upon and replace the GIF format with an image file format that doesnot require a patent license to use. PNG is officially pronounced as "ping", but it is often justspelled out (http://en.wikipedia.org/wiki/PNG)Polygon:A polygon (literally "many angle") is a closed planar path composed of a finite number ofsequential line segments. The straight line segments that make up the polygon are called itssides or edges and the points where the sides meet are the polygon's vertices(http://en.wikipedia.org/wiki/Polygon).Polyline:A polyline is a specific computer graphic which is composed of one or more line segments. Thisline can be created simply be specifying the endpoints of each segment(http://www.google.co.za/search?hl=en&lr=&oi=defmore&q=define:Polyline).Point:<strong>Biodiversity</strong> <strong>GIS</strong> (B<strong>GIS</strong>) <strong>Internet</strong> <strong>Map</strong> <strong>Tutorial</strong>97
A point is a geographic element which has a position, defined by its coordinates, but which hasno extension (http://www.google.co.za/search?hl=en&q=define%3APoint&meta=).Pop up:A pop up is a new browser window that displays when the visitor clicks on a hotlinked graphicor hyperlinked text. Pop up windows are often smaller than the existing browser window anddisplay on top of the existing page the visitor is viewing. Because pop up windows are a popularadvertising technique, some users install a program that turns this feature off in their browser.These programs are often referred to as "pop-up window killers" or "pop up blockers". On somewebsites including online <strong>GIS</strong> websites, however, pop up form an integral part of the systemand it is advisable to turn off pop ups window killers for these sites or the full functionality ofthe site will not be visible to the user(http://www.google.co.za/search?hl=en&lr=&oi=definer&q=define:pop+up+window&defl=en).Projections (<strong>Map</strong>):<strong>Map</strong> projections are used to flatten the curved Earth surface into a map. This process distortsdistance information as one moves away from the centre of the flattened area. Particularprojections as best used for particular areas, which reduce this distortion. Using an improperprojection can create large distortions(http://www.google.co.za/search?hl=en&q=define%3A%22<strong>Map</strong>+projections%22&meta=).Proxy Server:A proxy server is a mediator server that works between a client computer and a real server.Proxy Servers receive requests from clients and relays these to the real server, which returnsthe information back via the proxy server. Proxy servers can reply to clients by using storedinformation, thus reducing the bandwidth required to request a new task to the real server ().Query:The process of telling a particular programme what you would like to find via enteringparticular words or phrases into specific search applications(http://www.google.co.za/search?hl=en&q=define%3A+Query&meta=).R to SRadio button:<strong>Biodiversity</strong> <strong>GIS</strong> (B<strong>GIS</strong>) <strong>Internet</strong> <strong>Map</strong> <strong>Tutorial</strong>98
Radio buttons are small round computer graphics used to indicate a fixed number of choices tothe user. The user can only select one of the buttons at a time and a dot appears within theone they have selected, clicking on another will remove the dot from the previously selectedradio button and place it in the newly selected radio button.Raster graphic:A raster graphics image, digital image, or bitmap, is a data file or structure representing agenerally rectangular grid of pixels, or points of colour, on a computer monitor, paper, or otherdisplay device. The colour of each pixel is individually defined and less colourful images requireless information per pixel. Raster graphics are distinguished from vector graphics in that vectorgraphics represent an image through the use of geometric objects such as curves and polygons(http://en.wikipedia.org/wiki/Raster).Render:Rendering is the process of generating an image from a model, by means of a softwareprogram. The model is a description of three dimensional objects in a strictly defined languageor data structure. It would contain geometry, viewpoint, texture and lighting information. Theimage is a digital image or raster graphics image. The term may be by analogy with an "artist'srendering" of a scene (http://en.wikipedia.org/wiki/Raster).Scale:Scale is the ratio between the actual size of an object and its representation. In a <strong>GIS</strong> it is theratio between the map being viewed at a particular zoom level and the area represented onthe surface of the earth.Selection:Selection is a tool in some software that allows you to target a specific area of an image forsome type of manipulation; this can be a pointer arrow, crosshairs, a lasso or a box made ofdotted lines (http://www.google.co.za/search?hl=en&q=define%3A+Selection&meta=).Server (Web Server):A server is usually a combination of software and computer(s), supplying a service to client(users') computer and software over a network like the <strong>Internet</strong> ().Server-side:<strong>Biodiversity</strong> <strong>GIS</strong> (B<strong>GIS</strong>) <strong>Internet</strong> <strong>Map</strong> <strong>Tutorial</strong>99
In computer networking, the term server-side refers to operations that are performed by theserver in a client-server relationship. Typically, a server is a software program, such as a webserver, that runs on a remote server, reachable from a user's local computer or workstation.Operations may be performed server-side because they require access to information orfunctionality that is not available on the client, or require typical behaviour that is unreliablewhen it is done client-side. Server-side operations also include processing and storage of datafrom a client to a server, which can be viewed by a group of clients(http://en.wikipedia.org/wiki/Server-side).Servlet:Servlets are small programs that can be added to server software programs to add extrafunctionality. Examples include "Java servlets" that can be added to web servers ().Session (Session files):A session is either a lasting connection using the session layer of a network protocol or a lastingconnection between a user (or user agent) and a peer, typically a server, usually involving theexchange of many packets of data between the user's computer and the server(http://www.google.co.za/search?hl=en&q=define%3A+Session+&meta=).Shape (File format):A format for vector data to be used in Geographic Information Systems developed by ESRI. Ashape file actually consists of at least three and as many as six files that work together torepresent data in a <strong>GIS</strong>. All of these associated files must have the same name with differentextensions. The mandatory three files have the following extensions: shp, shx, dbf. Additionalextensions include: sbn,sbx,prj,xml. The shape file can be translated into many other formatsand is widely used throughout the <strong>GIS</strong> industry(http://www.google.co.za/search?hl=en&q=define%3A+shape+file&meta=).Shockwave:Macromedia Shockwave is frequently confused with Macromedia Flash. Shockwave isMacromedia's first and prior to the advent of Flash also its most successful multimedia player.Shockwave Flash is a dominant multimedia plugin, for web browsers.(http://en.wikipedia.org/wiki/Macromedia_Shockwave).Status bar:<strong>Biodiversity</strong> <strong>GIS</strong> (B<strong>GIS</strong>) <strong>Internet</strong> <strong>Map</strong> <strong>Tutorial</strong>100
The status bar is an area usually at the bottom of the Graphical User Interface (GUI) of asoftware application, which displays information about the currently selected command orabout an operation in progress(http://www.google.co.za/search?hl=en&q=define%3A+Status+bar&meta=).Sun:Sun Microsystems, Inc. is a vendor of computers, computer components, software, andinformation-technology services, founded in 1982. Sun's products include computer servers andworkstations based on its own SPARC and AMD's Opteron processors, the Solaris operatingsystem, the NFS network file system, and the Java platform(http://en.wikipedia.org/wiki/Sun_microsystems).T to VTables:Tables allow data to be organised into the rows and columns of rectangular cells. This data mayconsist of text, images, or other tables(http://www.google.co.za/search?hl=en&q=define%3A+Tables&meta=).Themes (<strong>Map</strong> themes):A user-defined perspective on a geographic dataset specified, if applicable, by a name andfeature or dataset name, attributes of interest, or data classification scheme(http://www.google.co.za/search?hl=en&q=define%3A+%22<strong>Map</strong>+themes%22&meta=).Text files:Computer files can be divided into two broad categories: binary and text. Text files are filesthat contain ordinary textual characters with essentially no formatting; binary files are allother files. Or, rather, text files are a special case of binary files, since any file isfundamentally a sequence of bits, and many computer components (for example, all hard diskcircuitry and most system software) make no distinction between file types. However, a largepercentage of application programs can understand and use text files in some way, but fewprograms can typically understand and use the contents of a particular binary file. Hence thedistinction can be useful to computer users (http://en.wikipedia.org/wiki/Text_files).Tickbox:<strong>Biodiversity</strong> <strong>GIS</strong> (B<strong>GIS</strong>) <strong>Internet</strong> <strong>Map</strong> <strong>Tutorial</strong>101
Is a graphic associated with various software programs. It is often found in <strong>GIS</strong> programmes,and occurs in the shape of an open box (or option). Once selected, a tick will appear in thatparticular box. This allows for the selection of various different options available to theparticular software application being used. In the case of a <strong>GIS</strong> application tick-boxes allow oneto select or deselect various layers of information.Tools:A tool in a <strong>GIS</strong> is a computer program that allows the user to perform a specific set ofoperations on map and attribute data. Examples of spatial analysis tools include overlay,window, proximity and network analysis, and map algebra(http://www.google.co.za/search?hl=en&q=define%3A+tools&meta=).Toolbox:A toolbox is an area on in a software application, which offers the user various useful functionsin the form of drop-down menus or a collection of icons.Unix:Unix or UNIX is a computer operating system originally developed in the 1960s and 1970s by agroup of AT&T Bell Labs employees. Today's Unix systems are split into various branches,developed over time by AT&T, several other commercial vendors, as well as several non-profitorganizations. Unix was designed to be portable, multi-tasking and multi-user(http://en.wikipedia.org/wiki/Unix).URL:A Uniform Resource Locator, URL (typically pronounced as a spelled-out initialism, butsyllabized by some as 'earl'), or (less formally) Web address, is a sequence of characters,conforming to a standardized format that is used for referring to resources, such as documentsand images on the <strong>Internet</strong>, by their location (http://en.wikipedia.org/wiki/URL).Vector graphics:Vector graphics or geometric modeling is the use of geometrical primitives such as points,lines, curves, and polygons to represent images in computer graphics. It is used by contrast tothe term raster graphics, which is the representation of images as a collection of pixels (dots)(http://en.wikipedia.org/wiki/Vector_graphic).<strong>Biodiversity</strong> <strong>GIS</strong> (B<strong>GIS</strong>) <strong>Internet</strong> <strong>Map</strong> <strong>Tutorial</strong>102
W to ZWindows (Operating System):Microsoft Windows is a series of operating environments and operating systems created byMicrosoft for use on personal computers and servers. Microsoft first introduced an operatingenvironment named Windows in 1985, as an add-on to MS-DOS. Microsoft Windows eventuallycame to dominate the world personal computer market. All recent versions of Windows arefully-fledged operating systems. Windows is mostly closed source software: MicrosoftCorporation owns the software's copyright and controls its distribution(http://en.wikipedia.org/wiki/Windows_operating_system).Window:A window is a Graphical User Interface (GUI), which usually has a rectangular shape, andcontains either a graphical or textual representation of a particular software programme'soutput. Windows allow for one or more computer processes to be run and viewedsimultaneously (http://www.google.co.za/search?hl=en&q=define%3A+window&meta=).WMS:An OGC Web <strong>Map</strong> Service (WMS) produces maps of spatially referenced data dynamically fromgeographic information. This international standard defines a "map" to be a portrayal ofgeographic information as a digital image file suitable for display on a computer screen. A mapis not the data itself. WMS-produced maps are generally rendered in a pictorial format such asPNG, GIF or JPEG, or occasionally as vector-based graphical elements in Scalable VectorGraphics (SVG) or Web Computer Graphics Metafile (WebCGM) formats(http://en.wikipedia.org/wiki/Web_<strong>Map</strong>_Service).XML (including AXL):The Extensible Markup Language (XML) is a general-purpose markup language for creatingspecial-purpose markup languages, capable of describing many different kinds of data. Itsprimary purpose is to facilitate the sharing of data across different systems, particularlysystems connected via the <strong>Internet</strong>. Geography Markup Language (GML) used by <strong>GIS</strong> systems isbased on XML (http://en.wikipedia.org/wiki/XML).X Y Location:<strong>Biodiversity</strong> <strong>GIS</strong> (B<strong>GIS</strong>) <strong>Internet</strong> <strong>Map</strong> <strong>Tutorial</strong>103