toward an intelligent ion mobility spectrometer (ims) - B & S Analytik ...
toward an intelligent ion mobility spectrometer (ims) - B & S Analytik ...
toward an intelligent ion mobility spectrometer (ims) - B & S Analytik ...

Create successful ePaper yourself
Turn your PDF publications into a flip-book with our unique Google optimized e-Paper software.
TOWARD AN INTELLIGENT ION MOBILITY SPECTROMETER (IMS)Timothy R. McJunkin, Jill R. Scott, <strong>an</strong>d Carla J. MillerIdaho Nat<strong>ion</strong>al Engineering <strong>an</strong>d Environmental Laboratory, Idaho Falls, ID 83415ABSTRACTThe ultimate goal is to design <strong>an</strong>d builda very smart <strong>ion</strong> <strong>mobility</strong> <strong>spectrometer</strong> (IMS)that c<strong>an</strong> operate autonomously. Toaccomplish this, software capable ofinterpreting spectra so that it c<strong>an</strong> be used incontrol loops for data interpretat<strong>ion</strong> as well asadjusting instrument parameters is beingdeveloped. Fuzzy logic <strong>an</strong>d fuzzy numbers areused in this IMS spectra classificat<strong>ion</strong> scheme.Fuzzy logic provides a straight forwardmethod for developing a classificat<strong>ion</strong>/detect<strong>ion</strong> system, whenever rules forclassifying the spectra c<strong>an</strong> be describedlinguistically. Instead of using “max” <strong>an</strong>d“min” values, the product of the truth valuesis used to determine class membership. Usingthe product allows rule-bases that utilize theAND funct<strong>ion</strong> to allow each condit<strong>ion</strong> todiscount truth value in determiningmembership, while rule-bases with <strong>an</strong> ORfunct<strong>ion</strong> are allowed to accumulatemembership. Fuzzy numbers allowencapsulat<strong>ion</strong> of the uncertainties due to <strong>ion</strong><strong>mobility</strong> peak widths as well as measuredinstrumental parameters, such as pressure<strong>an</strong>d temperature. Associating a peak with avalue of uncertainty, in addit<strong>ion</strong> to makingadjustments to the <strong>mobility</strong> calculat<strong>ion</strong> basedon variat<strong>ion</strong>s in measured parameters,enables unexpected shifts to be more reliablydetected <strong>an</strong>d accounted for; thereby, reducingthe opportunity for "false negative" results.The measure of uncertainty is <strong>an</strong>ticipated toserve the addit<strong>ion</strong>al purpose of diagnosing theoperat<strong>ion</strong>al condit<strong>ion</strong>s of the IMS instrument.INTRODUCTIONAn <strong>intelligent</strong> <strong>ion</strong> <strong>mobility</strong> <strong>spectrometer</strong>(IMS) must have robust automated spectralinterpretat<strong>ion</strong> capabilities. IMS spectra areoften complex because of gas-phase <strong>ion</strong>moleculeinteract<strong>ion</strong>s; therefore, spectralinterpretat<strong>ion</strong> methods used for massspectrometry, such as library searches, havebeen considered inappropriate [1]. Mostmethods for classifying IMS spectra have useda variety of neural networks [1-7]. Statisticalmethods have also been used to categorizeIMS spectra [8-10]. Alternatively, onecommercial instrument (Ion Track Itemiser®,Wilmington, MA) employs a non-adaptive formof fuzzy numbers for peak detect<strong>ion</strong>.It is not unexpected that neuralnetworks have been exploited to interpret IMSspectra, because their use for spectraclassificat<strong>ion</strong> in general has exploded since the1980s [11]. Uses of neural networks r<strong>an</strong>gefrom drug discovery [12], agriculture [13],solar system [14], <strong>an</strong>d medical [15]applicat<strong>ion</strong>s as well as <strong>ion</strong> <strong>mobility</strong>. Some ofthe adv<strong>an</strong>tages of neural networks are theflexibility they offer due to the variety oflearning rules, topologies, <strong>an</strong>d datapresentat<strong>ion</strong> formats [1, 2]. Although theiruse has proliferated widely, neural networksc<strong>an</strong> be costly in time (large number of datasets must be acquired), use of computat<strong>ion</strong>alresources (networks must be trained on theselarge data sets), <strong>an</strong>d verificat<strong>ion</strong> (potentiallytesting of more sets of data especially in thecase of outlying data). The potential for <strong>an</strong>eural network to “generalize” deteriorates ifthe network is “overtrained”. It has evenbeen noted that neural networks that were"undertrained" (i.e. performing poorly on thetraining data set itself) out perform fullytrainednetworks for making predict<strong>ion</strong>s [16].Convent<strong>ion</strong>al methods for checking trainingare inadequate <strong>an</strong>d provide little or noinformat<strong>ion</strong> about the quality of the training.To address this problem, Nazarov et al. [17]developed a graphical assessment method,based on the Fermi-Dirac distribut<strong>ion</strong>, to helpprevent neural net over-training.In this paper, the conceptual design ofour fuzzy-logic inference engine for IMSReceived for review July 2, 2003, Accepted July 28, 2003
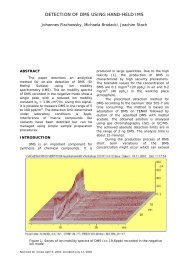
Toward <strong>an</strong> Intelligent Ion Mobility Spectrometer (IMS) - 31OR B) = 0.6 + 0.7 - (0.6)(0.7) = 0.88 > 0.7= maximum (0.6,0.7). For the AND caseusing the same memberships m(A AND B) =(0.6)(0.7) = 0.42 < 0.6 = minimum(0.6,0.7). The result of using this method isillustrated again in the discuss<strong>ion</strong> sect<strong>ion</strong> ofthis paper with IMS classificat<strong>ion</strong> rules.Fuzzy Numbers: Given a value of a realnumber that is measured with someinstrument, there is some uncertainty due tothe accuracy <strong>an</strong>d precis<strong>ion</strong> of the instrument.Fuzzy numbers provide a method forexpressing this uncertainty [22]. Take thefuzzy number “five.” “Five” will have amembership value of 1 at 5.0 on the realnumber line. Depending on the uncertainty ofthe value, “five” could have zero membershipat the values of 4.5 <strong>an</strong>d 5.5. The shape of thefuzzy number could be chosen as a tri<strong>an</strong>gle,piecewise linearly interpolating between thedefined points above. This is essentially themethod Ion Track Itemiser® uses in allowingfor mobilities around the expected <strong>mobility</strong> of<strong>an</strong> <strong>ion</strong> but discounting, with a Gaussi<strong>an</strong>shape, increasing dist<strong>an</strong>ce from the centervalue.Combining: This paper combines thetwo fuzzy methods above. Linguistic rulesc<strong>an</strong> be formed based on the combinat<strong>ion</strong> ofIMS peaks required for positive detect<strong>ion</strong> of asubst<strong>an</strong>ce. The ratio of a peak’s amplitude tothe amplitude in the rule-base required for <strong>an</strong><strong>ion</strong> to completely satisfy a requirement formsthe fuzzy membership funct<strong>ion</strong>. The classmembership of a combinat<strong>ion</strong> of peaks iscomputed based on products. The finaldecis<strong>ion</strong> to set <strong>an</strong> alarm is based on athreshold greater th<strong>an</strong> 0 <strong>an</strong>d less th<strong>an</strong> orequal to 1 depending on the desiredsensitivity. The shape <strong>an</strong>d width of the fuzzynumber is determined by the peak width ofthe <strong>ion</strong> <strong>an</strong>d other possible factorscontributing to the uncertainty of IMSmeasurement. This gives a novel adaptivetwist to the use of fuzzy numbers in IMS.RESULTS & DISCUSSIONFigure 1: Cumulative plasmagram of sample with three differentexplosive st<strong>an</strong>dards obtained with a Barringer IONSCAN®instrument. Peaks are detected with local maxima <strong>an</strong>d inflect<strong>ion</strong>points. Peak width is determined at the point of maximum slope oneither side of the peak that has the greatest dist<strong>an</strong>ce to the peakcenter. Calibrat<strong>ion</strong> peak is indicated with a vertical line. Refer toTable 1 for details on peaks referred to by letters A-Q.The first step <strong>toward</strong> automated datainterpretat<strong>ion</strong> is locating the peaks within <strong>an</strong>IMS spectrum. Figure 1 shows a compositespectrum formed by the summat<strong>ion</strong> of the 15spectra taken of a mixed explosive sample(25 ng/mL each TNT, RDX, <strong>an</strong>d PETN). Todetermine the peak width, the locat<strong>ion</strong> of themaximum slope on each side of the peak isused. The widestdist<strong>an</strong>ce from eachmaximum slope to thecenter of the peak isused to define the halfwidthof the peak.Deconvolut<strong>ion</strong> based onpredicted peak shape isnot currently utilized;however, this techniquemay be employed in thefuture to "disent<strong>an</strong>gle"peaks [23, 24].IMS spectra haveintrinsically wide peaksgiven the r<strong>an</strong>domdistribut<strong>ion</strong> of thecollis<strong>ion</strong>s of the samesubst<strong>an</strong>ce with theambient gas <strong>an</strong>d/orreact<strong>an</strong>t in the drifttube. Temperature,pressure, humidity,electric field, <strong>an</strong>dcle<strong>an</strong>liness of theapparatus influence thetiming <strong>an</strong>d shape ofthese peaks. Therefore,the st<strong>an</strong>dard express<strong>ion</strong>(Eq. 1) for reduced <strong>ion</strong>Copyright © 2003 by Internat<strong>ion</strong>al Society for Ion Mobility Spectrometry
32 - Toward <strong>an</strong> Intelligent Ion Mobility Spectrometer (IMS)Table 1: Details on detected peaks from Figure 1.Label Peak (mS) Width(mS) Ko AmpA 6.70 0.150 2.41 19.6B 7.45 0.125 2.16 297.3C 8.17 0.100 1.97 33.2D 8.52 0.150 1.89 40.6E 9.40 0.150 1.72 67.6F Cal 9.77 0.150 1.65 81.5G 10.50 0.125 1.54 10.3H TNT 11.15 0.125 1.45 126.5I RDX-C 11.65 0.125 1.38 129.9J RDX-NO 12.30 0.125 1.31 56.6K 12.87 0.125 1.25 32.3L RDX-F 13.40 0.150 1.20 139.7M PETN-NO 14.62 0.225 1.10 19.2N PETN-F 15.60 0.125 1.03 13.9O 16.10 0.050 1.00 8.2P 16.40 0.150 0.98 9.2Q RDX-D 17.02 0.175 0.95 79.9<strong>mobility</strong> compensates for several factors toallow comparisons among spectra [25].Ko = (L/t)(1/E)(P/760)(273/T)(Eq. 1)Equat<strong>ion</strong> 1 makes adjustments basedon measured temperature (T), pressure (P),<strong>an</strong>d electric field (E), dist<strong>an</strong>ce from gatingshutter to the collect<strong>ion</strong> sensor (L), <strong>an</strong>d themeasured time from the gate opening todetect<strong>ion</strong> (t). For this equat<strong>ion</strong>, pressure isgiven in units of Torr <strong>an</strong>d temperature inKelvin. In some cases there may be otherfactors, such as humidity, which are notcompensated for in equat<strong>ion</strong> 1. Applicat<strong>ion</strong>of the fuzzy inference engine described belowc<strong>an</strong> compensate for operating condit<strong>ion</strong>s thatare not or c<strong>an</strong>not be explicitly measured.In Figure 1, the detected peaks areshown with a vertical line indicatingamplitude <strong>an</strong>d a horizontal line indicatingwidth. Letters A-Q label each peak (see Table1 for details on each peak). The calibr<strong>an</strong>tpeak (Cal) was located based on theBarringer IONSCAN® expected locat<strong>ion</strong> oftheir st<strong>an</strong>dard calibr<strong>an</strong>t. The convers<strong>ion</strong>factor (Cf) is found by the product of the timeof the calibr<strong>an</strong>t peak (tcal) <strong>an</strong>d <strong>mobility</strong> ofthe calibr<strong>an</strong>t <strong>ion</strong> (Kocal),Cf = (Kocal)( tcal)(Eq. 2)Solving equat<strong>ion</strong> 2 for Ko, thetr<strong>an</strong>sform from time to <strong>mobility</strong> is:Ko = Cf / t(Eq. 3)Using the calculated convers<strong>ion</strong> factor,we then tr<strong>an</strong>slate the peaks with their widthsinto a <strong>mobility</strong> spectrum according toequat<strong>ion</strong> 3. By using the actual locat<strong>ion</strong> ofthe calibr<strong>an</strong>t peak to determine the time to<strong>mobility</strong> convers<strong>ion</strong> factor, the softwarecompensates for unmeasured operatingvariables that are not contained in equat<strong>ion</strong>1.Figure 2 shows the <strong>mobility</strong> spectrum ofthe peaks from the plasmagram in Figure 1.The plateaus of the peak representat<strong>ion</strong>s(Fig. 2) are the tr<strong>an</strong>slat<strong>ion</strong> of the end pointsof the widths of the peaks shown at the peakamplitude (Fig. 1). The base width of thepeak is twice the peak width converted to<strong>mobility</strong>. The choice of twice the width for thebase is arbitrary <strong>an</strong>d could be modified asCopyright © 2003 by Internat<strong>ion</strong>al Society for Ion Mobility Spectrometry
Toward <strong>an</strong> Intelligent Ion Mobility Spectrometer (IMS) - 33heuristic evidence indicates. Otherfactors influencing uncertainty couldalso be factored into the evaluat<strong>ion</strong>s byaltering the shape of therepresentat<strong>ion</strong>s. Note that peaks of thesame width in time are not necessarilythe same width in the <strong>mobility</strong>spectrum. This is a direct result of theconvers<strong>ion</strong> (Eq. 3) using the reciprocalof time, giving the "faster" <strong>ion</strong>s moreuncertainty in terms of <strong>mobility</strong> value.The trapezoid shapes in the<strong>mobility</strong> representat<strong>ion</strong> form the basisfor determining membership values(i.e. fuzzificat<strong>ion</strong>) for fuzzy-logic rulebase. The mech<strong>an</strong>ism used for findinga membership value for a particular <strong>ion</strong>of interest is demonstrated in Figure 3.A molecule of known <strong>mobility</strong> iscompared to a peak by placing avertical line at the expected <strong>mobility</strong>Ko. The length of the line segment isthe full confidence threshold (Afko) atwhich there is no ambiguity that the <strong>ion</strong>is present with enough abund<strong>an</strong>ce tomake a positive assignment. Theamplitude (AKo) is defined as wherethe vertical line intersects the trapezoid. Theratio of the amplitude to the full confidencethreshold is the membership value. We willuse the notat<strong>ion</strong> "m(Ko,S)" for themembership value of the given spectrum (S)for the <strong>mobility</strong> (Ko) for a specific <strong>ion</strong>.Therefore the membership is defined as:m(Ko,S) = AKo/AfKo(Eq. 4)Membership value c<strong>an</strong> be thought of asa truth or confidence value, where completeconfidence value is one <strong>an</strong>d no confidencevalue is zero. If the line segment is fullycontained in a trapezoid the membership isfull, m(Ko,S) = 1, while a line segmentcompletely outside of the trapezoid has zeromembership, m(Ko,S) = 0. To limit themembership to the r<strong>an</strong>ge 0 to 1, equat<strong>ion</strong> 4is modified to:m(Ko,S) = min (AKo/AfKo, 1)(Eq. 5)In the simplest case of a compound (M)that c<strong>an</strong> be classified with just one peak, theFigure 2: Tr<strong>an</strong>slat<strong>ion</strong> of peak locat<strong>ion</strong>s <strong>an</strong>d widths to<strong>mobility</strong> based on locat<strong>ion</strong> of calibr<strong>an</strong>t. Shape of thepeak representat<strong>ion</strong> is based on the peak width <strong>an</strong>damplitude <strong>an</strong>d represents the uncertainty of the<strong>mobility</strong> of the <strong>ion</strong> the peak represents.total membership is strictly the membershipvalue for that single peak:m(M,S) = m(Ko,S)(Eq. 6)In Figure 3, the intersect<strong>ion</strong> of the linesegment occurs on the slope of the trapezoid.The intersect<strong>ion</strong> amplitude A(Ko) is about 60<strong>an</strong>d the required amplitude for full confidenceis set at 140, making the membership value60/140 or 0.43. Ko was far enough from thepeak representat<strong>ion</strong> that there is lowconfidence that this peak is associated with<strong>an</strong> <strong>ion</strong> with <strong>mobility</strong> Ko. Had the peak beencentered on the given Ko the ratio wouldhave been over 0.9 with relatively highconfidence that the subst<strong>an</strong>ce M is present.Fuzzy logic allows the format<strong>ion</strong> ofmore complex rules that requirecombinat<strong>ion</strong>s of peaks. The membershipvalues associated with the rules are carriedthrough the logical express<strong>ion</strong>s allowingflexibility <strong>an</strong>d interpolat<strong>ion</strong>, which Bayesi<strong>an</strong>or Boole<strong>an</strong> based systems c<strong>an</strong>not. Thisboundary flexibility is necessary to moreaccurately reflect how a hum<strong>an</strong> <strong>an</strong>alyst wouldinterpret spectra [20]. We use the product tocombine membership values for the ANDoperat<strong>ion</strong> <strong>an</strong>d the products logicalcounterpart for the OR operat<strong>ion</strong>. A ruleCopyright © 2003 by Internat<strong>ion</strong>al Society for Ion Mobility Spectrometry
34 - Toward <strong>an</strong> Intelligent Ion Mobility Spectrometer (IMS)Figure 3: Figure 3. Illustrat<strong>ion</strong> of the tr<strong>an</strong>slat<strong>ion</strong> calculat<strong>ion</strong> of theconfidence factor for rule only requiring <strong>an</strong> individual peak. The ratio of theintersect<strong>ion</strong> amplitude of the Ko line with the fuzzy <strong>mobility</strong> representat<strong>ion</strong>to the full confidence amplitude gives the confidence (i.e. fuzzymembership) factor. Note if the line is fully enclosed in the trapezoid shapethe confidence is 1.0 (or full confidence).requiring the presence of several peaks isdemonstrated in Figure 4. This examplerequires the presence of four peaks (Pa ANDPb AND Pc AND Pd); therefore, the totalmembership is:m(P,S) = m(Pa,S) m(Pb,S) m(Pc,S)m(Pd,S)(Eq. 7)where Px (x = a, b, c, or d) is thereduced <strong>mobility</strong> for each required peak. Theillustrat<strong>ion</strong> shows all four peaks are presentwith Pb <strong>an</strong>d Pd above the required threshold(segment is inside the trapezoid) <strong>an</strong>d Pa <strong>an</strong>dPc with ratios of 0.8 <strong>an</strong>d 0.9, respectively.The total membership, using equat<strong>ion</strong> 7,gives (0.8)(1.0)(0.9)(1.0) = 0.72. Theproduct operator allows both terms that areless th<strong>an</strong> 1.0 to discount the final result,while use of the minimum would have given amembership of 0.8.The equivalent of the product operatorfor the OR funct<strong>ion</strong> allows membership to beadditive. An example of a case when <strong>an</strong> ORrule would be appropriate is where acompound forms dual (or multiple) adducts inthe <strong>ion</strong>izat<strong>ion</strong> process. In the case of twopossible adducts, one or both of the adductsmay form. If both adducts are formed, theymay form with very different amplitudes. Inthe case where both adducts are present, butslightly below the truth threshold for thepresence of either adduct by itself, the ORfunct<strong>ion</strong> allows the overall confidence to beincreased. The OR funct<strong>ion</strong> essentiallyreinforces the overall confidence, which moreaccurately reflects the decis<strong>ion</strong> makingprocess of a hum<strong>an</strong> <strong>an</strong>alyst.Figure 5 shows a case where a rulecombines both AND <strong>an</strong>d OR funct<strong>ion</strong>s in therule Ra AND { Rb OR Rc } with totalmembership:m(R,S) = m(Ra,S){ m(Rb,S) + m(Rc,S)- m(Rb,S) m(Rc,S)}(Eq. 8)The OR term has <strong>an</strong> addit<strong>ion</strong>component. The subtract<strong>ion</strong> of the productCopyright © 2003 by Internat<strong>ion</strong>al Society for Ion Mobility Spectrometry
Toward <strong>an</strong> Intelligent Ion Mobility Spectrometer (IMS) - 35Figure 4: Example of a rule that requires the combinat<strong>ion</strong> of four peaks. A membershipvalue for each required <strong>mobility</strong> is determined <strong>an</strong>d then combined using the product term.The resulting confidence level discounts truth value for <strong>an</strong>y peak whose confidence is notfull (a zero confidence of <strong>an</strong>y of the terms obviously causes <strong>an</strong> overall zero confidence).Figure 5: Example of a rule requiring one <strong>ion</strong>, Ra, <strong>an</strong>d either Rb or Rc. Use of theproduct equivalent for the OR allows for the confidence of Rb <strong>an</strong>d Rc to be additive <strong>an</strong>daccumulate truth value.term imposes a maximum of 1.0 as a resulton the OR operator. In Figure 5, all threerequired peaks are present with truth valuesfor each peak as follows: m(Ra,S) = 0.9,Copyright © 2003 by Internat<strong>ion</strong>al Society for Ion Mobility Spectrometry
36 - Toward <strong>an</strong> Intelligent Ion Mobility Spectrometer (IMS)m(Rb,S) = 0.6, <strong>an</strong>d m(Rc,S) = 0.5. The RbOR Rc term is found, using the bracketedform of equat<strong>ion</strong> 8, to be 0.6 + 0.5 -(0.6)(0.5) = 0.8. The resulting membershipvalue is greater th<strong>an</strong> the condit<strong>ion</strong> withmaximum membership value of 0.6, showingthe additive property of the OR operator. Themembership of the entire rule is found bymultiplying the membership of Ra with theresult of the OR term, (0.9)(0.8) = 0.72. Thefact that both condit<strong>ion</strong>s in the OR term arepresent is allowed to make up for the lowerconfidence in Rb <strong>an</strong>d Rc. This reflects higherconfidence because both peaks are present tosome extent.Finally, a threshold (h) is set based onthe desired sensitivity within the r<strong>an</strong>ge 0 to1, so that the final decis<strong>ion</strong> for subst<strong>an</strong>ce Min spectrum S is given as:If (m(M,S) h), then set ALARM(M)(Eq.9)This provides a crisp result, which isrequired to determine whether to indicatepositive detect<strong>ion</strong> of a subst<strong>an</strong>ce.SUMMARYThe process of detecting subst<strong>an</strong>cesbegins with calculating <strong>an</strong> expected time for acalibr<strong>an</strong>t peak based on the measuredtemperature, pressure, <strong>an</strong>d the electric fieldstrength. The plasmagram is searched for thepeak nearest the expected time for thecalibr<strong>an</strong>t. Assuming that the calibr<strong>an</strong>t peak isfound within some error bound, a convers<strong>ion</strong>factor is calculated to tr<strong>an</strong>slate time-of-flightto reduced <strong>mobility</strong>. This convers<strong>ion</strong> factoraccounts for other non-explicit factors in theinstrument operat<strong>ion</strong>. If the calibr<strong>an</strong>t peak isnot found with the calculated boundaries,then the instrument is not operating withinspecificat<strong>ion</strong>s or there is <strong>an</strong> error in samplepreparat<strong>ion</strong> <strong>an</strong>d/or inject<strong>ion</strong>. All peaks <strong>an</strong>dpeak widths are then identified. The peakwidth is found using the steepest slope onboth sides of the peak, using the side thathas the greatest dist<strong>an</strong>ce from the peakcenter to define the half width. All peak widthend points are converted to reducedmobilities by the convers<strong>ion</strong> factor <strong>an</strong>ddisplayed as trapezoids with a base of twicethe width. From a database of subst<strong>an</strong>ces,sets of indicator peaks with defined fullconfidence thresholds are compared to the<strong>mobility</strong> peak trapezoids. A membershipvalue for each indicator peak is found basedon the ratio of the intersect<strong>ion</strong> with thetrapezoids <strong>an</strong>d the full confidence threshold.The individual memberships are thencombined using fuzzy logic operat<strong>ion</strong>s.Finally, a threshold based on requiredsensitivity is applied to determine if asubst<strong>an</strong>ce is detected.ACKNOWLEDGEMENTSThe authors would like to th<strong>an</strong>k MichaelC. Ev<strong>an</strong>s for the data used in the <strong>an</strong>alyses<strong>an</strong>d Dr. Charles R. Tolle for his helpfulconversat<strong>ion</strong>s. The authors also gratefullyacknowledge support from the United StatesDepartment of Energy, under contract DE-AC07-99ID13727 BBWI.REFERENCES[1] Bell, S.E., et al., Connect<strong>ion</strong>ist HyperprismNeural-Network for the Analysis of IonMobility Spectra - <strong>an</strong> Empirical-Evaluat<strong>ion</strong>.Journal of Chemical Informat<strong>ion</strong> <strong>an</strong>dComputer Sciences, 1993. 33(4): p. 609-615.[2] Bell, S., et al., Classificat<strong>ion</strong> of <strong>ion</strong> <strong>mobility</strong>spectra by funct<strong>ion</strong>al groups using neuralnetworks. Analytica Chimica Acta, 1999.394(2-3): p. 121-133.[3] Bell, S., et al., Neural network recognit<strong>ion</strong> ofchemical class informat<strong>ion</strong> in <strong>mobility</strong> spectraobtained at high temperatures. AnalyticalChemistry, 2000. 72(6):p. 1192-1198.[4] Boger, Z. <strong>an</strong>d Z. Karpas, Applicat<strong>ion</strong> ofNeural Networks for Interpretat<strong>ion</strong> of IonMobility <strong>an</strong>d X-Ray-Fluorescence Spectra.Analytica Chimica Acta, 1994. 292(3): p.243-251.[5] Boger, Z. <strong>an</strong>d Z. Karpas, Use of NeuralNetworks for Qu<strong>an</strong>titative Measurements inIon Mobility Spectrometry (Ims). Journal ofChemical Informat<strong>ion</strong> <strong>an</strong>d ComputerSciences, 1994. 34(3): p. 576-580.[6] Eicem<strong>an</strong>, G.A., E.G. Nazarov, <strong>an</strong>d J.E.Rodriguez, Chemical class informat<strong>ion</strong> in <strong>ion</strong><strong>mobility</strong> spectra at low <strong>an</strong>d elevatedtemperatures. Analytica Chimica Acta, 2001.433(1): p. 53-70.[7] Simpson, M., et al., Use of Pattern-Recognit<strong>ion</strong> for Signatures Generated byLaser- Desorpt<strong>ion</strong> Ion Mobility Spectrometryof Polymeric Materials. Analyst, 1993.118(10): p. 1293-1298.[8] Snyder, A.P., et al., Multivariate Statistical-Analysis Characterizat<strong>ion</strong> of Applicat<strong>ion</strong>-Based Ion Mobility Spectra. Analytica ChimicaActa, 1995. 316(1): p. 1-14.[9] Horrak, U., J. Salm, <strong>an</strong>d H. Tammet,Statistical characterizat<strong>ion</strong> of air <strong>ion</strong> <strong>mobility</strong>spectra at Tahkuse Observatory:Classificat<strong>ion</strong> of air <strong>ion</strong>s. Journal ofGeophysical Research-Atmospheres, 2000.105(D7): p. 9291-9302.[10] Clark, J.M., K.A. Daum, <strong>an</strong>d J.H. Kalivas,Demonstrated potential of <strong>ion</strong> <strong>mobility</strong>spectrometry for detect<strong>ion</strong> of adulteratedperfumes <strong>an</strong>d pl<strong>an</strong>t speciat<strong>ion</strong>. AnalyticalLetters, 2003. 36(1): p. 215-244.[11] Zup<strong>an</strong>, J. <strong>an</strong>d J. Gasteiger, Neural networks:A new method for solving chemical problemsCopyright © 2003 by Internat<strong>ion</strong>al Society for Ion Mobility Spectrometry
Toward <strong>an</strong> Intelligent Ion Mobility Spectrometer (IMS) - 37or just a passing phase? Analytica ChimicaActa, 1991. 248: p. 1-30.[12] Gasteiger, J., et al., Neural networks as datamining tools in drug design. Journal ofPhysical Org<strong>an</strong>ic Chemistry, 2003. 16(4): p.232-245.[13] Ru<strong>an</strong>, R., et al., Non-destructivedeterminat<strong>ion</strong> of deoxynivalenol levels inbarley using near-infrared spectroscopy.Applied Engineering in Agriculture, 2002.18(5): p. 549-553.[14] Lubin, L.M., et al., A study of nine highredshiftclusters of galaxies. III. HubbleSpace Telescope morphology of clusters0023+0423 <strong>an</strong>d 1604+4304. AstronomicalJournal, 1998. 116(2): p. 584-622.[15] Sardari, S. <strong>an</strong>d D. Sardari, Applicat<strong>ion</strong>s ofartificial neural network in AIDS research <strong>an</strong>dtherapy. Current Pharmaceutical Design,2002. 8(8): p. 659-670.[16] Peterson, K.L., Artificial neural networks <strong>an</strong>dtheir use in chemistry, in Reviews inComputat<strong>ion</strong>al Chemistry, Vol 16. 2000. p.53-140.[17] Nazarov, E., G.A. Eicem<strong>an</strong>, <strong>an</strong>d S. Bell,Qu<strong>an</strong>titative assessment for the training ofneural networks with large libraries of <strong>ion</strong><strong>mobility</strong> spectra. Internat<strong>ion</strong>al Journal of IonMobility Spectrometry, 1999. 2: p. 45-60.[18] Scott, J.R., T.R. McJunkin, <strong>an</strong>d P.L. Tremblay,Automated <strong>an</strong>alysis of mass spectral datausing Fuzzy logic classificat<strong>ion</strong>. Journal of theAssociat<strong>ion</strong> for Laboratory Automat<strong>ion</strong>, 2003.8: p. 61-63.[19] McJunkin, T.R., J.R. Scott, <strong>an</strong>d P.L. Tremblay,Fuzzy logic classificat<strong>ion</strong> of imaging laserdesorpt<strong>ion</strong> Fourier tr<strong>an</strong>sform massspectrometry data. IEEE Tr<strong>an</strong>sact<strong>ion</strong> onSystems M<strong>an</strong> <strong>an</strong>d Cybernetics-PART C, 2003:p. submitted.[20] Otto, M., Fuzzy-Logic for SpectraInterpretat<strong>ion</strong>. Analytica Chimica Acta, 1993.283(1): p. 500-507.[21] Johnson, J.A. <strong>an</strong>d H.B. Smartt, Adv<strong>an</strong>tages of<strong>an</strong> Alternative Form of Fuzzy-Logic. IEEETr<strong>an</strong>sact<strong>ion</strong>s on Fuzzy Systems, 1995. 3(2):p. 149-157.[22] Dubois, D. <strong>an</strong>d H. Prade, The Me<strong>an</strong>-Value ofa Fuzzy Number. Fuzzy Sets <strong>an</strong>d Systems,1987. 24(3): p. 279-300.[23] Davis, D.M., et al., Analysis of Ion MobilitySpectra for Mixed Vapors Using Gaussi<strong>an</strong>Deconvolut<strong>ion</strong>. Analytica Chimica Acta, 1994.289(3): p. 263-272.[24] Bell, S.E., et al., Qualitative <strong>an</strong>dQu<strong>an</strong>titative-Evaluat<strong>ion</strong> of Deconvolut<strong>ion</strong> forIon Mobility Spectrometry. Analytica ChimicaActa, 1995. 303(2-3): p. 163-174.[25] Eicem<strong>an</strong>, G.A. <strong>an</strong>d Z. Karpas, Ion MobilitySpectrometry. 1994, Boca Raton: CRC Press.228.Copyright © 2003 by Internat<strong>ion</strong>al Society for Ion Mobility Spectrometry