Nanocrystalline ZnO Doped with Fe2O3 â Magnetic and Structural ...
Nanocrystalline ZnO Doped with Fe2O3 â Magnetic and Structural ...
Nanocrystalline ZnO Doped with Fe2O3 â Magnetic and Structural ...

Create successful ePaper yourself
Turn your PDF publications into a flip-book with our unique Google optimized e-Paper software.
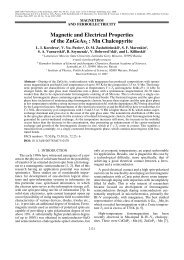
690 I. Kuryliszyn-Kudelska et al.The advantage of micro-Raman technique is the veryaccurate chemical phases determination. The Ramanspectroscopy has already proven to be a unique tool forprobing nanophases dispersed in a matrix (see eg. [1]).The selected Raman spectra are shown in Fig. 1.The main characteristics of experimental Raman spectrumin 200 to 1600 cm −1 spectral region are sharppeak at 436 cm −1 <strong>and</strong> broad two-phonon structure at≈ 1150 cm −1 , typical for <strong>ZnO</strong>; broad structure below700 cm −1 is attributed to ZnFe 2 O 4 nanoparticles.Fig. 2. The temperature dependence of the in-phasecomponent Re(χ) of the magnetic susceptibility for several<strong>ZnO</strong>: Fe 2O 3 nanocrystalline samples in the widerange of magnetic dopant. The data were taken inexternal magnetic field H AC = 2 Oe <strong>and</strong> frequencyf = 625 Hz.TABLEThe positions of maxima T f derived at f = 625 Hz <strong>and</strong>determined values of parameter Φ for <strong>ZnO</strong>:Fe 2 O 3 .Fig. 1. The selected Raman spectra for nanocrystallinesamples <strong>ZnO</strong>:Fe 2O 3.The Raman spectroscopy measurements allowed to determinethe detailed structural characterization. In particular,XRD analysis did not reveal the presence of <strong>ZnO</strong>phase in samples doped <strong>with</strong> high content of magneticdopants. Despite of fact that XRD does not evident <strong>ZnO</strong>,sharp peaks at 436 cm −1 is clearly E (2)2 mode of <strong>ZnO</strong>.This peak is typical for undoped <strong>ZnO</strong> nanoparticles [6].The Raman spectroscopy studies revealed the presenceof two phases: <strong>ZnO</strong> <strong>and</strong> ZnFe 2 O 4 in the entire contentrange.2.2. <strong>Magnetic</strong> propertiesThe dynamic magnetic properties were studied bymeans of AC susceptibility χ. The real, Re(χ), as wellas imaginary, Im(χ) parts of magnetic susceptibility weremeasured using a mutual inductance method in an ACmagnetic field of frequency range 7–10 kHz <strong>and</strong> amplitudenot exceeding 5 Oe. Figure 2 shows the temperaturedependence of the real part of the AC susceptibility forselected <strong>ZnO</strong>:Fe 2 O 3 samples in the wide range of magneticdopant. The Re(χ) curves show pronounced maxima(the positions of maxima T f derived at f = 625 Hzare summarized in Table).We have observed the pronounced changes in the positionsof temperature maxima T f <strong>with</strong> the nominal con-NominalconcentrationT f [K](625 Hz)5 wt% 30.2 0.0630 wt% 33 0.0340 wt% 31.8 0.0450 wt% 34 0.0460 wt% 43.3 0.0470 wt% 34 0.04centration of Fe 2 O 3 . The measurements of AC susceptibilitywere performed at the small AC magnetic field<strong>with</strong> amplitude not exceeding 5 Oe <strong>and</strong> different frequencyvalues (from 7 Hz to 9970 Hz). We observedthat the positions of the maxima shift towards highervalues <strong>with</strong> increasing driving frequency (Fig. 3). Theabove-described experimental features are expected inthe superparamagnetic system [7]. A useful criterion forclassifying the observed freezing/blocking process is theempirical parameter Φ [8, 9] that is a quantitative measureof the frequency shift <strong>and</strong> is given by the relativeshift of the peak temperature per decade shift in frequencyΦ = ∆T f /T f ∆ log 10 (f), (1)where ∆T f is the difference between the peak temperaturemeasured in the ∆ log 10 (f), <strong>and</strong> f is the AC magneticfield frequency.We obtained values in the range from 0.04 for the sample<strong>with</strong> 70 wt% of Fe 2 O 3 up to 0.06 for the sample <strong>with</strong>5 wt% of Fe 2 O 3 (the determined values of parameter Φare gathered in Table). For the superparamagnetic sys-Φ
<strong>Nanocrystalline</strong> <strong>ZnO</strong> <strong>Doped</strong> <strong>with</strong> Fe 2 O 3 . . . 691AC susceptibility curve using the empirical parameter Φ[8, 9]. For <strong>ZnO</strong> doped <strong>with</strong> 5 wt% of Fe 2 O 3 , the results oflow-field AC susceptibility are satisfactorily explained bysuperparamagnetic model including inter-particle interactions.For higher content of magnetic Fe 2 O 3 , we haveobserved the spin-glass-like behavior.ReferencesFig. 3. The frequency dependence of the in-phase componentRe(χ) of the magnetic susceptibility for selected<strong>ZnO</strong>:Fe 2O 3 nanocrystalline sample <strong>with</strong> x = 30 wt%.tem of noninteracting nanoparticles, the frequency dependentpeaks in linear AC susceptibilities are characterizedby the so-called blocking temperature (T b ), <strong>and</strong>the relative variation of T f = T b <strong>with</strong> frequency is between0.10 <strong>and</strong> 0.13 [7]. For interacting nanoparticles,superparamagnetic systems exhibit values of Φ between0.05 <strong>and</strong> 0.10, in spin-glass systems Φ < 0.05 [7, 8].3. ConclusionsWe have studied the dynamic magnetic properties of<strong>ZnO</strong>:Fe 2 O 3 by carrying out the frequency-dependent ACsusceptibility measurements. We analyzed the observedfrequency dependence of the peak temperature in the[1] M. Knobel, W.C. Nunes, L.M. Socolovsky, E. De Niasi,J.M. Vargas, J.C. Denardin, J. Nanosci. Nanotechnol.8, 2836 (2008).[2] An-Hui Lu, E.L. Salabas, F. Schüth, Angew. Chem.Int. Ed. 46, 1222 (2007).[3] P. Wust, U. Gneveckow, M. Johannsen, D. Böhmer,T. Henkel, F. Kahmann, J. Sehouli, R. Felix, J. Ricke,A. Jordan, J. Nanosci. Nanotechnol. 22, 673 (2006).[4] K.R. Kittilstved, W.K. Liu, D.R. Gamelin, NatureMater. 5, 291 (2006).[5] U. Narkiewicz, D. Sibera, I. Kuryliszyn-Kudelska,L. Kilański, W. Dobrowolski, N. Romcevic, ActaPhys. Pol. A 113, 1695 (2008).[6] R.Y. Sato-Berru, A. Vázquez-Olmos, A.L. Fernández--Osorio, S. Sortes-Martinez, J. Raman Spectrosc. 38,1073 (2007).[7] J.L. Dorman, D. Fiorani, E. Tronc, Adv. Chem. Phys.98, 283 (1997).[8] G.F. Goya, T.S. Berquo, F.C. Fonseca, M.P. Morales,J. Appl. Phys. 94, 3520 (2003).[9] J.A. Mydosh, Spin Glasses: An Experimental Introduction,Taylor <strong>and</strong> Francis, London 1993.