Printing Technique Classification for Document Counterfeit Detection
Printing Technique Classification for Document Counterfeit Detection
Printing Technique Classification for Document Counterfeit Detection

Create successful ePaper yourself
Turn your PDF publications into a flip-book with our unique Google optimized e-Paper software.
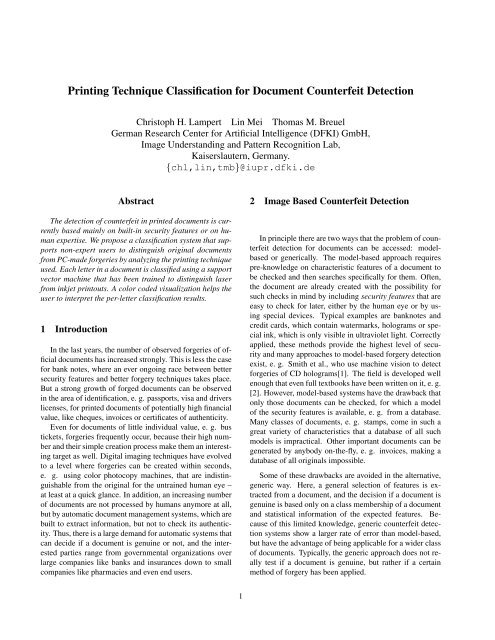
(a)(b)Figure 1. Sample letter from different inkjetprintouts (top) and laser printouts (bottom).Laser printed letter typically show sharpercontours than inkjet printed ones.2.1 Per-Letter <strong>Classification</strong>A canonical choice <strong>for</strong> getting a hint on the genuinenessof a printed document is to study its creation process, inparticular the type of printer that has been used. However,little research has been done in this area so far.One exception are studies on the dot patterns of inkjetprinters by Yamashita et al.[3]. Tchan analyzed the sharpnessof image features to detect manipulations of existingprintouts[4]. A more specialized solutions is proposed e. g.by Akao et al., who search <strong>for</strong> spur marks, which inkjetprinters commonly leave on the paper during the printingprocess[5].The approach proposed in this paper is to generically detect<strong>for</strong>geries by using a per-letter classification of the printingtechnique. It relies on the fact that <strong>for</strong> different printershave different visual characteristics, especially in the edgearea of the letters. From the grayscale distribution in thisimage area, it can be decided <strong>for</strong> each letter in the documentwhat kind of printer created it. In parts, this is similarto Tchan[6], but there the target was to distinguish differentprinter models, which required details knowledge on thecreation of the original document, access to the machines tobe detected, and also specialized hardware <strong>for</strong> the imageacquisition. The method we propose is more generic, it ispossible to target a wide range of different documents types.Another advantage is, that the method does not require anyspecific hardware but can work with a standard consumerimaging device like a scanner or a digital camera.The suitability of the proposed technique to counterfeitdetection is backed up by <strong>for</strong>ensic results on how document<strong>for</strong>geries are usually done these days: only a very smallfraction of <strong>for</strong>gers are professionally equipped with an expensivelaboratory of advanced printing machinery. Instead,the vast majority of <strong>for</strong>geries are done on an ordinary homePC with a scanner and a printer. This includes the replacementof passports photographs by inkjet printouts, and scanningbus-tickets and printing copies on a color laser printer.A surprisingly large number of <strong>for</strong>geries is even simplyFigure 2. Enlarged contour region of a inkjetprinted (a) and a laser printed character (b).The laser image shows a sharper black-towhitetransition and fewer ink/toner dropletsoutside of the black contour.done by hand, e. g. adding or manipulating digits and aninvoice. It is characteristic <strong>for</strong> these kinds of <strong>for</strong>geries, thatthe <strong>for</strong>ged in<strong>for</strong>mation relies on a different printing techniquethan the original. This can be the case that the wholedocument was created using a wrong technique, like <strong>for</strong> thebus-ticket, or that some parts have different, like on the invoice.Both scenarios can be detected by the proposed method:if the original printing technique of a document is known, itcan as a whole be validated against the detection techniquein the document to be checked. Additionally, documentswhich show only few positions of different printing techniquethan the main body show strong evidence of a manipulation.3 <strong>Printing</strong> <strong>Technique</strong> <strong>Classification</strong>The proposed method consists of four steps: preprocessing,feature extraction, classification and visualization,which we describe in the following in more detail.3.1 Image PreprocessingFor a more compact description, we leave out the moreparts of image acquisition and assume that the system isprovided with high resolution image material. Since we aredealing with document images, we usually cannot rely oncolor in<strong>for</strong>mation, and we there<strong>for</strong>e assume the material tobe in 8 bit grayscale <strong>for</strong>mat. We identify individual objectson the page by a connected component analysis on a binarizedversion of the image. Of the connected componentswe keep all which have roughly the right size and aspectratio to be characters and extract the classification featuresfrom them.3.2 Feature ExtractionWhen studying high resolution scans of different printertypes, sharp edges are the most interesting regions to distinguishbetween them visually. Here, the techniques differ,
(a) Letter Contours <strong>for</strong> Inkjet(b) Letter Contours <strong>for</strong> LaserFigure 3. Line Edge Roughness <strong>for</strong> Inkjet (a)and Laser (b) print. In low resolution, laserand inkjet letter contours are roughly equallysmooth (small letters). In full resolution, theinkjet print has rougher contours than thelaser one (large letters). There<strong>for</strong>e, the ratiobetween high res and low res contour lengthscan be used as a distinguishing feature.e. g. in sharpness and existence of droplets. This is illustratedin Figure 2. From these areas, we extract the followingqualities to <strong>for</strong>m a feature vector: Line Edge Roughness,Area Difference, Correlation Coefficient, Texture.Line Edge Roughness It is a basic observation that in veryhigh resolution images, the contour line of an inkjet printtypically is rougher than that of a laser print, and it there<strong>for</strong>ehas a longer perimeter. However, if the image is scaleddown, the contours of inkjet and laser printouts both becomesmoother and it is generally not possible to distinguishthem anymore. Figure 3 shows this effect.For classification, we calculate the ratio of the lengths ofthe high res and the low res contours, and we include thescale as a factor as well, because the roughness measurethen becomes invariant to the actual resolutions used:perimeter of downsized object contour ∗ scaleroughness =perimeter of object contour(1)For our experiments, we use a scale factor of 10.Area Difference Another characteristic property of inkjetprints is that the grayscale distribution of a black-to-whiteedge transition contains more intermediate grayscale values<strong>for</strong> inkjet than <strong>for</strong> laser prints. To measure this in a sizeinvariantmatter, we use the area difference between twodifferent image binarizations. One is created using Otsu’sautomatic threshold [7], the other by using a threshold δunits larger. From the difference between the area A otsu ofthe first binary shape and the area A otsu+δ of the second binaryshape we obtain the number of intermediate grayscaleFigure 4. Area Difference: The size of a binarizedletter (left) is increased slightly by raisingthe binarization threshold (center). Thearea of the additional pixels (right) typicallyis larger <strong>for</strong> inkjet printers than <strong>for</strong> laser andcan be used <strong>for</strong> classification.pixels, which we normalize by the total area:area difference = |A otsu − A otsu+δ |A otsu(2)This is illustrated in Figure 4 using δ = 20, which is thesame value that we used in our experiments.Correlation Coefficient It is also characteristic <strong>for</strong> a printerhow close its output of a letter contour comes to an ideastep edge. We measure this by calculating the correlationcoefficient between the original image and the segmentedbinary image. Since only the contour region is importantto us, we use an edge image that had been dilated with acircular mask of radius 7 as a region-of-interest (ROI) mask.Figure 5 illustrates this.When A is the original gray value image and B the Otsubinarizedversion, the correlation coefficient is calculated as∑(A[i, j]−Ā)(B[i, j]− ¯B)[i,j]∈ROIcorrelation = √ ∑√ ∑(A[i, j]−Ā)2 (B[i, j]− ¯B) 2[i,j]∈[i,j]∈ROIROI(3)where Ā and ¯B are the mean of A and B respectively overthe ROI.Texture To obtain a texture descriptor, we use a techniquethat is similar to the gray value co-occurrence matrix, butmeasures the co-occurrence of values in two different imagesor channels. One is the original image, another is atrans<strong>for</strong>med version of the original. We do this <strong>for</strong> threedifferent trans<strong>for</strong>ms:Gaussian Filter We obtain the the second channel fromblurring the original using a Gaussian filter.Wavelet Filter We obtain the second channel from computingthe first low pass approximation in a waveletsrepresentation of the original image.
For each of the trans<strong>for</strong>med images, we create a 2D valueco-occurrence histogram p[i, j], i.e. the histogram of howoften an original grayscale value i occurs in the region ofinterest of image I together with a value j at the same positionin the trans<strong>for</strong>med image J.p[i, j] =#{(x, y) ∈ ROI : I[x, y] = i ∧ J[x, y] = j}#{(x, y) ∈ ROI}(a) Contour image and dilation(b) ROI in original and binarizationFigure 5. A region is interest (ROI) mask isconstructed by dilating the contour image (a).The cross-correlation between the ROI-pixelsin the original image and in the binarized image(b) measures how close the contour regionis to an ideal step edge.From each such histogram, we extract the four features contrast,correlation, energy and homogeneity <strong>for</strong> classification:contrast = ∑ |i − j| 2 p[i, j]i,j∑i,jcorrelation =(i − µ x)(j − µ y )p[i, j]σ x σ yenergy = ∑ i,jp 2 [i, j]homogeneity = ∑ i,jp[i, j]1 + |i − j|whereµ x = ∑ i,ji p[i, j]µ y = ∑ i,jj p[i, j]Figure 6. Local binary pattern: A 3 × 3 windowsaround each position is extracted (left).Its center value is used as threshold <strong>for</strong> binarization(center). The 8 binarized neighborsare multiplied with a mask of powers of twoand summed up (right). This arranges themin clockwise order <strong>for</strong>ming a byte value, inthis example 1 + 2 + 4 + 16 + 128 = 151.Local Binary Maps We calculate the rotation invariant localbinary map[8]. It can be illustrated in the followingway: Assume a 3 × 3 window in the image. We calculatea binary version of this window using the centerpoint as threshold. The resulting 8 single-bit values arecombined into a bitstring in clockwise order, resultingin an 8-bit integer value. This process is illustrated inFigure 3.2. The resulting value depends on which bitthe combination started with. To make the feature rotationallyinvariant, we using each bit as a starting pointonce and keep the minimum resulting value as output.The same process can also be done <strong>for</strong> larger windowsizes. In our experiments, we use a 5 × 5 window. Thevalues at its boundary are binarized and combined intoa 16 bit output value, which is again made rotationallyinvariant by minimizing over all 16 possible rotations.√ ∑√ ∑σ x = (i − µ x ) 2 p[i, j] σ y = (j − µ y ) 2 p[i, j]i,ji,jThis results in a 4D feature vector per trans<strong>for</strong>mation, i.e.the total vector <strong>for</strong> texture features is 12-dimensional.3.3 <strong>Classification</strong>For classification, the 15-dimensional feature vectors arereduce to 12-dimensions using the PCA trans<strong>for</strong>m and normalizedto the range [0, 1]. Afterwards, they are used asinput to a support vector machine with Gaussian kernel(RBF-SVM). Support vector machines have proven to bea powerful tool <strong>for</strong> classification tasks where high accuracyis required. By use of a Gaussian kernel function, we avoidthe frequent problem of parameter section, because a RBF-SVM has only two free parameters, the penalty C and thekernel width σ, and there are straight<strong>for</strong>ward testing method<strong>for</strong> choosing them[9]. In our case, parameters were set toC = 20 and σ = 1.Another reason <strong>for</strong> choosing a RBF-SVM was, that theyutilize the advantages of a high (even infinite) dimensionalclassification space, and can be thought of as covering themore fundamental linear kernel SVMs as well[10].3.4 VisualizationA big problem of fully automatic classification problemsis that users don’t fully trust their decisions. This is evenmore the case in sensitive areas like document authenticity,
where matters of national security or financial transactionsare involved. We have there<strong>for</strong>e designed our system to notindependently make decisions, but to guide the user intomaking his or her own decision. This is done by presentingthe user with the classification results in <strong>for</strong>m of a color annotationof the original document image. Green representslaser printed characters and red represents inkjet.This representation allows the user to see at a singleglance if a document is uniquely colored in the way he orshe expects, indicating that it is an original, or if the coloris uni<strong>for</strong>mly wrong, indicating a complete <strong>for</strong>gery, or if itconsists of different colors, which can be an indicator <strong>for</strong>a partial <strong>for</strong>gery. In the last case, the color coding showsits special strength, because the user can immediately seewhich parts of the documents have been detected as potentially<strong>for</strong>ged. Based on the semantic meaning of these part,he or she might can decide to either consult the original document<strong>for</strong> an in-depth check, or to attribute the detection asa false positive and proceed. Typically, names and numbersare positions where a missing a <strong>for</strong>gery is potentially dangerous,whereas in the company logo or the running text ofa letter, a detection error is more likely. Encoding this in<strong>for</strong>mationinto the system would require a lot of backgroundknowledge about the documents to be checked, somethingthat a generic counterfeit detection system typically doesnot have. By instead leaving the choice to the user in an interactivefashion, the system stays overall generic. We alsobelieve that the acceptance rate with a user will be higher,because of the positive feedback to decide <strong>for</strong> oneself insteadof giving the control to ”a machine”.4 Experiments4.1 SetupWe implemented a prototype of the described system inMatLab, and tested it on a dataset of 26 printouts of 8 laserand 5 inkjet printouts. All documents show only text andwere scanned at a resolution of 3200 dpi. Since our algorithmworks on the level of individual letters, the documentimages were split into connected components, resulting in9217 image regions in total.For evaluation, we per<strong>for</strong>med two kinds of experiments.To measure the numerical classification accuracy, we per<strong>for</strong>medleave-one-out testing, each time selecting all regionsof one document <strong>for</strong> testing and all regions of all other documents<strong>for</strong> training. This resulted in a classification accuracyof 94.8%. However, the classification accuracy variedrather strongly, <strong>for</strong> some documents reaching 100% but inone case also dropping as low as 78%. We believe that thisis caused by a lack diversity in the training material, sincewe only had access to a limited number of printer and papercombinations.To demonstrate our approach of visualization and counterfeitdetection, we created an example document fromlaser printed stationary with inkjet printed text body. It wasclassified and the result is presented in Figure 7. As one cansee, the laser part is recognized perfectly, whereas in theinkjet section, some letters are falsely marked as laser print.However, the visualization makes it possible to see that theerrors happen mainly <strong>for</strong> very small bounding boxes in particularpunctuation, and not <strong>for</strong> critical parts like names orbank data. A human observer should there<strong>for</strong>e be able toclassify the letter as non-<strong>for</strong>ged.4.2 DiscussionFor the prototypical stage of the system, we believe thatthe results presented are good. It also looks promising thatthey can be improved by more careful parameter selectionand in particular more training material. However, the currenterror rate of 5.2% is not low enough to establish a fullyautomatic system. For that the task of counterfeit detectionitself is much too sensitive to errors: a single <strong>for</strong>ged lettermakes a whole document a <strong>for</strong>gery. There<strong>for</strong>e, a singlefalse decision can cause a genuine document to be detectedas <strong>for</strong>gery, and a single false negative can cause a <strong>for</strong>geddocument to be overlooked.A system working with such a strict decision rule wouldinstead require an error rate in the range of 0.01% (one errorper 10 documents) which appears unreachable with currentmethods. We have avoided this problem by not letting thesystem decide <strong>for</strong> itself, but by presenting the user with avisualization of the classification results in <strong>for</strong>m of an assistancesystem.5 ConclusionWe have presented a system that uses machine learningto detect different types of printing techniques on the levelof individual letters, or even parts of letters. Furthermore,we have described a setup to detect counterfeit or manipulationof printed documents. Here, the aim was not to build acompletely autonomous system in <strong>for</strong>m of a black box classifier,but a system that assists a possible user in his owndecision. The reported results indicate that automatic classificationof the technique used to create a printed documentis indeed possible with ordinary consumer hardware. So farwe used two classes, inkjet and laser, but by switching toa multi-class classifier and with additional research on suitablefeatures, it should be possible to distinguishing evenmore types of print and also other writing devices like ballpens. Our goal is to create a system that can indeed fulfilla useful purpose outside of the lab environment, e. g.by integration into a content management system handlinginvoices or receipts, as they are frequently used today at
(a) (b) (c)Figure 7. Example of classifier visualization: A letter, that is composed of both laser and inkjetprint, is classified using the proposed system. The left image shows the original scan in reducedresolution; the center and right images show the red and green color channel of the classificationoutput. The header and footer have been identified correctly as laser (b). The text body shows fewerrors, but is mainly correctly identified as inkjet (c). In the software GUI, the output is color codedinstead of showing the color channels separately.companies, who have to handle a large amount of incomingpaper documents, e. g. insurance companies.6 AcknowledgementsThis project was supported in part by the BMBF (GermanFederal Ministry of Education and Research), projectIPeT (01 IW D03) and by the Stiftung Rheinland-Pfalz fürInnovation, project BIVaD (15202-386261/737). We wouldlike to thank Jane and Thomas Bensch and Oleg Nagaitsev<strong>for</strong> their help in creating and scanning the ground truth documentprintouts.References[1] Smith, P.J., O’Doherty, P., Luna, C.: Commercial anticounterfeitproducts using machine vision. In: Proceedingsof SPIE – Optical Security and CouterfeitDeterrence <strong>Technique</strong>s V. (2004) 237–243[2] van Renesse, R.L.: Optical <strong>Document</strong> Security.Artech House (1997)[3] Yamashita, J., Sekine, H., Nakaguchi, T., Tsumura,N., Miyake, Y.: Spectral based analysis and modelingof dot gain in ink-jet printing. In: InternationalConference on Digital <strong>Printing</strong> Technologies IS&T’sNIP19. (2003) 769–772[4] Tchan, J.: The development of an image analysissystem that can detect fraudulent alterations made toprinted images. In: Proceedings of SPIE – Optical Securityand Couterfeit Deterrence <strong>Technique</strong>s V. (2004)151–159[5] Akao, Y., Kobayashi, K., Sugawara, S., Seki, Y.: Discriminationof inkjet-printed couterfeits by spur marksand feature extraction by spatial frequency analysis.In: Proceedings of SPIE – Optical Security andCouterfeit Deterrence <strong>Technique</strong>s IV. (2002) 129–137[6] Tchan, J.: Classifying digital prints according to theirproduction process using image analysis and artificialneural networks. In: Proceedings of SPIE – OpticalSecurity and Couterfeit Deterrence <strong>Technique</strong>s III.(2000) 105–116[7] Otsu, N.: A threshold selection method from graylevel histograms. IEEE Trans. Systems, Man and Cybernetics9 (1979) 62–66[8] Mäenpää, T., Pietikäinen, M.: Texture analysis withlocal binary patterns. In C. H. Chen, L.F.P., Wang,P.S.P., eds.: Handbook of Pattern Recognition andComputer Vision. 3rd edn. World Scientific PublishingCompany, River Edge, NJ, USA (2005) 197–216[9] Hsu, C.W., Chang, C.C., Lin, C.J.: A practical guideto support vector classification. Technical report, Departmentof Computer Science, National Taiwan University(2003)[10] Keerthi, S.S., Lin, C.J.: Asymptotic behaviors of supportvector machines with gaussian kernel. NeuralComputing 15(7) (2003) 1667–1689