Verteporfin photodynamic therapy for neovascular age-related ...
Verteporfin photodynamic therapy for neovascular age-related ... Verteporfin photodynamic therapy for neovascular age-related ...
62 Results (3) – objective E60,000Annual cost (£)40,00020,0000–10 0 10 20 30 40 50 60 70 80 90 100Best VA in either eyeFIGURE 17 Scatterplot showing the annual cost of HSS resource use compared with better-seeing eye BCVA. Theregression line superimposed on a scatterplot of the raw data is derived from fitting the two-part model. Values of BCVA< 0 (–10 and –20) represent ‘counting fingers’ and ‘hand movements’ levels of vision respectively.–0.005Time from baseline (months)0 3 6 9 12 15 18 21 240Mean predicted change in HRQoL–0.010–0.015–0.020–0.025–0.030–0.035–0.040–0.045–0.050BSCPDTFIGURE 18 Mean predicted change in HRQoL at 3-monthly time points for VPDT vs BSC for eyes with predominantlyclassic lesions that would have been EFT. Predictions combine VPDT map of HRQoL and visual acuity with visual acuityfor VDPT treatment and placebo groups reported in the TAP study.TABLE 20 Incremental costs, QALYs and costs per QALY results (VPDT vs BSC)Item Year 1 Year 2 (Year 1 + 2)Incremental intervention costs (£) 2860 744 3604Incremental costs of HSS (£) –59 –92 –151Incremental total costs (£) 2884 630 3514Incremental QALY 0.00866 0.01212 0.02071Incremental cost/QALY (£) 333,000 52000 170,000
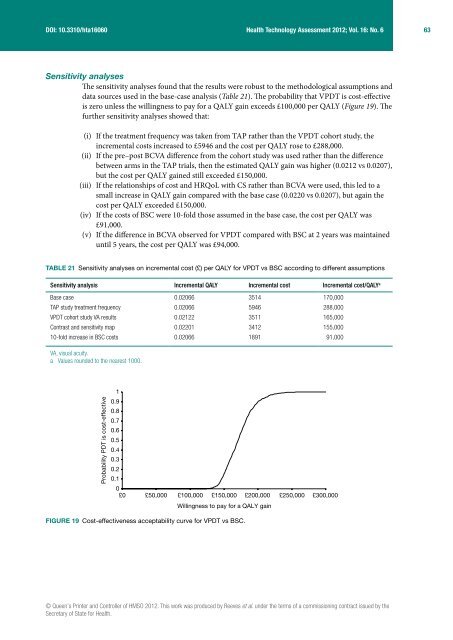
DOI: 10.3310/hta16060Health Technology Assessment 2012; Vol. 16: No. 663Sensitivity analysesThe sensitivity analyses found that the results were robust to the methodological assumptions anddata sources used in the base-case analysis (Table 21). The probability that VPDT is cost-effectiveis zero unless the willingness to pay for a QALY gain exceeds £100,000 per QALY (Figure 19). Thefurther sensitivity analyses showed that:(i) If the treatment frequency was taken from TAP rather than the VPDT cohort study, theincremental costs increased to £5946 and the cost per QALY rose to £288,000.(ii) If the pre–post BCVA difference from the cohort study was used rather than the differencebetween arms in the TAP trials, then the estimated QALY gain was higher (0.0212 vs 0.0207),but the cost per QALY gained still exceeded £150,000.(iii) If the relationships of cost and HRQoL with CS rather than BCVA were used, this led to asmall increase in QALY gain compared with the base case (0.0220 vs 0.0207), but again thecost per QALY exceeded £150,000.(iv) If the costs of BSC were 10-fold those assumed in the base case, the cost per QALY was£91,000.(v) If the difference in BCVA observed for VPDT compared with BSC at 2 years was maintaineduntil 5 years, the cost per QALY was £94,000.TABLE 21 Sensitivity analyses on incremental cost (£) per QALY for VPDT vs BSC according to different assumptionsSensitivity analysis Incremental QALY Incremental cost Incremental cost/QALY aBase case 0.02066 3514 170,000TAP study treatment frequency 0.02066 5946 288,000VPDT cohort study VA results 0.02122 3511 165,000Contrast and sensitivity map 0.02201 3412 155,00010-fold increase in BSC costs 0.02066 1891 91,000VA, visual acuity.a Values rounded to the nearest 1000.Probability PDT is cost-effective10.90.80.70.60.50.40.30.20.10£0 £50,000 £100,000 £150,000 £200,000 £250,000 £300,000Willingness to pay for a QALY gainFIGURE 19 Cost-effectiveness acceptability curve for VPDT vs BSC.© Queen’s Printer and Controller of HMSO 2012. This work was produced by Reeves et al. under the terms of a commissioning contract issued by theSecretary of State for Health.
- Page 25 and 26: DOI: 10.3310/hta16060Health Technol
- Page 27 and 28: DOI: 10.3310/hta16060Health Technol
- Page 29 and 30: DOI: 10.3310/hta16060Health Technol
- Page 31: DOI: 10.3310/hta16060Health Technol
- Page 34 and 35: 20 Key changes to the protocolThese
- Page 36 and 37: 22 Key changes to the protocolCentr
- Page 38 and 39: 24 Key changes to the protocolADVER
- Page 40 and 41: 26 Key changes to the protocolPlan
- Page 42 and 43: 28 Key changes to the protocolClass
- Page 44 and 45: 30 Key changes to the protocolFor i
- Page 46 and 47: 32 Key changes to the protocolIn ad
- Page 48 and 49: 34 Key changes to the protocolsites
- Page 52 and 53: 38 Results (1) - study cohortTABLE
- Page 54 and 55: 40 Results (1) - study cohortTABLE
- Page 56 and 57: 42 Results (1) - study cohortTABLE
- Page 58 and 59: 44 Results (1) - study cohortTABLE
- Page 60 and 61: 46 Results (2) - objectives A, B, C
- Page 62 and 63: 48 Results (2) - objectives A, B, C
- Page 64 and 65: 50 Results (2) - objectives A, B, C
- Page 66 and 67: 52 Results (2) - objectives A, B, C
- Page 69 and 70: DOI: 10.3310/hta16060Health Technol
- Page 71 and 72: DOI: 10.3310/hta16060Health Technol
- Page 73 and 74: DOI: 10.3310/hta16060Health Technol
- Page 75: DOI: 10.3310/hta16060Health Technol
- Page 80 and 81: 66 Discussion of resultsStrengths a
- Page 82 and 83: 68 Discussion of resultsThe VPDT st
- Page 84 and 85: 70 Discussion of resultsOur analyse
- Page 86 and 87: 72 Discussion of resultsA further c
- Page 88 and 89: 74 Discussion of resultsVPDT. It is
- Page 91 and 92: DOI: 10.3310/hta16060Health Technol
- Page 93 and 94: DOI: 10.3310/hta16060Health Technol
- Page 95: DOI: 10.3310/hta16060Health Technol
- Page 98 and 99: 84 References16. Stelmack J. Qualit
- Page 100 and 101: 86 References49. Guymer RH, Chiu AW
- Page 102 and 103: 88 References83. Margrain TH. Minim
- Page 104 and 105: 90 Appendix 1THE VERTEPORFIN PHOTOD
- Page 106 and 107: 92 Appendix 11. Overview of Manual
- Page 108 and 109: 94 Appendix 1And, if also collectin
- Page 110 and 111: 96 Appendix 1more patients in the v
- Page 112 and 113: 98 Appendix 12.4 Limitations of the
- Page 114 and 115: 100 Appendix 1Box 2 Key advantages
- Page 116 and 117: 102 Appendix 14. Study population4.
- Page 118 and 119: 104 Appendix 15. Recruitment to the
- Page 120 and 121: 106 Appendix 16. Background data co
- Page 122 and 123: 108 Appendix 1Table 1: Schedule of
- Page 124 and 125: 110 Appendix 1The Verteporfin Photo
DOI: 10.3310/hta16060Health Technology Assessment 2012; Vol. 16: No. 663Sensitivity analysesThe sensitivity analyses found that the results were robust to the methodological assumptions anddata sources used in the base-case analysis (Table 21). The probability that VPDT is cost-effectiveis zero unless the willingness to pay <strong>for</strong> a QALY gain exceeds £100,000 per QALY (Figure 19). Thefurther sensitivity analyses showed that:(i) If the treatment frequency was taken from TAP rather than the VPDT cohort study, theincremental costs increased to £5946 and the cost per QALY rose to £288,000.(ii) If the pre–post BCVA difference from the cohort study was used rather than the differencebetween arms in the TAP trials, then the estimated QALY gain was higher (0.0212 vs 0.0207),but the cost per QALY gained still exceeded £150,000.(iii) If the relationships of cost and HRQoL with CS rather than BCVA were used, this led to asmall increase in QALY gain compared with the base case (0.0220 vs 0.0207), but again thecost per QALY exceeded £150,000.(iv) If the costs of BSC were 10-fold those assumed in the base case, the cost per QALY was£91,000.(v) If the difference in BCVA observed <strong>for</strong> VPDT compared with BSC at 2 years was maintaineduntil 5 years, the cost per QALY was £94,000.TABLE 21 Sensitivity analyses on incremental cost (£) per QALY <strong>for</strong> VPDT vs BSC according to different assumptionsSensitivity analysis Incremental QALY Incremental cost Incremental cost/QALY aBase case 0.02066 3514 170,000TAP study treatment frequency 0.02066 5946 288,000VPDT cohort study VA results 0.02122 3511 165,000Contrast and sensitivity map 0.02201 3412 155,00010-fold increase in BSC costs 0.02066 1891 91,000VA, visual acuity.a Values rounded to the nearest 1000.Probability PDT is cost-effective10.90.80.70.60.50.40.30.20.10£0 £50,000 £100,000 £150,000 £200,000 £250,000 £300,000Willingness to pay <strong>for</strong> a QALY gainFIGURE 19 Cost-effectiveness acceptability curve <strong>for</strong> VPDT vs BSC.© Queen’s Printer and Controller of HMSO 2012. This work was produced by Reeves et al. under the terms of a commissioning contract issued by theSecretary of State <strong>for</strong> Health.


