

Climate Change and Tourism - UNEP - Division of Technology ...
Climate Change and Tourism - UNEP - Division of Technology ...
Climate Change and Tourism - UNEP - Division of Technology ...

Create successful ePaper yourself
Turn your PDF publications into a flip-book with our unique Google optimized e-Paper software.
UNWTO, 9 July 2008<br />
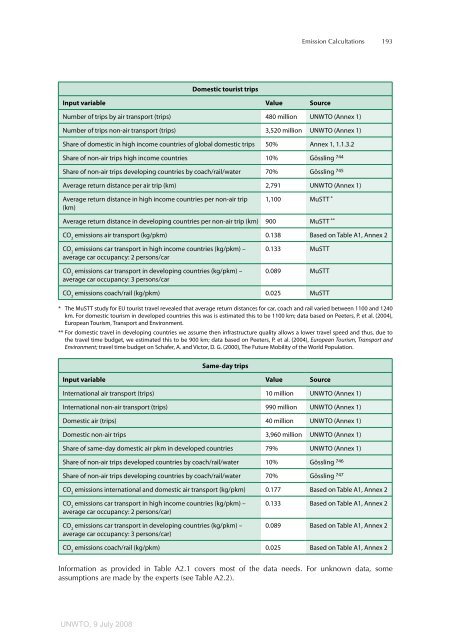
Domestic tourist trips<br />
Input variable Value Source<br />
Emission Calcultations<br />
Number <strong>of</strong> trips by air transport (trips) 480 million UNWTO (Annex 1)<br />
Number <strong>of</strong> trips non-air transport (trips) 3,520 million UNWTO (Annex 1)<br />
Share <strong>of</strong> domestic in high income countries <strong>of</strong> global domestic trips 50% Annex 1, 1.1.3.2<br />
Share <strong>of</strong> non-air trips high income countries 10% Gössling 744<br />
Share <strong>of</strong> non-air trips developing countries by coach/rail/water 70% Gössling 745<br />
Average return distance per air trip (km) 2,791 UNWTO (Annex 1)<br />
Average return distance in high income countries per non-air trip<br />
(km)<br />
1,100 MuSTT *<br />
Average return distance in developing countries per non-air trip (km) 900 MuSTT **<br />
CO 2 emissions air transport (kg/pkm) 0.138 Based on Table A1, Annex 2<br />
CO 2 emissions car transport in high income countries (kg/pkm) –<br />
average car occupancy: 2 persons/car<br />
CO 2 emissions car transport in developing countries (kg/pkm) –<br />
average car occupancy: 3 persons/car<br />
0.133 MuSTT<br />
0.089 MuSTT<br />
CO 2 emissions coach/rail (kg/pkm) 0.025 MuSTT<br />
* The MuSTT study for EU tourist travel revealed that average return distances for car, coach <strong>and</strong> rail varied between 1100 <strong>and</strong> 1240<br />
km. For domestic tourism in developed countries this was is estimated this to be 1100 km; data based on Peeters, P. et al. (2004),<br />
European <strong>Tourism</strong>, Transport <strong>and</strong> Environment.<br />
** For domestic travel in developing countries we assume then infrastructure quality allows a lower travel speed <strong>and</strong> thus, due to<br />
the travel time budget, we estimated this to be 900 km; data based on Peeters, P. et al. (2004), European <strong>Tourism</strong>, Transport <strong>and</strong><br />
Environment; travel time budget on Schafer, A. <strong>and</strong> Victor, D. G. (2000), The Future Mobility <strong>of</strong> the World Population.<br />
Same-day trips<br />
Input variable Value Source<br />
International air transport (trips) 10 million UNWTO (Annex 1)<br />
International non-air transport (trips) 990 million UNWTO (Annex 1)<br />
Domestic air (trips) 40 million UNWTO (Annex 1)<br />
Domestic non-air trips 3,960 million UNWTO (Annex 1)<br />
Share <strong>of</strong> same-day domestic air pkm in developed countries 79% UNWTO (Annex 1)<br />
Share <strong>of</strong> non-air trips developed countries by coach/rail/water 10% Gössling 746<br />
Share <strong>of</strong> non-air trips developing countries by coach/rail/water 70% Gössling 747<br />
CO 2 emissions international <strong>and</strong> domestic air transport (kg/pkm) 0.177 Based on Table A1, Annex 2<br />
CO 2 emissions car transport in high income countries (kg/pkm) –<br />
average car occupancy: 2 persons/car)<br />
CO 2 emissions car transport in developing countries (kg/pkm) –<br />
average car occupancy: 3 persons/car)<br />
0.133 Based on Table A1, Annex 2<br />
0.089 Based on Table A1, Annex 2<br />
CO 2 emissions coach/rail (kg/pkm) 0.025 Based on Table A1, Annex 2<br />
Information as provided in Table A2.1 covers most <strong>of</strong> the data needs. For unknown data, some<br />
assumptions are made by the experts (see Table A2.2).<br />
193


