The probable impacts of climate change on poverty - UNDP
The probable impacts of climate change on poverty - UNDP
The probable impacts of climate change on poverty - UNDP

Create successful ePaper yourself
Turn your PDF publications into a flip-book with our unique Google optimized e-Paper software.
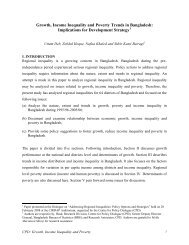
Table 7.11: Loss <str<strong>on</strong>g>of</str<strong>on</strong>g> AUSRice due to Flood (in M T<strong>on</strong>)<br />
Year Producti<strong>on</strong><br />
Loss<br />
Loss + Producti<strong>on</strong><br />
% <str<strong>on</strong>g>of</str<strong>on</strong>g> Loss<br />
1993<br />
0<br />
71835 71835<br />
1994 1790670<br />
31565<br />
1822235<br />
1.73<br />
1995 1676020<br />
176970<br />
1852990<br />
9.55<br />
1996 1870750<br />
12558<br />
1883308<br />
0.67<br />
1997 1874730<br />
30117<br />
1904847<br />
1.58<br />
1998 1616880<br />
274875<br />
1891755<br />
14.53<br />
1999<br />
26510<br />
26510<br />
2000<br />
8979640<br />
-<br />
8979640<br />
2001 17808690<br />
27540<br />
17836230<br />
0.15<br />
2002 35617380<br />
52030<br />
35669410<br />
0.15<br />
2003 71234760<br />
177880<br />
71412640<br />
0.25<br />
2004 1500470<br />
150590<br />
1651060<br />
9.12<br />
Source: Year Book <str<strong>on</strong>g>of</str<strong>on</strong>g> Agricultural Statistics, 2005<br />
Table 7.12: Loss <str<strong>on</strong>g>of</str<strong>on</strong>g> AMAN Rice due to Flood (in M.T<strong>on</strong>)<br />
Aman<br />
Year Producti<strong>on</strong> Loss Loss + Producti<strong>on</strong> % <str<strong>on</strong>g>of</str<strong>on</strong>g> Loss<br />
1993<br />
115313<br />
1994<br />
8503950<br />
3535<br />
8507485<br />
0.04<br />
1995<br />
8790330<br />
541995<br />
9332325<br />
5.81<br />
1996<br />
9551780<br />
8677<br />
9560457<br />
0.09<br />
1997<br />
8849900<br />
6240<br />
8856140<br />
0.07<br />
1998<br />
7735850<br />
927357<br />
8663207<br />
10.70<br />
1999<br />
242605<br />
242605<br />
2000<br />
11248930<br />
197970<br />
11446900<br />
1.73<br />
2001<br />
10726190<br />
34870<br />
10761060<br />
0.32<br />
2002<br />
11114950<br />
131890<br />
11246840<br />
1.17<br />
2003<br />
11520590<br />
43880<br />
11564470<br />
0.38<br />
2004<br />
9819617<br />
954500<br />
10774117<br />
8.86<br />
Source: Year Book <str<strong>on</strong>g>of</str<strong>on</strong>g> Agricultural Statistics, 2005<br />
7.4.2 Impacts <str<strong>on</strong>g>of</str<strong>on</strong>g> Hazards <strong>on</strong> GDP<br />
1998 and 2004 were two years <str<strong>on</strong>g>of</str<strong>on</strong>g> multi-hazards, including severe floods (both riverine and flash). C<strong>on</strong>tributi<strong>on</strong> <str<strong>on</strong>g>of</str<strong>on</strong>g><br />
crop agriculture to GDP has been reduced by 2.48% and 2.38% respectively. Compared to the percentage <str<strong>on</strong>g>of</str<strong>on</strong>g> loss<br />
<str<strong>on</strong>g>of</str<strong>on</strong>g> AMAN and AUS producti<strong>on</strong> with reducti<strong>on</strong> <str<strong>on</strong>g>of</str<strong>on</strong>g> c<strong>on</strong>tributi<strong>on</strong> <str<strong>on</strong>g>of</str<strong>on</strong>g> crop agriculture to GDP in 1998 and 2004, it is<br />
clear that the loss <str<strong>on</strong>g>of</str<strong>on</strong>g> producti<strong>on</strong> has posed a great impact <strong>on</strong> Nati<strong>on</strong>al GDP <str<strong>on</strong>g>of</str<strong>on</strong>g> the particular sector.<br />
Table 7.13: Change in C<strong>on</strong>tributi<strong>on</strong> to GDP due to CC related hazards<br />
GDP <str<strong>on</strong>g>of</str<strong>on</strong>g> three c<strong>on</strong>secutive year (Milli<strong>on</strong> Taka)<br />
Hazard pr<str<strong>on</strong>g>of</str<strong>on</strong>g>ile<br />
Previous yr. Next yr.<br />
Crop Agriculture<br />
Same yr. Average Producti<strong>on</strong> Decrease<br />
PY & N Y Decrease in %<br />
Cycl<strong>on</strong>e- Nov, 1970 - - -<br />
Cycl<strong>on</strong>e-Nov. 1971 (2) - -<br />
Cycl<strong>on</strong>e-Dec; Tornado-<br />
April, 1973<br />
197661 22212 22352 109936.5 87584.5 79.67<br />
Cycl<strong>on</strong>e-Aug., Nov.;<br />
Riverine flood 1974<br />
70<br />
Aus<br />
22352 25477 22212 23914.5 1702.5 7.12<br />
<str<strong>on</strong>g>The</str<strong>on</strong>g> Probable Impacts <str<strong>on</strong>g>of</str<strong>on</strong>g> Climate Change <strong>on</strong> Poverty and Ec<strong>on</strong>omic Growth and<br />
the Opti<strong>on</strong>s <str<strong>on</strong>g>of</str<strong>on</strong>g> Coping with adverse Effect <str<strong>on</strong>g>of</str<strong>on</strong>g> Climate Change in Bangladesh