The probable impacts of climate change on poverty - UNDP
The probable impacts of climate change on poverty - UNDP
The probable impacts of climate change on poverty - UNDP

Create successful ePaper yourself
Turn your PDF publications into a flip-book with our unique Google optimized e-Paper software.
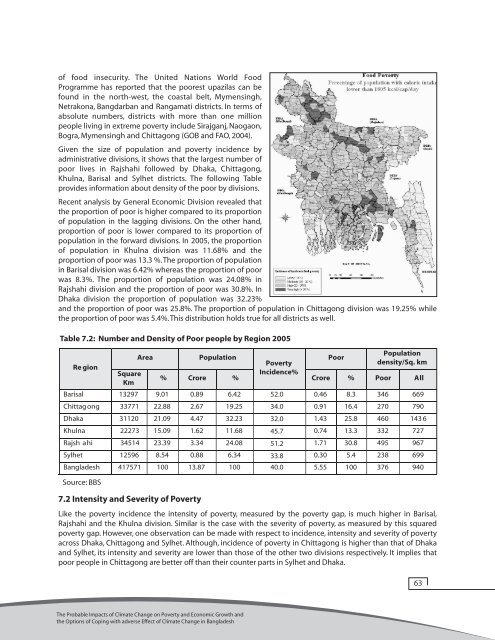
<str<strong>on</strong>g>of</str<strong>on</strong>g> food insecurity. <str<strong>on</strong>g>The</str<strong>on</strong>g> United Nati<strong>on</strong>s World Food<br />
Programme has reported that the poorest upazilas can be<br />
found in the north-west, the coastal belt, Mymensingh,<br />
Netrak<strong>on</strong>a, Bangdarban and Rangamati districts. In terms <str<strong>on</strong>g>of</str<strong>on</strong>g><br />
absolute numbers, districts with more than <strong>on</strong>e milli<strong>on</strong><br />
people living in extreme <strong>poverty</strong> include Sirajganj, Naoga<strong>on</strong>,<br />
Bogra, Mymensingh and Chittag<strong>on</strong>g (GOB and FAO, 2004).<br />
Given the size <str<strong>on</strong>g>of</str<strong>on</strong>g> populati<strong>on</strong> and <strong>poverty</strong> incidence by<br />
administrative divisi<strong>on</strong>s, it shows that the largest number <str<strong>on</strong>g>of</str<strong>on</strong>g><br />
poor lives in Rajshahi followed by Dhaka, Chittag<strong>on</strong>g,<br />
Khulna, Barisal and Sylhet districts. <str<strong>on</strong>g>The</str<strong>on</strong>g> following Table<br />
provides informati<strong>on</strong> about density <str<strong>on</strong>g>of</str<strong>on</strong>g> the poor by divisi<strong>on</strong>s.<br />
Recent analysis by General Ec<strong>on</strong>omic Divisi<strong>on</strong> revealed that<br />
the proporti<strong>on</strong> <str<strong>on</strong>g>of</str<strong>on</strong>g> poor is higher compared to its proporti<strong>on</strong><br />
<str<strong>on</strong>g>of</str<strong>on</strong>g> populati<strong>on</strong> in the lagging divisi<strong>on</strong>s. On the other hand,<br />
proporti<strong>on</strong> <str<strong>on</strong>g>of</str<strong>on</strong>g> poor is lower compared to its proporti<strong>on</strong> <str<strong>on</strong>g>of</str<strong>on</strong>g><br />
populati<strong>on</strong> in the forward divisi<strong>on</strong>s. In 2005, the proporti<strong>on</strong><br />
<str<strong>on</strong>g>of</str<strong>on</strong>g> populati<strong>on</strong> in Khulna divisi<strong>on</strong> was 11.68% and the<br />
proporti<strong>on</strong> <str<strong>on</strong>g>of</str<strong>on</strong>g> poor was 13.3 %. <str<strong>on</strong>g>The</str<strong>on</strong>g> proporti<strong>on</strong> <str<strong>on</strong>g>of</str<strong>on</strong>g> populati<strong>on</strong><br />
in Barisal divisi<strong>on</strong> was 6.42% whereas the proporti<strong>on</strong> <str<strong>on</strong>g>of</str<strong>on</strong>g> poor<br />
was 8.3%. <str<strong>on</strong>g>The</str<strong>on</strong>g> proporti<strong>on</strong> <str<strong>on</strong>g>of</str<strong>on</strong>g> populati<strong>on</strong> was 24.08% in<br />
Rajshahi divisi<strong>on</strong> and the proporti<strong>on</strong> <str<strong>on</strong>g>of</str<strong>on</strong>g> poor was 30.8%. In<br />
Dhaka divisi<strong>on</strong> the proporti<strong>on</strong> <str<strong>on</strong>g>of</str<strong>on</strong>g> populati<strong>on</strong> was 32.23%<br />
and the proporti<strong>on</strong> <str<strong>on</strong>g>of</str<strong>on</strong>g> poor was 25.8%. <str<strong>on</strong>g>The</str<strong>on</strong>g> proporti<strong>on</strong> <str<strong>on</strong>g>of</str<strong>on</strong>g> populati<strong>on</strong> in Chittag<strong>on</strong>g divisi<strong>on</strong> was 19.25% while<br />
the proporti<strong>on</strong> <str<strong>on</strong>g>of</str<strong>on</strong>g> poor was 5.4%. This distributi<strong>on</strong> holds true for all districts as well.<br />
Table 7.2: Number and Density <str<strong>on</strong>g>of</str<strong>on</strong>g> Poor people by Regi<strong>on</strong> 2005<br />
Re gi<strong>on</strong><br />
Square<br />
Km<br />
Area Populati<strong>on</strong> Poor<br />
% Crore %<br />
<str<strong>on</strong>g>The</str<strong>on</strong>g> Probable Impacts <str<strong>on</strong>g>of</str<strong>on</strong>g> Climate Change <strong>on</strong> Poverty and Ec<strong>on</strong>omic Growth and<br />
the Opti<strong>on</strong>s <str<strong>on</strong>g>of</str<strong>on</strong>g> Coping with adverse Effect <str<strong>on</strong>g>of</str<strong>on</strong>g> Climate Change in Bangladesh<br />
Poverty<br />
Incidence%<br />
Populati<strong>on</strong><br />
density/Sq. km<br />
Crore % Poor All<br />
Barisal 13297 9.01 0.89 6.42 52.0 0.46 8.3 346 669<br />
Chittag<strong>on</strong>g 33771 22.88 2.67 19.25 34.0 0.91 16.4 270 790<br />
Dhaka 31120 21.09 4.47 32.23 32.0 1.43 25.8 460 143 6<br />
Khulna 22273 15.09 1.62 11.68 45.7 0.74 13.3 332 727<br />
Rajsh ahi 34514 23.39 3.34 24.08 51.2 1.71 30.8 495 967<br />
Sylhet 12596 8.54 0.88 6.34 33.8 0.30 5.4 238 699<br />
Bangladesh 417571 100 13.87 100 40.0 5.55 100 376 940<br />
Source: BBS<br />
7.2 Intensity and Severity <str<strong>on</strong>g>of</str<strong>on</strong>g> Poverty<br />
Like the <strong>poverty</strong> incidence the intensity <str<strong>on</strong>g>of</str<strong>on</strong>g> <strong>poverty</strong>, measured by the <strong>poverty</strong> gap, is much higher in Barisal,<br />
Rajshahi and the Khulna divisi<strong>on</strong>. Similar is the case with the severity <str<strong>on</strong>g>of</str<strong>on</strong>g> <strong>poverty</strong>, as measured by this squared<br />
<strong>poverty</strong> gap. However, <strong>on</strong>e observati<strong>on</strong> can be made with respect to incidence, intensity and severity <str<strong>on</strong>g>of</str<strong>on</strong>g> <strong>poverty</strong><br />
across Dhaka, Chittag<strong>on</strong>g and Sylhet. Although, incidence <str<strong>on</strong>g>of</str<strong>on</strong>g> <strong>poverty</strong> in Chittag<strong>on</strong>g is higher than that <str<strong>on</strong>g>of</str<strong>on</strong>g> Dhaka<br />
and Sylhet, its intensity and severity are lower than those <str<strong>on</strong>g>of</str<strong>on</strong>g> the other two divisi<strong>on</strong>s respectively. It implies that<br />
poor people in Chittag<strong>on</strong>g are better <str<strong>on</strong>g>of</str<strong>on</strong>g>f than their counter parts in Sylhet and Dhaka.<br />
63